
WHAT THIS USDA MEANS FOR CORN
AUDIO COMMENTARY
Grains hammered with USDA
Feeders posting new highs for the move
Corn stocks came in 173 million above est
What does this report mean for corn?
We saw something similar in 2010
How similar is this story to 2010?
What exactly happened in 2010?
Does USDA know yield is dropping?
Increase in carryout was off farm
Dramatically more in elevators vs farmers hands
This report added a 2 bpa buffer
Yield doesn’t seem like it’s actually there
This is why those short on time need to be proactive
The volatility is here to stay
Avoid making emotional sales
Corn dropped right down to next support
This report doesn’t always go the same way as Oct USDA report
These are days to consider re-owning
Will corn carryout continue to shrink?
Where is the bottom for corn? (chart below)*
Corn chart breakdown below audio*
Listen to today’s audio below
Want to talk?
Office: (806)484-1214
Don’t miss our next signal such as our Sep 2nd corn sell alert. Subscribe for every update + signal
DEC CORN CHART BREAKDOWN
By Sebastian:
Dec Corn 🌽
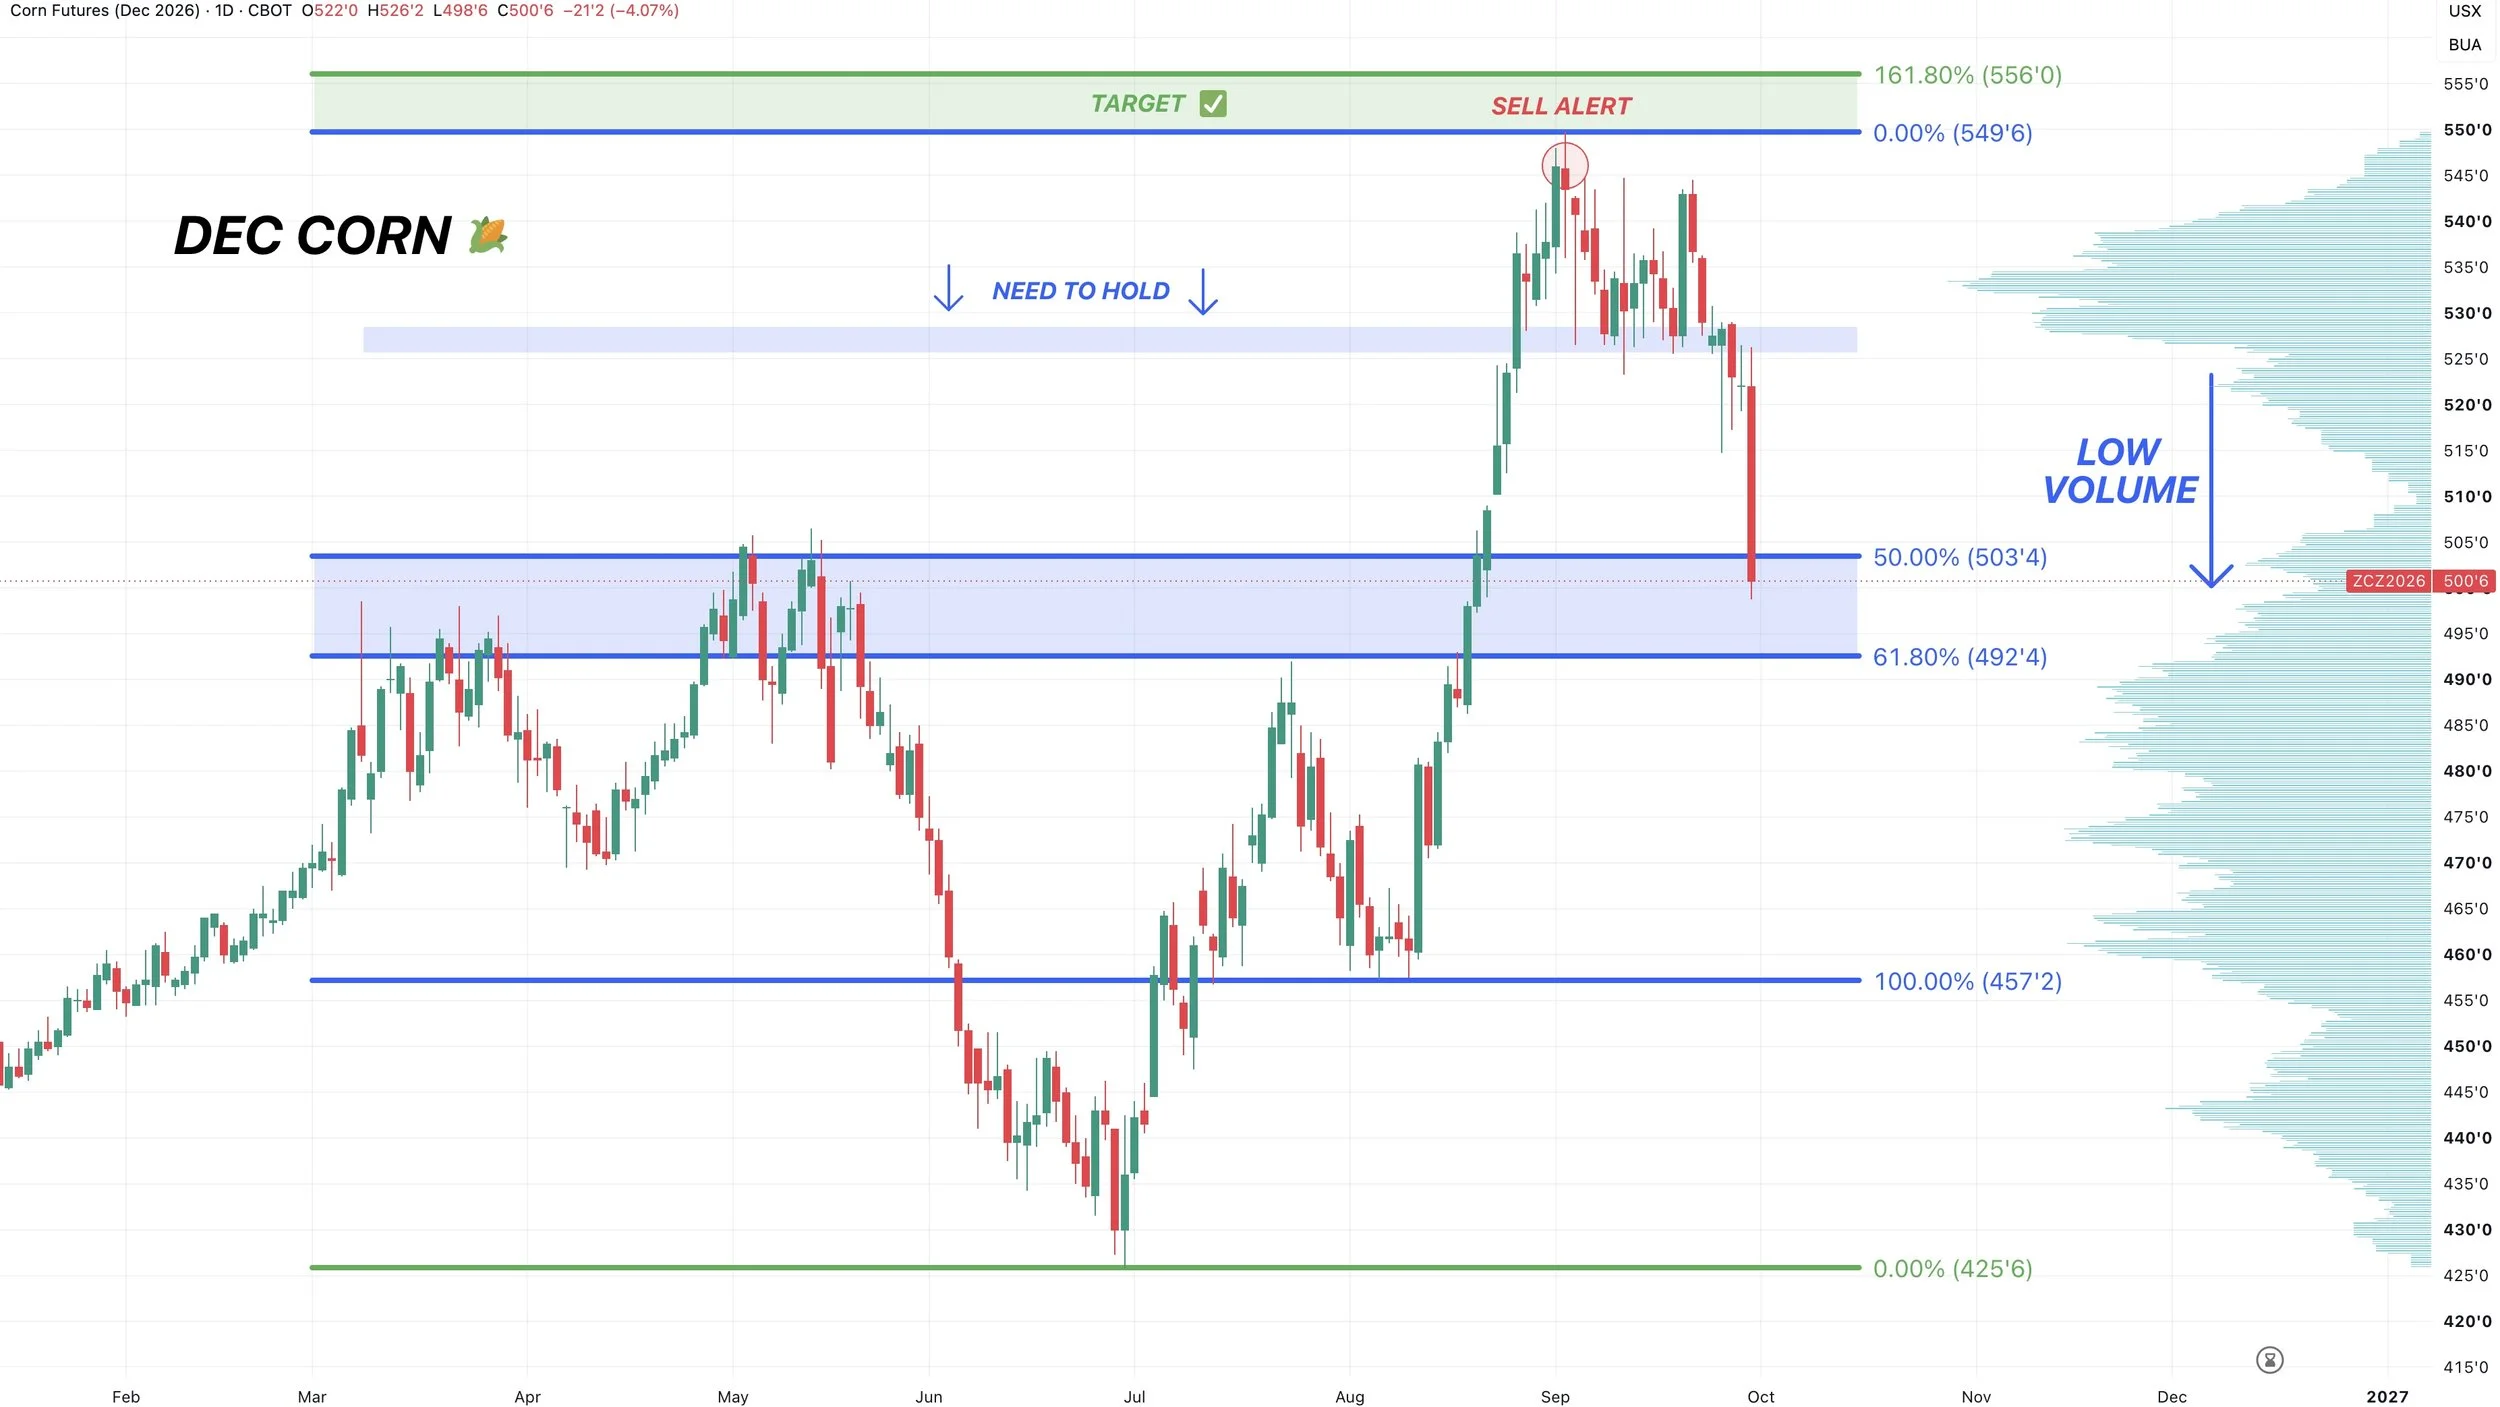
We’re 50 cents off the highs and from that Sep 2nd sell/hedge alert.
For the last several weeks, I have been talking about the downside risks if we failed to hold that support and range from earlier this month. (Although no, I wasn’t expecting that downside to all come in one day).
I’ve been saying I am cautious because there was a massive volume gap and zero support holding up this market below that prior support.
We broke massively today, but should we be worried?
I would say no. Corn has simply came down to that support we’ve been talking about. This area has been my downside target if we got a real pullback. Which we’ve now received.
We’re sitting right at the 50% retracement down to the August lows.
This re-tests those highs from May.
We are now back at an area of high volume after slicing through that volume gap.
I would expect us to find a floor between here and the 61.8% level at $4.93. If we break below that level it would not look great.
But the time to be bearish was at $5.50. Not down here at support.
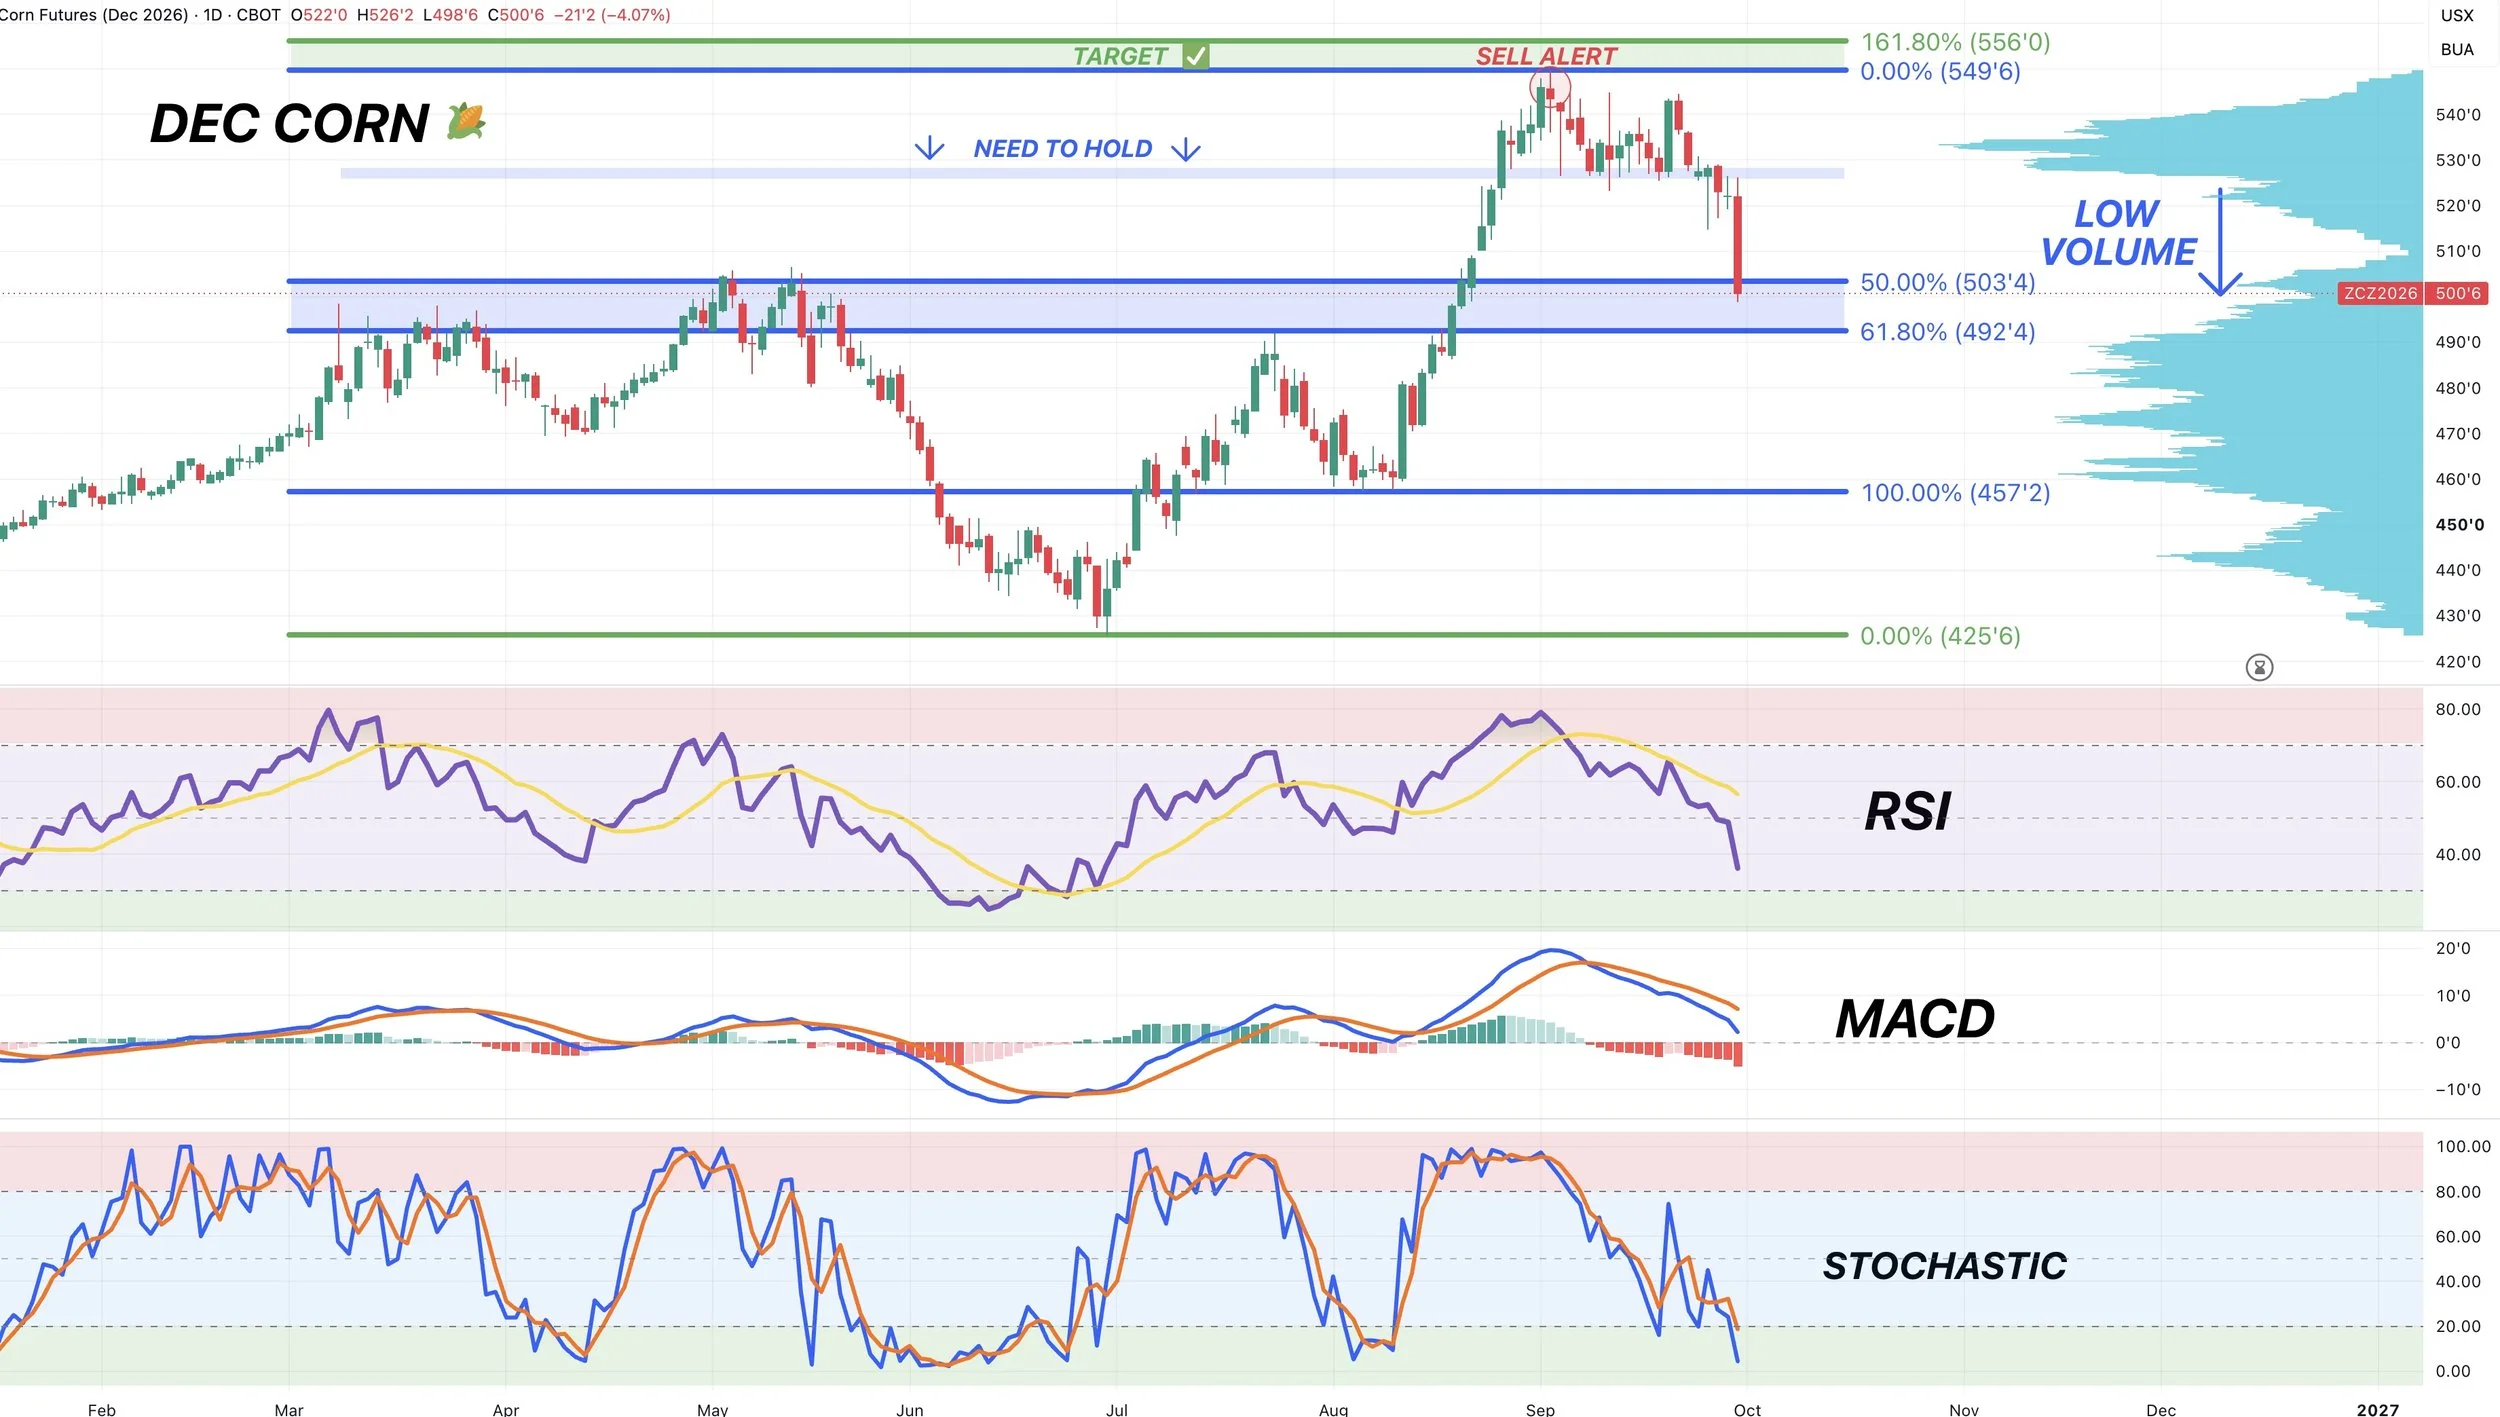
If you watched or read my past videos. The indicators were a large reason as to why I have been short term cautious.
Now that the market has pulled back, the indicators have received a healthy reset.
The RSI is now finally getting oversold. Corn was trading at $4.30 the last time we were this oversold.
The stochastics have now finally came down into oversold territory. Which is something I’ve been looking for when searching for a bottom. As most of the time we don’t see a major bottom unless the stochastics bottom.
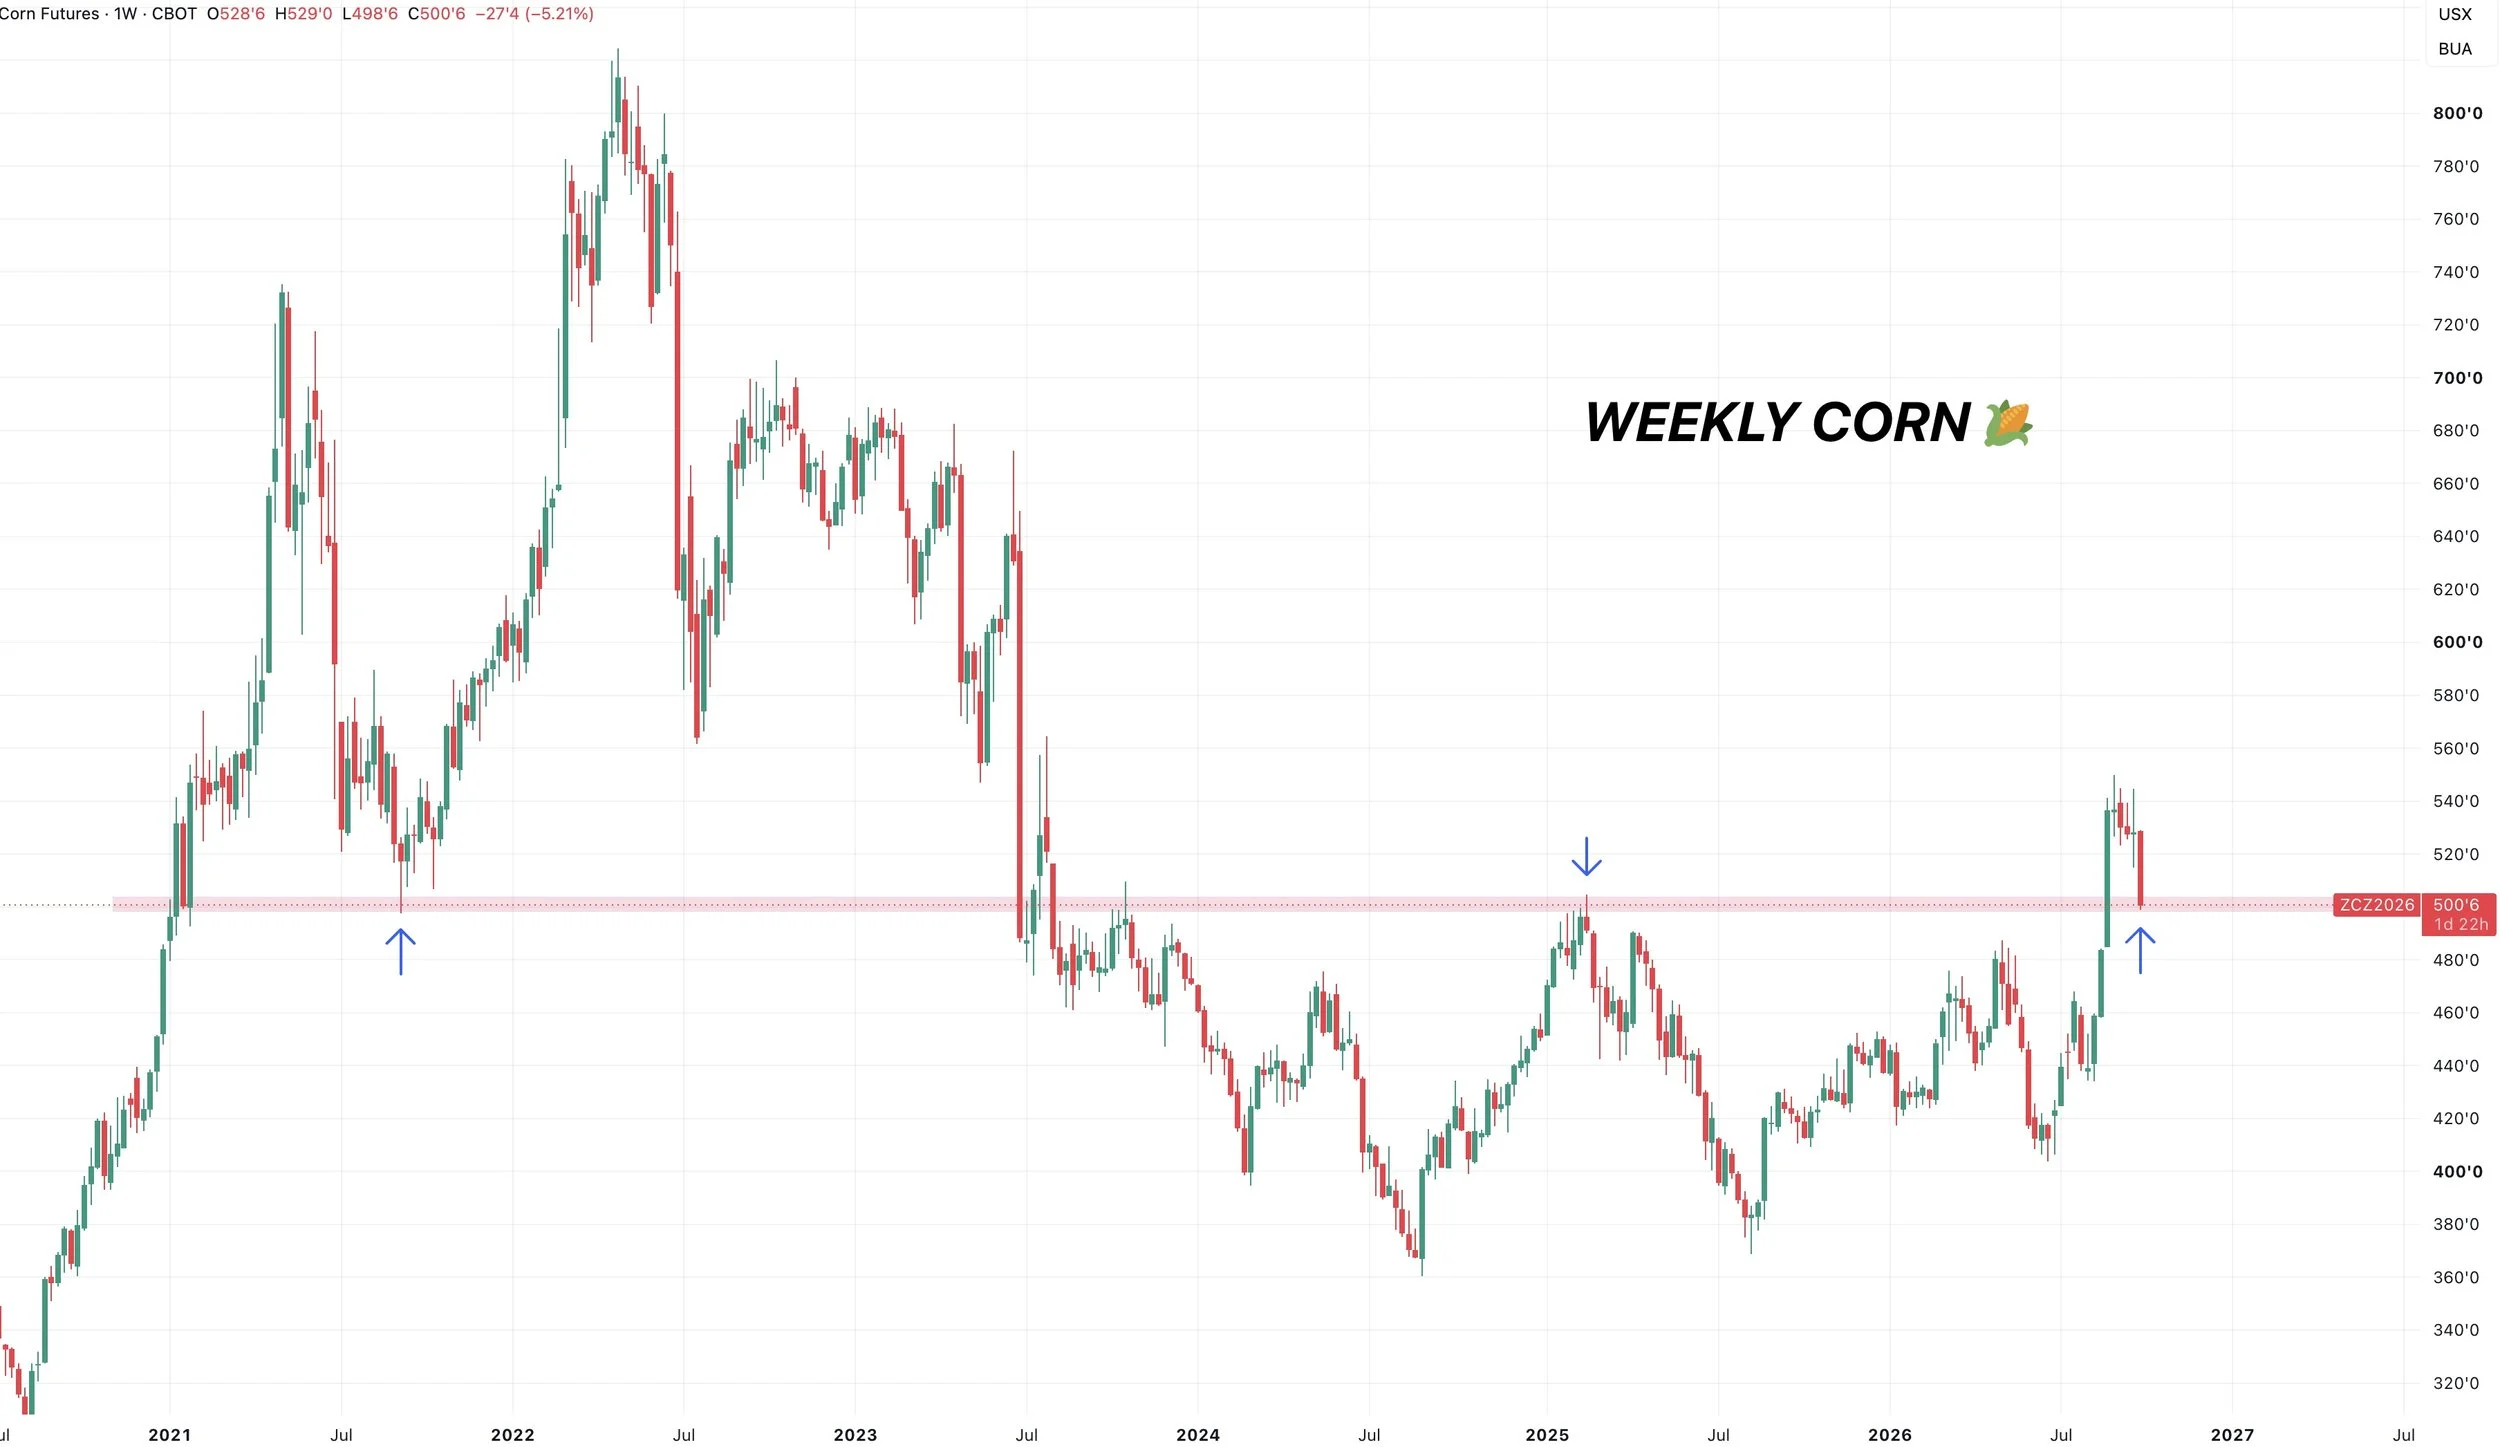
Let’s zoom out to the weekly chart.
Corn was trapped in a massive sideways range the last 3 years.
We broke out in August.
Now what does it look like we are doing?
For now this looks like a simple re-test of that old point of breakout. As we are right down at those highs from 2024 and the top of the range.
Old resistance often acts as new support.
Want to Talk?
Our phones are open 24/7 for you guys if you ever need anything or want to discuss your operation.
Jeremey & Office: (806)484-1214
Sebastian: (605)280-1186
Email: sfrost@dailymarketminute.com
Hedge Account
Interested in a hedge account? Use the link below to set up an account or give us a call.