
ACRES, RAIN, SEASONAL LOWS & CHARTS
MARKET UPDATE
You can scroll to read the usual update as well. As the written version is the exact same as the video.
Timestamps for video:
Overview: 0:00min
Corn: 3:20min
Beans: 11:05min
Wheat: 14:35min
Cattle: 15:35min
Want to talk?
Office: (806)484-1214
Want every daily update & signal?
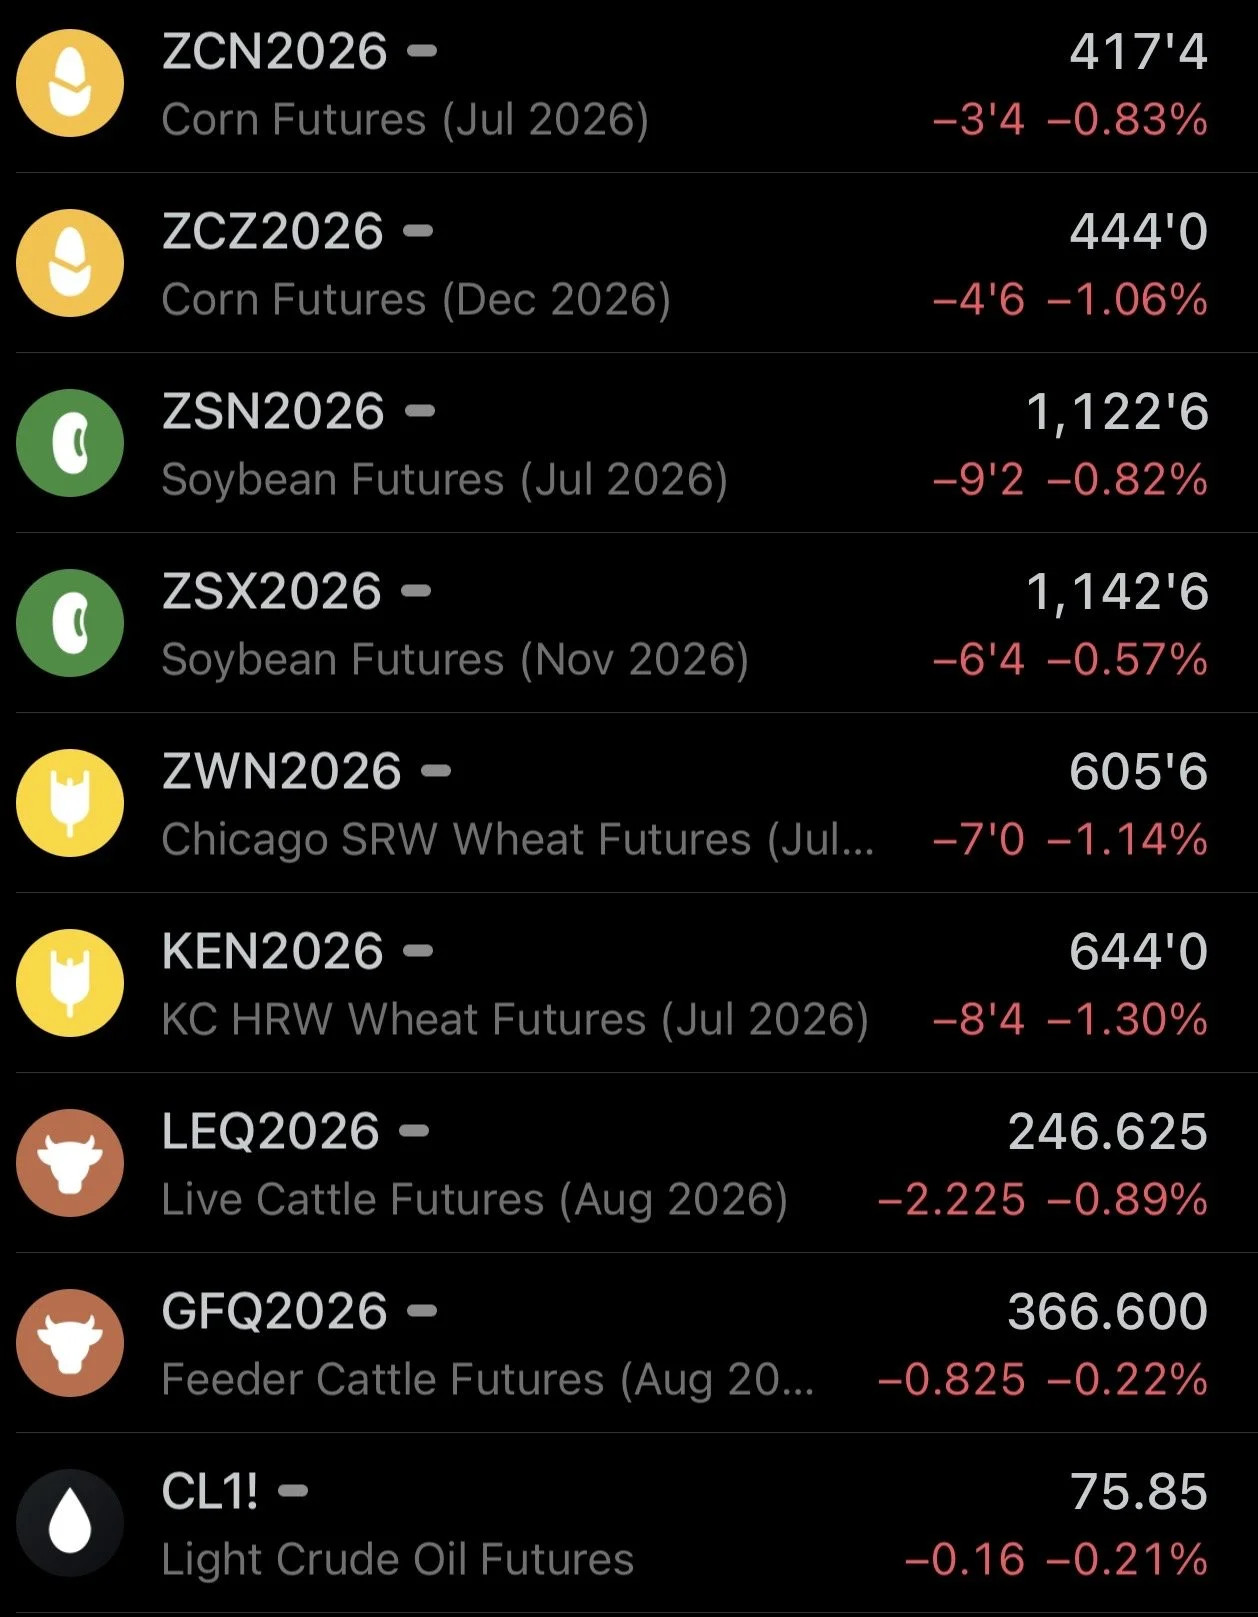
Futures Prices Close
Overview
Disappointing action in grains today, as we saw red across the board. Following yesterday's positive price action.
The markets will be closed tomorrow for Juneteenth and reopen on Sunday night.
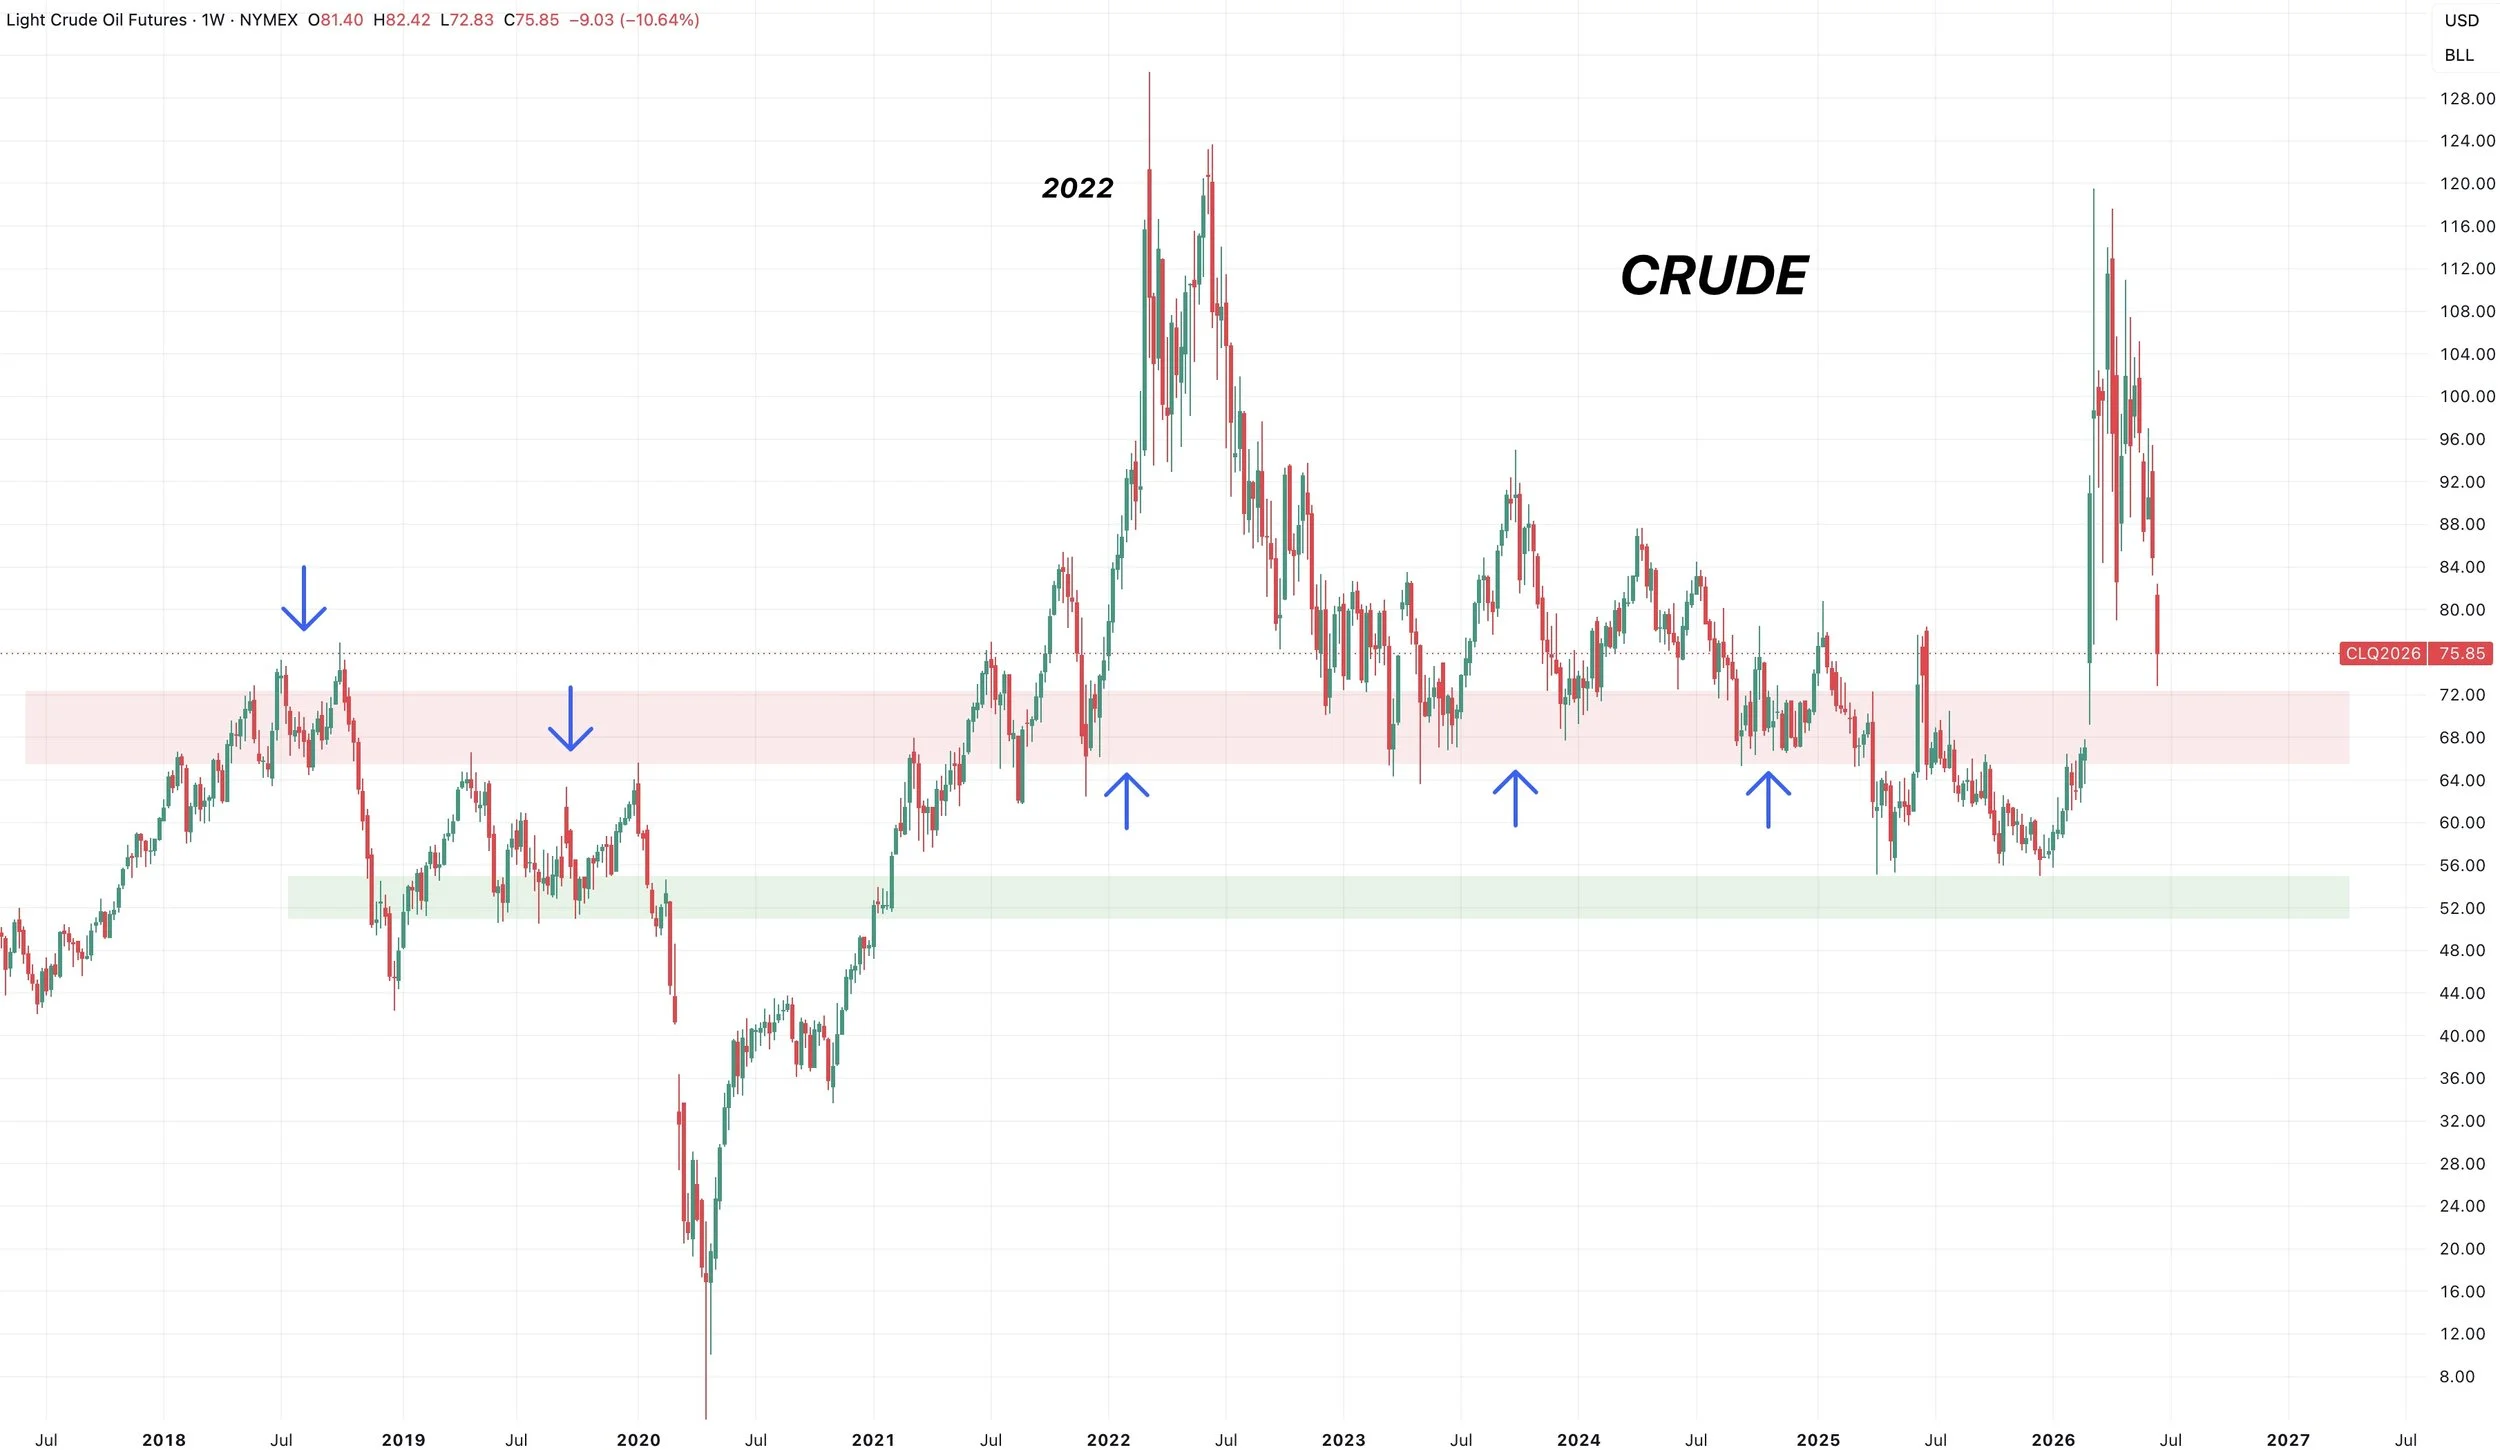
Crude oil has been getting smoked, but did rally well off the lows today.
Trump signed an MOU with Iran. The agreement to end the conflict is now in full effect.
Ship traffic in the Strait of Hormuz has officially resumed as well.
Crude traded under $73 today. It's down $24 over the last 2 weeks alone. $45 off the highs. Dropping to it's lowest levels since March 3rd. Eliminating most of that war rally.
We are getting close to possible support. As we've got some good support in the $65 to $70 range.

Here is a weekly chart for more context.
Too Wet?
We've still got plenty of rain in the forecasts.
Rain the middle of June is almost never going to be viewed as bullish to the market.
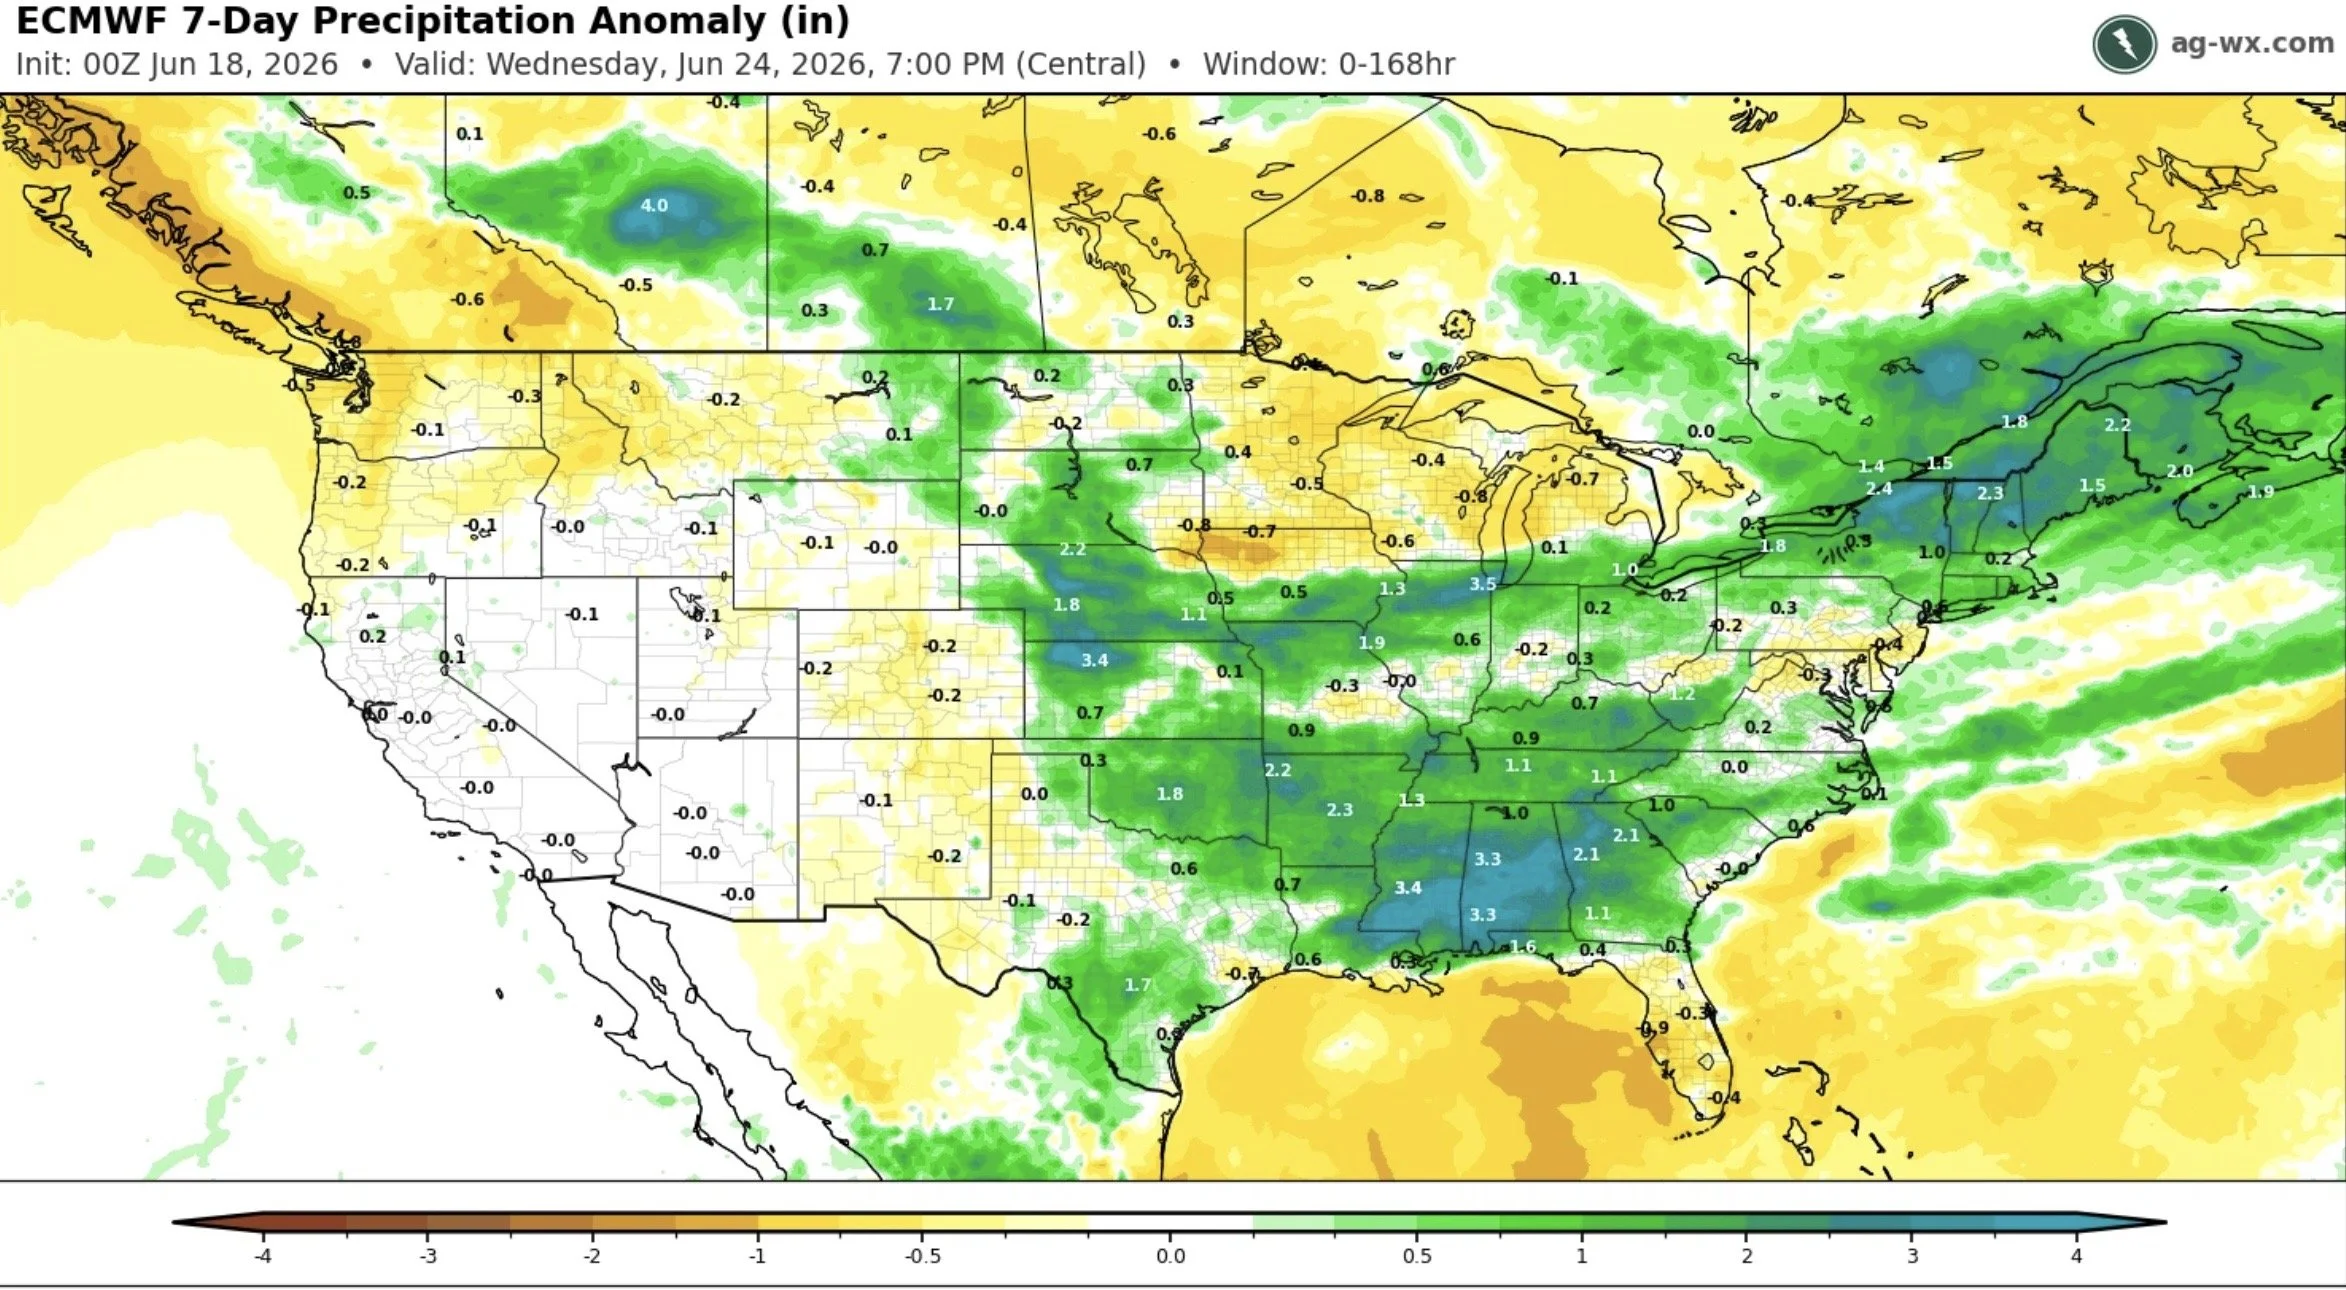
Although the markets reaction to rain isn’t going to be bullish, you could argue that some areas are getting too much rain.
The immediate reaction the market has is "rain makes grain".
Too much rain is absolutely something that can impact production down the road. But the problem is that too much rain isn’t going to create a weather rally like drought can.
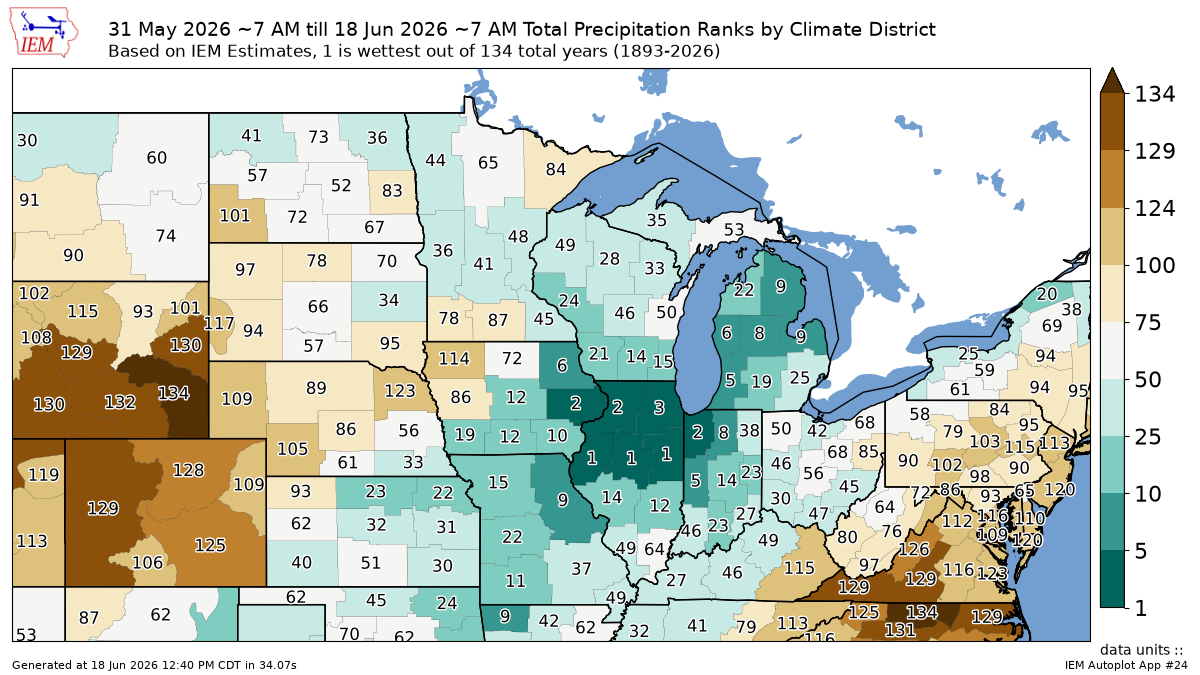
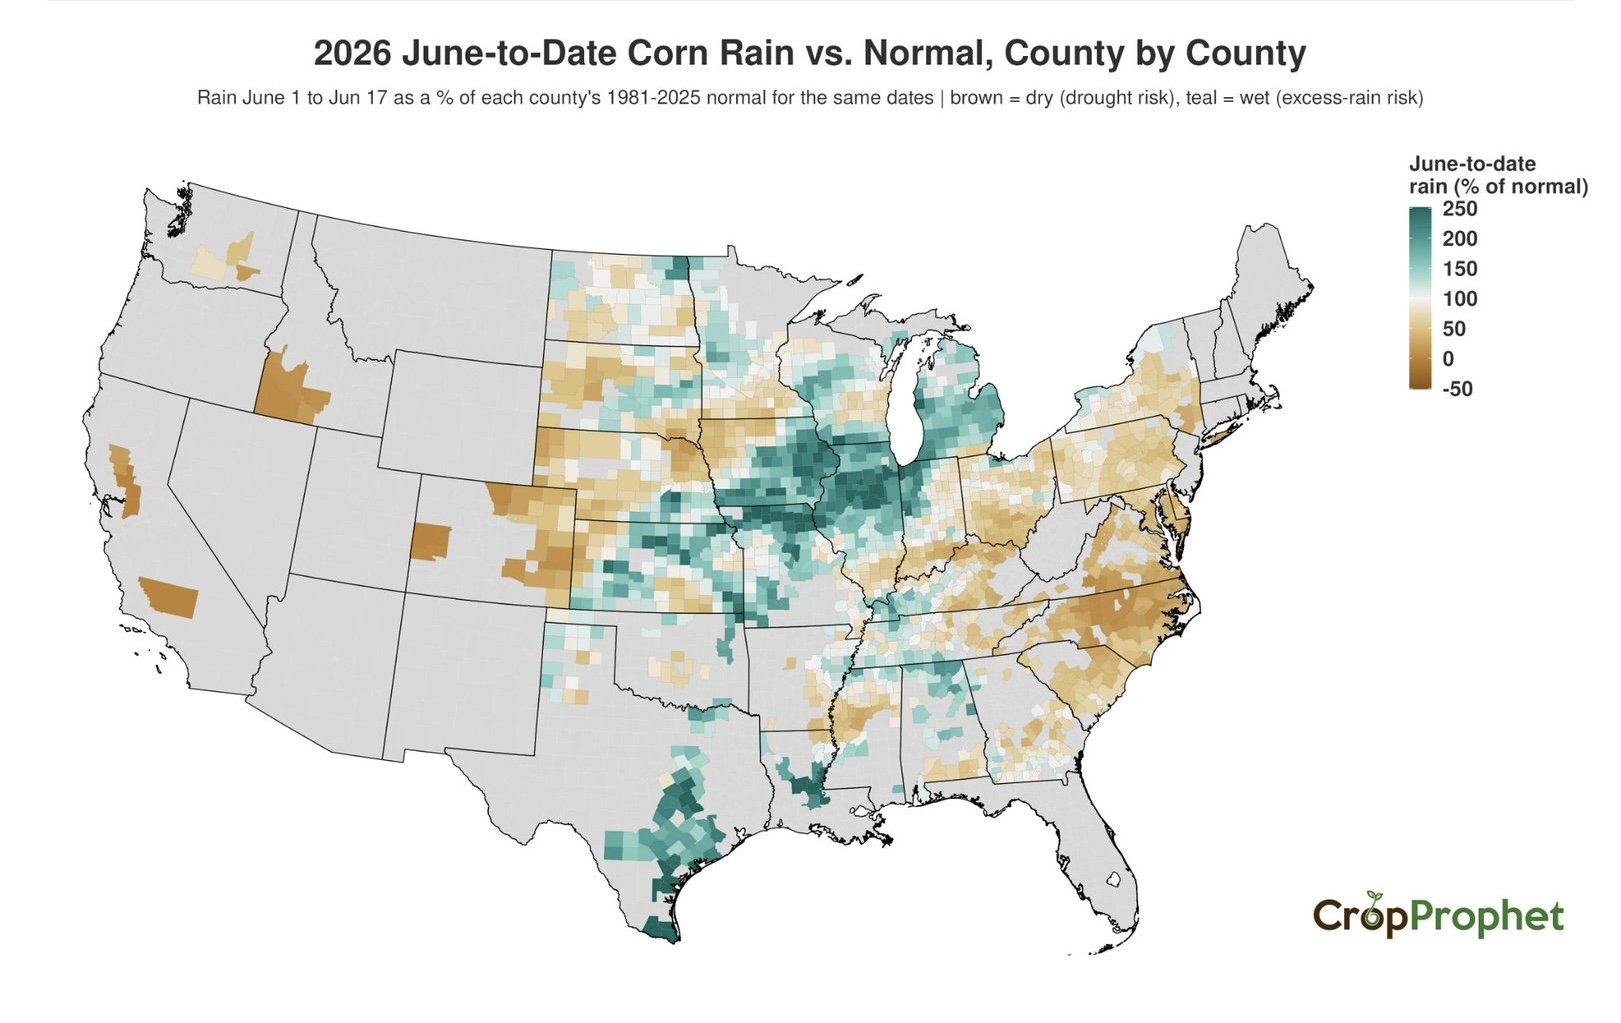
June has been crazy wet for the central corn belt. Here are the precip ranking for June so far.
Areas such as northern Illinois have had their wettest stretch ever.
Here are two great charts from Crop Prophet (@cropprophet on X).
One shows the % of rainfall for the month of June vs normal.
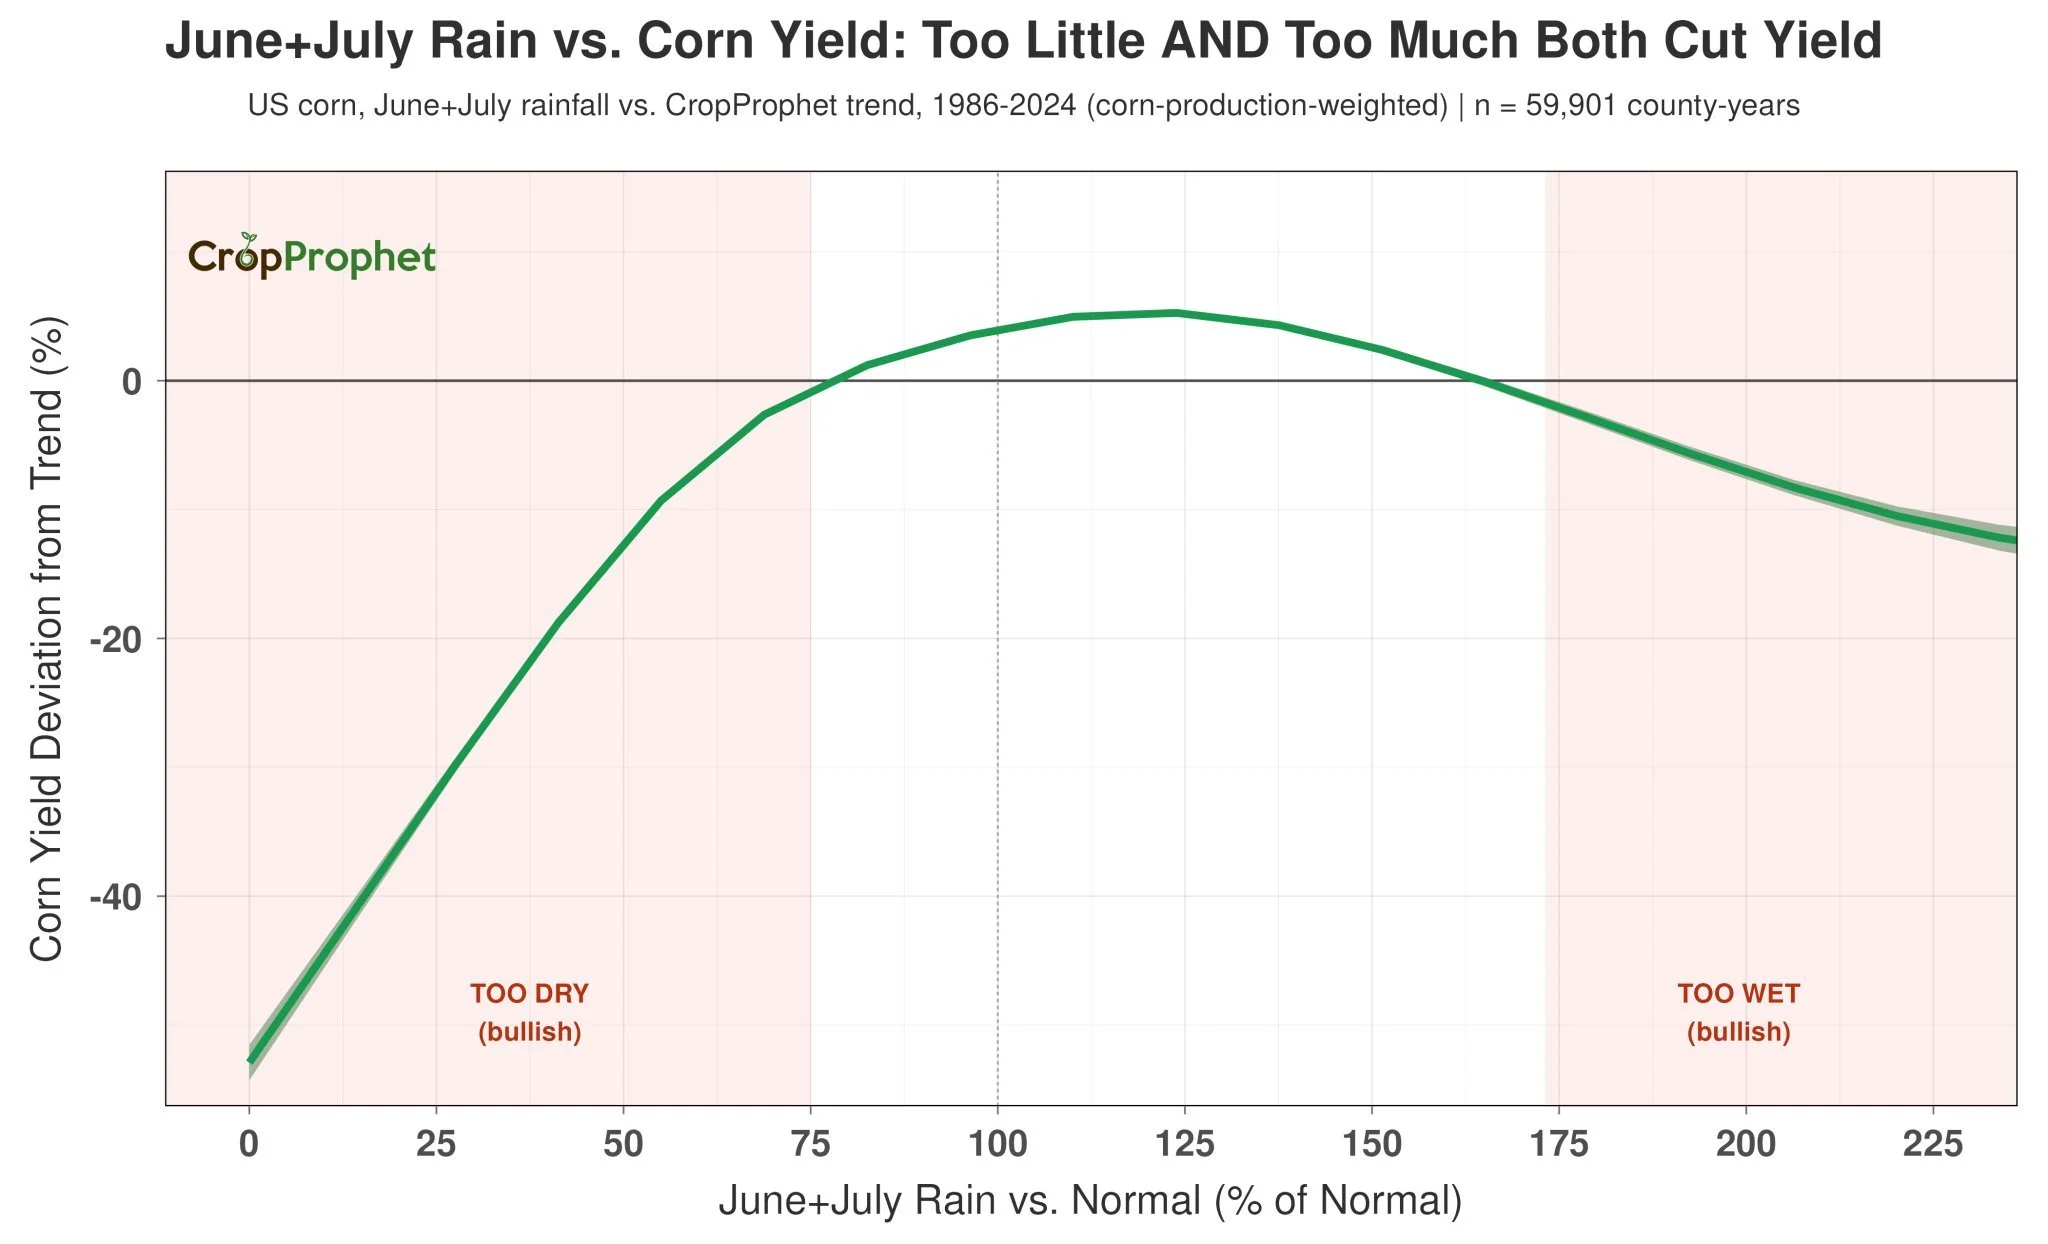
One shows how much rain is needed before it becomes a risk to yield.
Based on their data, above 175% of rain is historically where the overly wet conditions start to become an issue for yield in corn.
If you notice, there are several areas in Iowa and Illinois that have received well over 200% of their normal rainfall.
So I'd say this rain could definitely have a negative impact later on. The market of course won’t care too much about it today, but this much rain isn’t a recipe for a perfect crop.
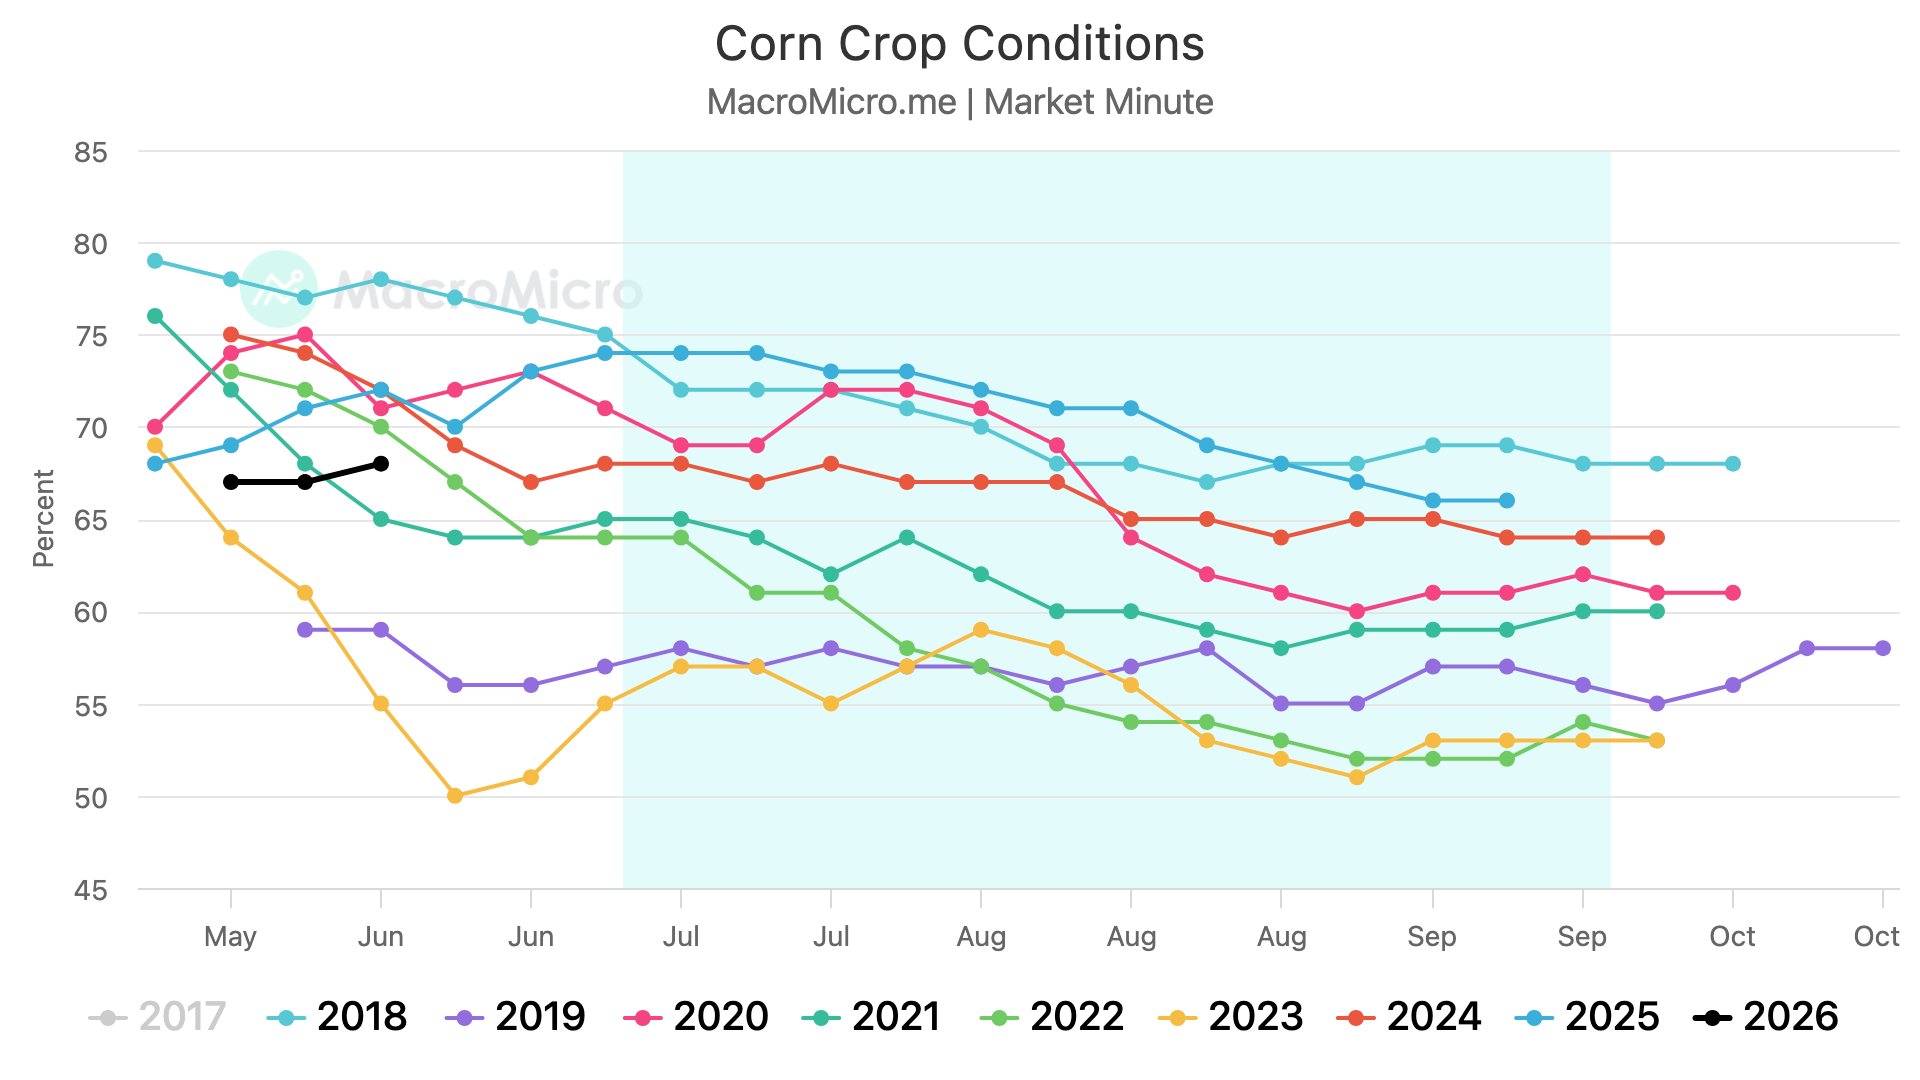
Nationally the crop conditions don’t suggest major issues.
We're sitting right around average.
Crop's not bad, but it's not great based on these.
Although it's still plenty early to make assumptions in either direction.

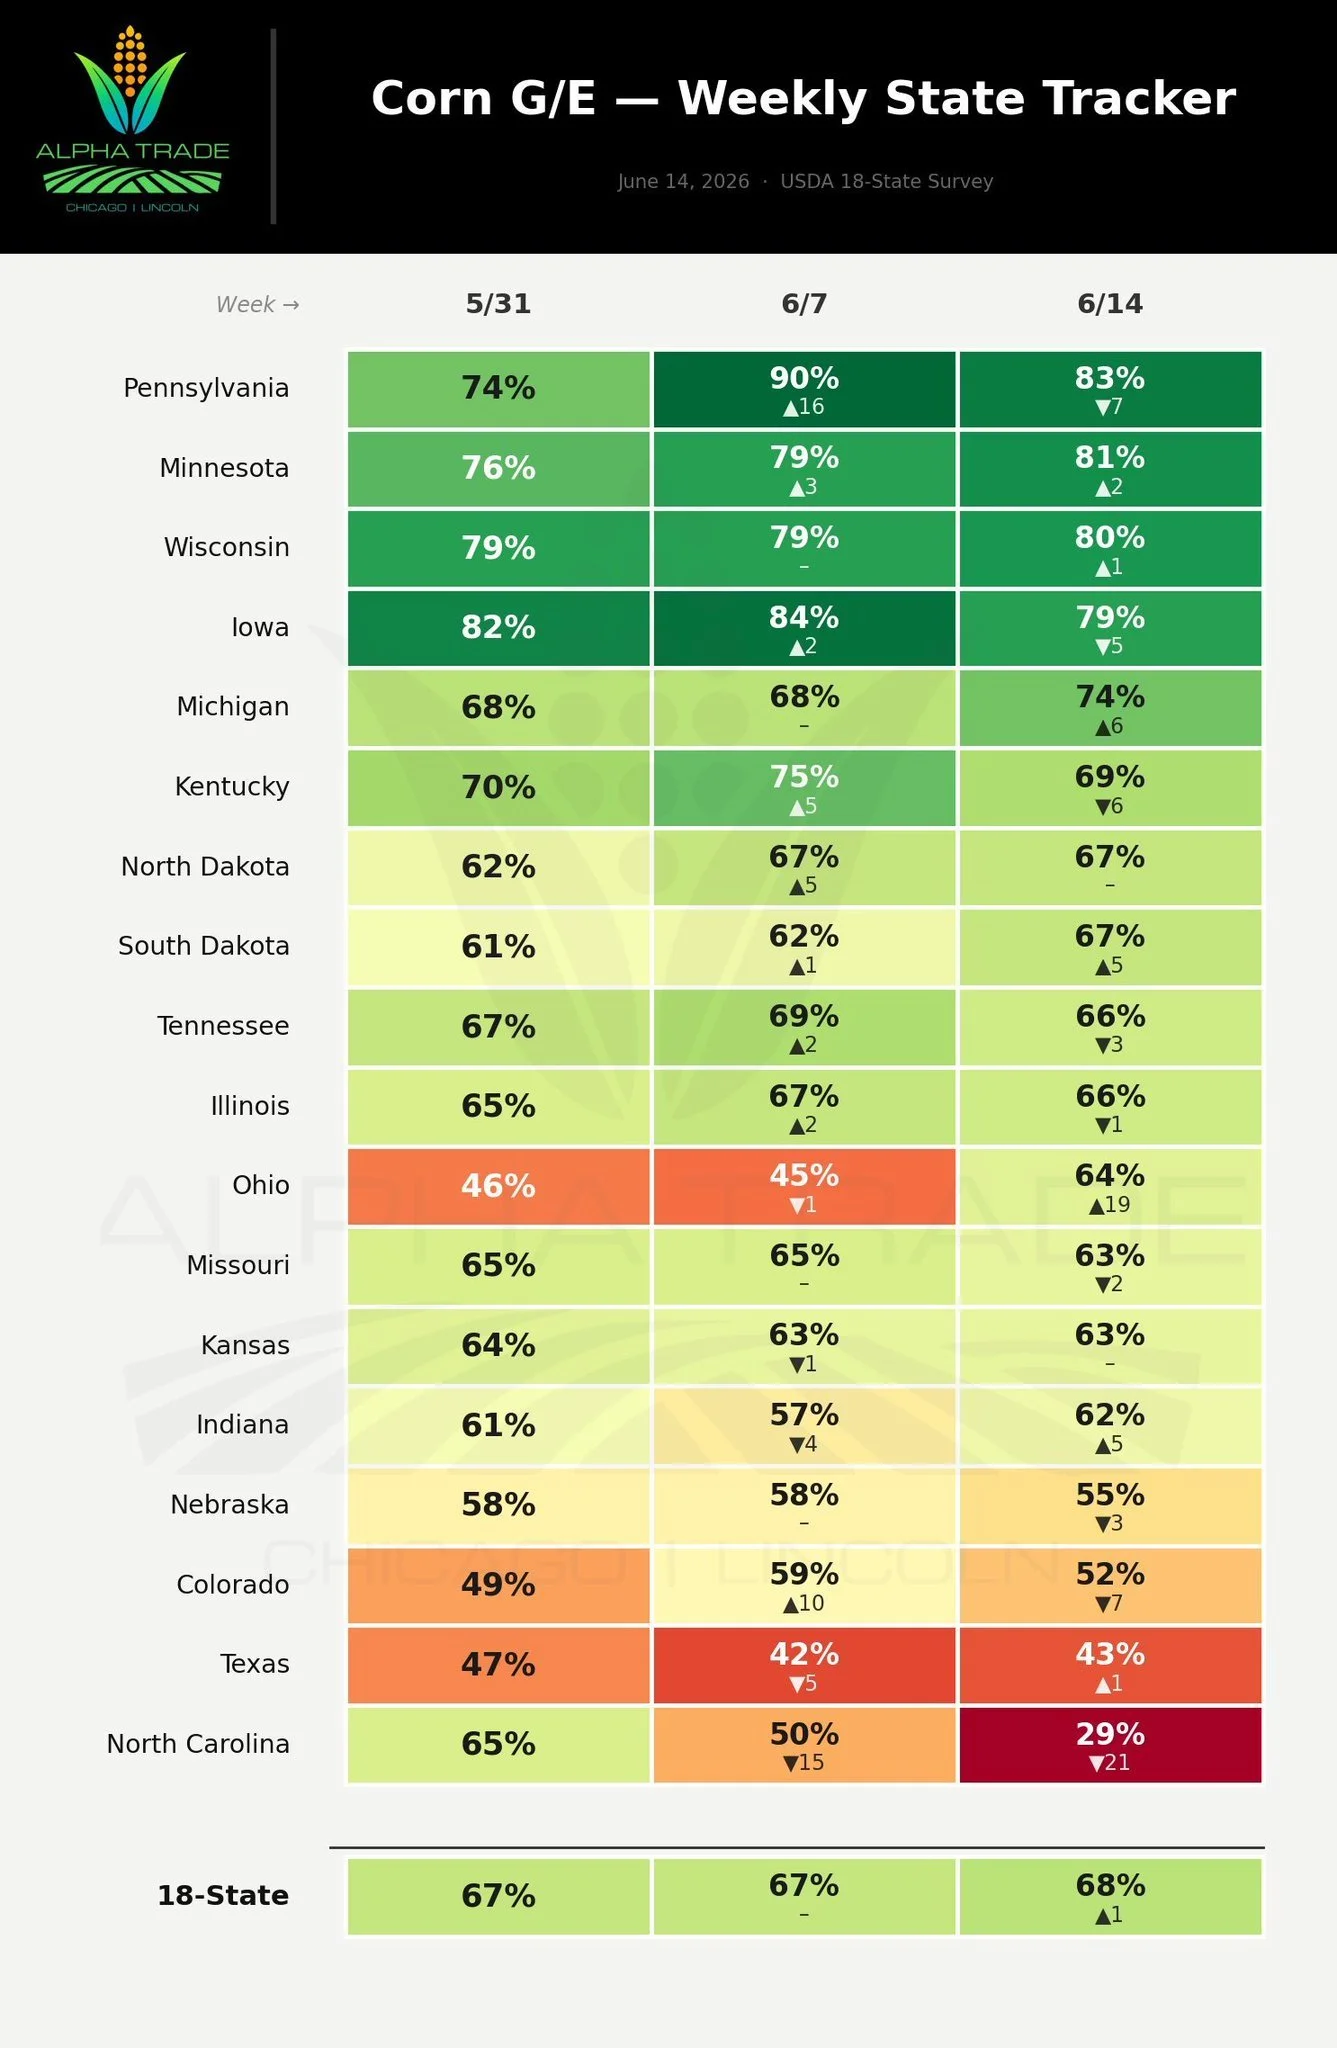
Here is the week by week changes for each state's corn crop conditions.
We increased 1% nationally last week, but Iowa dropped 5%. So the wetness could very well be having an impact.
(Chart from Darrin Fessler @DDFalpha on X)
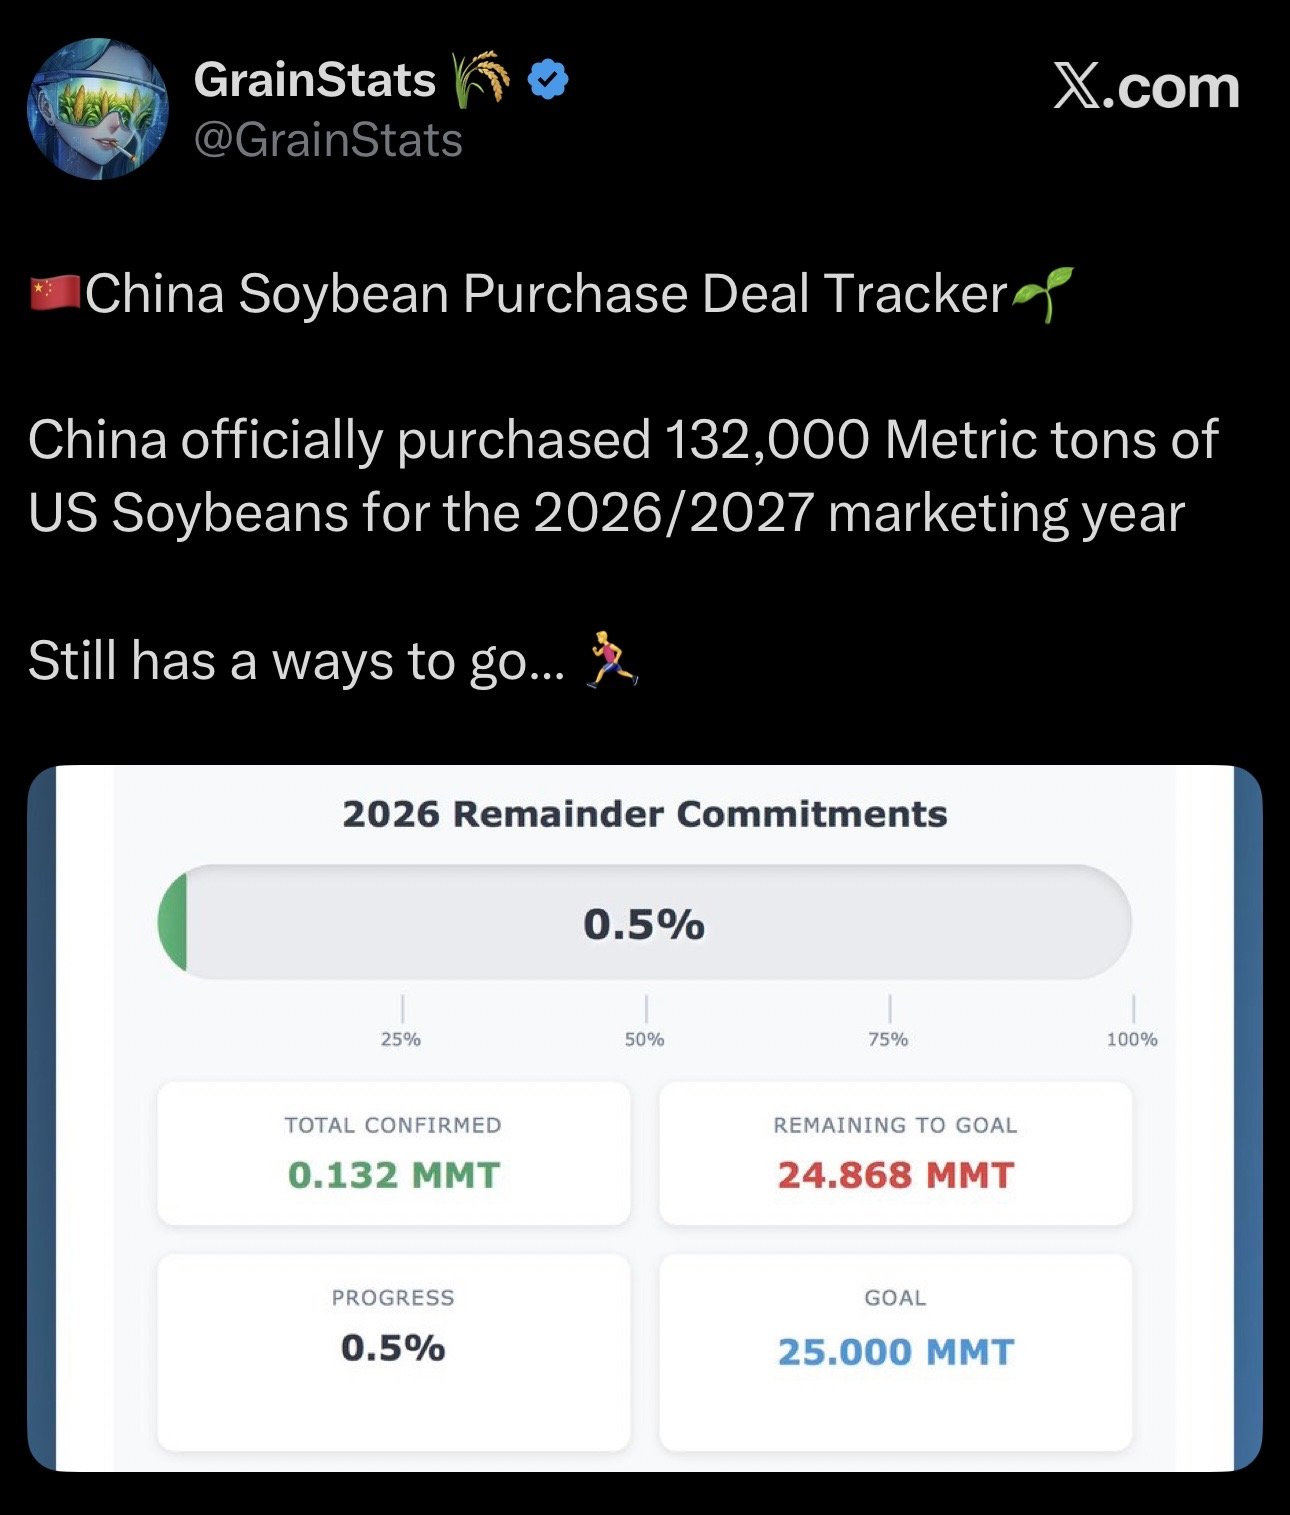
China Bought Beans
The last few days there were some rumors that China was buying beans, as we saw a good amount of flash sales to unknown. Which could very well be China.
Yesterday we saw a flash sale of 370k MT to unknown, which was the biggest flash sale we've seen since January.
Today we did actually see our first offical flash sale of new crop beans to China.
As they bought 132k MT.
Which is a relatively small amount. It's only 0.5% of the 25 MMT goal.
Today's Main Takeaways
Corn
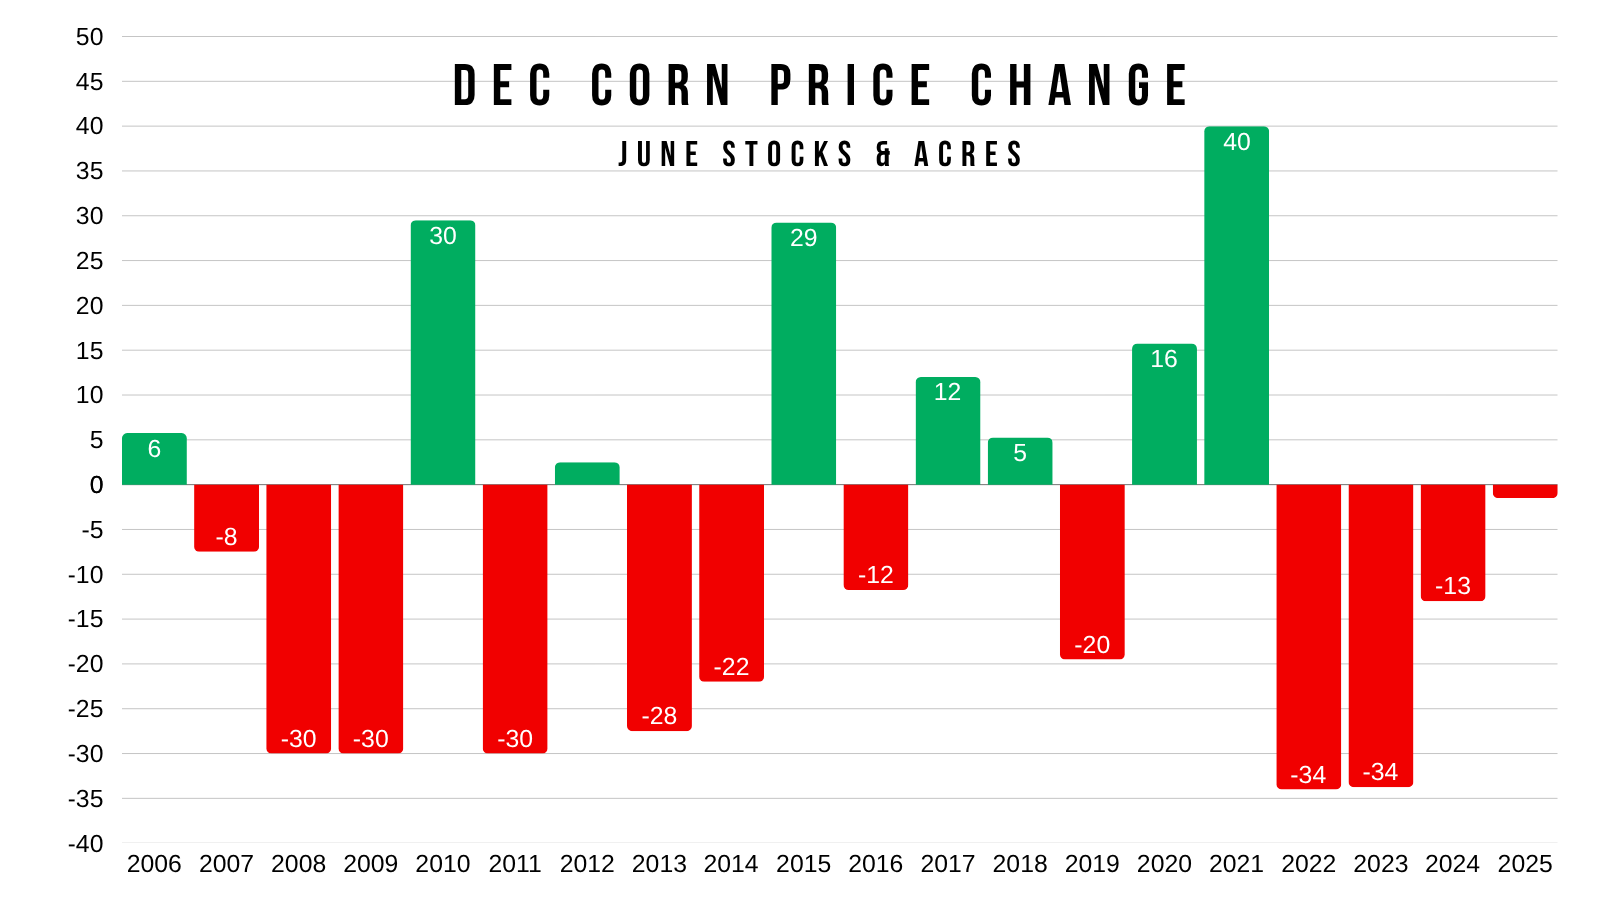
The report at the end of the month is going to be a big one. It's one of the biggest of the entire year.
Just take a look at the price changes for Dec corn on the day of this report.
Absolutely a market mover.
We've only seen less than a 10 cent move twice in the last 13 years.
Normally, we see acres jump from the March intentions to the June acres report. Especially if planting was above average pace, which we saw this year.
We actually rarely see the USDA drop acres from March to June.
But this isn’t a normal year either with the whole fertilizer situation.
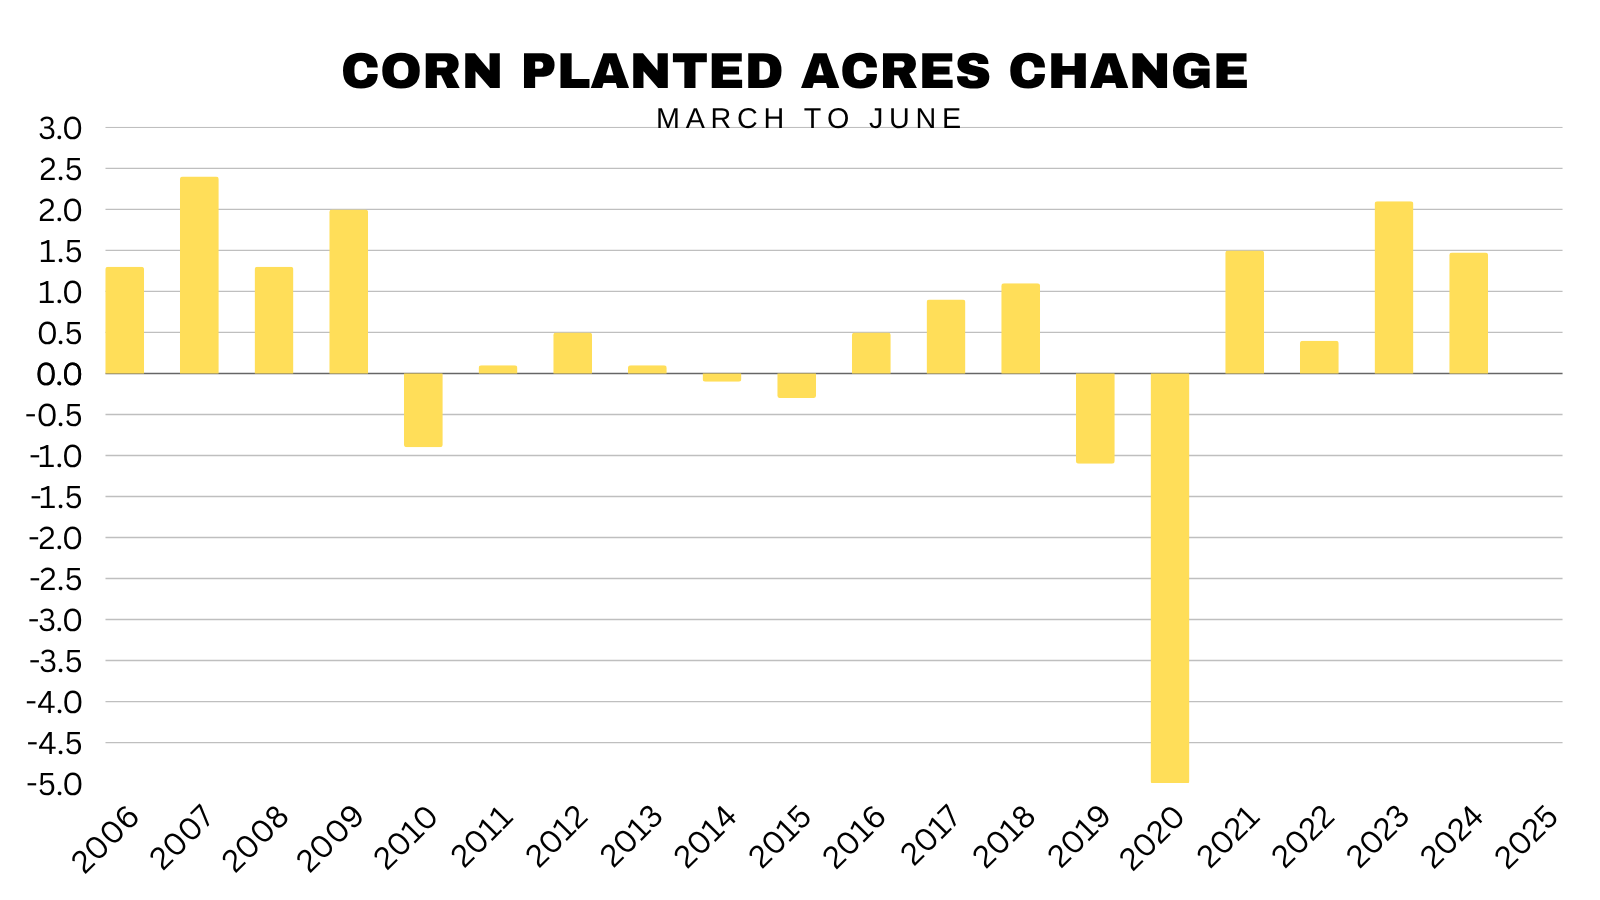
Whether the USDA acknowledges it at the end of the month or not, I do feel like acres ultimately end up coming down.
The USDA's starting number has rarely been within a million of the final number the last decade. The last time they were close was 2017.
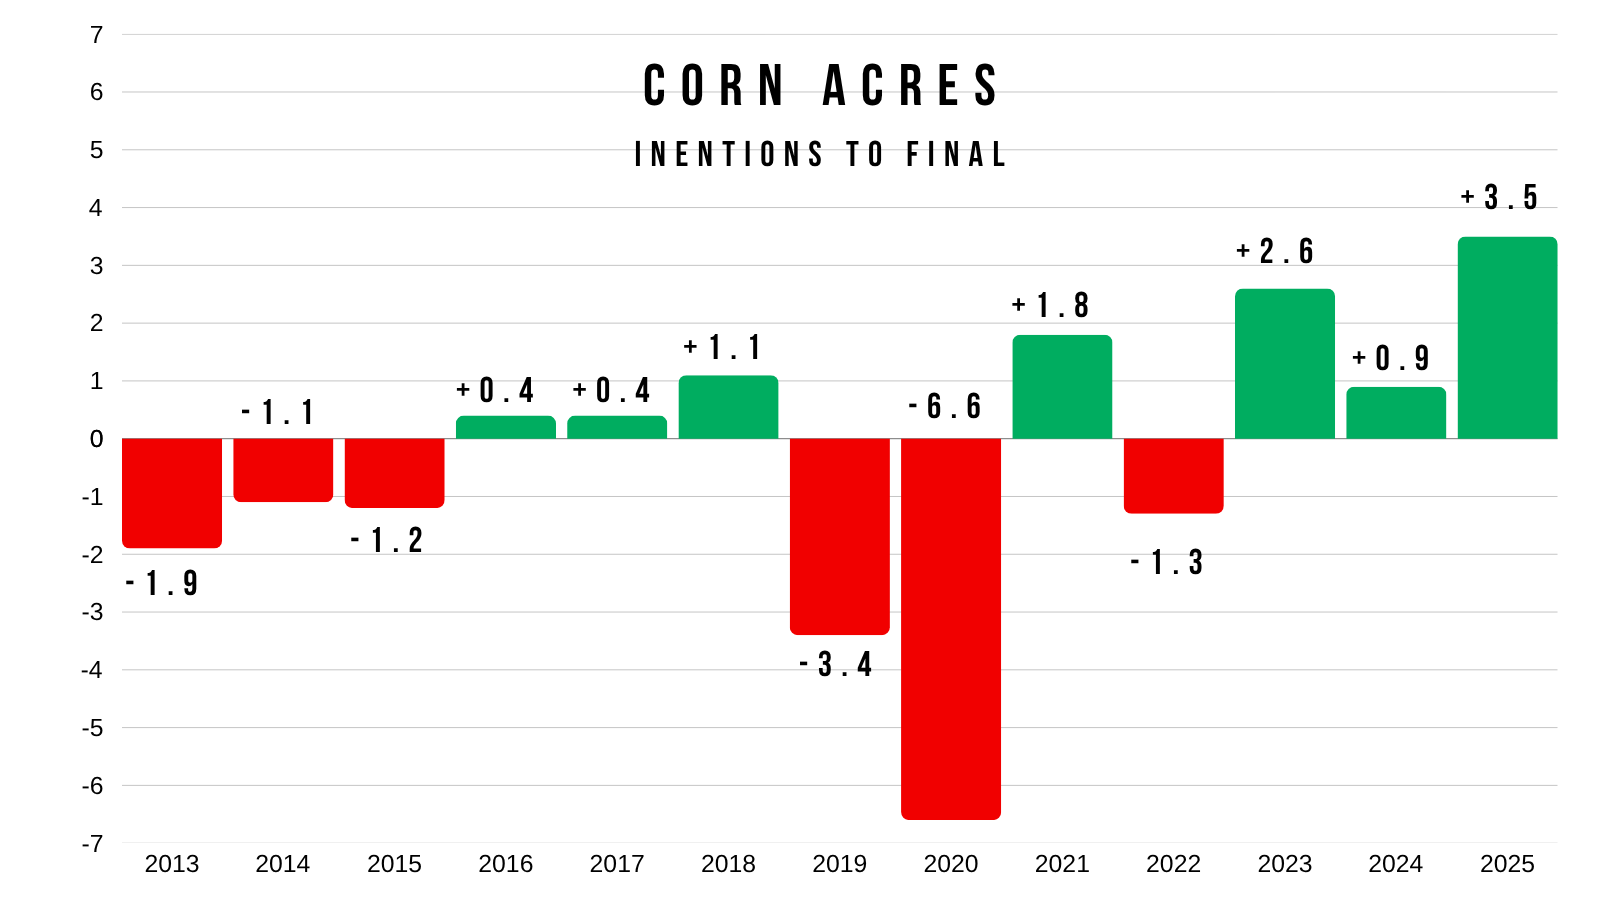
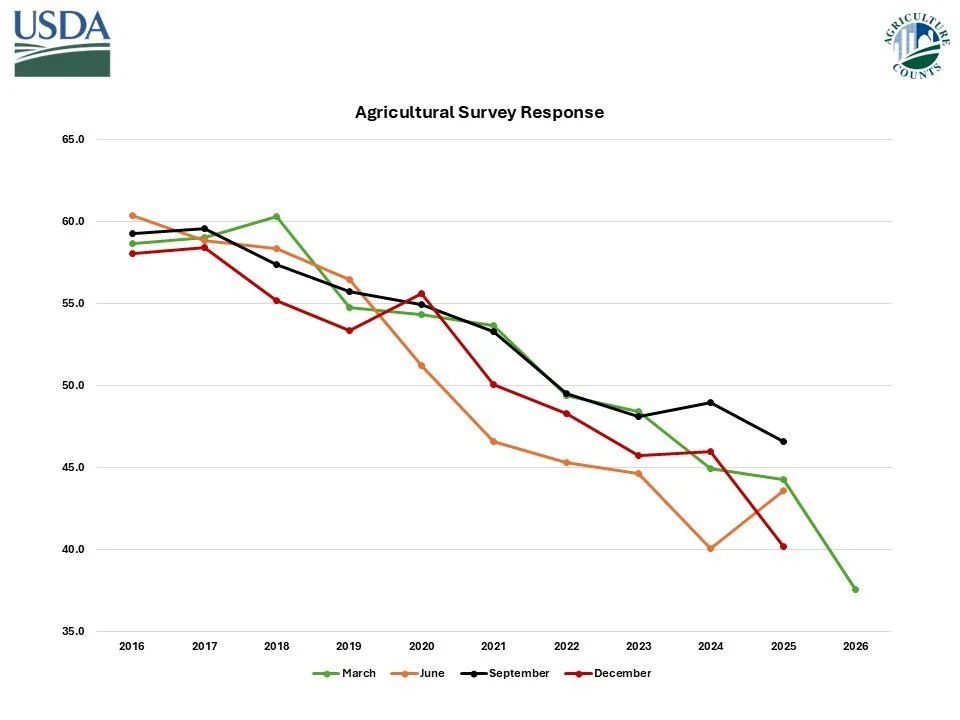
You also can’t forget the fact that this intentions report had the lowest response rate ever.
In the 90's the response rate was around 80-90%.
Just back 10 years ago the response rate was 60%.
Last year it was 44%.
This year it was all the way down to 37.5%..
So those starting numbers are definitely questionable.
Last year's 3.5 million-acre miss alone makes you have to question these surveys.
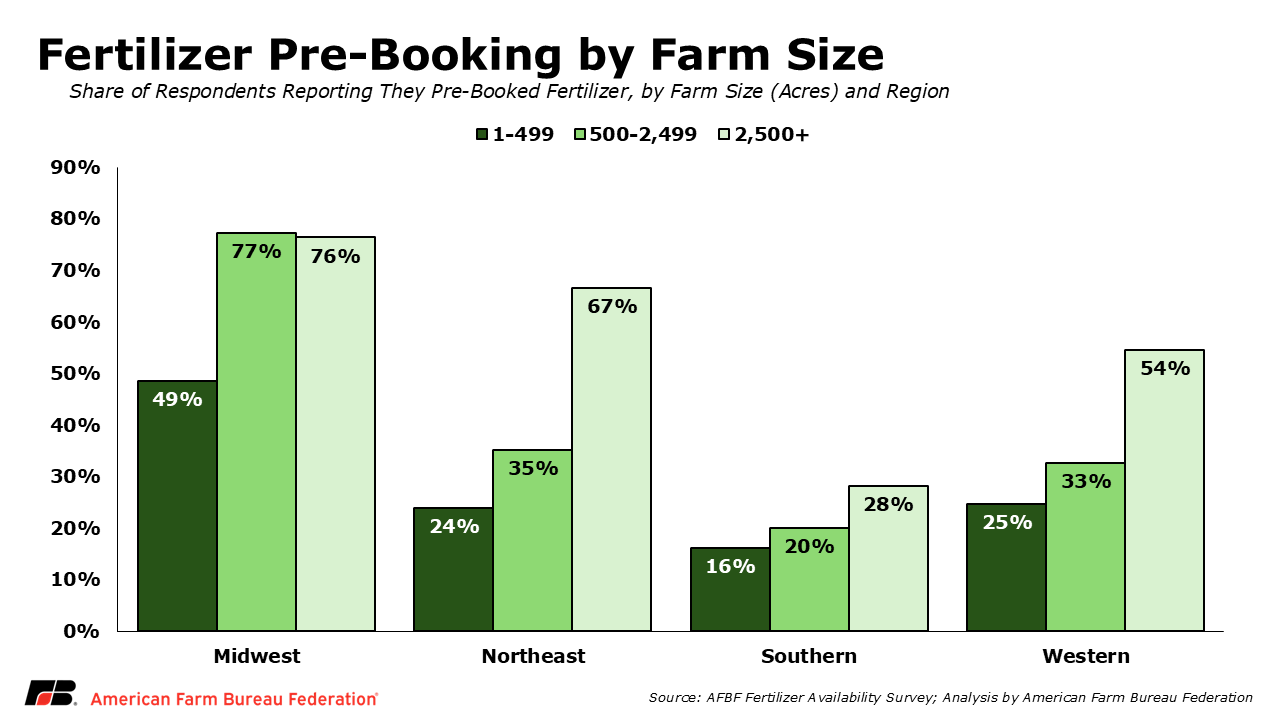
Here is a chart from the American Farm Bureau from back in April that shows fertilizer pre-booking by regions and farm size.
On one hand, yes corn rallied which could’ve incentivized some acres.
On the other, I find it hard to imagine that the fertilizer situation didn’t have an impact on things.
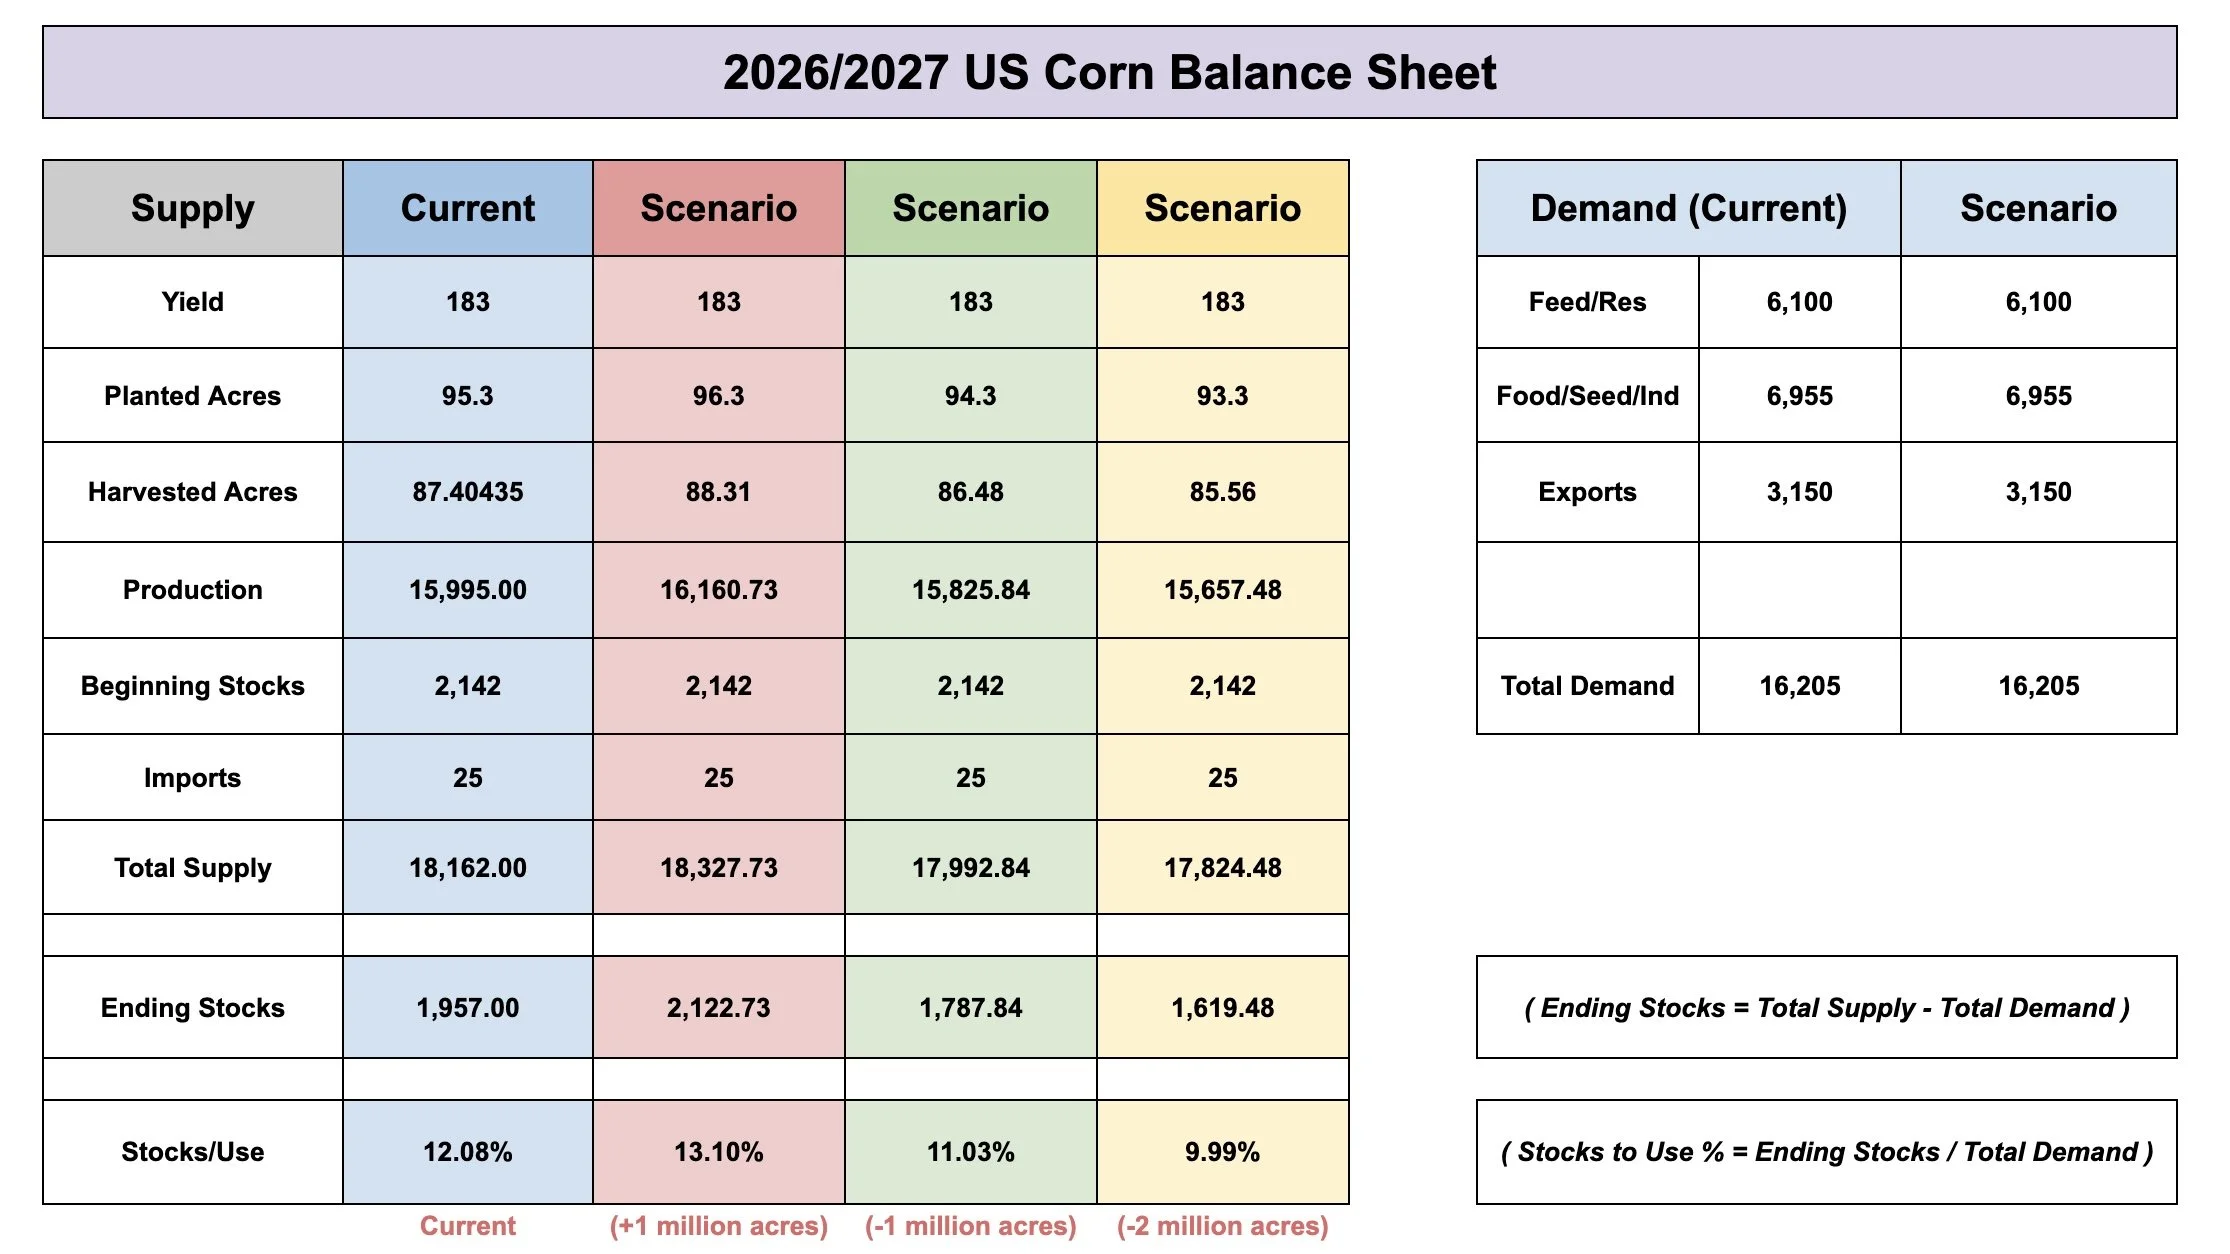
Here is how changes in acres can impact the balance sheet. This shows you just how impactful acres are going to be.
None of these examples includes any demand changes, and keep the 183 yield.
96.3 million acres (+1 million more)
Carryout: 2.12 billion
Stocks to Use: 13.00%
95.3 million acres (Current)
Carryout: 1.95 billion
Stocks to Use: 12.00%
94.3 million acres (-1 million less)
Carryout: 1.78 billion
Stocks to Use: 11.00%
93.3 million acres (-2 million less)
Carryout: 1.62 billion
Stocks to Use: 10.00%
So simply losing acres can have a massive impact on the balance sheet alone, and that's with using a 183 yield.
If we lose acres, we will have to have a big yield or the balance sheet gets relatively tight.
Acres can completely change the balance sheet.
Bottom Line:
I’d like to think the worst of it is probably behind us. Given how hard and fast we sold off. We've completely removed the war premium and crude oil is -40% off of it's highs now.
In the short term, we still might have a hard time putting together this massive rally out of nowhere without a catalyst driving us.
As we've discussed countless times, I still think corn has massive amounts of potential looking towards next year, but that's a story for another time.
We have plenty of friendly long term factors such as China should be buying, we don’t know acres or production at all, along with the whole inflation and fertilizer impact.
But if we get a bounce, we will want to be looking to reward it and respect any sort of rally here.
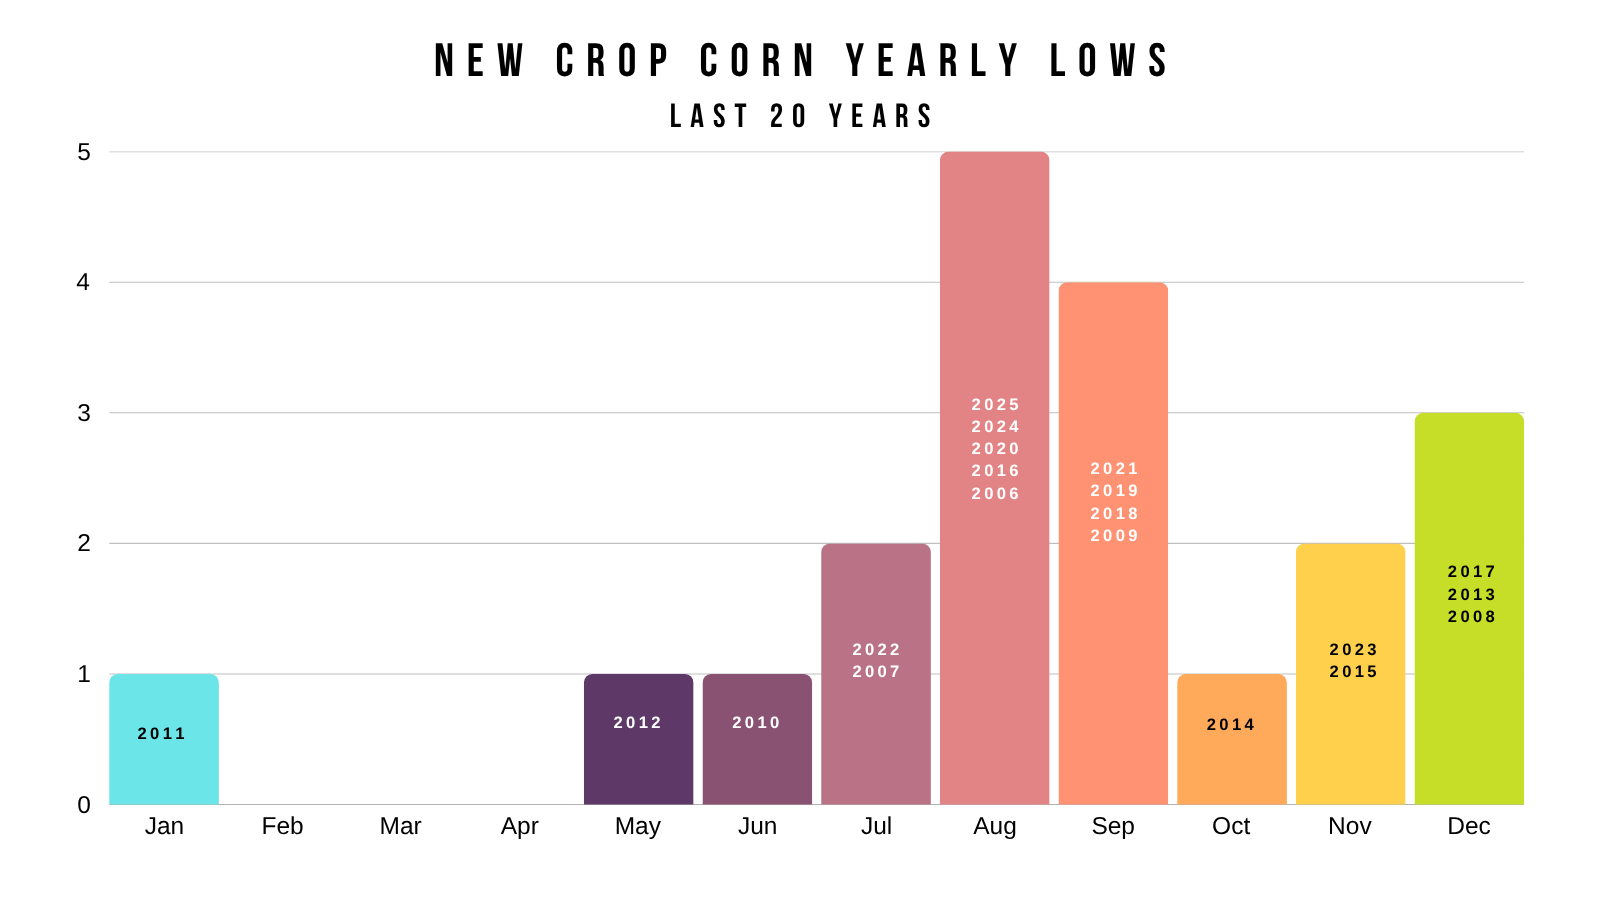
Because we've only posted our lowest price of the year in June one time ever. Back in 2010 when we had a bullish June 30th report.
Outside of that, the lowest price of the year has never came in June. (Chart below)
There is of course always the chance it could happen again, but history isn’t on our side.
For that to happen, it would probably take a really bullish report at the end of the month, China stepping in right now, or some sort of weather scare.
However, logically, it makes sense for China to wait until harvest to buy corn.
The weather hasn’t been an issue. Some of the extended forecasts do look dry, but you can’t trust them.
The report is the biggest short term wildcard.
If we look at the updated seasonal data, it still says lower by August whether we bounce first or not.
From today's date by August 15th, we've been lower the last 9 of 10 years.
So if we get a good bounce or rally here, it's going to be viewed as an opportunity before those harvest lows.
Which is why we've been talking about courage calls. Having them makes sense for some of you who need to make sales on a bounce or knows you will struggle to pull the trigger if we get a bounce. They are just a cheap way to give you the "courage" to make sales on a bounce.
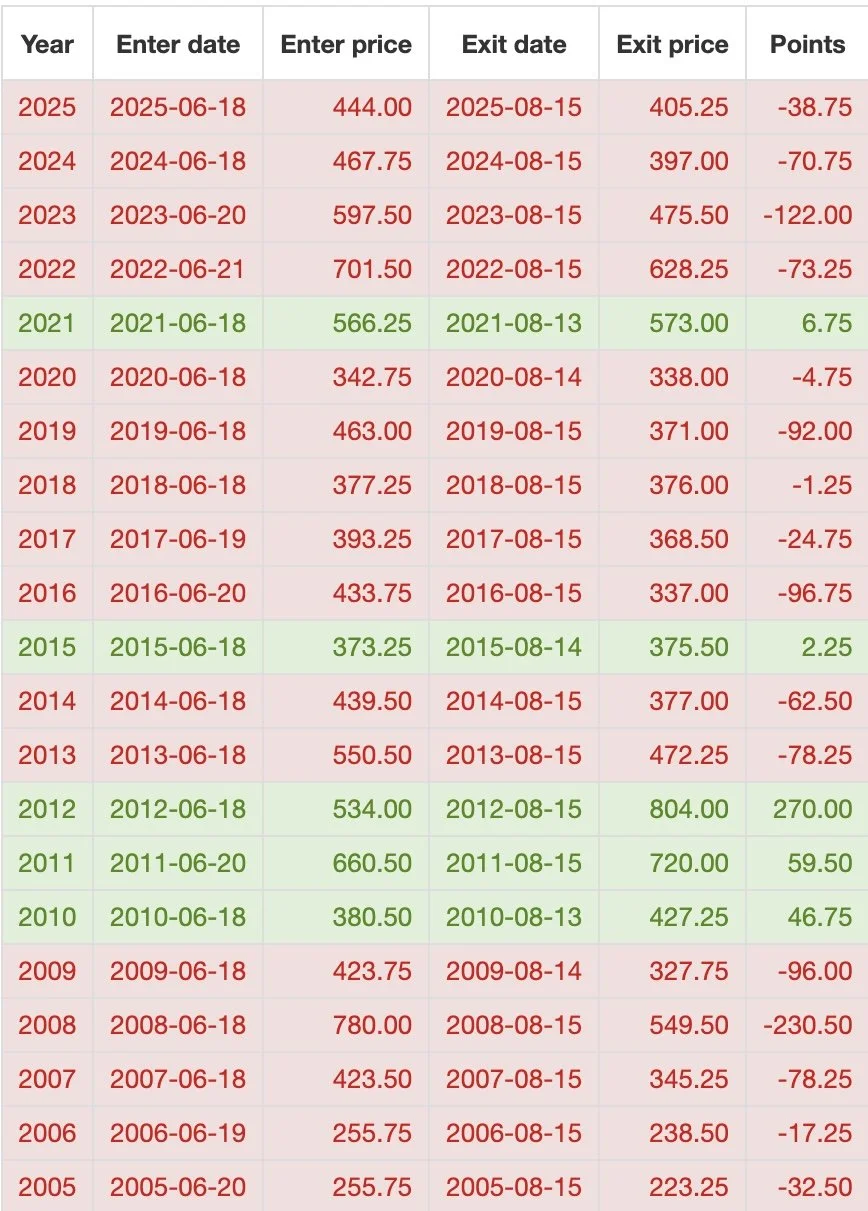
When and where could the harvest lows be?
I circled the last several harvest lows on the weekly corn chart.
2025: Aug
2024: Aug
2023: Aug
2022: Late July
2021: Early Sep
2020: Aug
2019: Aug
Over the last several years it's tended to be right around that August timeframe.
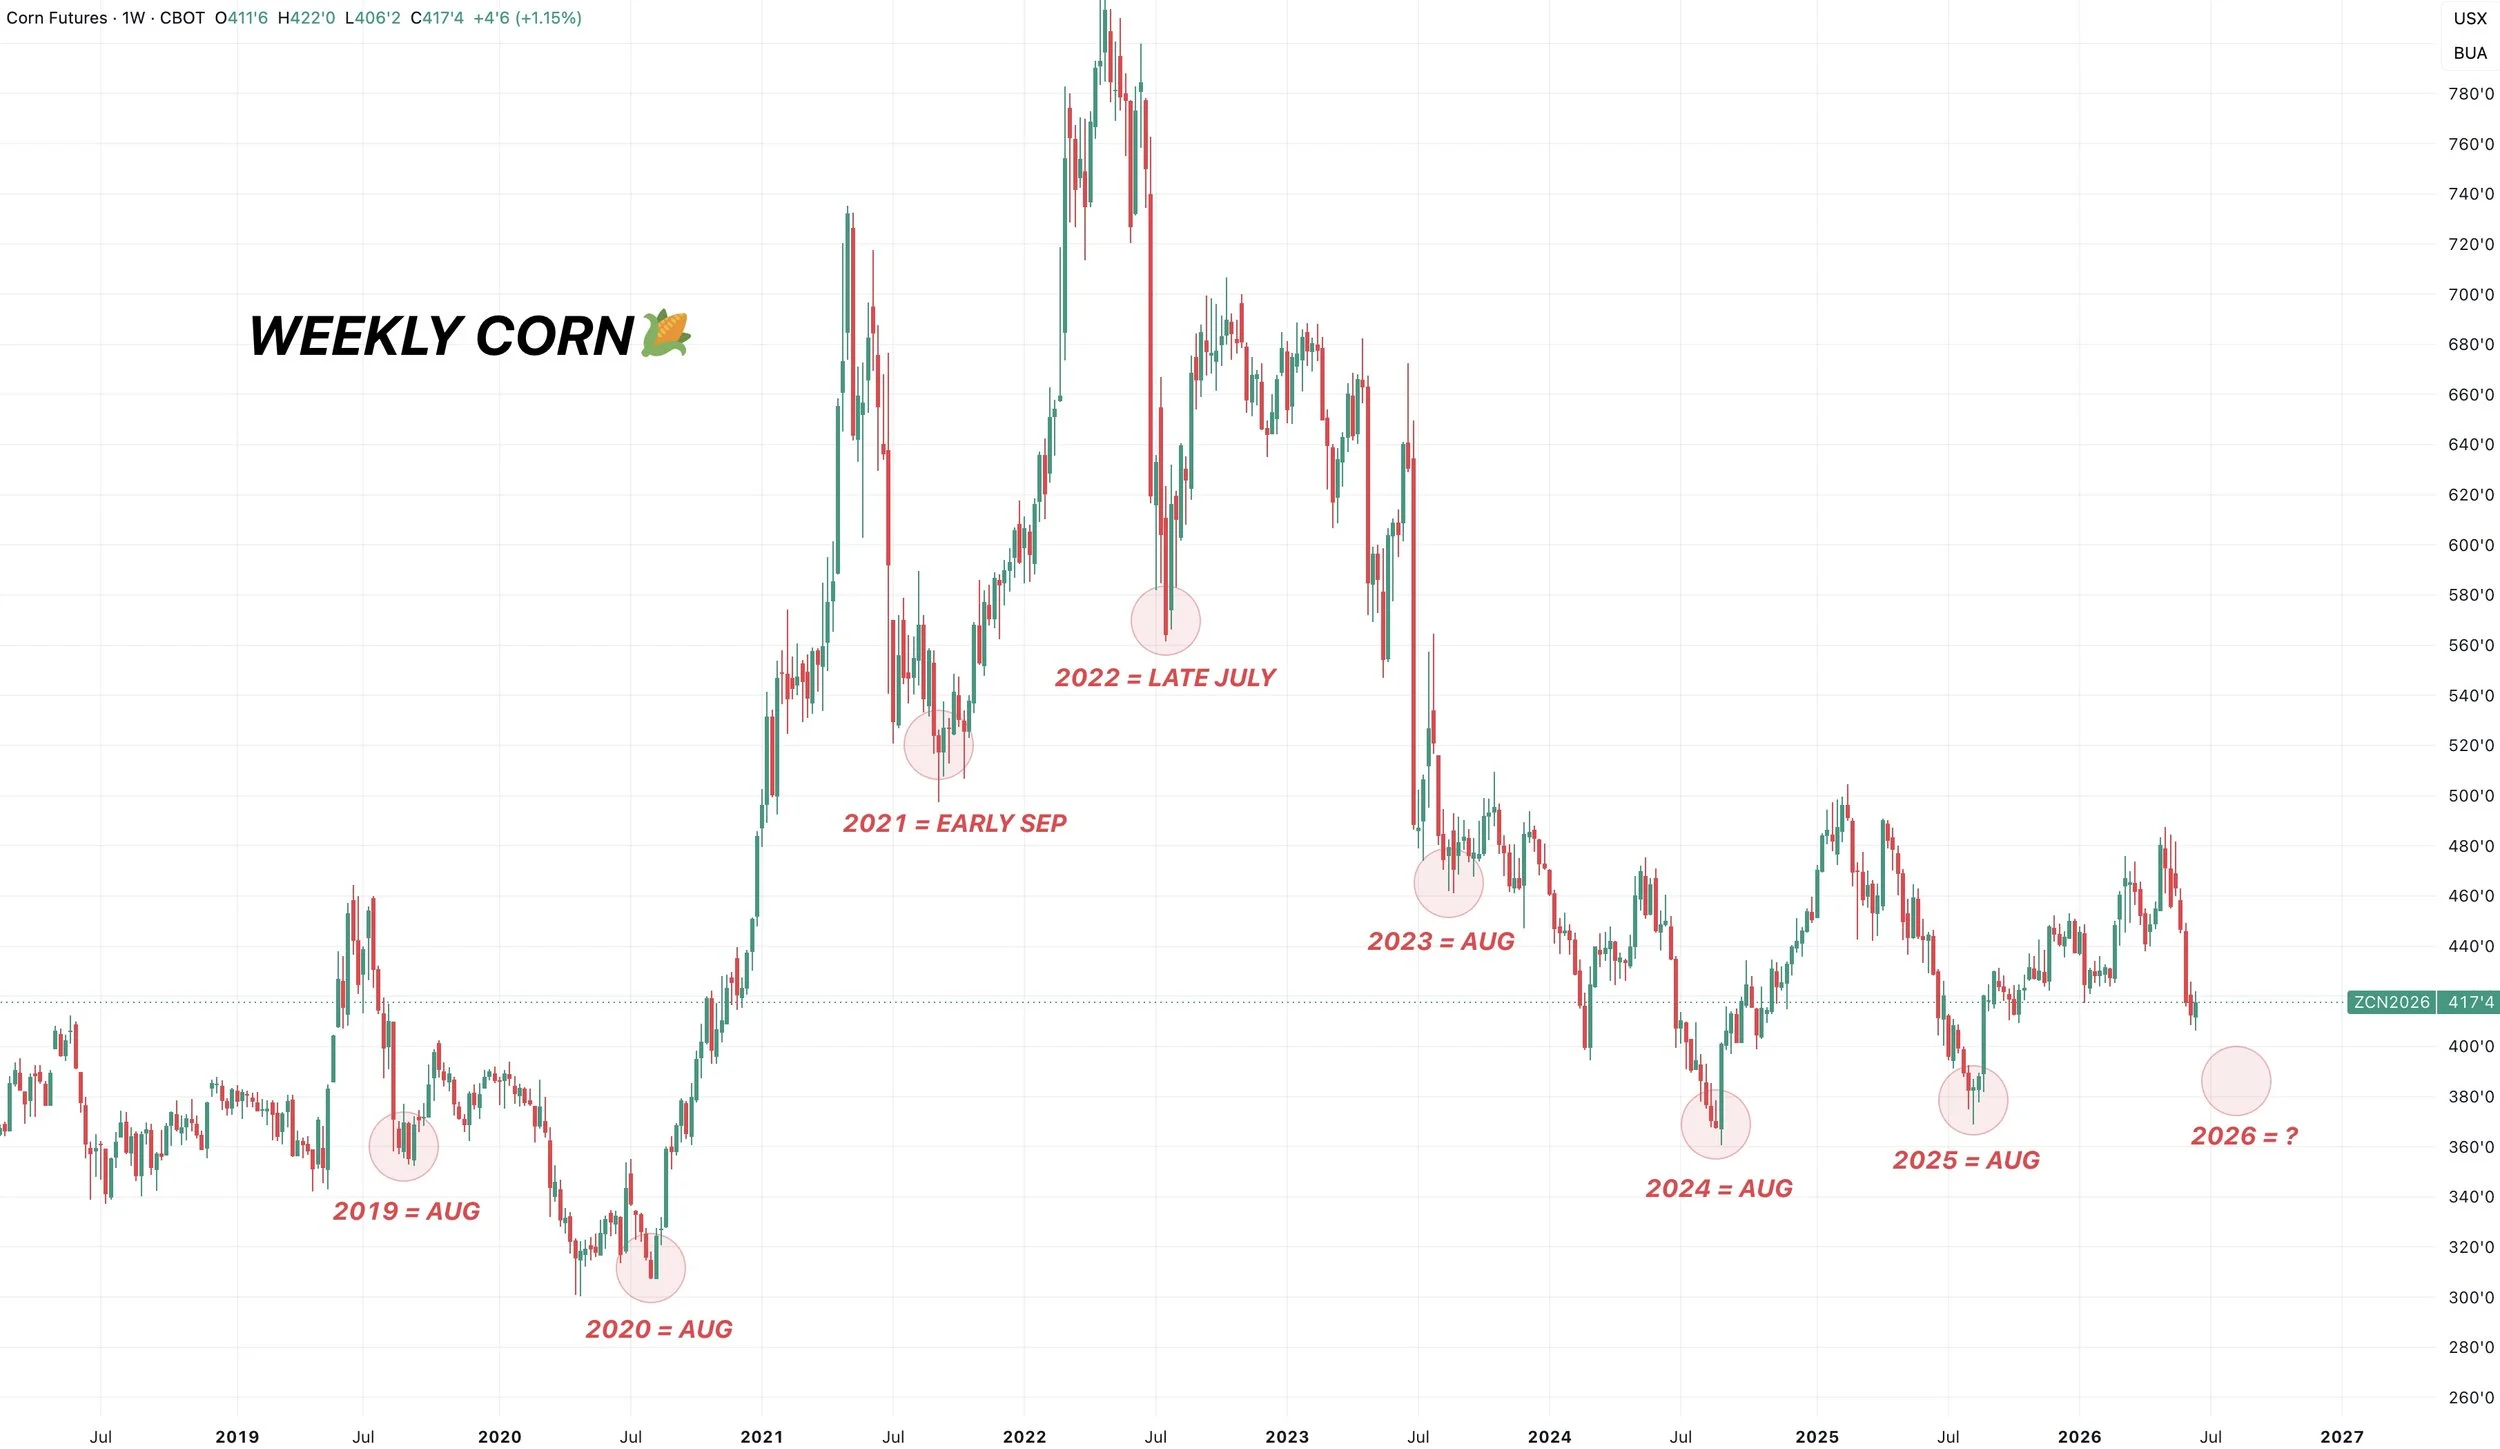
If you draw a simple upward channel connecting the 2020 lows to the 2024 and 2025 lows, the trendline support comes in around that $3.80 to $3.90 range.
Our harvest lows last year were $3.68. I don’t think we get that low this year.
If you notice, we are sitting at our last level of support on this chart. As there is no support beneath this level.
So if we are going to bounce, we'd like to see it happen here.
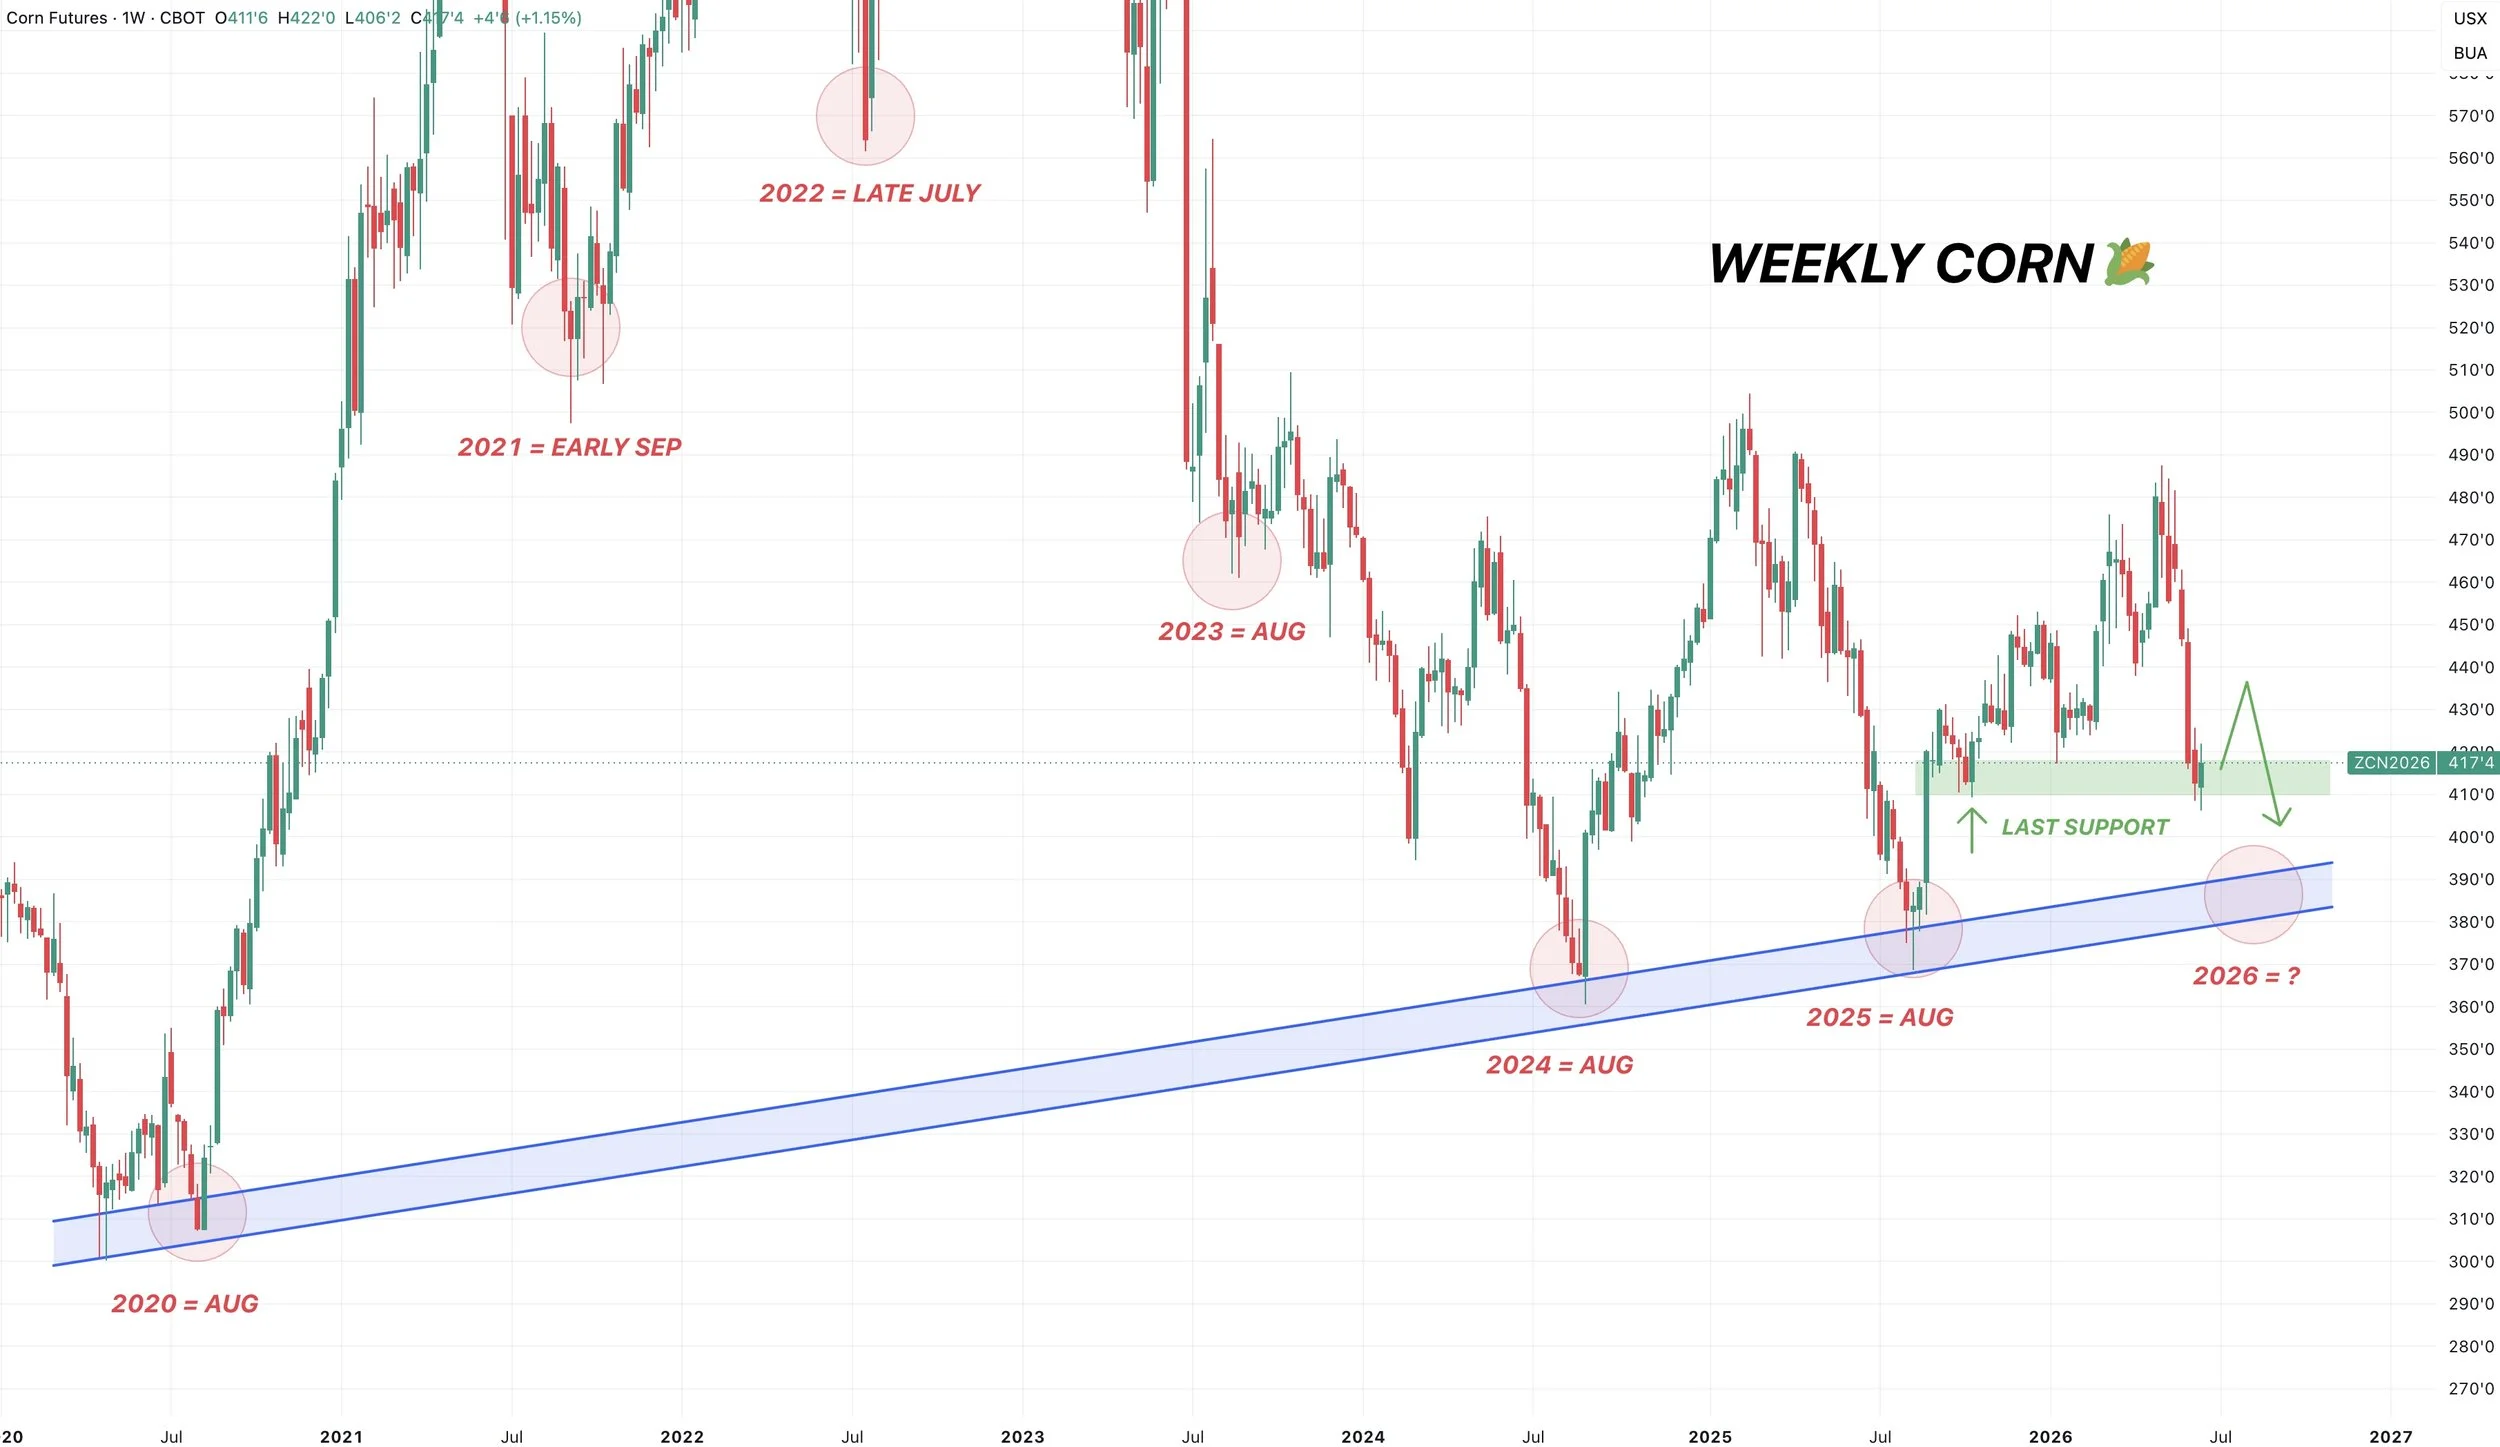
Here is the daily view of the front month chart.
Again, we are sitting at our last level of support. So we'd like to see a bounce here.
We have an unfilled gap from 2025 at $3.94 if we lose this support.
2025's harvest lows were marked after filling the gap from 2024.
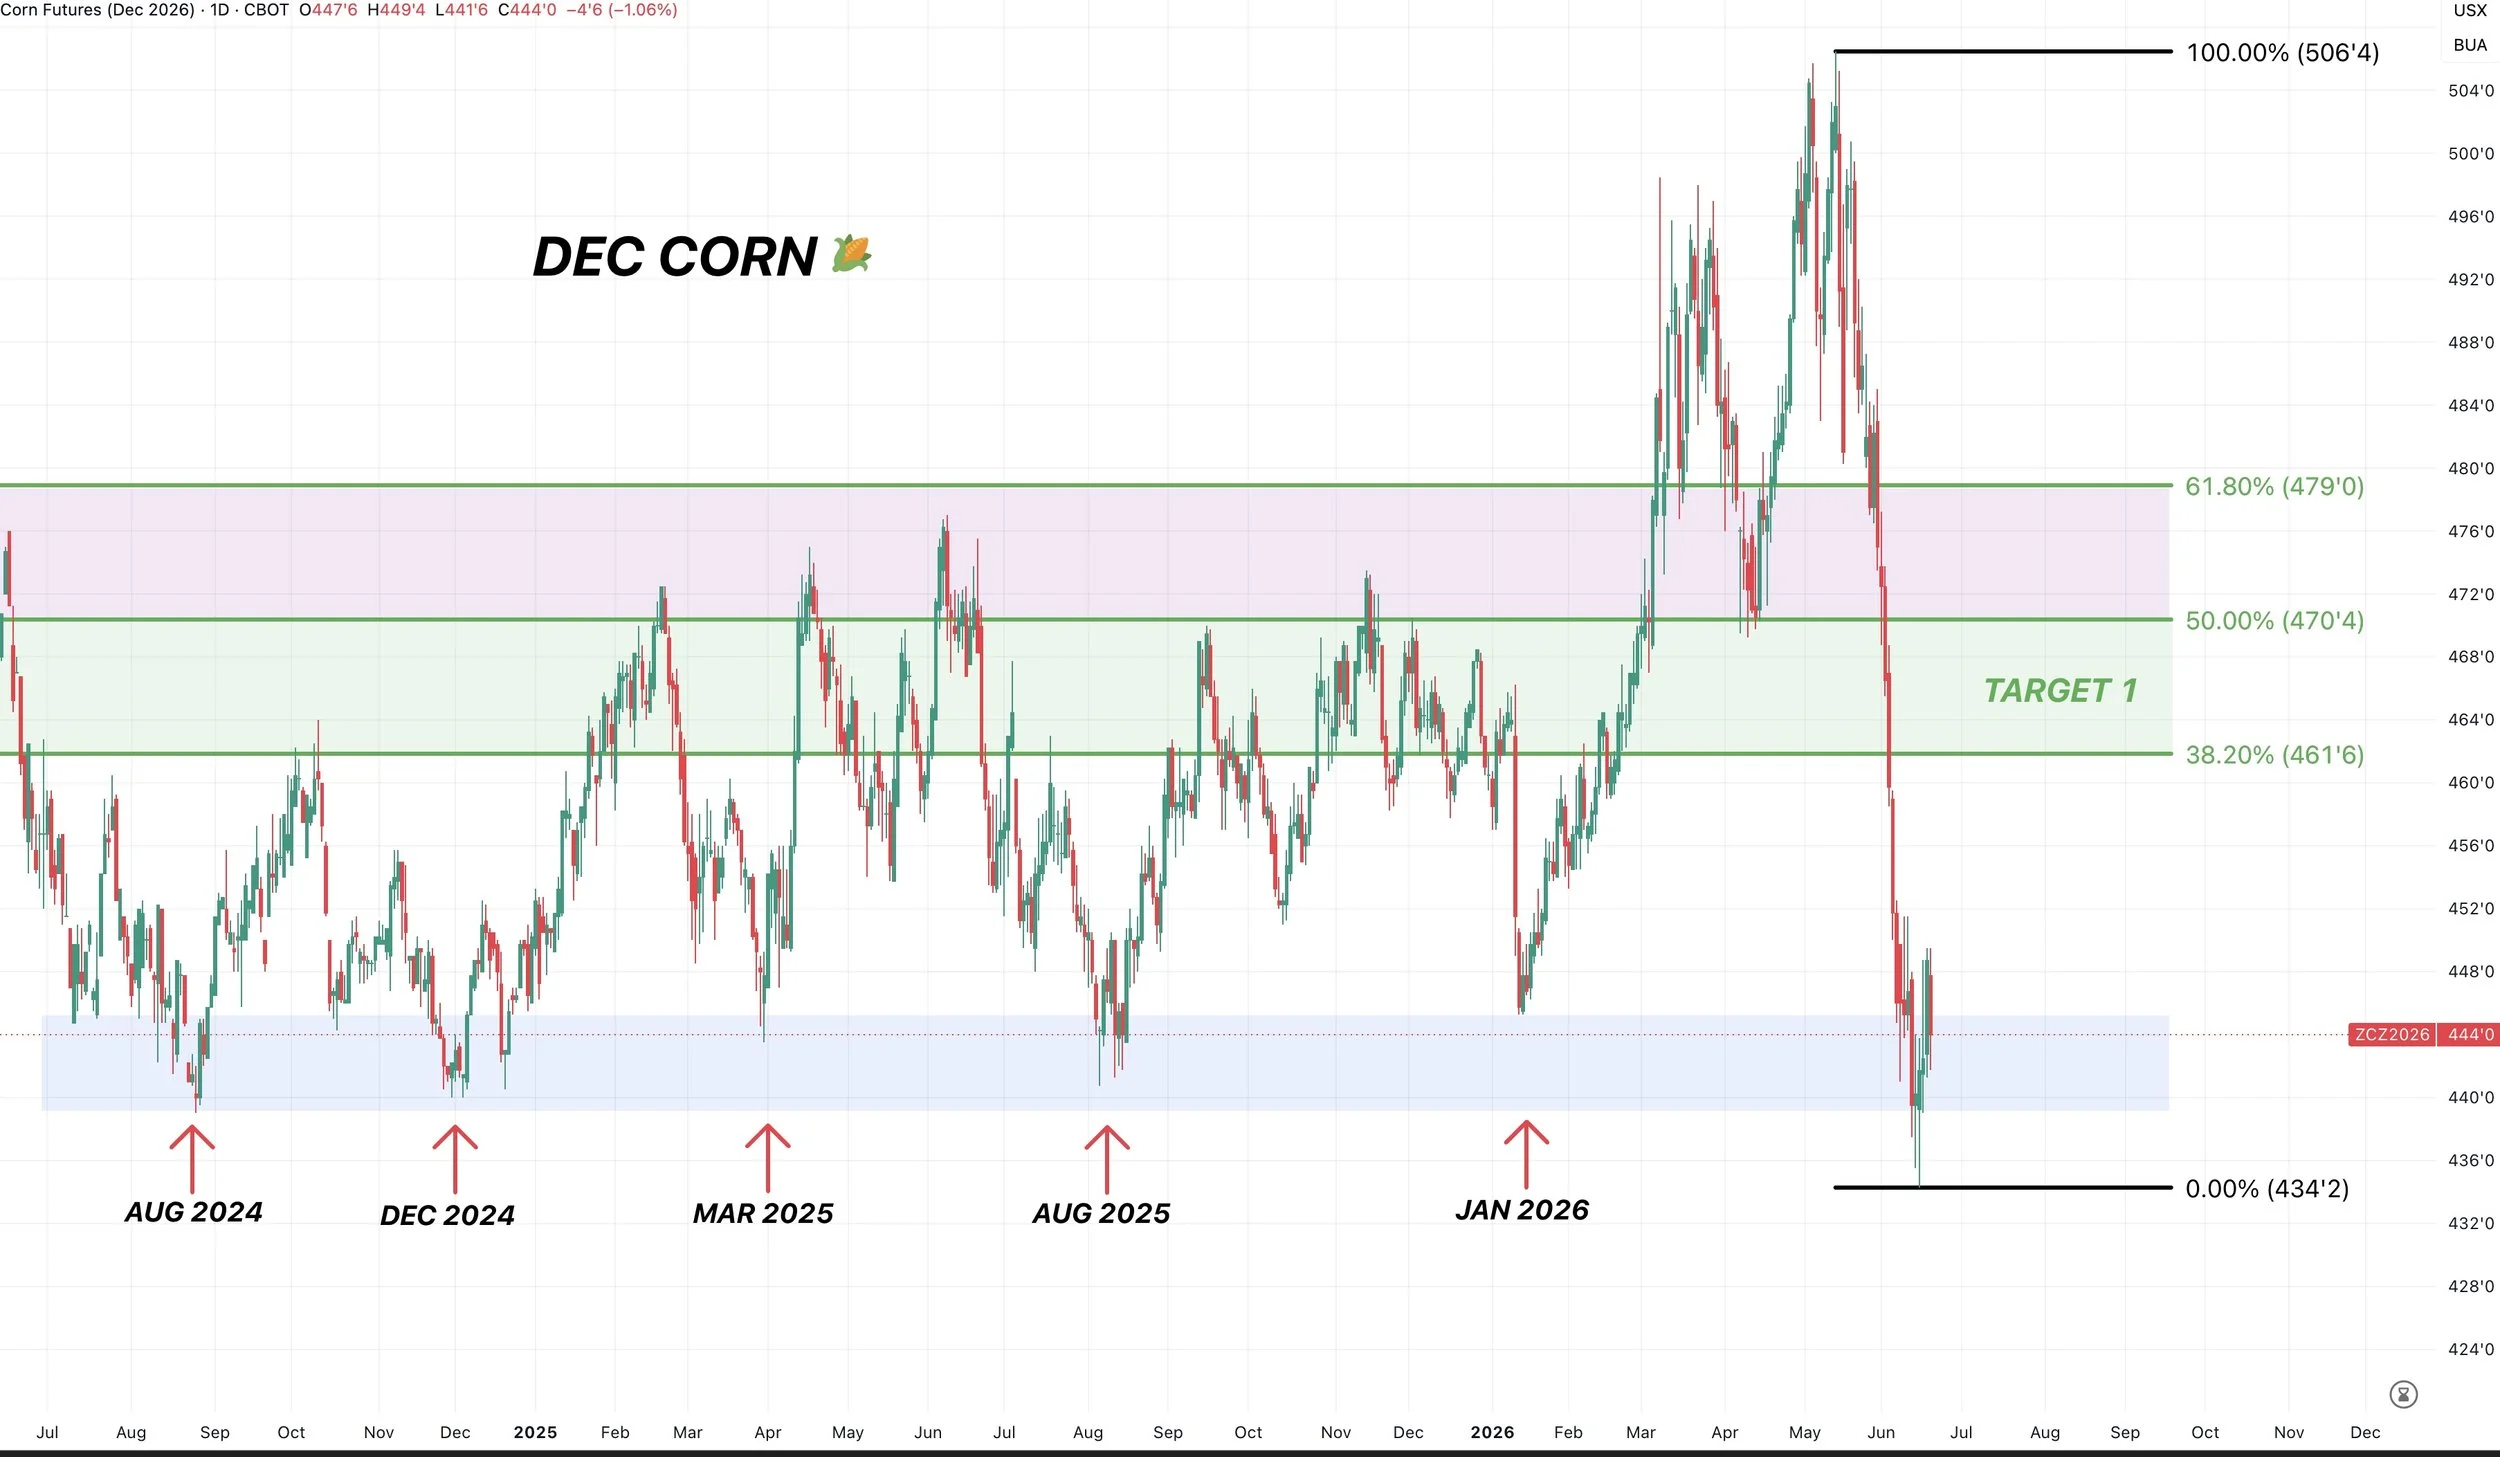
Dec Corn Chart:
We continue to hold where we need to so far.
We posted new contract lows, but did not ever close below the previous contract lows.
We've held this support for 2 years.
If we're going to bounce, you'd like to see it happen here.
If we can crawl into the $4.60 to $4.70 range that would be an area we'd want to defend and hedge.
That crawls back 38.2% to 50% of the sell off. It's prior support and resistance.
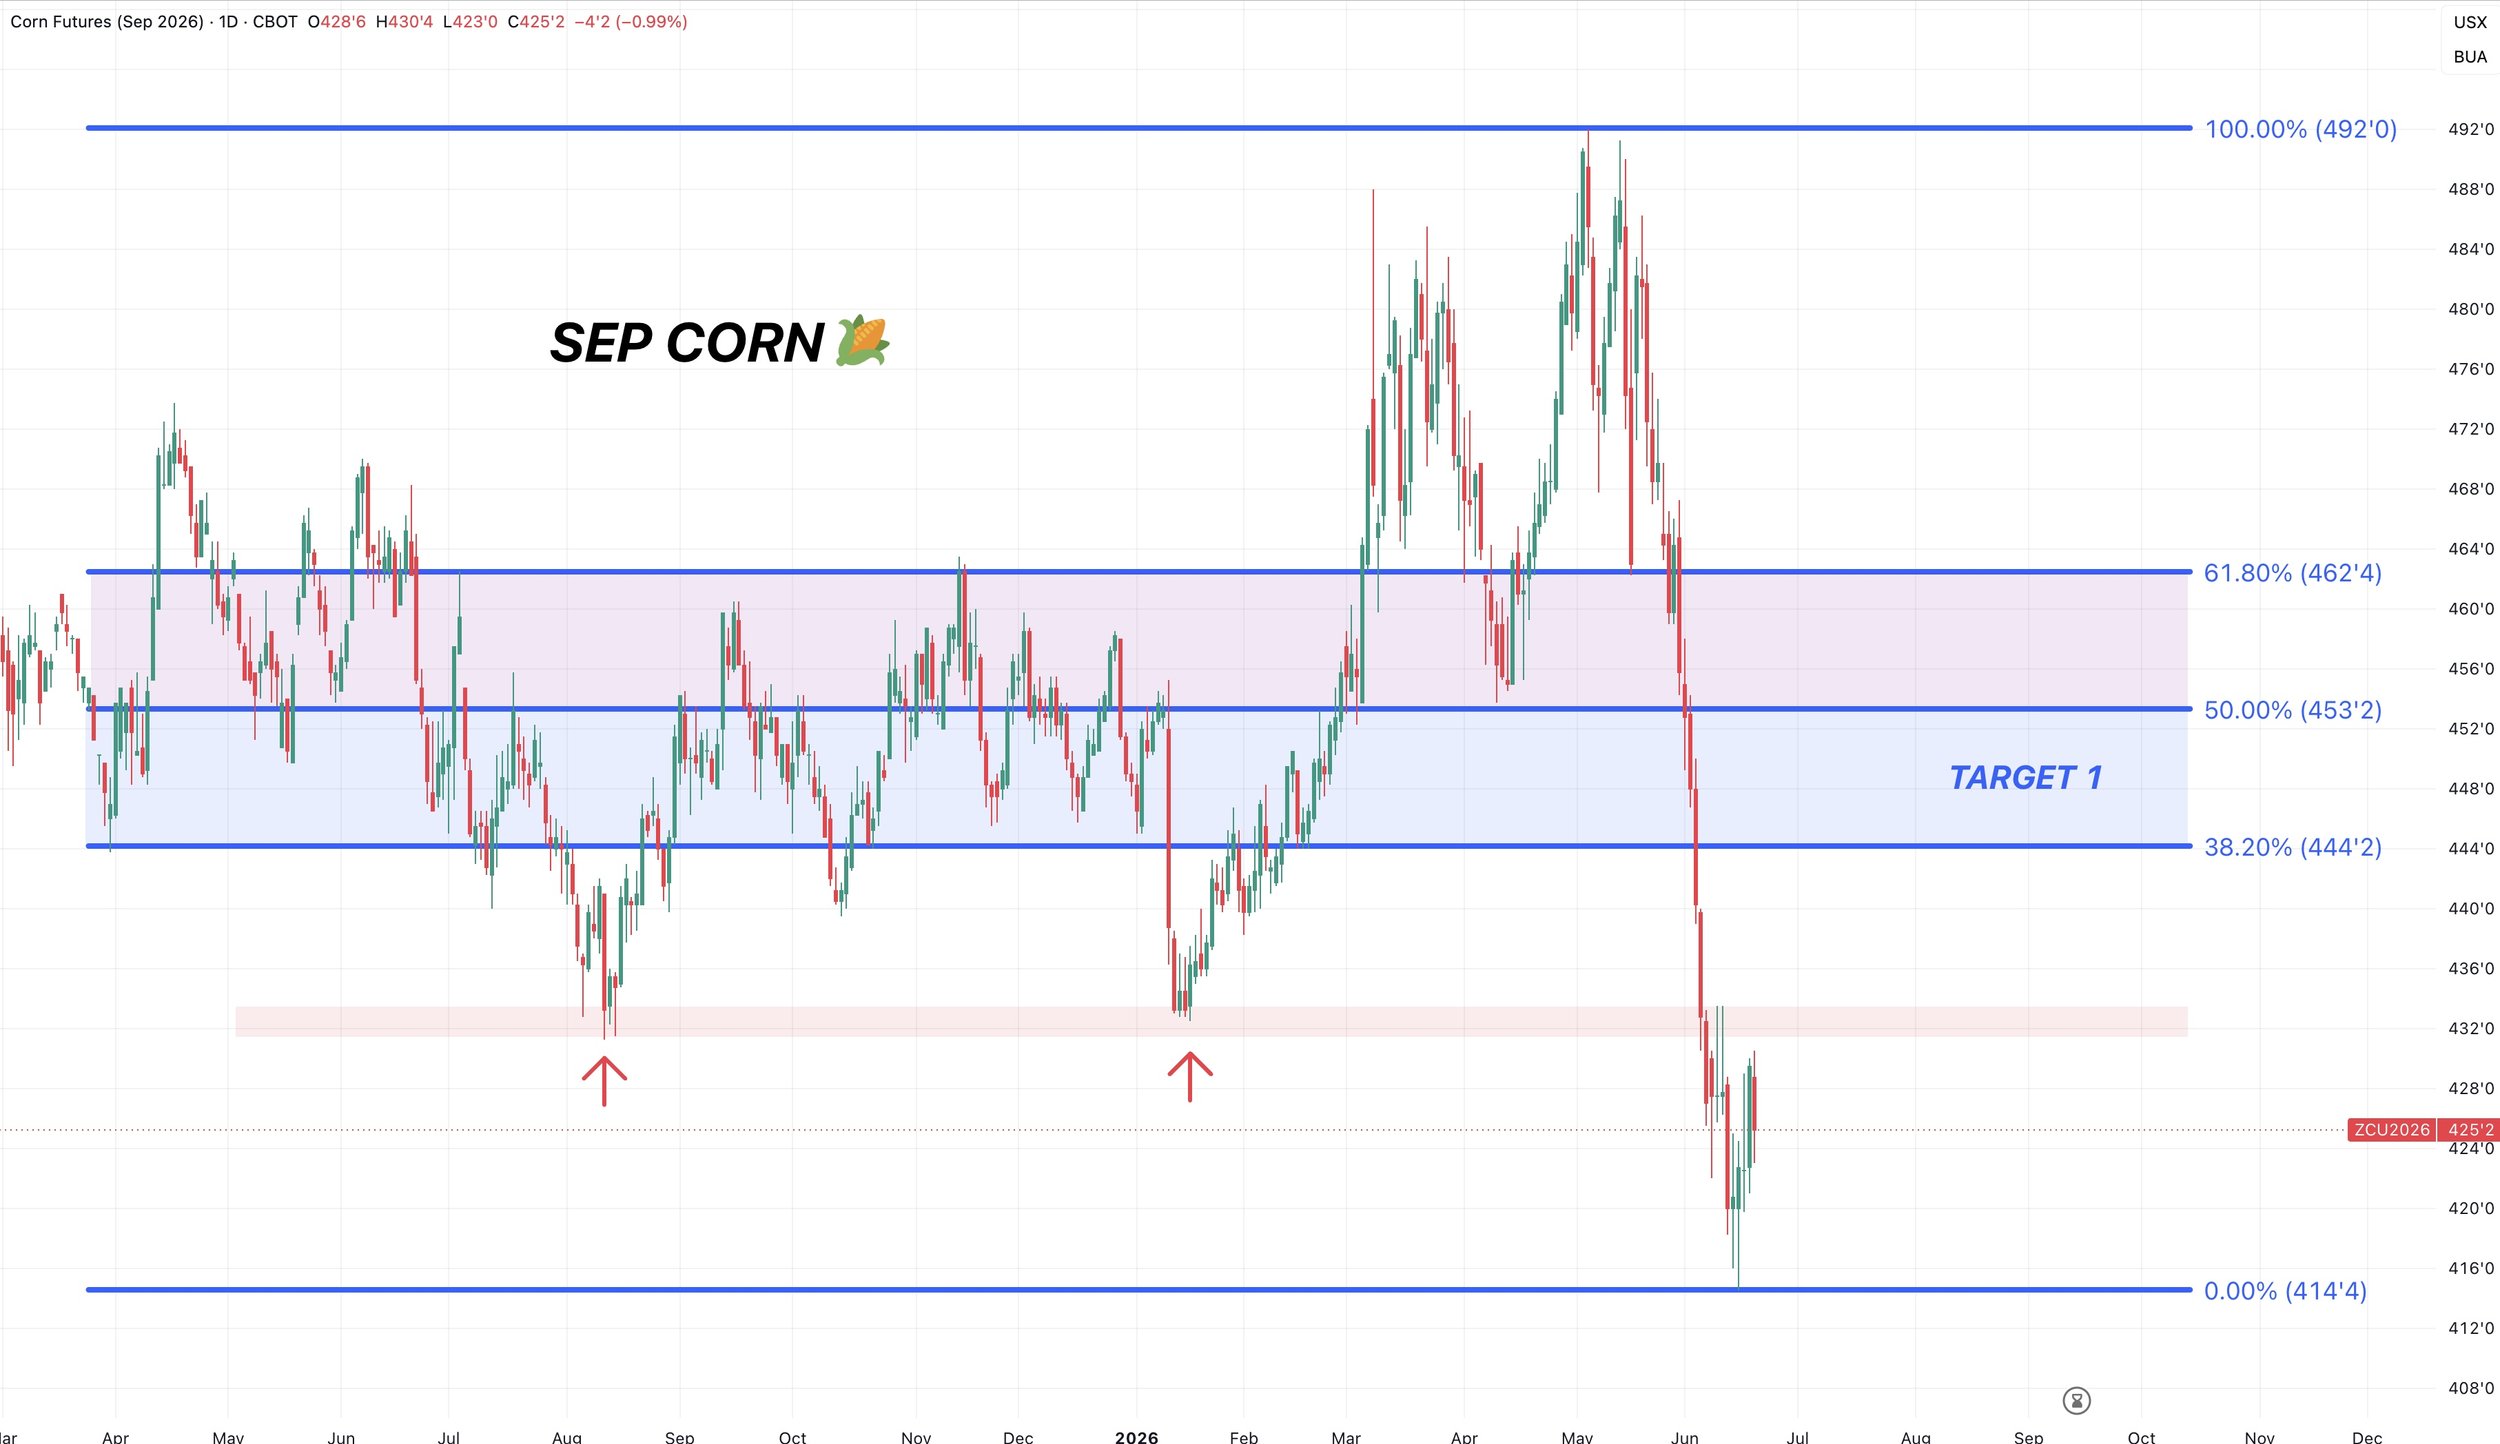
Sep Corn Chart:
We have some resistance at $4.33
If we can break above that, I think we could push towards $4.44 to $4.53
That would be the area I'd look to reward if it comes.
That's 38.2% to 50% of the sell off. It's old support.
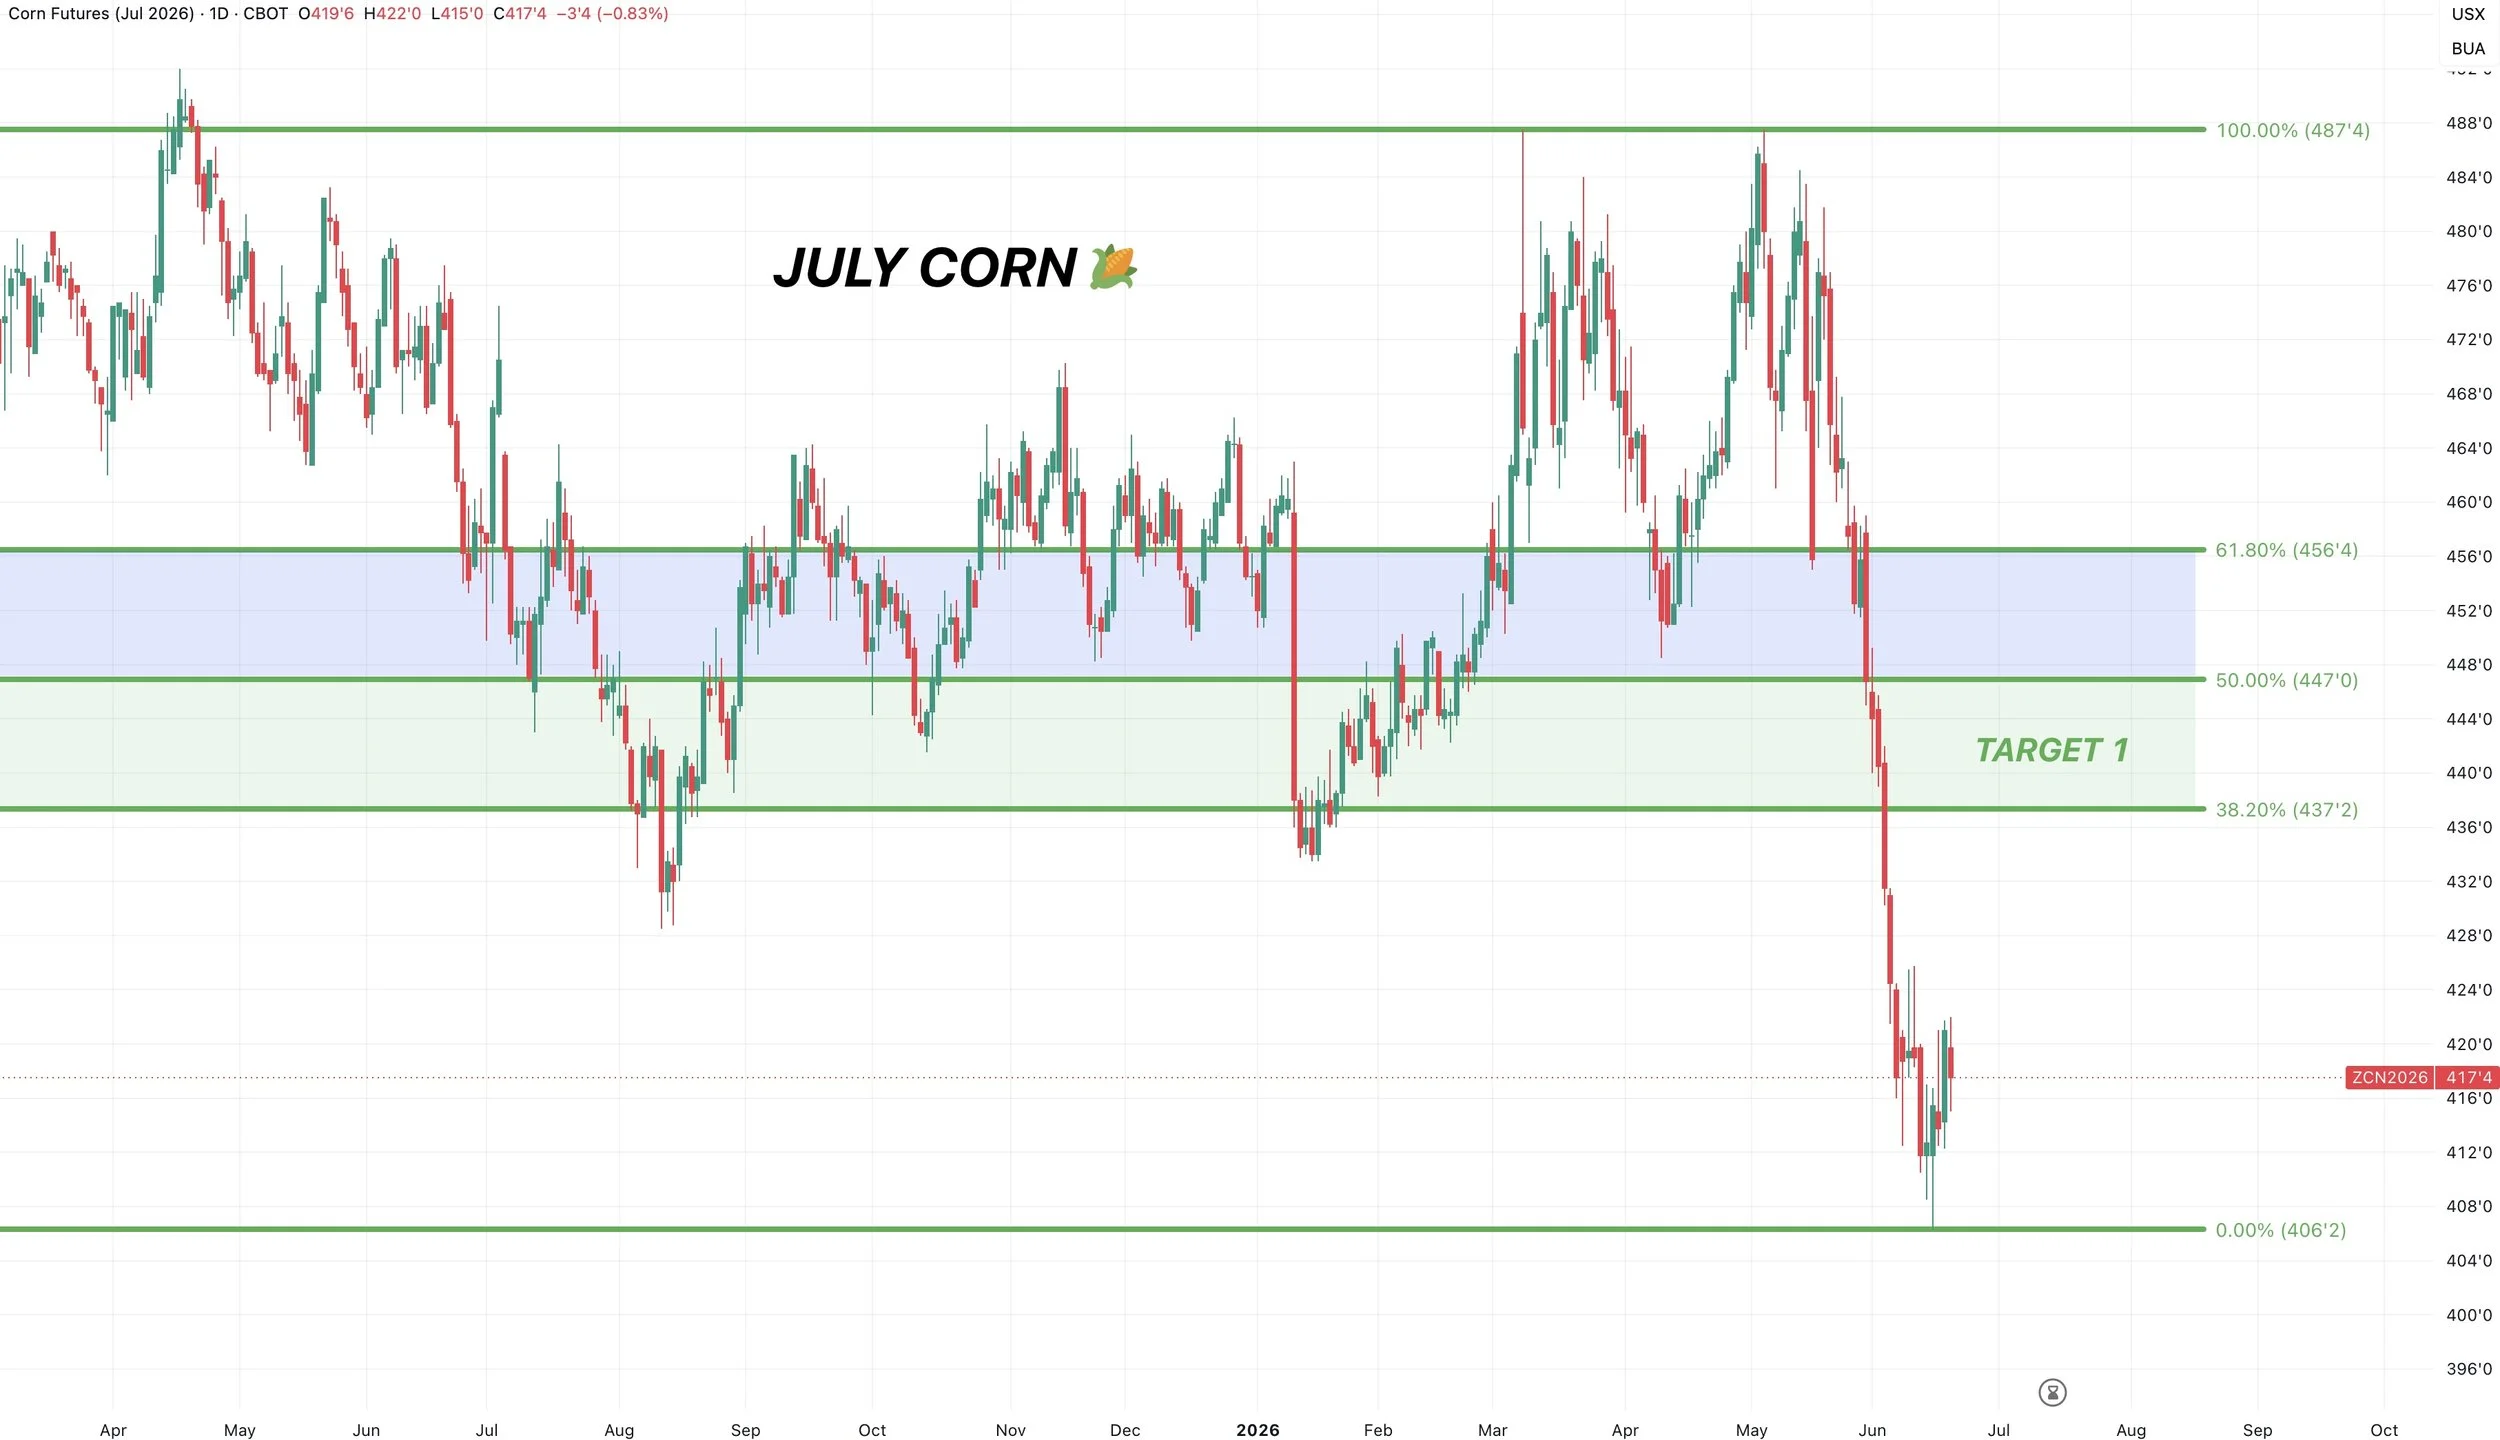
July Corn Chart:
The obvious spot we want to hold is the recent lows, or we simply open up further downside.
Running out of time on this chart.
However, if we can bounce into the $4.37 to $4.47 range that's an area to look to reward.
That's 38.2% to 50% of the sell off. It's prior support.
If we look at some of the indicators:
The RSI was just in extreme oversold territory. It's still oversold.
The MACD is on the verge of flipping bullish for the first time since April 22nd.
The stochastics are dead, but trying to carve out some lows.
Do we have to continue the bounce? No.
But a bounce still makes sense on the charts. As there are signs of a possible local bottom.

Soybeans
We finally saw China step in, even though it wasn’t a massive confirmed amount.
There are plenty of people who are skeptical of the whole China deal, and don’t think they will live up to their deal to buy 25 MMT of new crop beans.
I don’t personally see why they wouldn’t.
For starters, buying some soybeans is really just a drop in a bucket for them in the grand scheme of things.
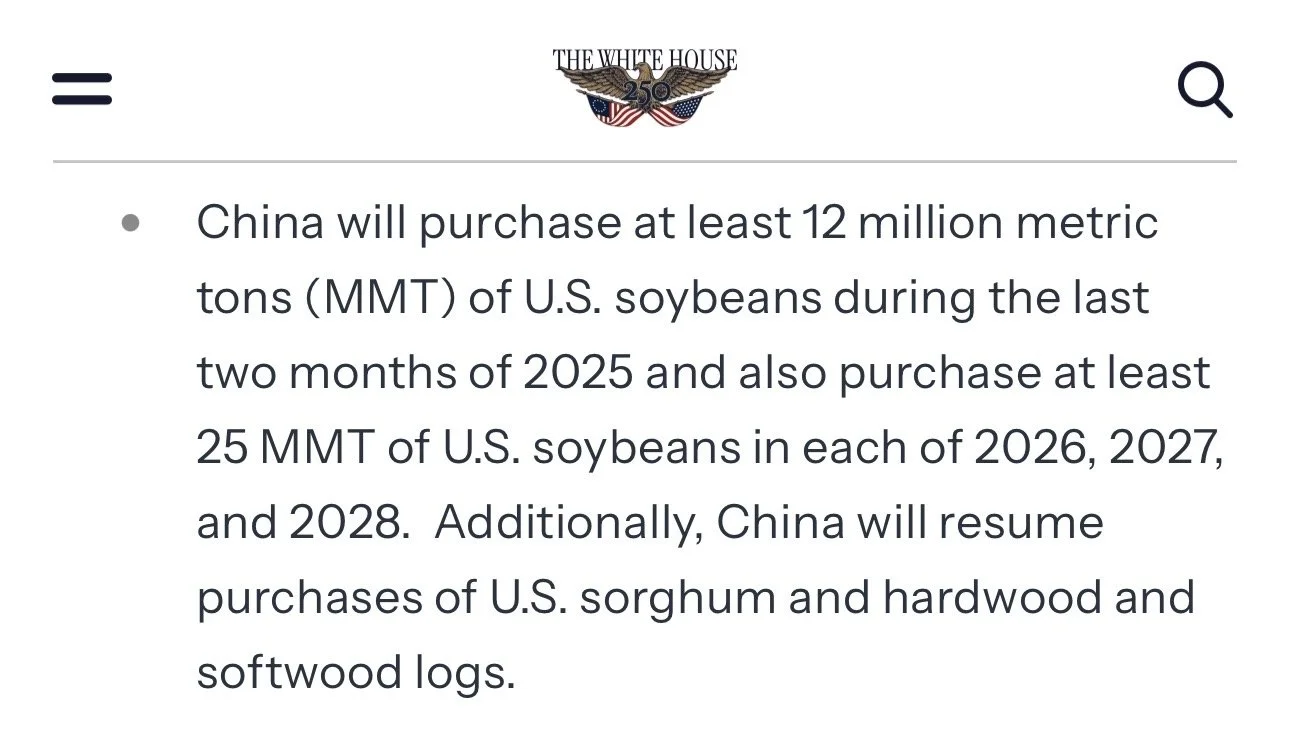
The original 12 MMT of old crop China agreed to buy was put in the White House fact sheet. They lived up to their word and bought that amount.
That extra 8 MMT of old crop that Trump said they would buy, was never included in the fact sheet. And it didn’t happen.
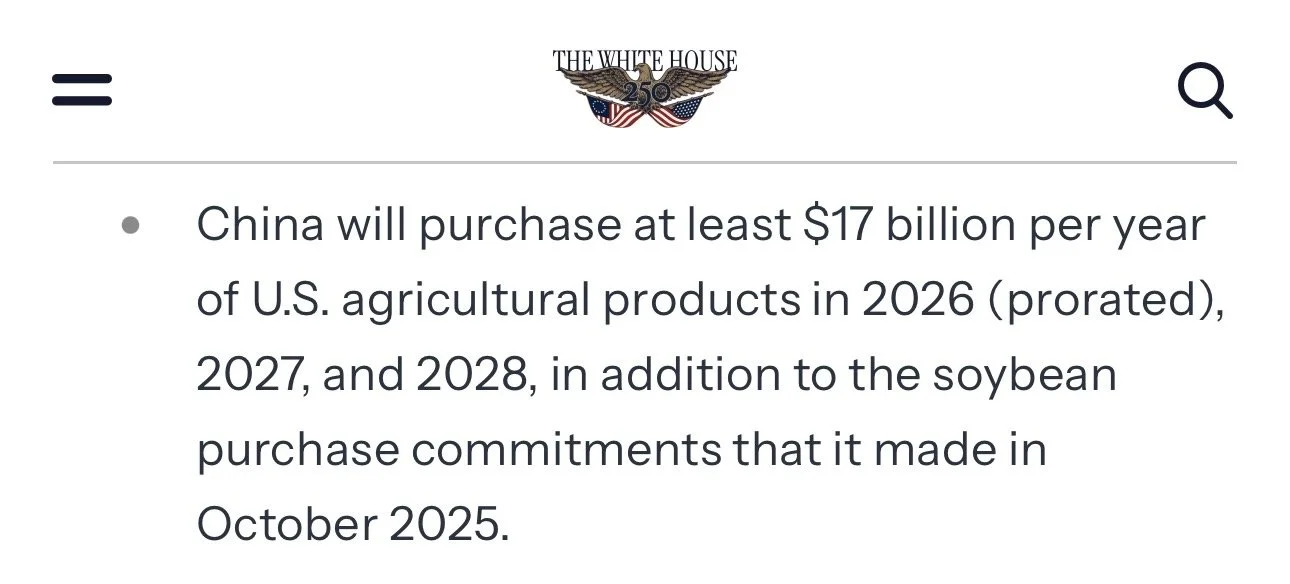
Now this 25 MMT of soybeans of new crop they agreed to buy is also in the fact sheet, along with the $17 billion of non-soybean ag purchases.
So I think they live up to the deal just like they did with last year's deal.
White House Fact Sheet Nov 2025
White House Fact Sheet May 2026
The funds are still long the entire soy complex despite puking out of their longs in the rest of the grains.
Still holding large longs in soybeans, meal, and bean oil despite the recent selling.
Seasonally, this is the time of year where they lighten up those positions.

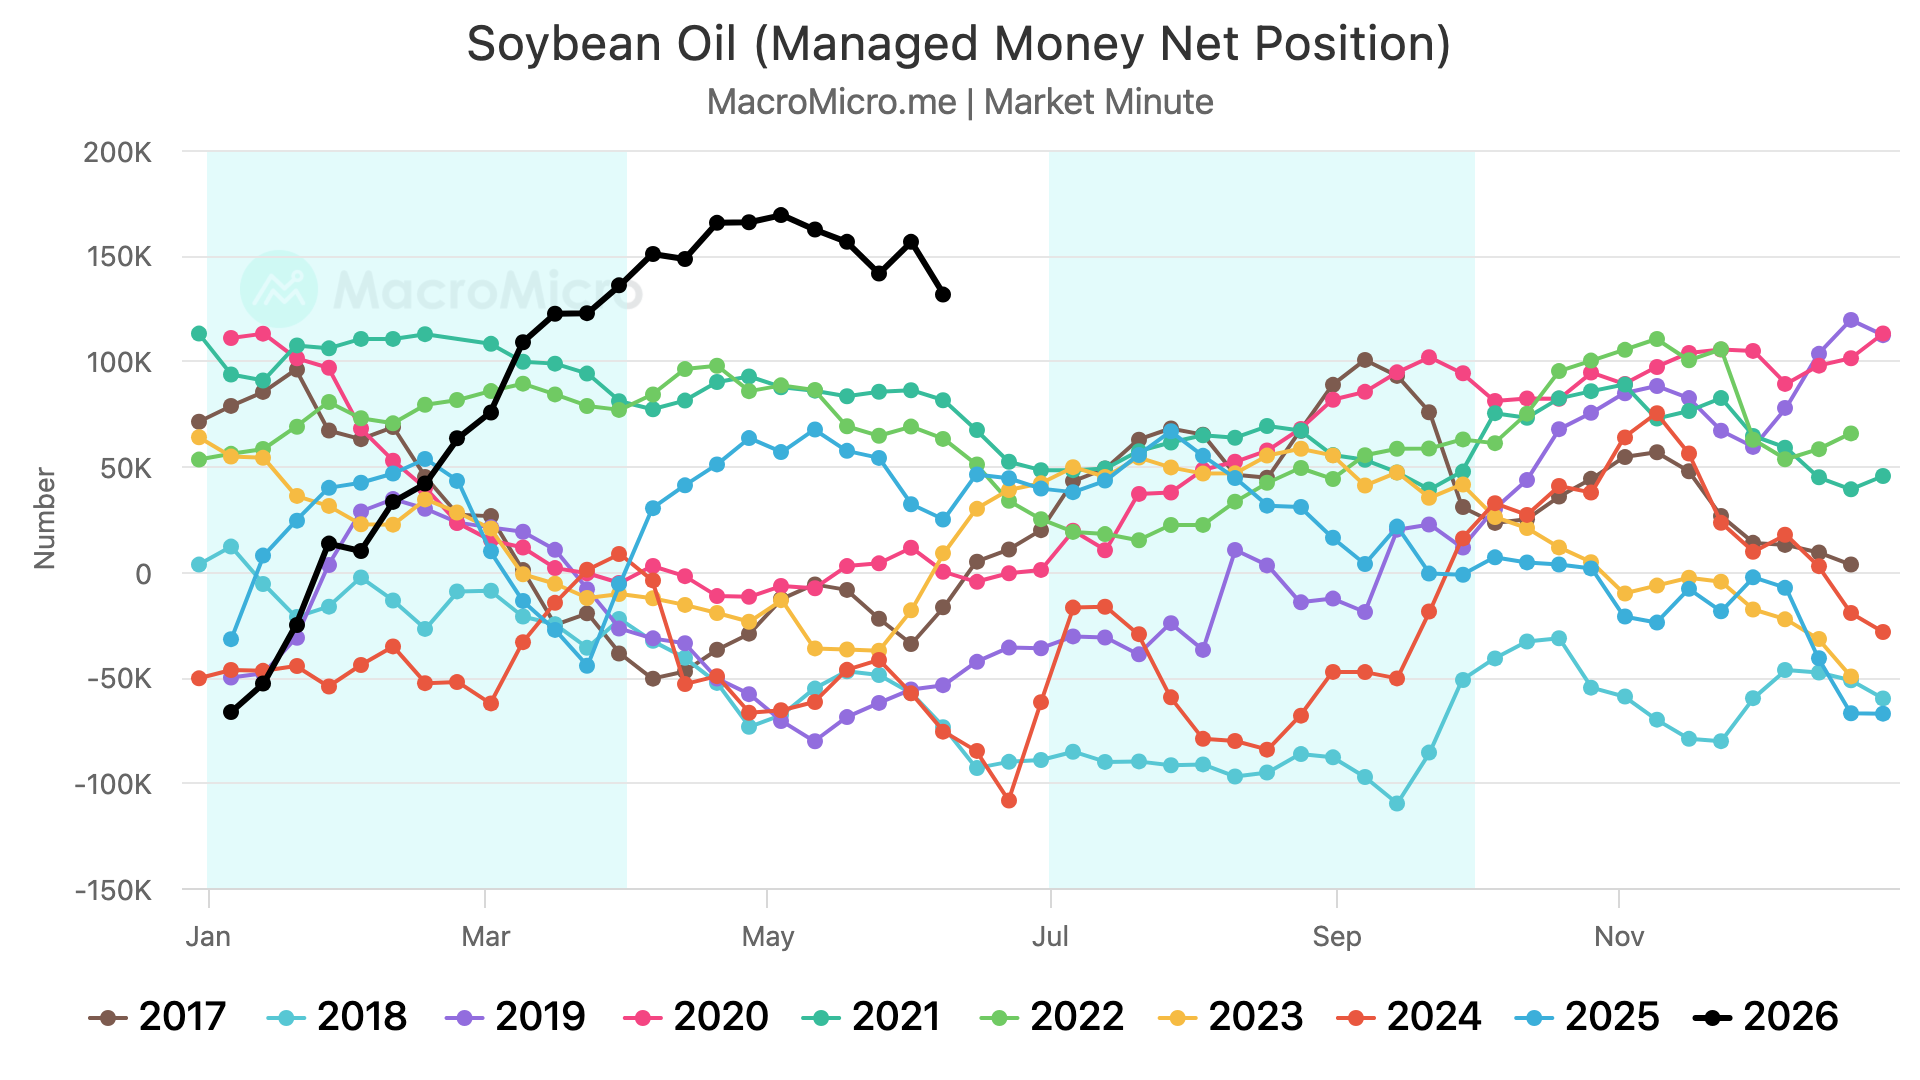

Bean oil has been the bright spot in the soybean complex up until recently.
We've seen a sizeable sell off with the collapse in crude oil.
However, we are now sitting at some level of support.
Bean oil is the reason the funds are still long soybeans.
So if bean oil breaks this support and starts to roll over, the funds probably puke out of their soybean position. Which is a risk.
But until that happens, the funds like being long the soybean complex.
It's the one and only grain they're long.

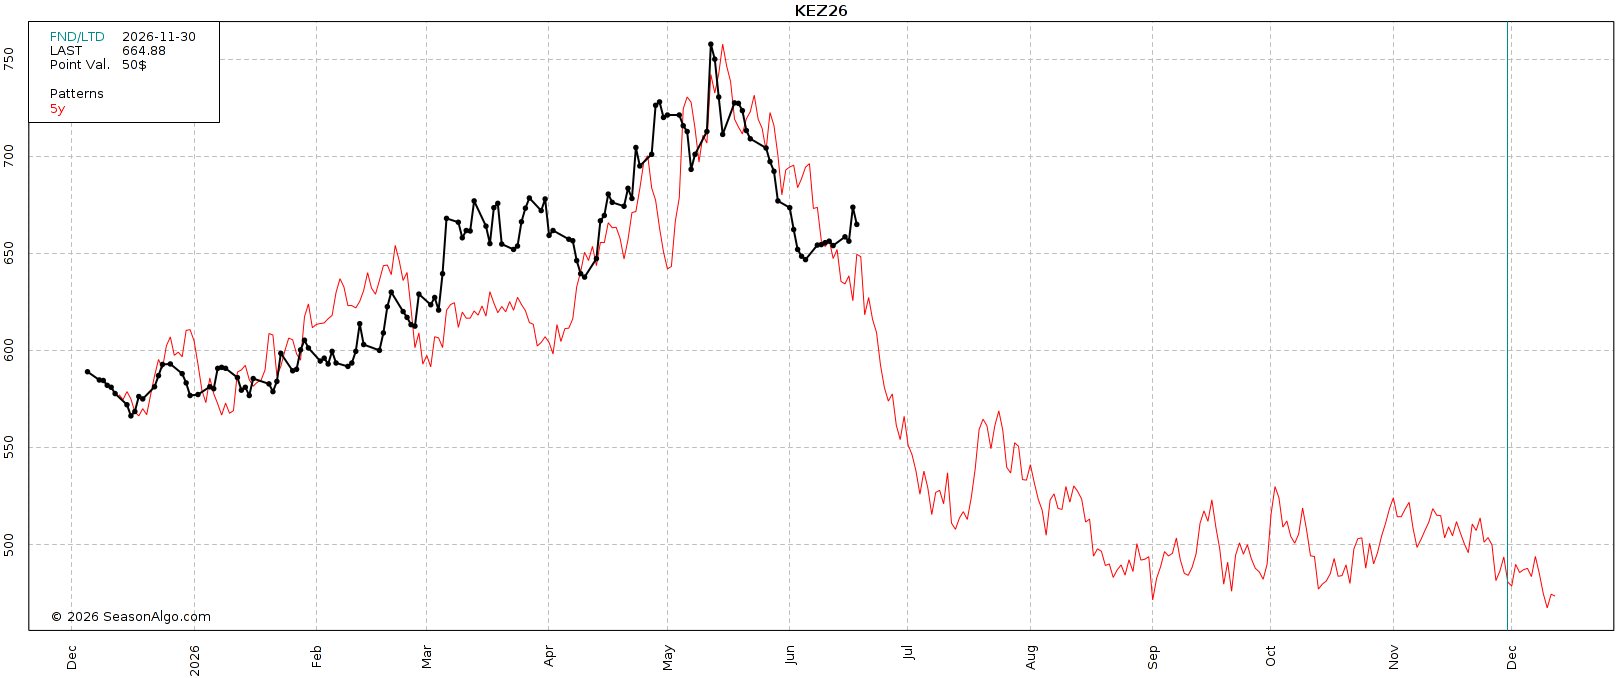
Seasonals still aren’t on our side.
From today by August 15th, we've been lower the last 11 of 13 years.
So like in corn, this doesn’t mean we can’t bounce or get some sort of rally before hand. It simply suggests lower by August. Which means we want to look to reward a rally if it comes.

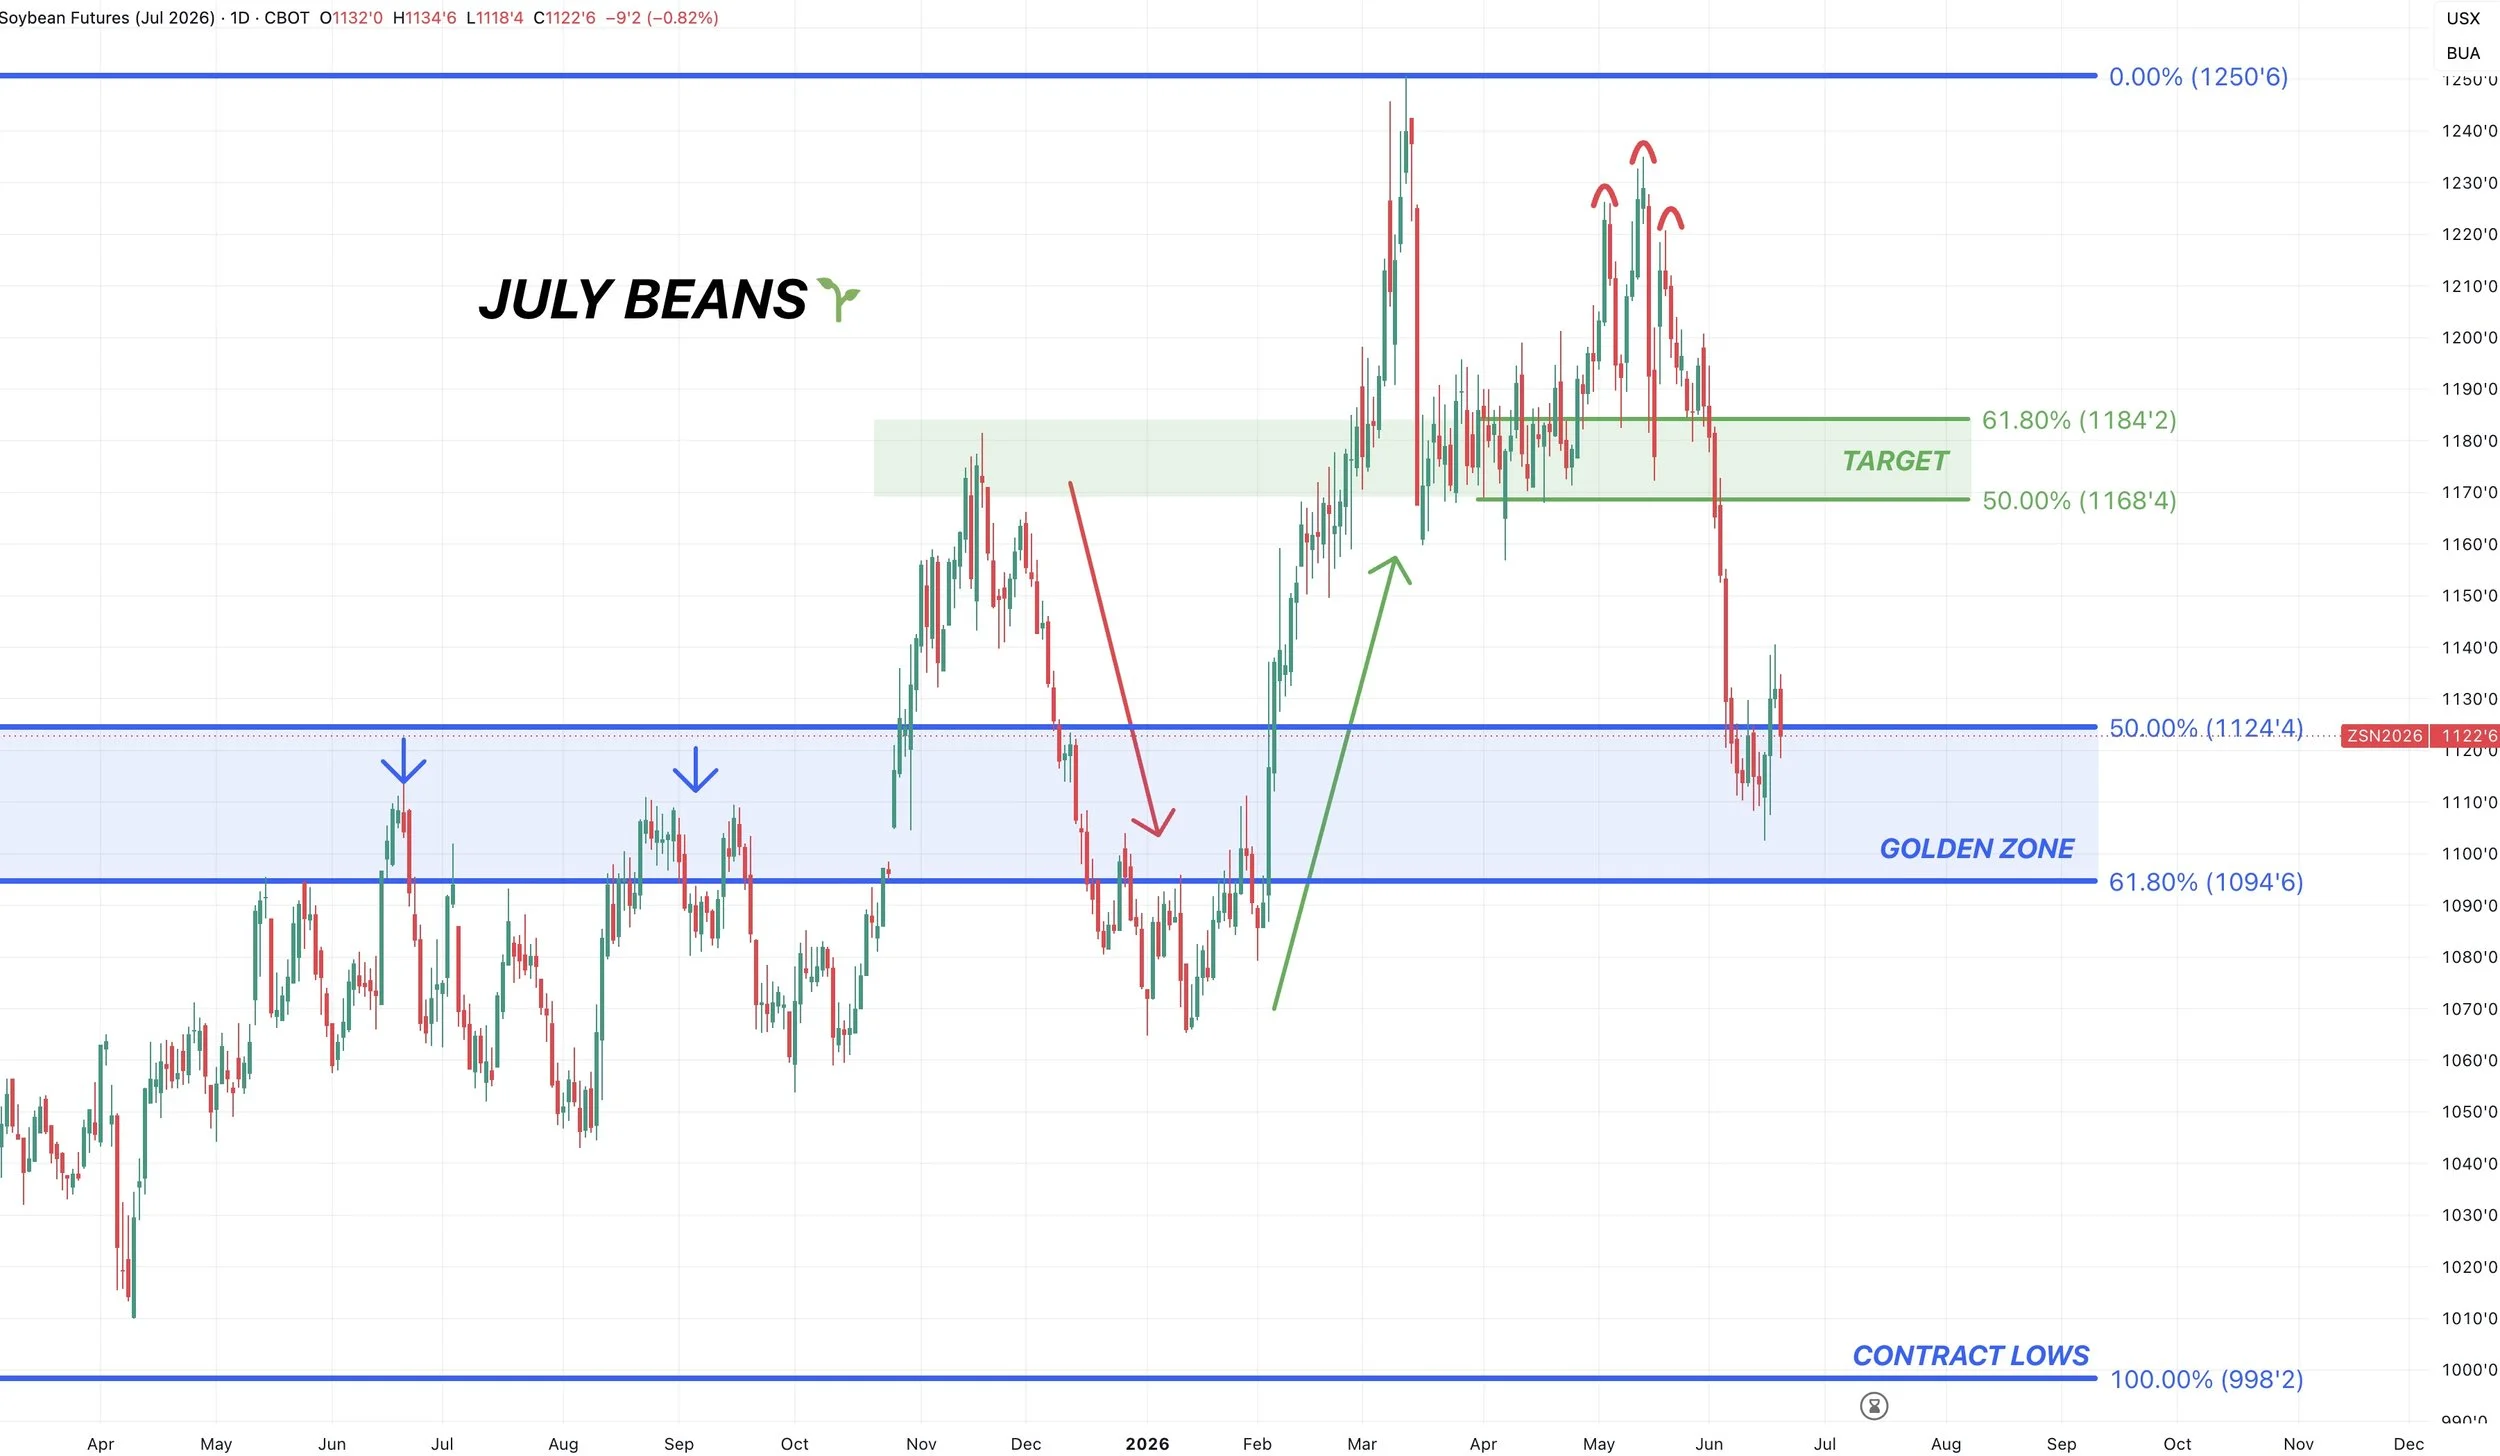
July Beans Chart:
Finding life where we need to. Inside the golden zone from the highs to the contract lows.
We're running out of time on this chart, but if we get a relief bounce towards $11.68 to $11.84 that's the area we want to defend.
That claws back 50% to 61.8% of the sell off. It's also the old range we were trapped in for weeks. Along with the highs from last November.
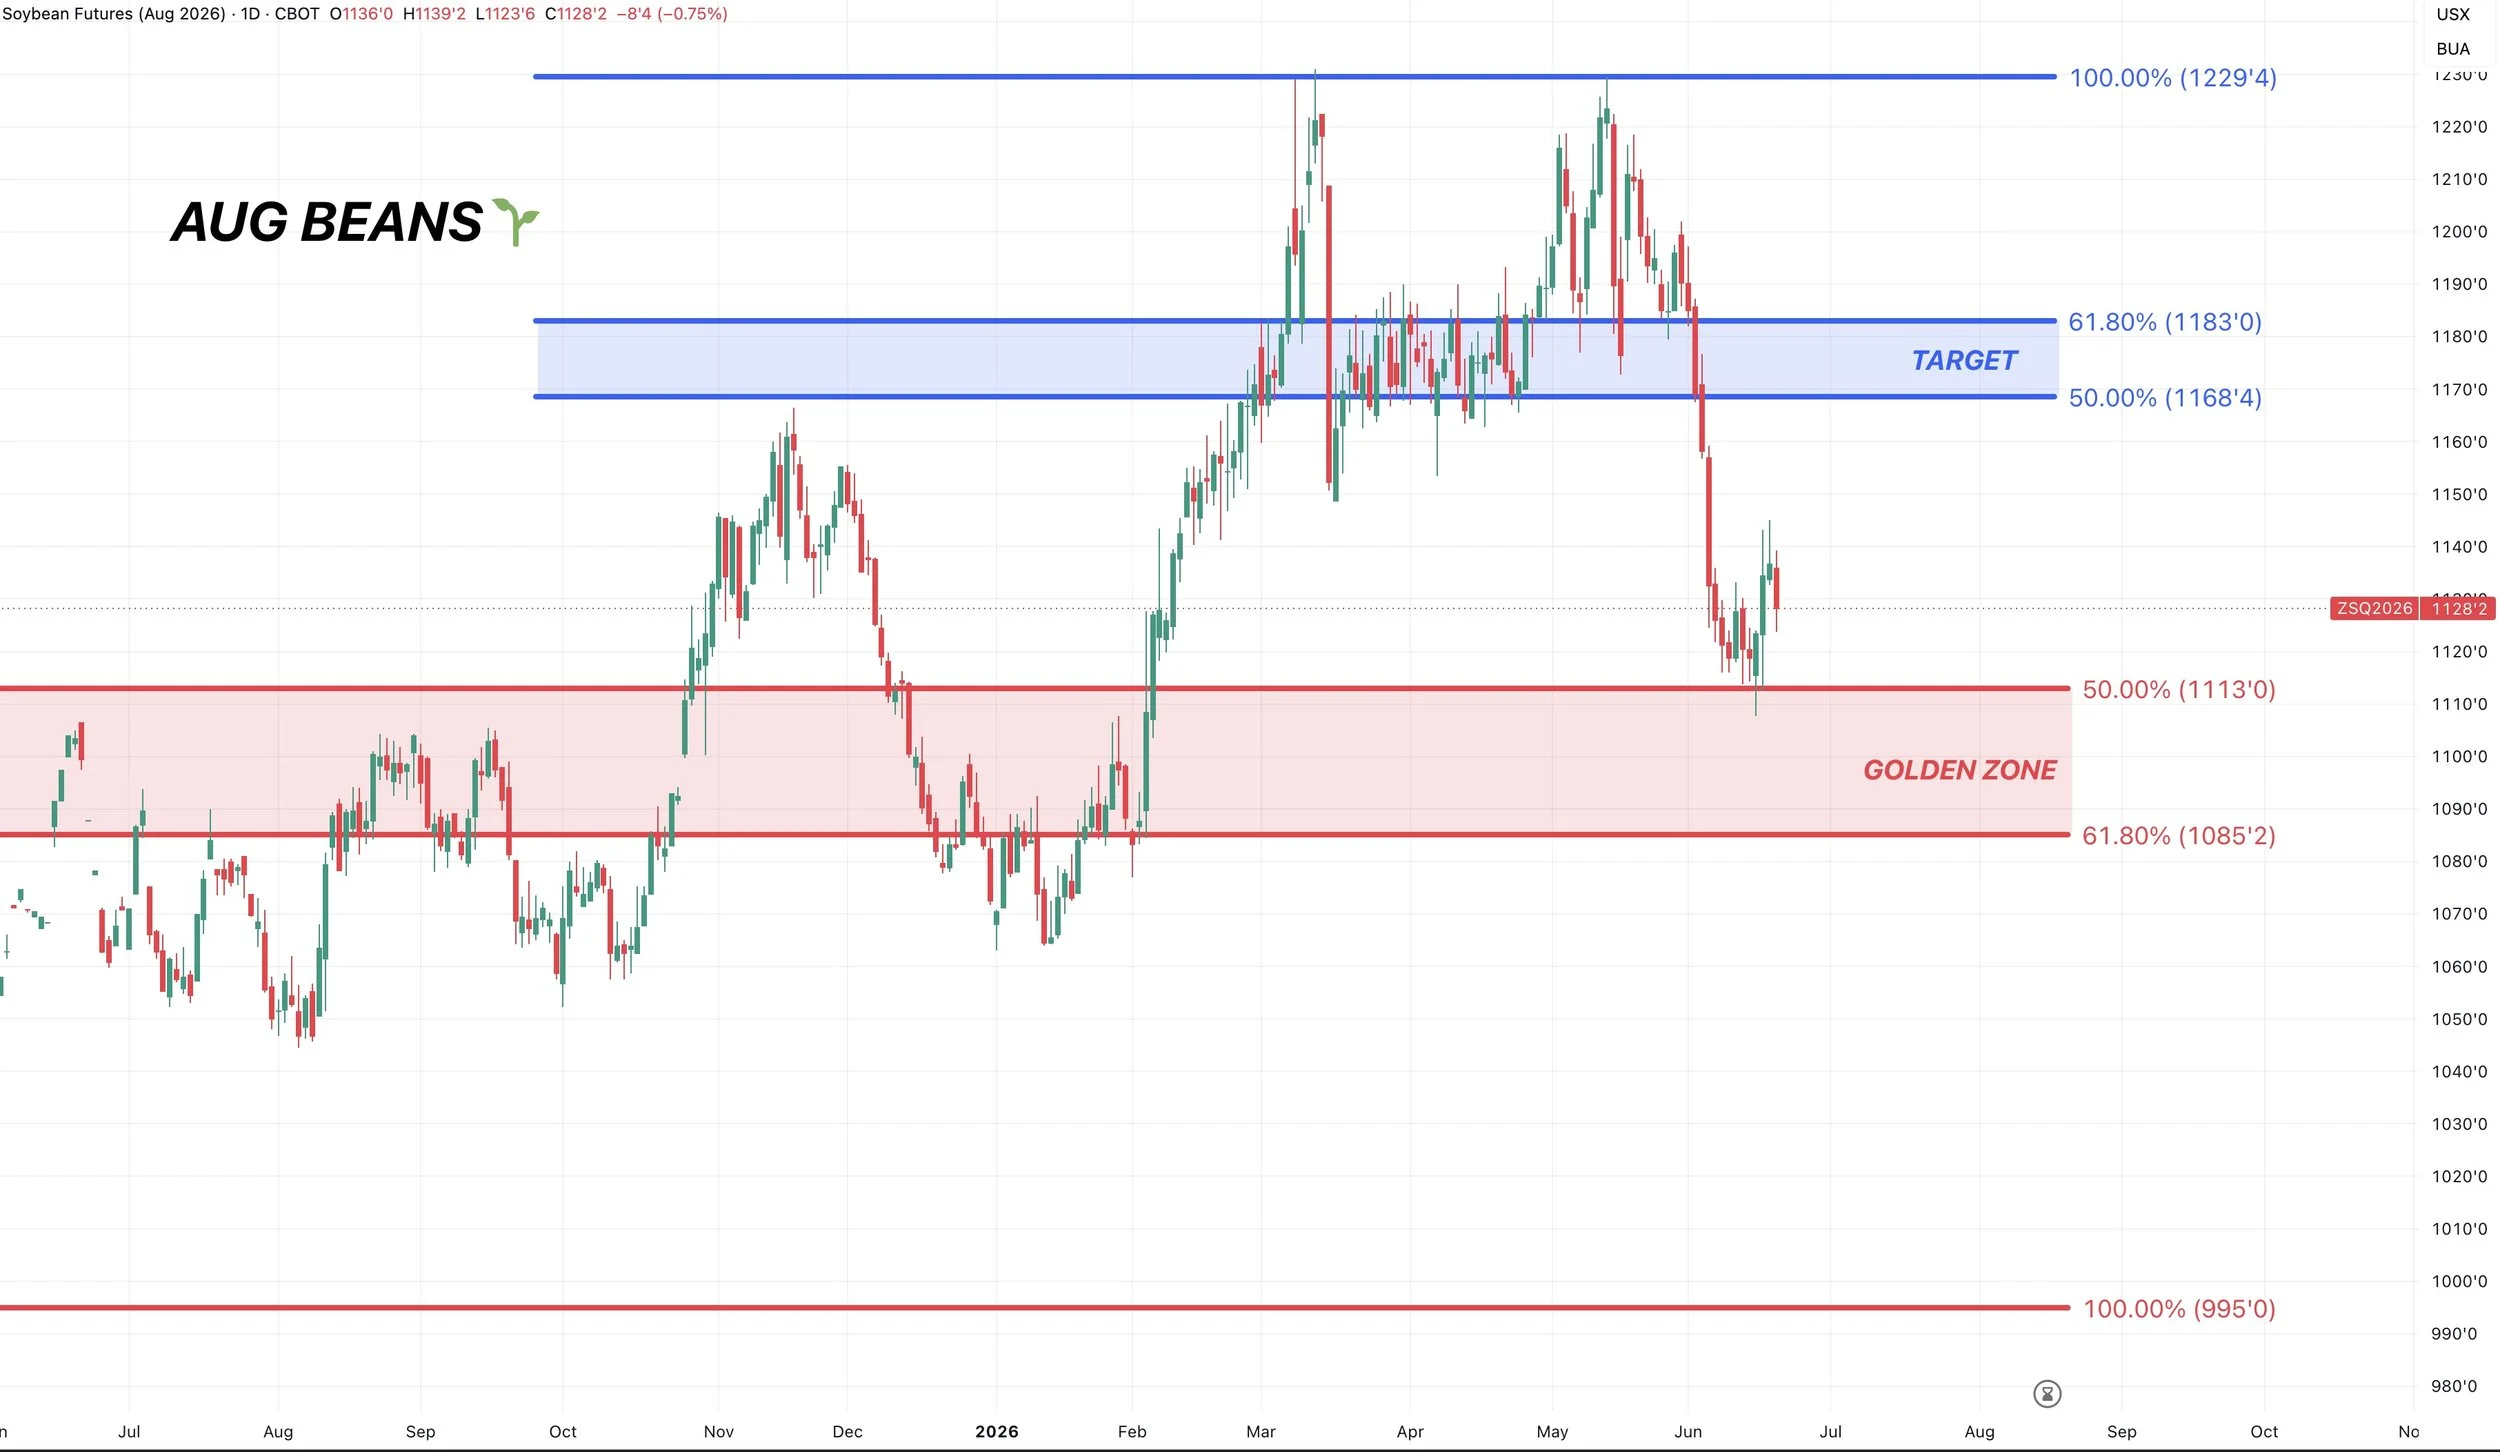
Aug Beans Chart:
We are finding life after giving back 50% of the highs down to contract lows.
We need to hold this level or we could take a trip down to the 61.8% level.
If we can get a bounce into the $11.68 to $11.83 range that would be an area to look to reward.
That's the golden zone retracements of the sell off. It also happens to be that old range we were trapped in before falling apart.
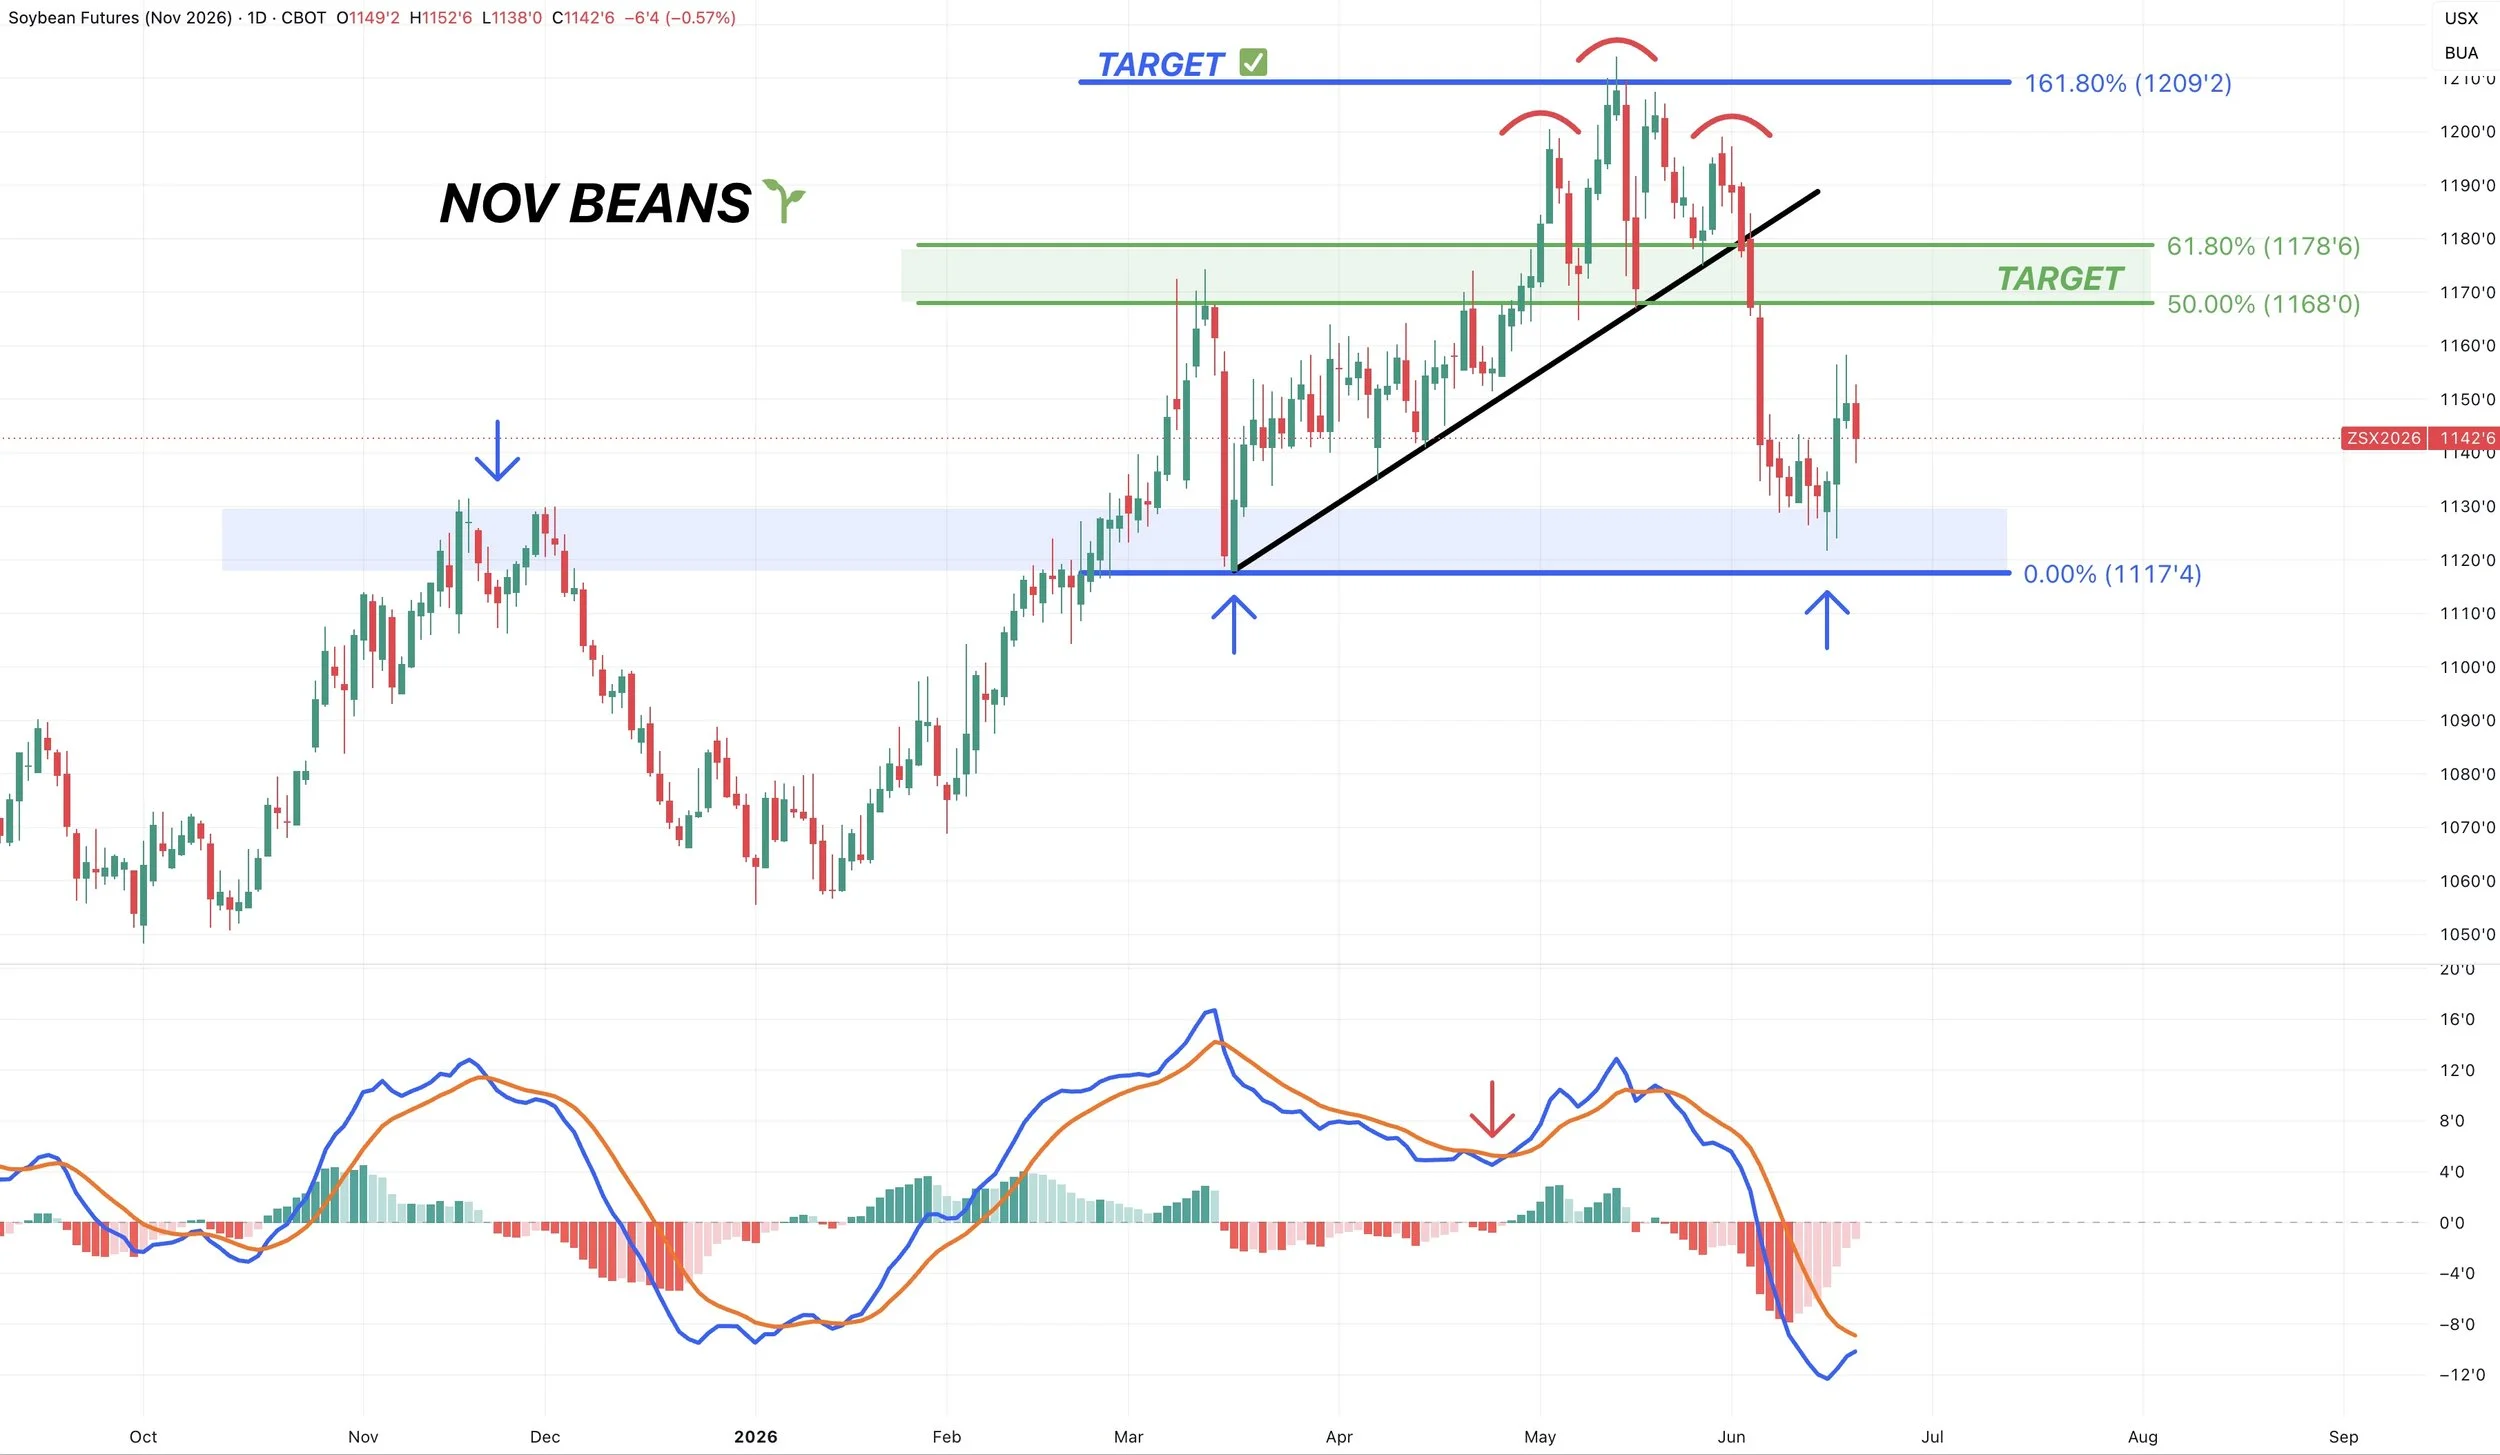
Nov Beans Chart:
Holding exactly where we want to so far.
Bouncing right at those highs from November and lows from March.
We need to continue to hold this level or there is plenty of air to the downside. With zero volume or support beneath.
If we get a bounce into the $11.68 to $11.78 area we want to defend it.
That's the golden zone retracements. The most common spot for a relief bounce to fail.
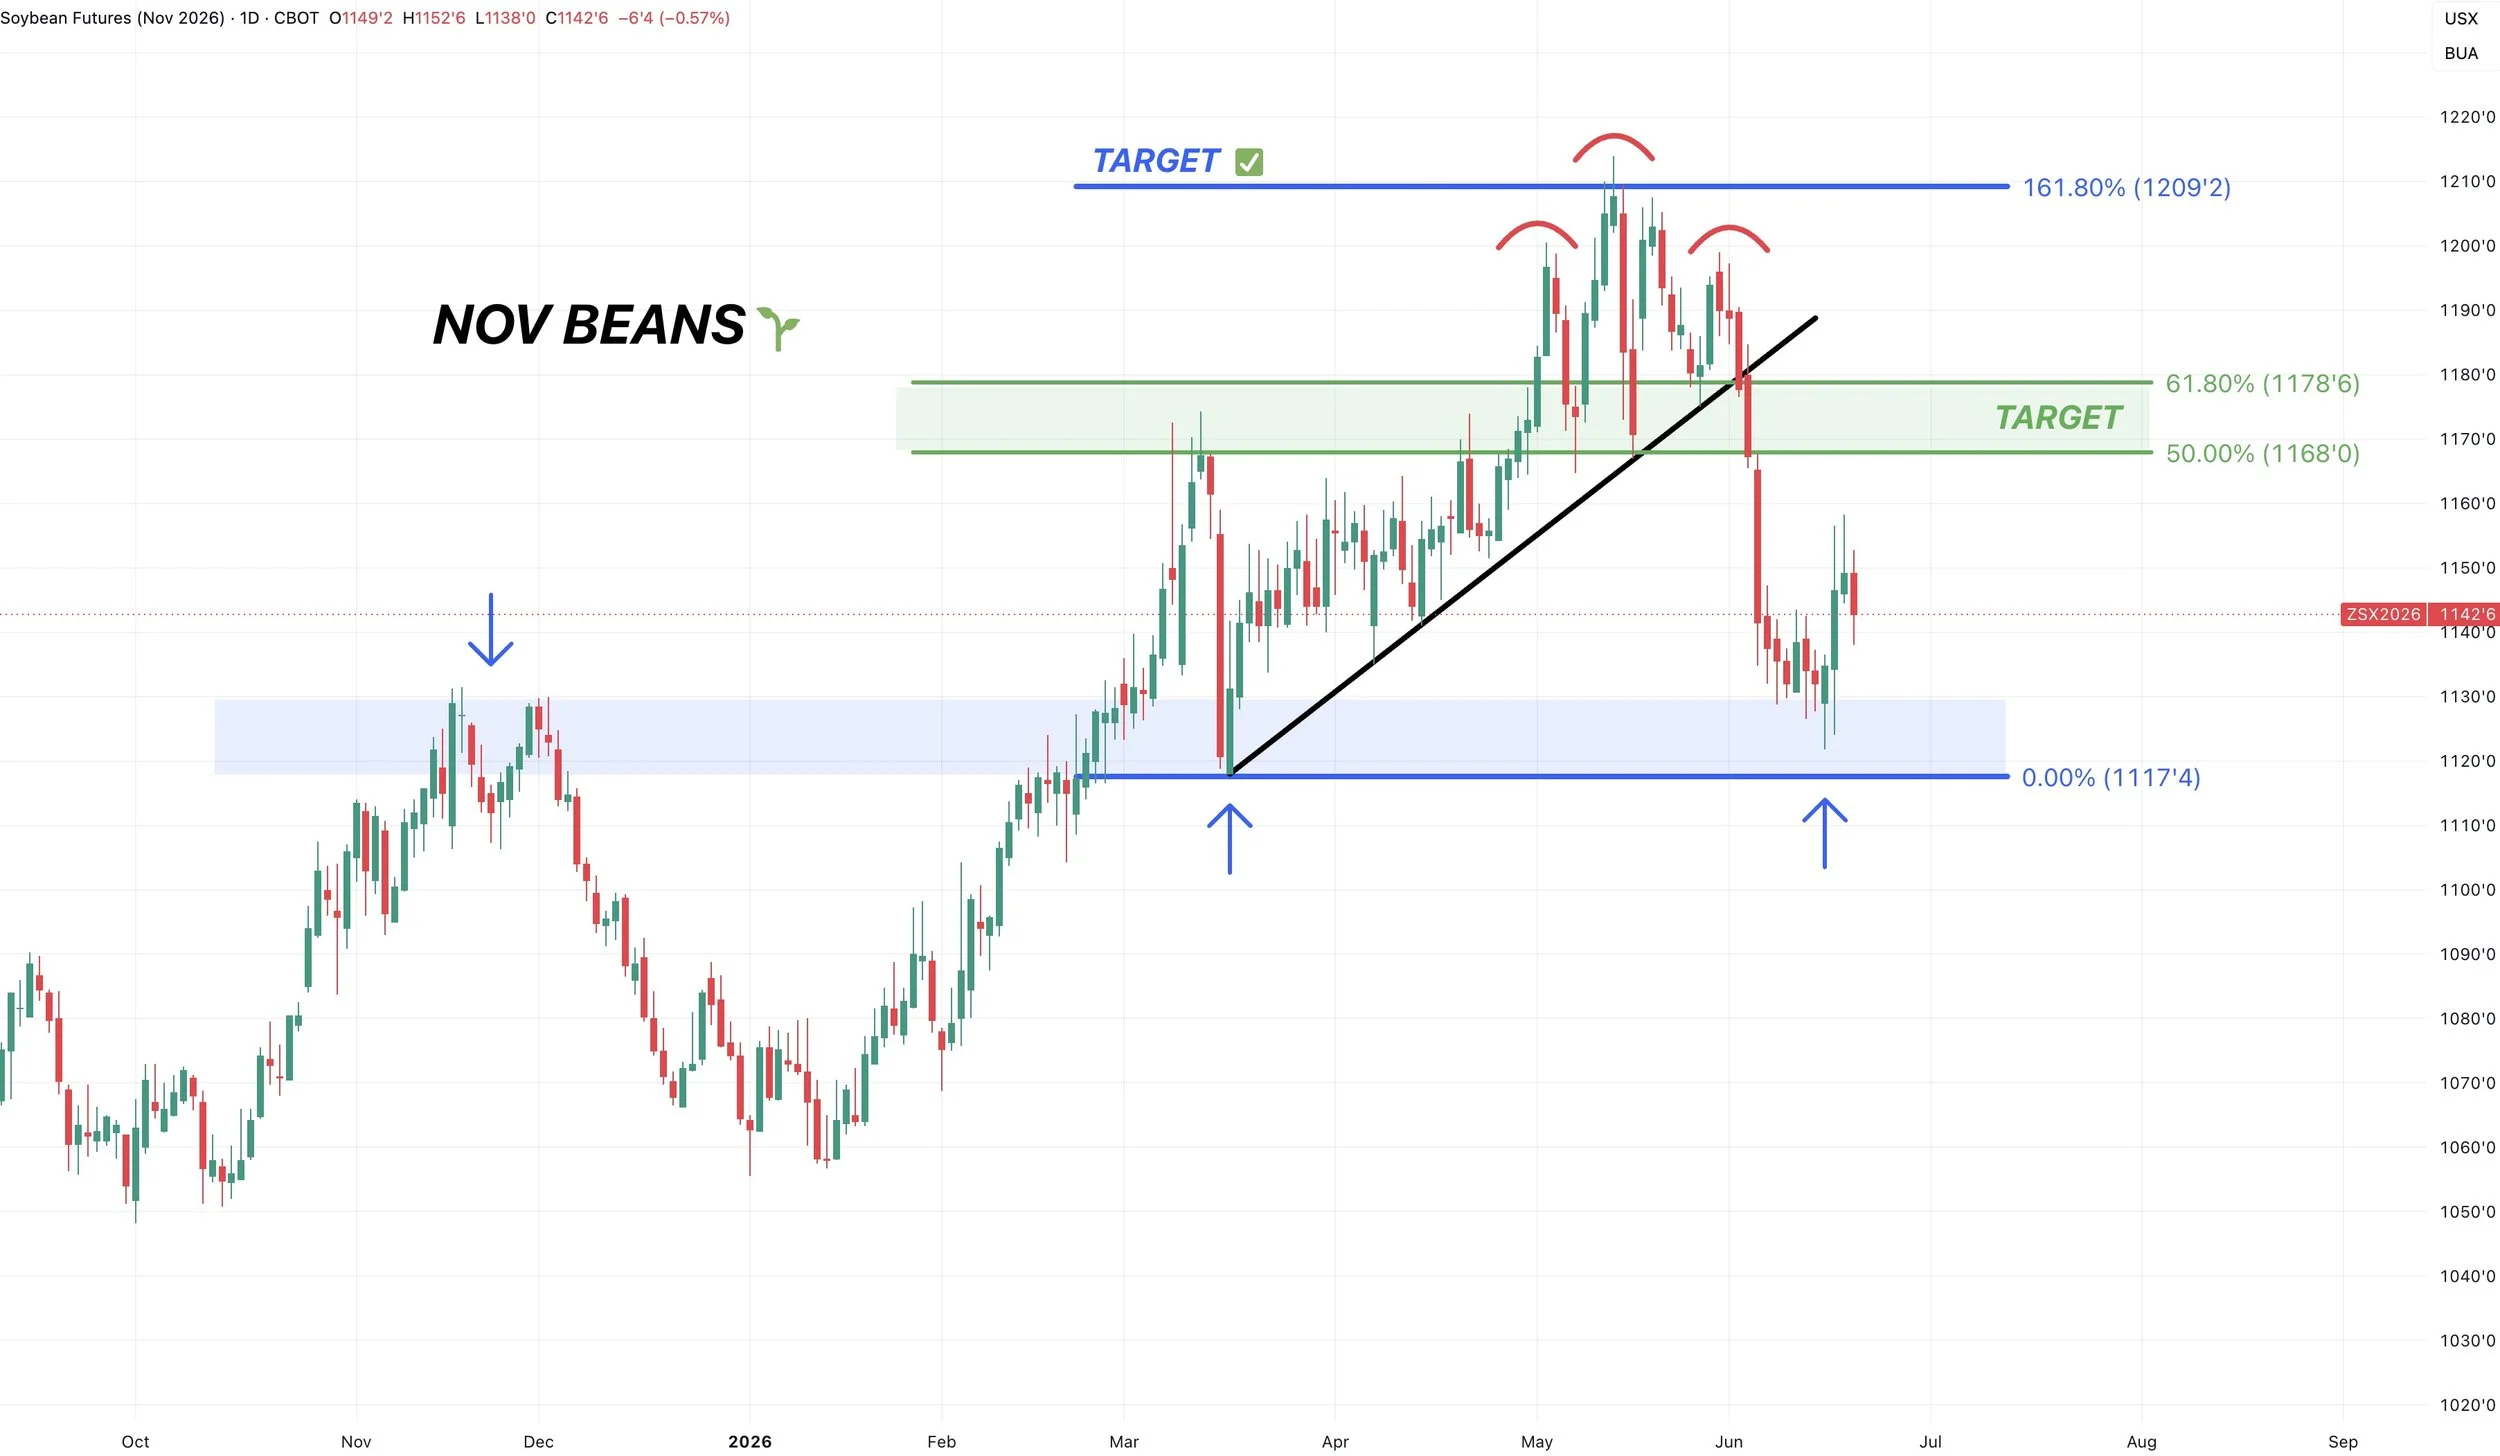
Something to note is that the MACD is on the verge of flipping bullish for the first time since April 28th.
Which suggests momentum might be starting to shift higher.
Wheat
Nothing fresh or exciting in the wheat market today.
I just wanted to note that seasonally we are still in a time frame where we tend to struggle.
From today by August 15th, we've been lower the last 12 of 15 years.
So like in the rest of the grains, if you are someone who is going to have to move something, we want to do so if we get a nice bounce here.
As I've talked about countless times, wheat still has a possible story next year, but for now we lack a catalyst in a seasonally weak time.

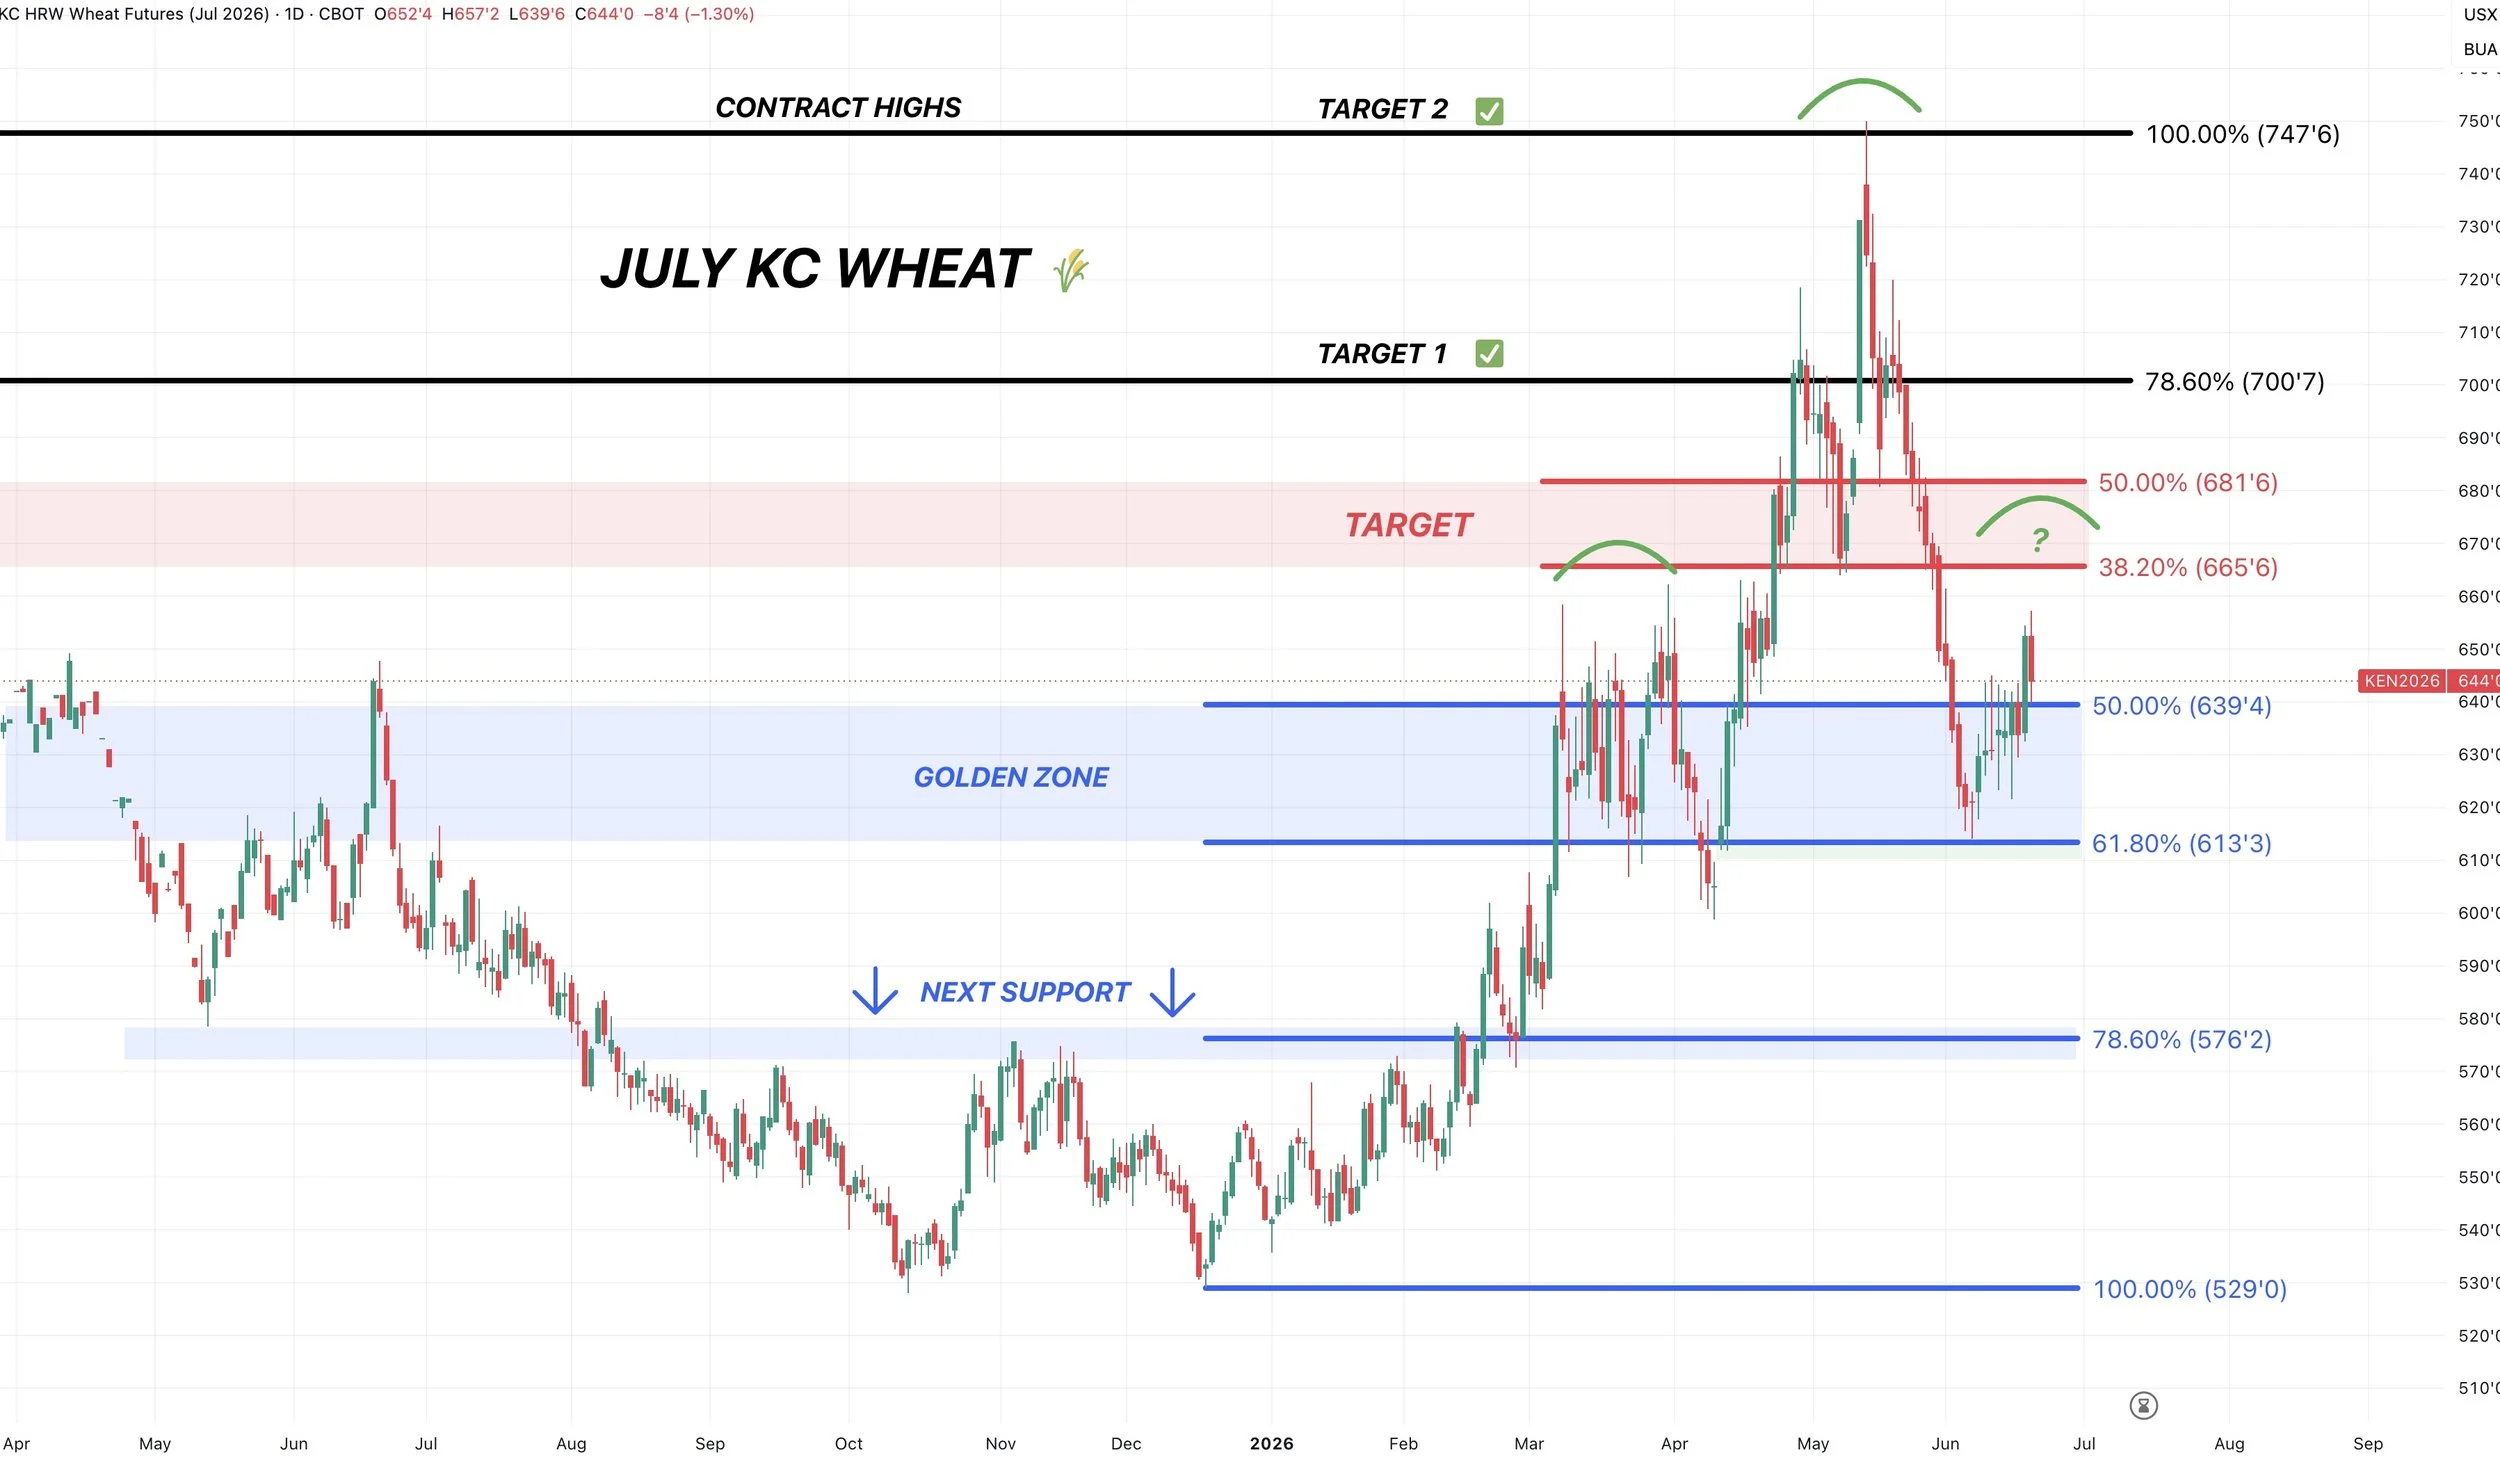
July KC Chart:
We found life right where we need to. After giving back 61.8% of the entire rally from contract highs all the way down to contract lows.
We fell a $1.30 from the highs. Now 30 cents off the lows.
We still need to hold the recent lows or we likely visit $5.75
To the upside, I want to defend the $6.65 to $6.82 range if it comes.
That claws back 38.2% to 50% of the sell off and prior support.
Cattle
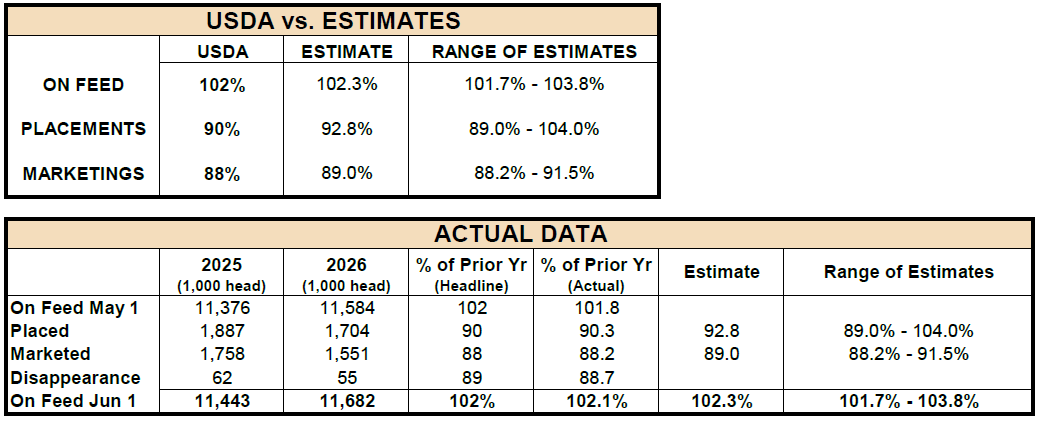
COF Report:
We had a cattle on feed report today.
On Feed:
USDA: 102%
Estimate: 102.3%
Placements:
USDA: 90%
Estimate: 92.8%
Marketings:
USDA: 88%
Estimate: 89%
They reduced placements, which should be supportive to the back months.
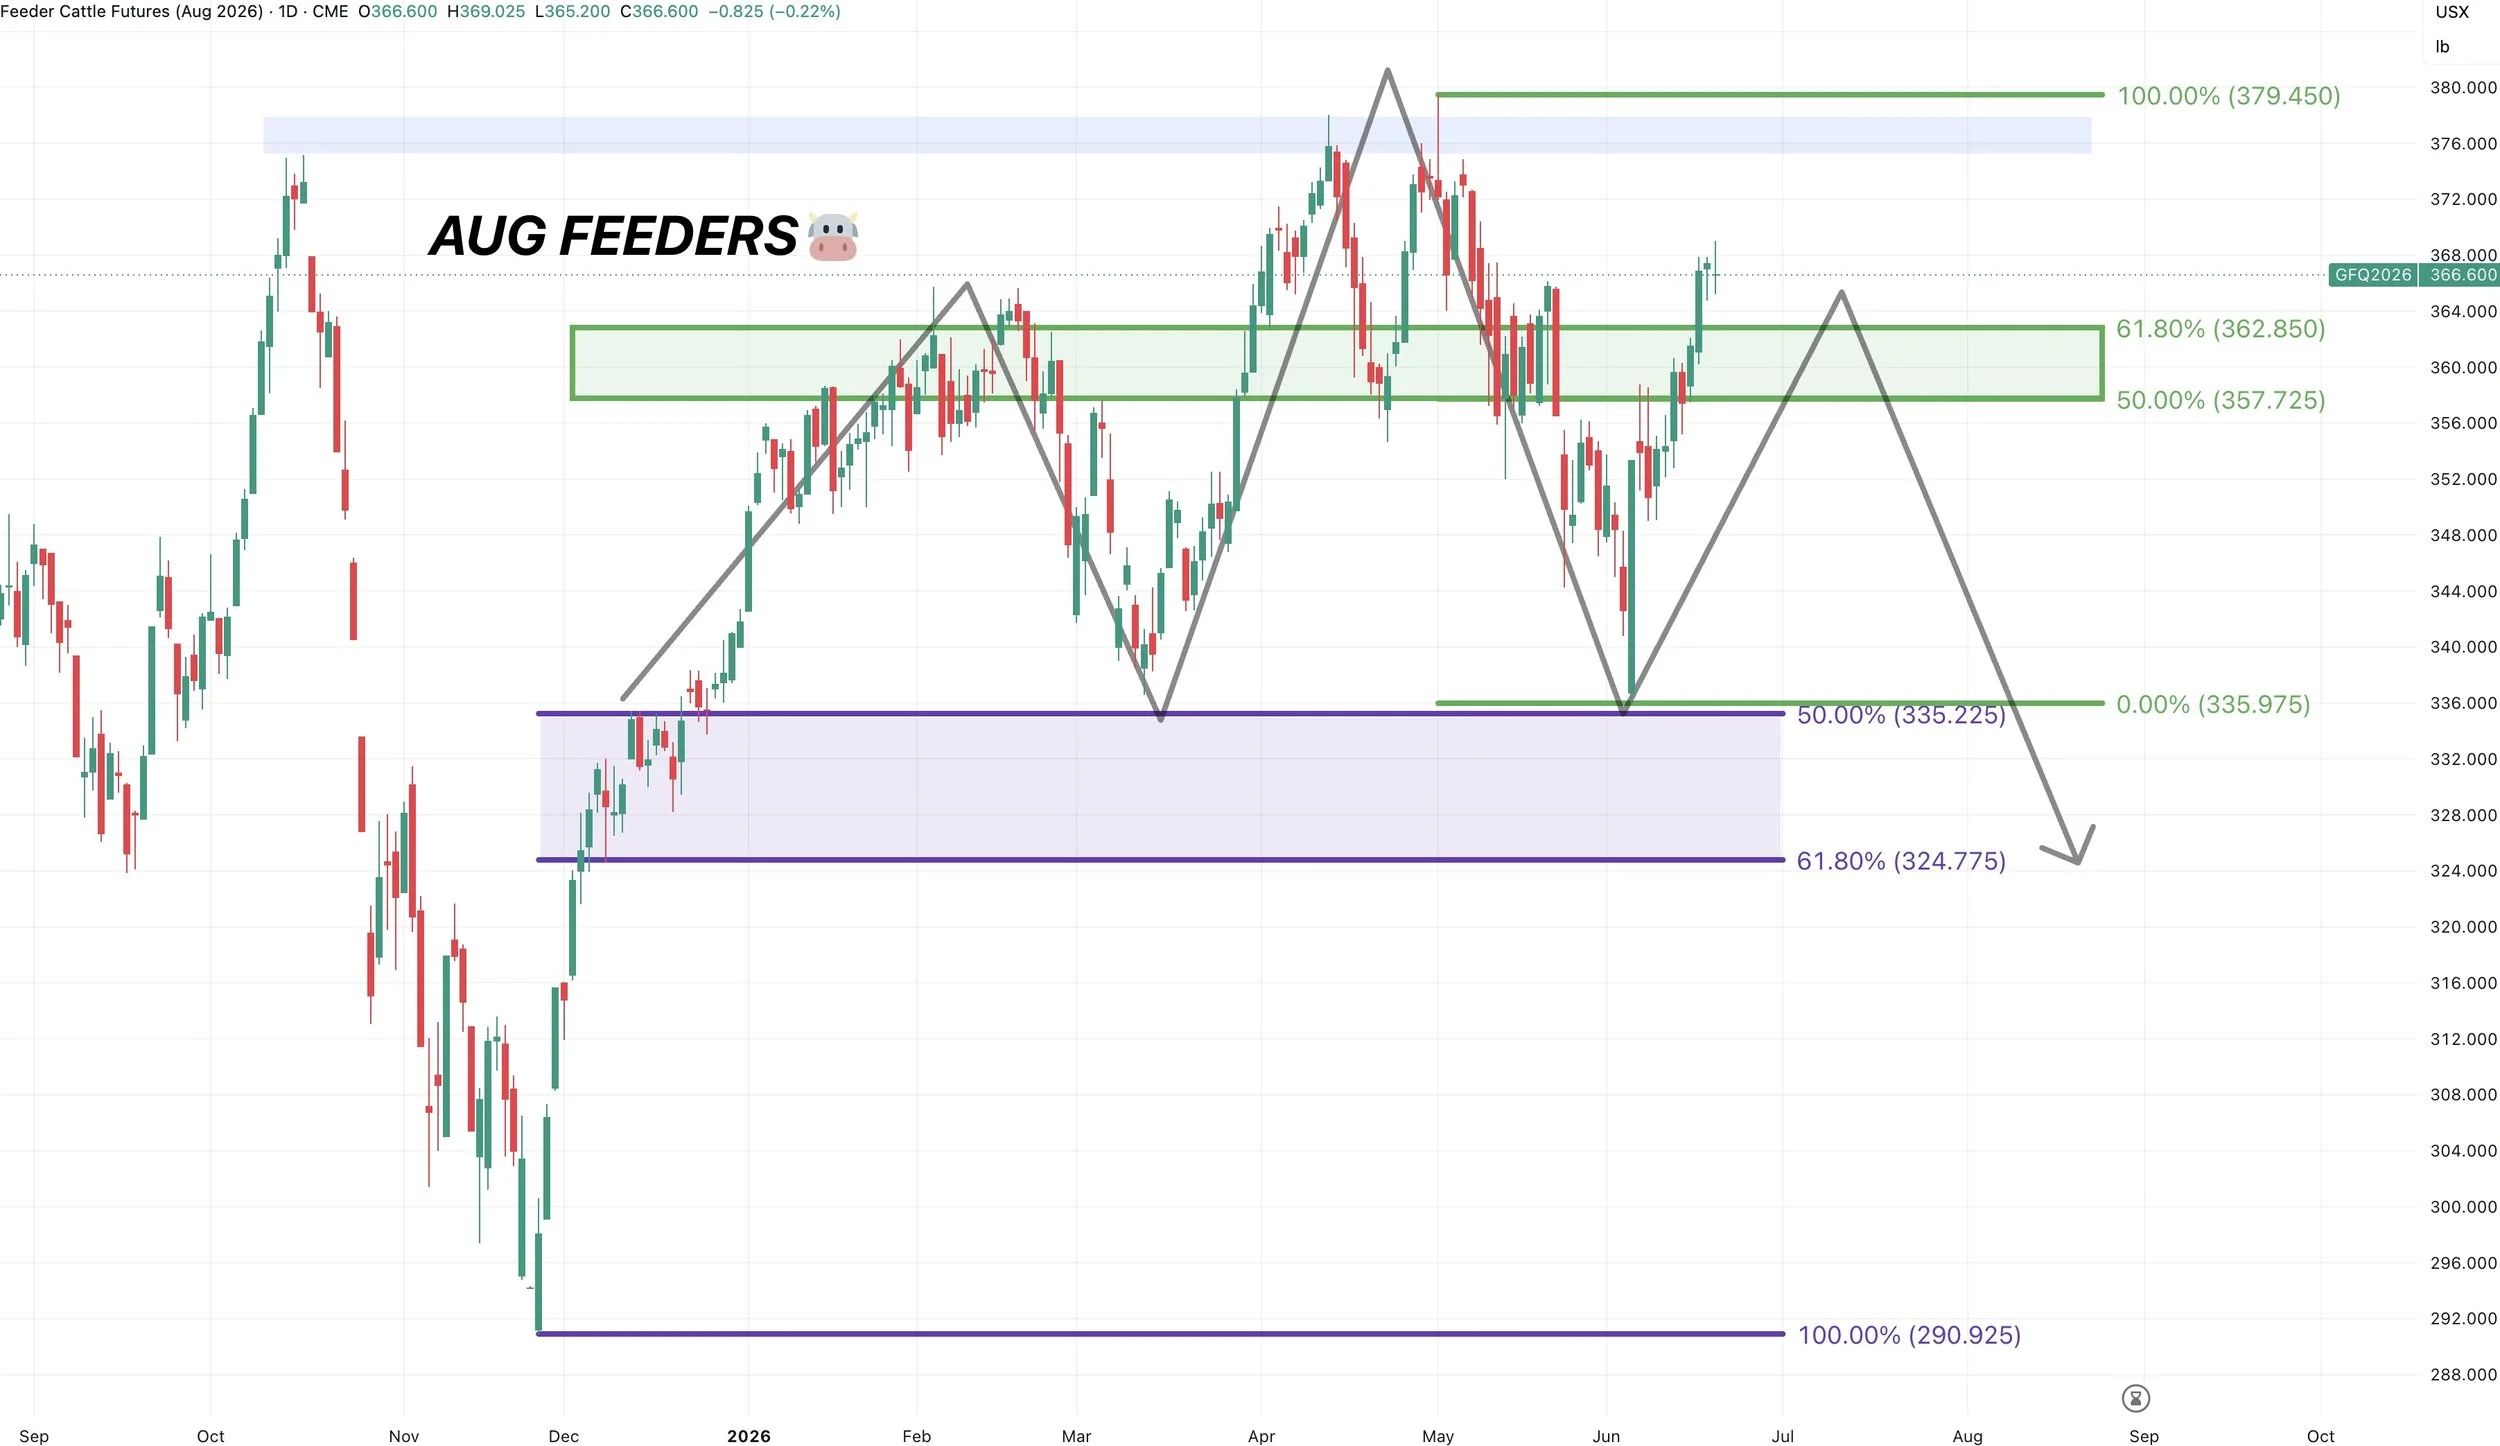
Aug Feeders Chart:
We took out the golden zone retracements, which means this is often no longer viewed as a correctional bounce and allows us to challenge the highs.
We still feel like it makes sense to have some protection at these levels as we are at the upper end of the range.
I am still being cautious of the possible head and shoulders pattern.
August Live Chart:
We bounced right where we needed to earlier this month. In the golden zone and right at the prior highs.
We are right near the highs and sitting in the upper end of the range. Rejecting here the last two days.
Anytime you are near the highs is never the worst spot to protect yourself.

Want to Talk?
Our phones are open 24/7 for you guys if you ever need anything or want to discuss your operation.
Jeremey & Office: (806)484-1214
Sebastian: (605)280-1186
Email: sfrost@dailymarketminute.com
Hedge Account
Interested in a hedge account? Use the link below to set up an account or give us a call.