
MARKET UPDATE
You can scroll to read the usual update as well. As the written version is the exact same as the video.
Timestamps for video:
Overview: 0:00min
Corn: 0:50min
Corn Charts: 4:45min
Beans: 7:35min
Bean Charts: 11:00min
Wheat: 14:20min
Cattle: 15:55min
Want to talk?
Office: (806)484-1214
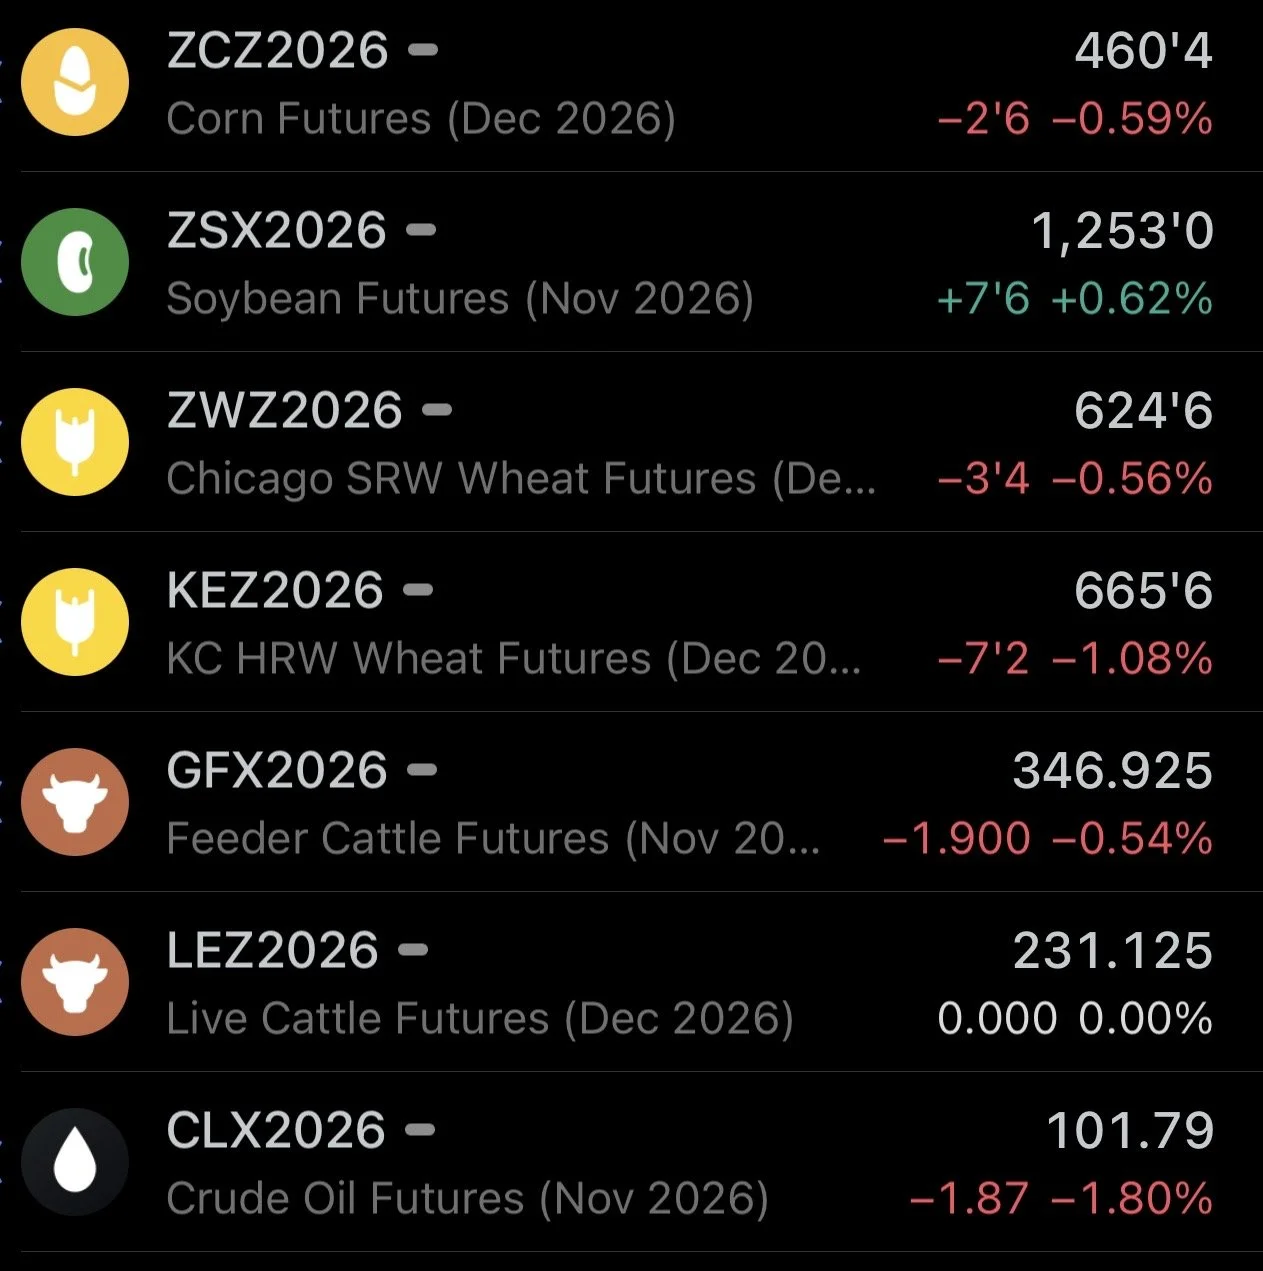
Futures Prices Close
Overview
Grains were mixed with soybeans leading the way higher and corn and wheat slightly lower.
Overall news is still pretty limited across this market, as there isn’t much for the market to run with.
Wheat got smacked on Russia peace talk headlines yesterday.
Meanwhile, corn and soybeans are showing their first signs of possible life following the recent break.
Soybeans finally got a green day. Before today, soybeans had been lower for 8 days in a row.
Corn and soybeans have both been lower the last 10 of 12 days.
Wheat has been lower the last 11 of 12 days.
So the market still clearly lacks a catalyst, but corn and soybeans are at some interesting spots on the charts.
The forecasts look dry which means harvest should continue to ramp up, however harvest is over 50% complete meaning we should start to see less hedge pressure.
Not much for news today so let's get right into today's udpate.
Todays Main Takeaways
Corn
Corn vs Bean Ratio:
Overall, not a ton of fresh things to talk about fundamentally for corn.
Here is the corn to soybean ratio.
It's approaching it's highest levels it's been at for the last two years.
Meaning corn is priced cheaper relative to soybeans.
So right now this would favor more bean acres and less corn acres as of now.
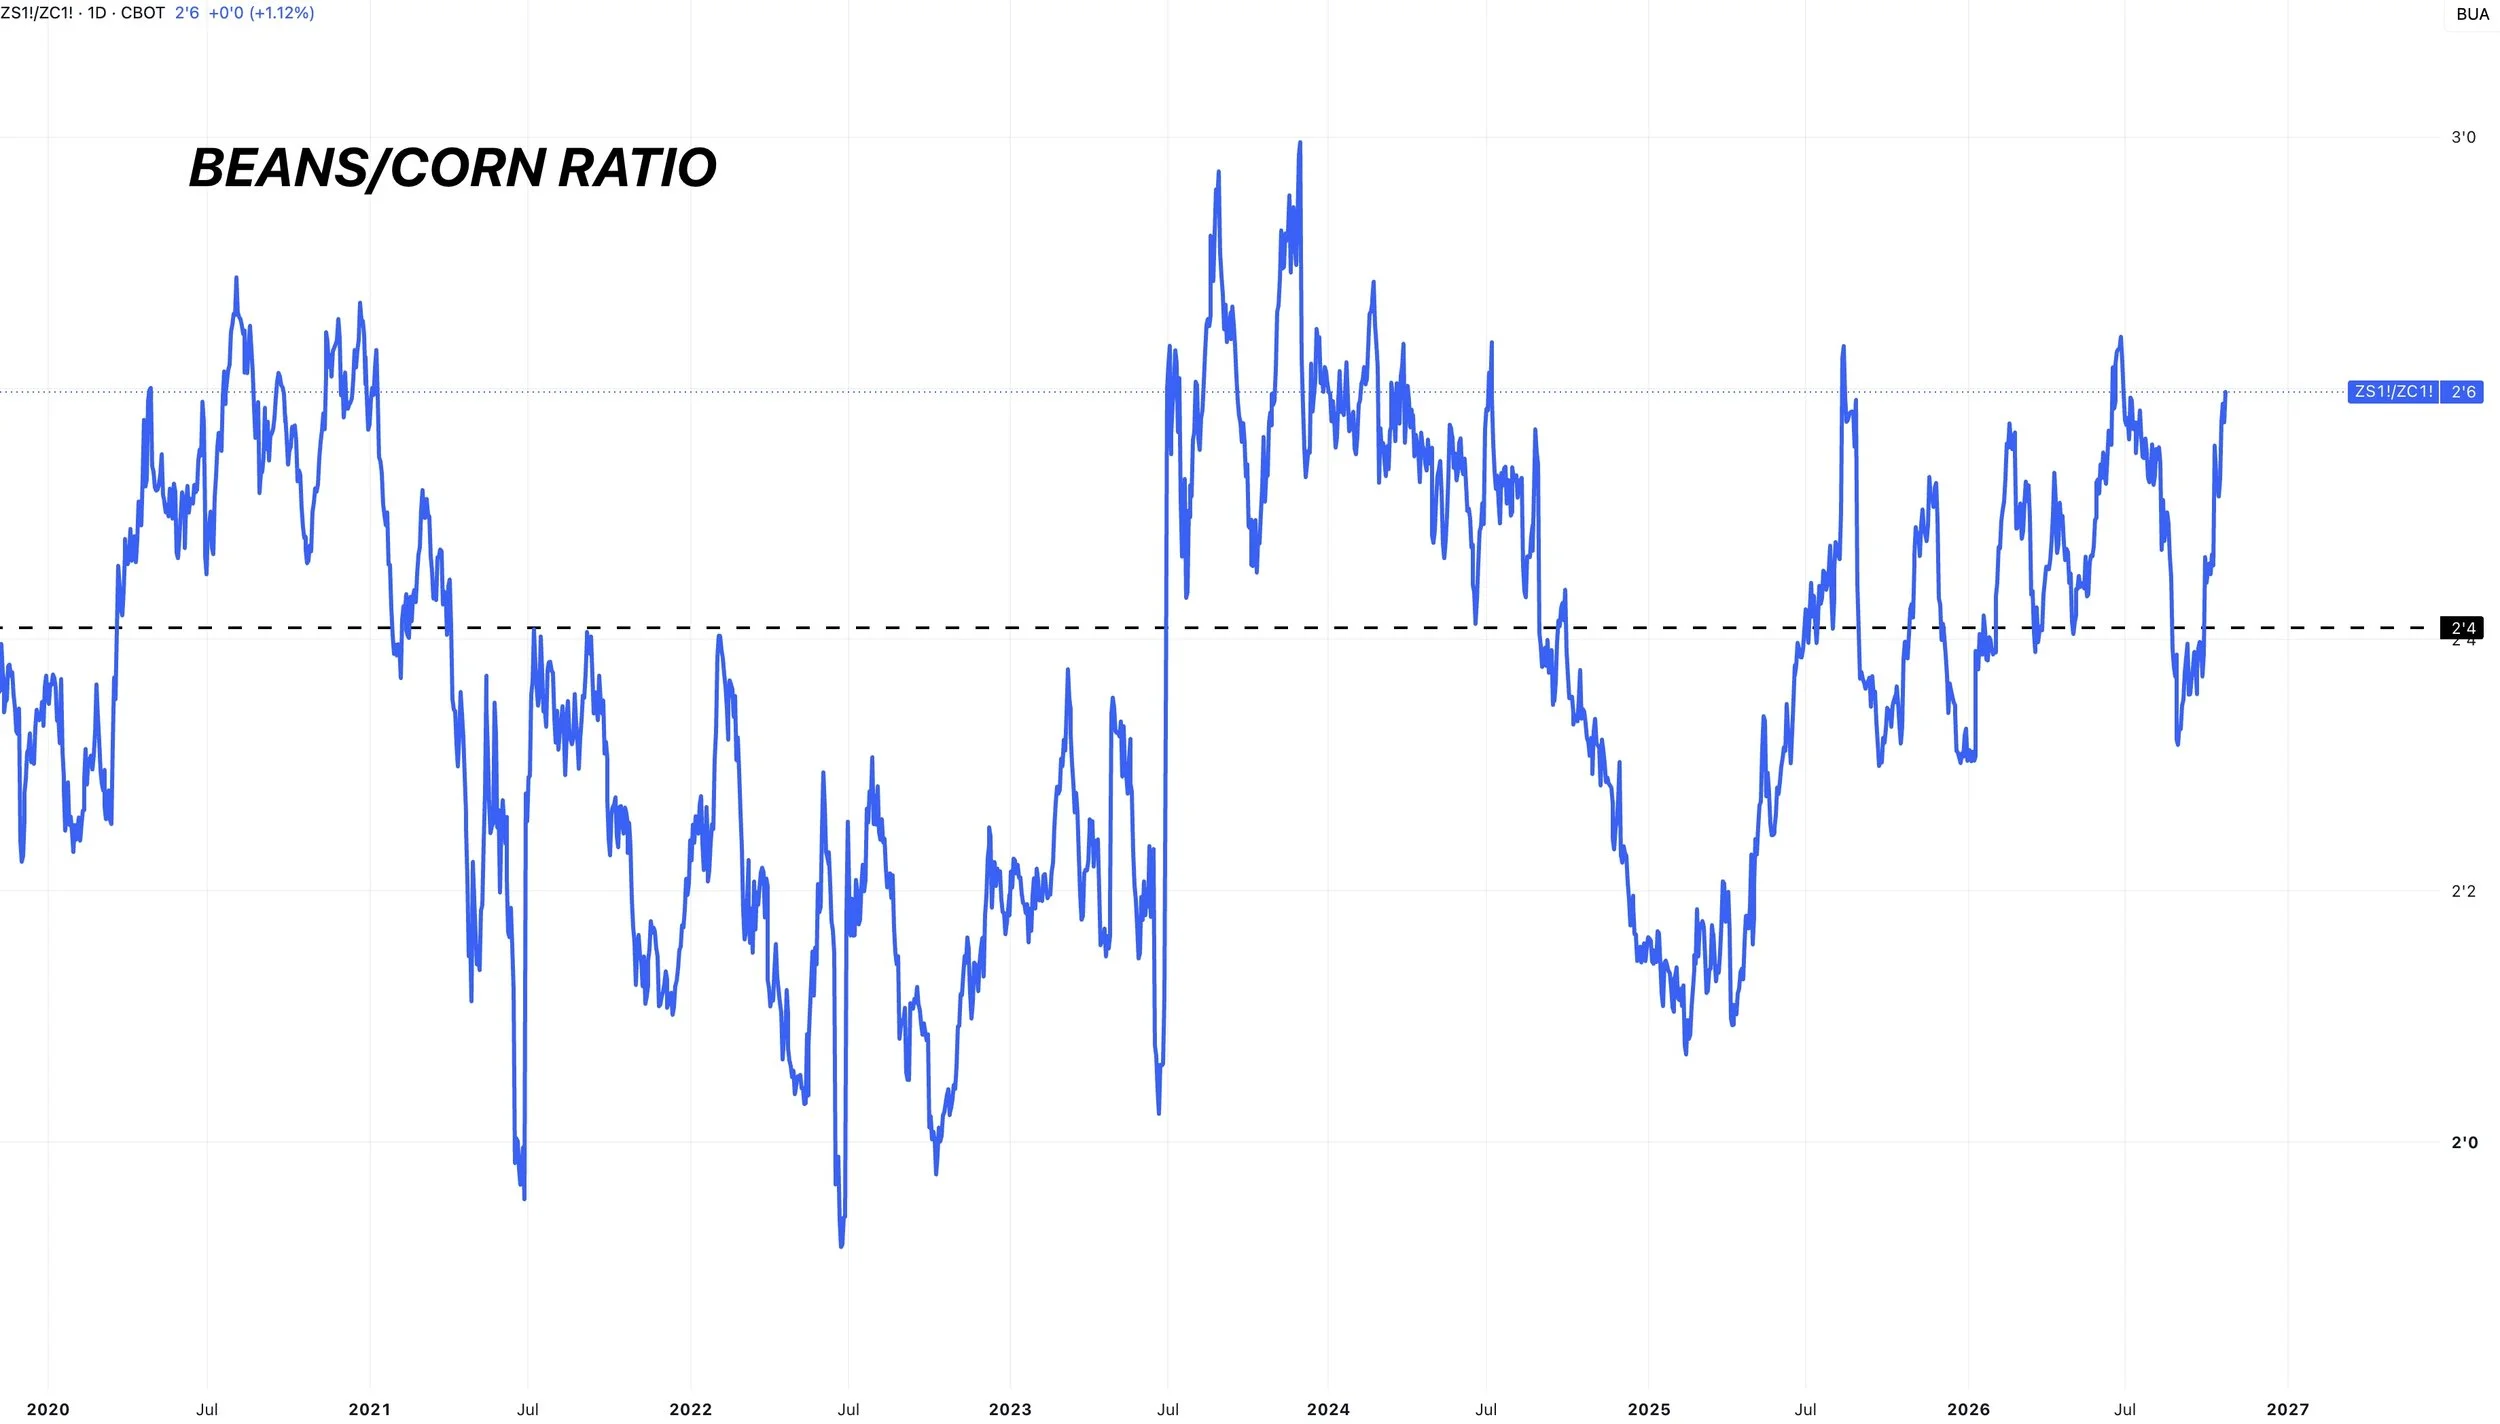
This is more of a 2027 story, but corn can’t really afford less acres.
We are clearly not at prices that are going to lower that record demand. If anything, lower prices creates more demand.
In the same token, beans also can’t really afford to lose any acres next year given how much demand has improved the last year.
So we could be setting up for an acre battle.
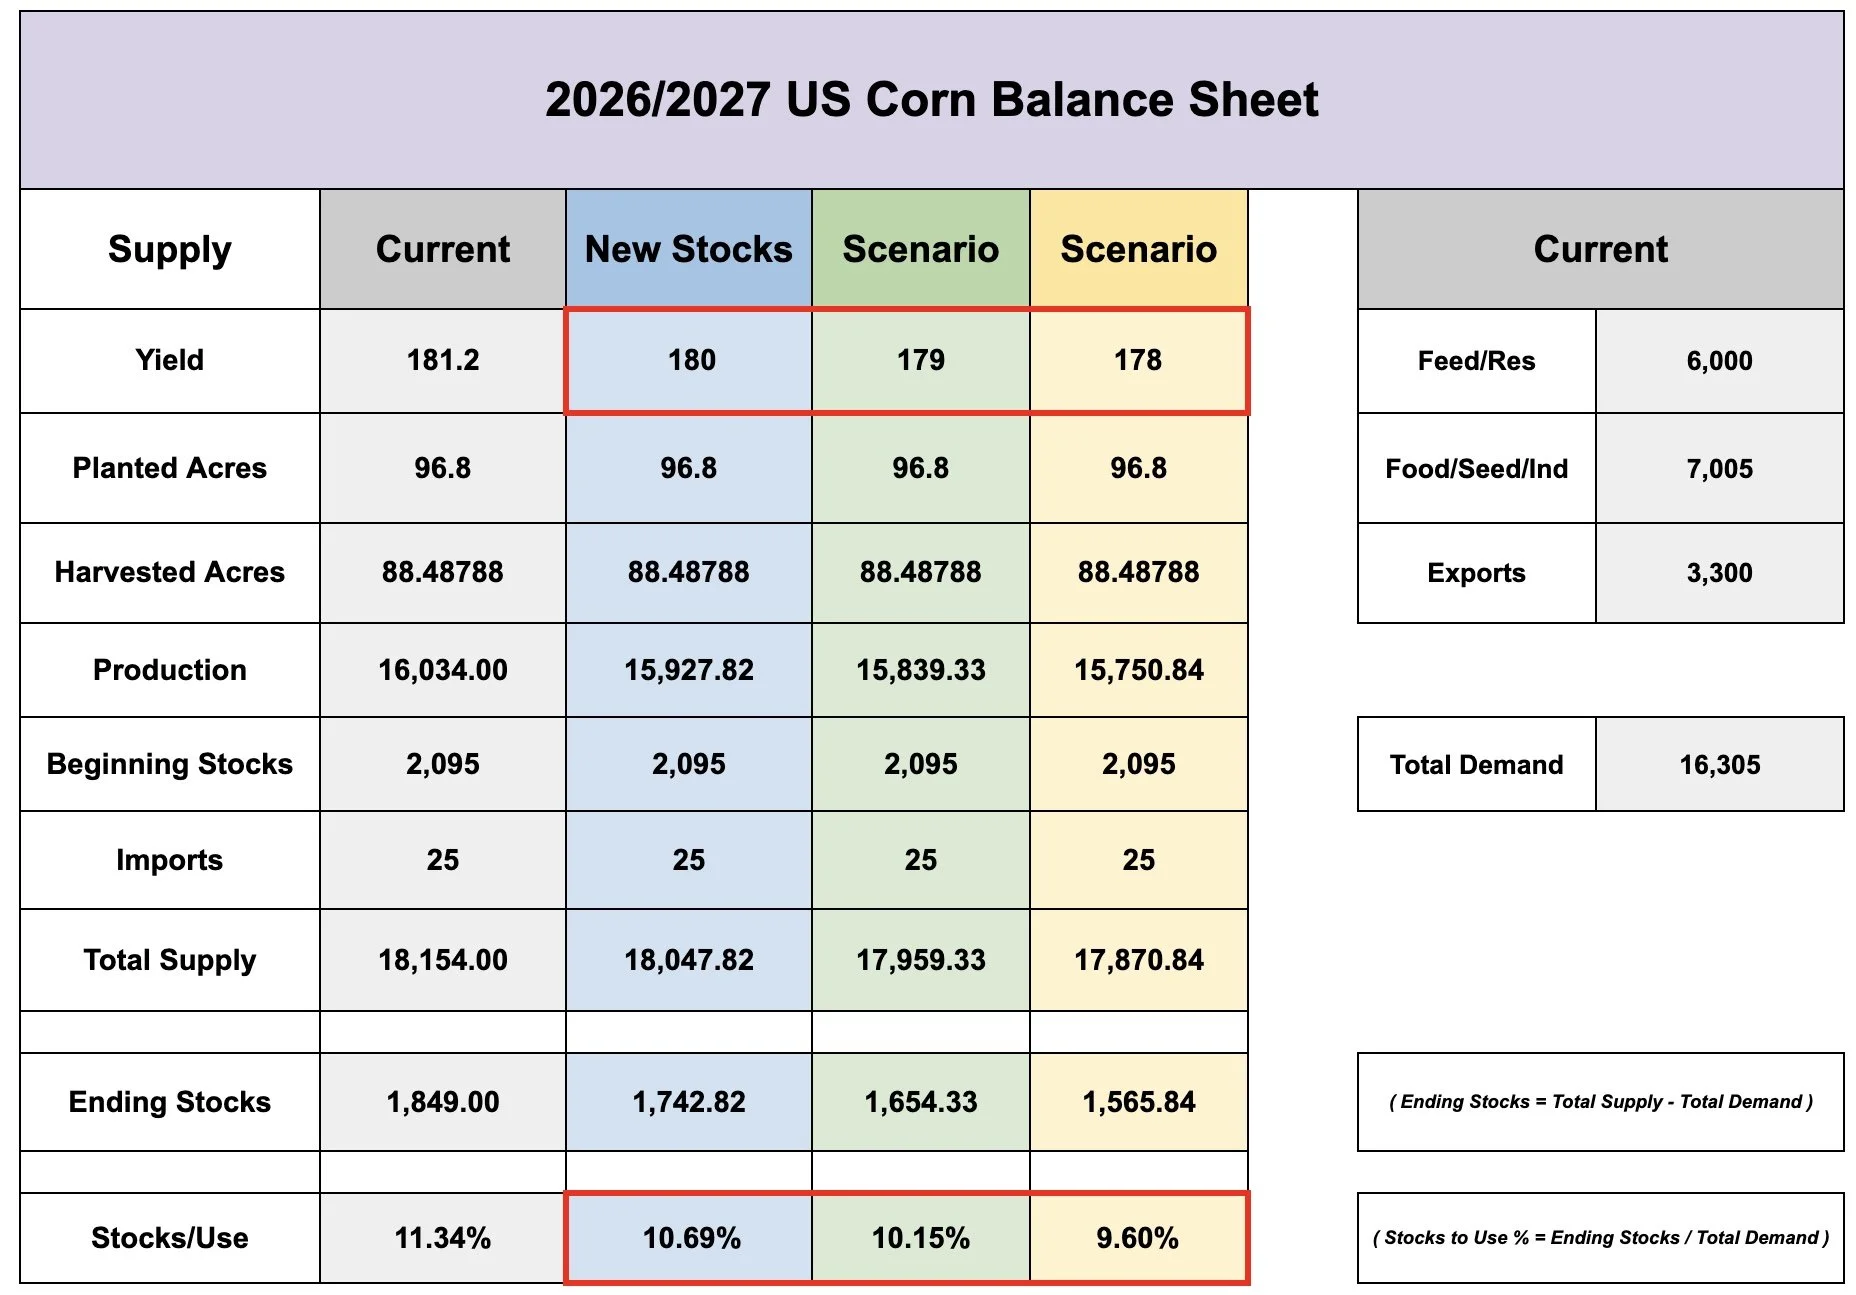
When it comes to the current balance sheet, I think yield is too high.
Like we talked about last week, there are several things pointing to some states such as Iowa having their yield come down.
Link to Friday's Update: Click Here
Nebraska is a clear question mark as well.
They have one of their worst rated crops on record. Yet the USDA isn’t expecting their yield to fall too far.
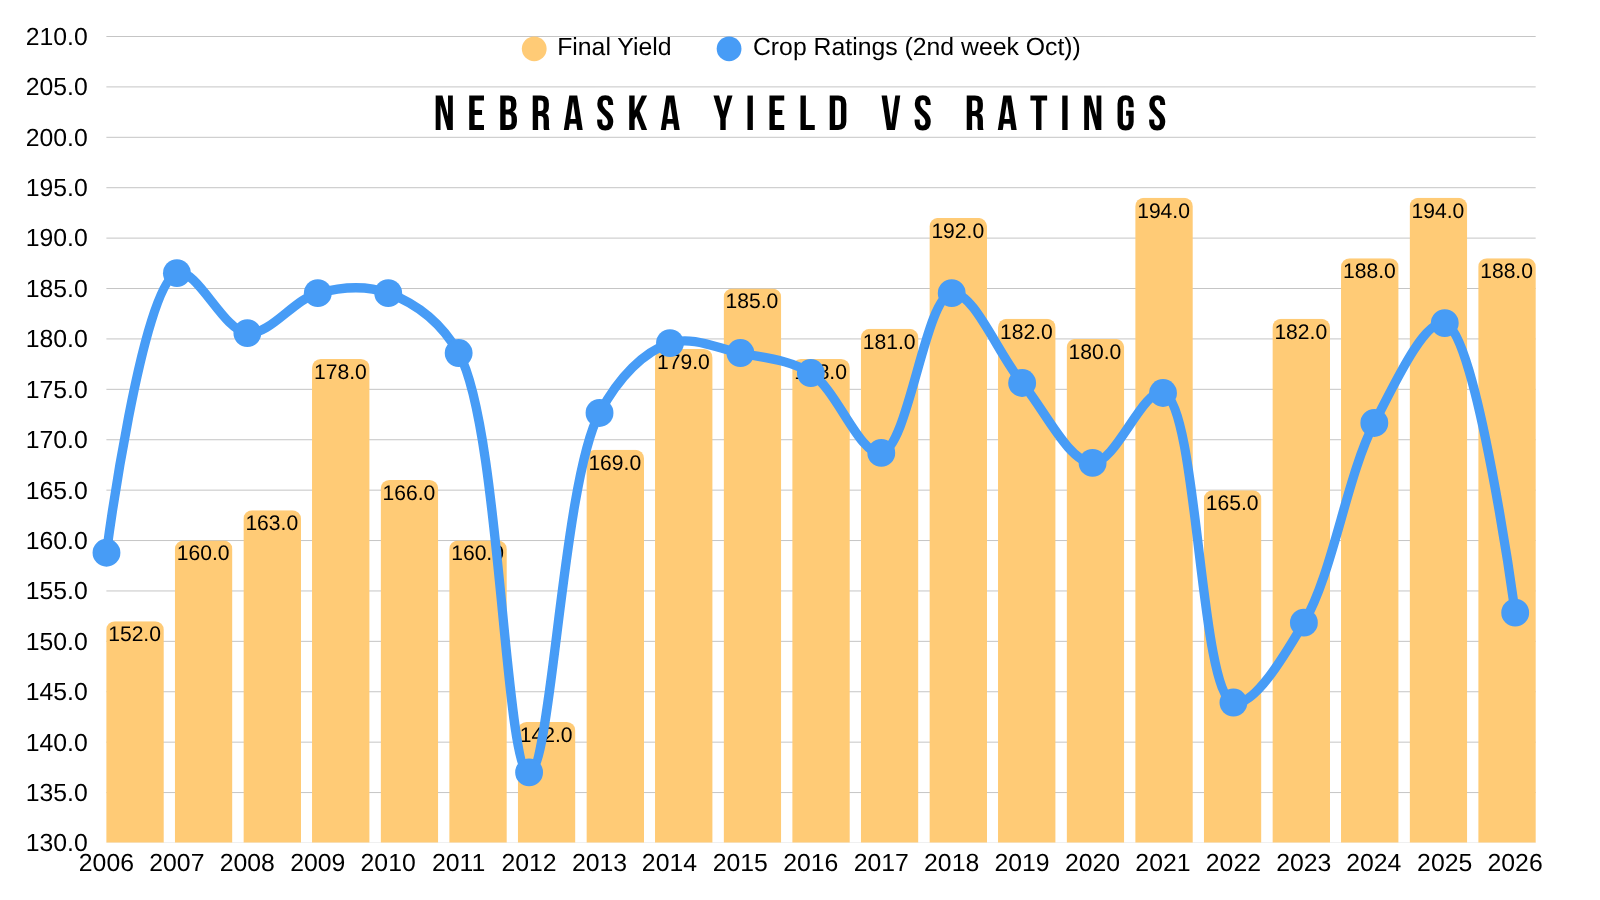
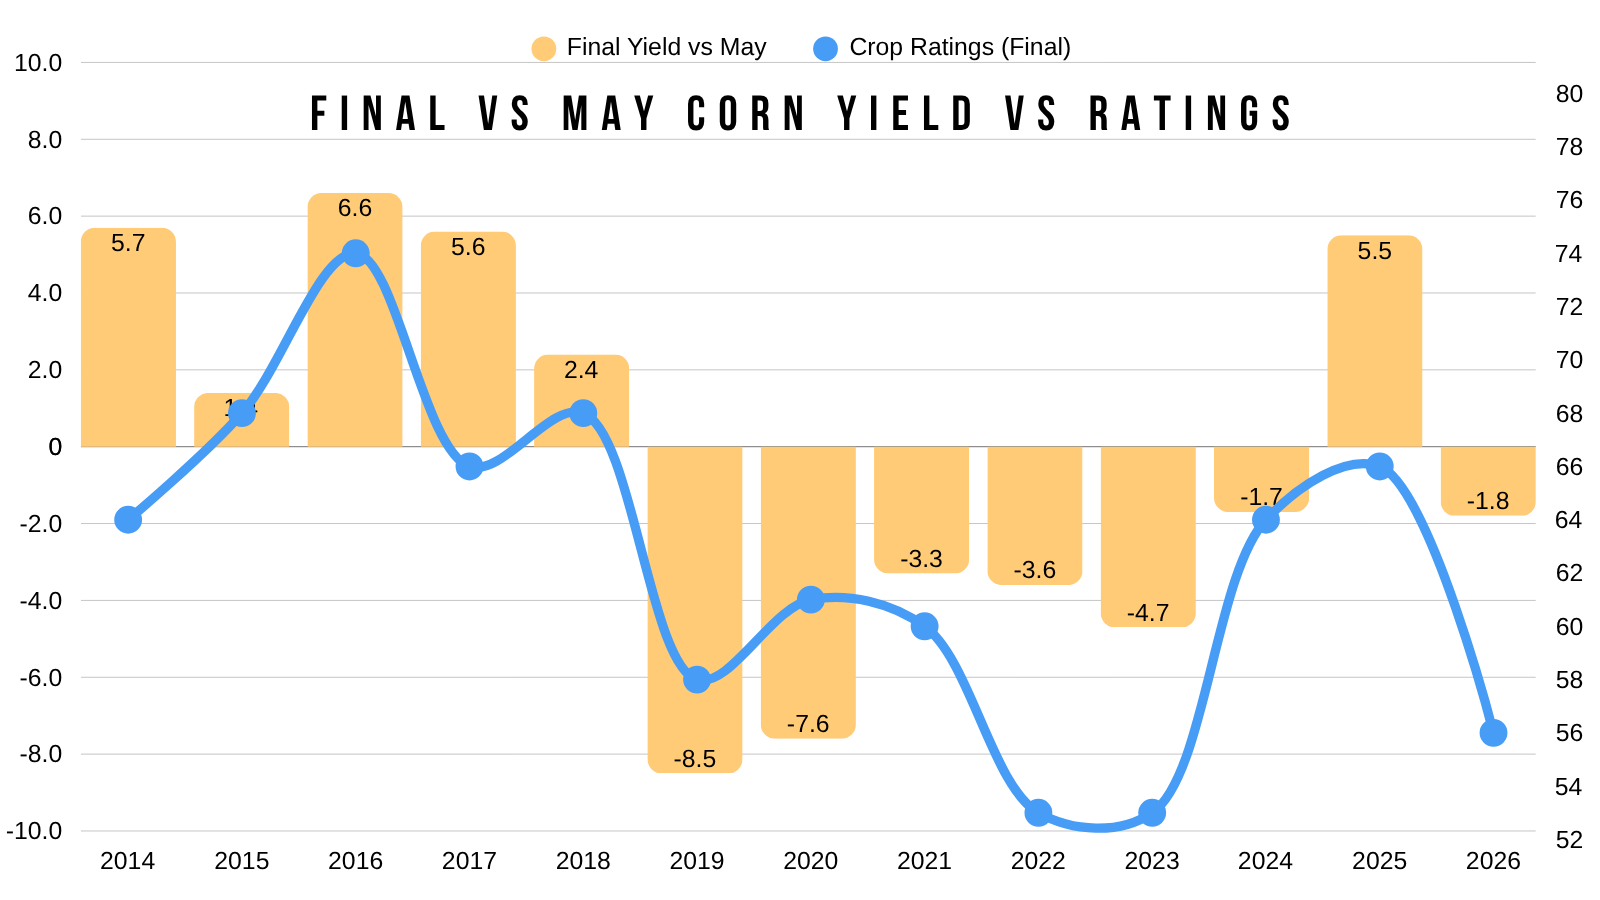
Even on a national scale like we've talked about, the crop ratings suggest yield should be coming down at least to a certain extent.
We have one of the worst rated crops we've had over the last decade.
Yet the USDA is projecting just a small -1.8 bpa deviation from trend.
Where as every other year with a rating this poor, has resulted in a larger deviation.
On average, our yield change from October to January over the last decade is 3 bpa in either direction.
We had an October yield of 181.2 bpa.
So a yield in that of 178 to 179 range should not be out of the realm of possibilities.
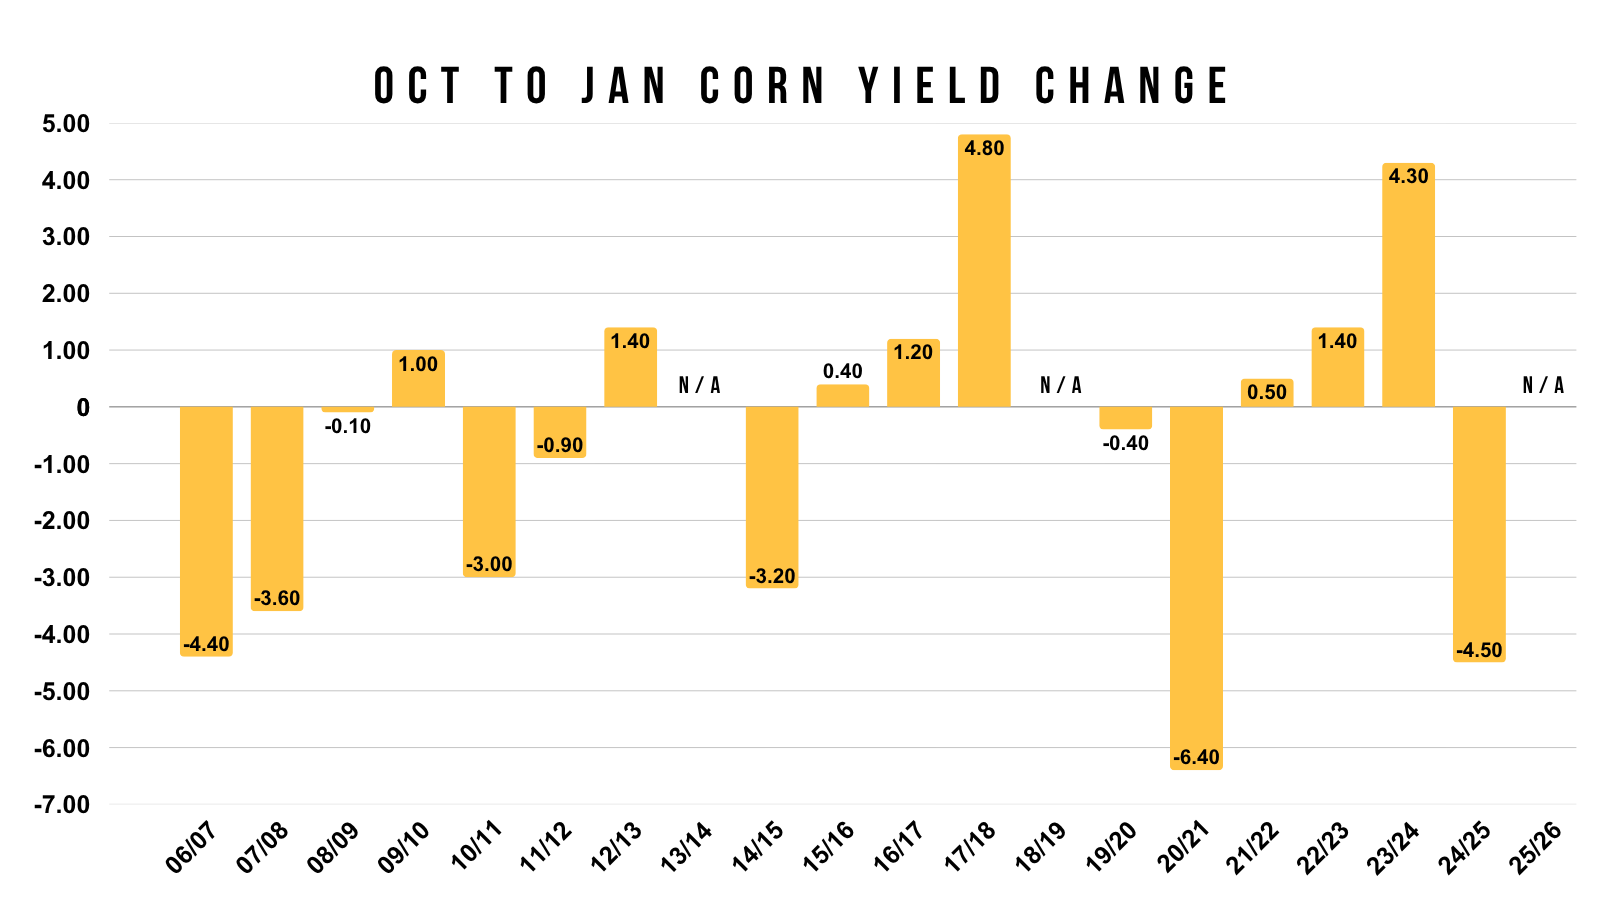
Before touching demand at all.
A 179 to 178 yield puts the balance sheet back into a decently tight situation, as it brings that S/U back down into that 10% range.
If yield really does come down, the story for corn isn’t over. It's just not going to happen tomorrow.
Currently, the market seems to be buying into the bigger crop story for now until it's proven wrong.
Export Situation: Reason for Concern?
Our export sales are way behind last year.
As they trail last year bu -35%.
Some would argue that this is a concern, but it's not quiet that simple.
For starters, this is largely a timing thing rather than pure lost demand.
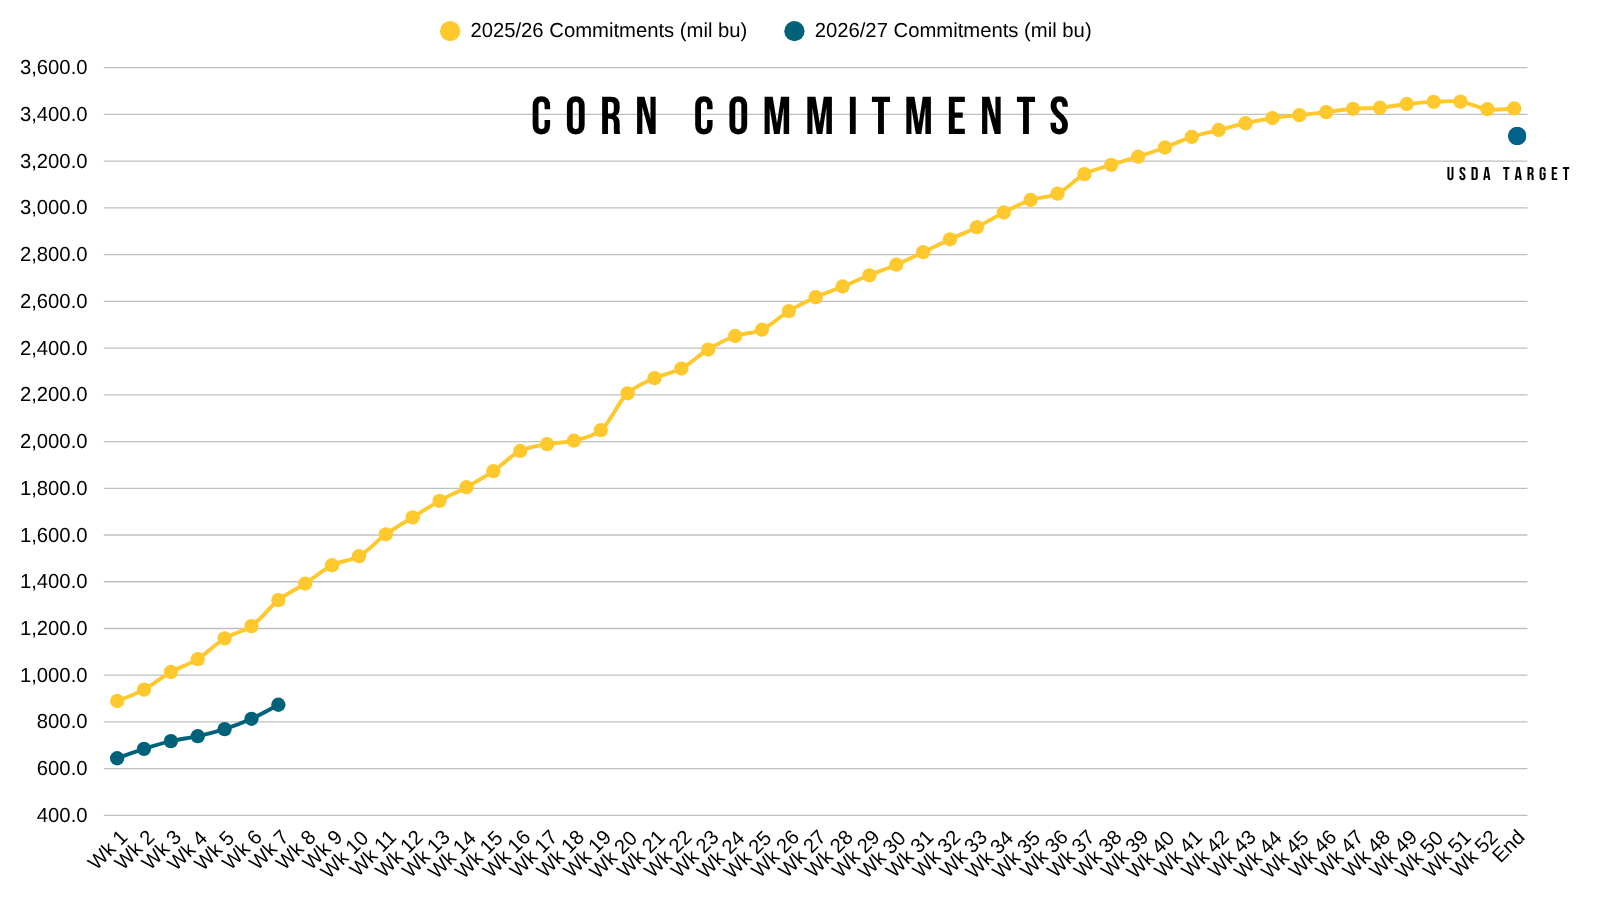
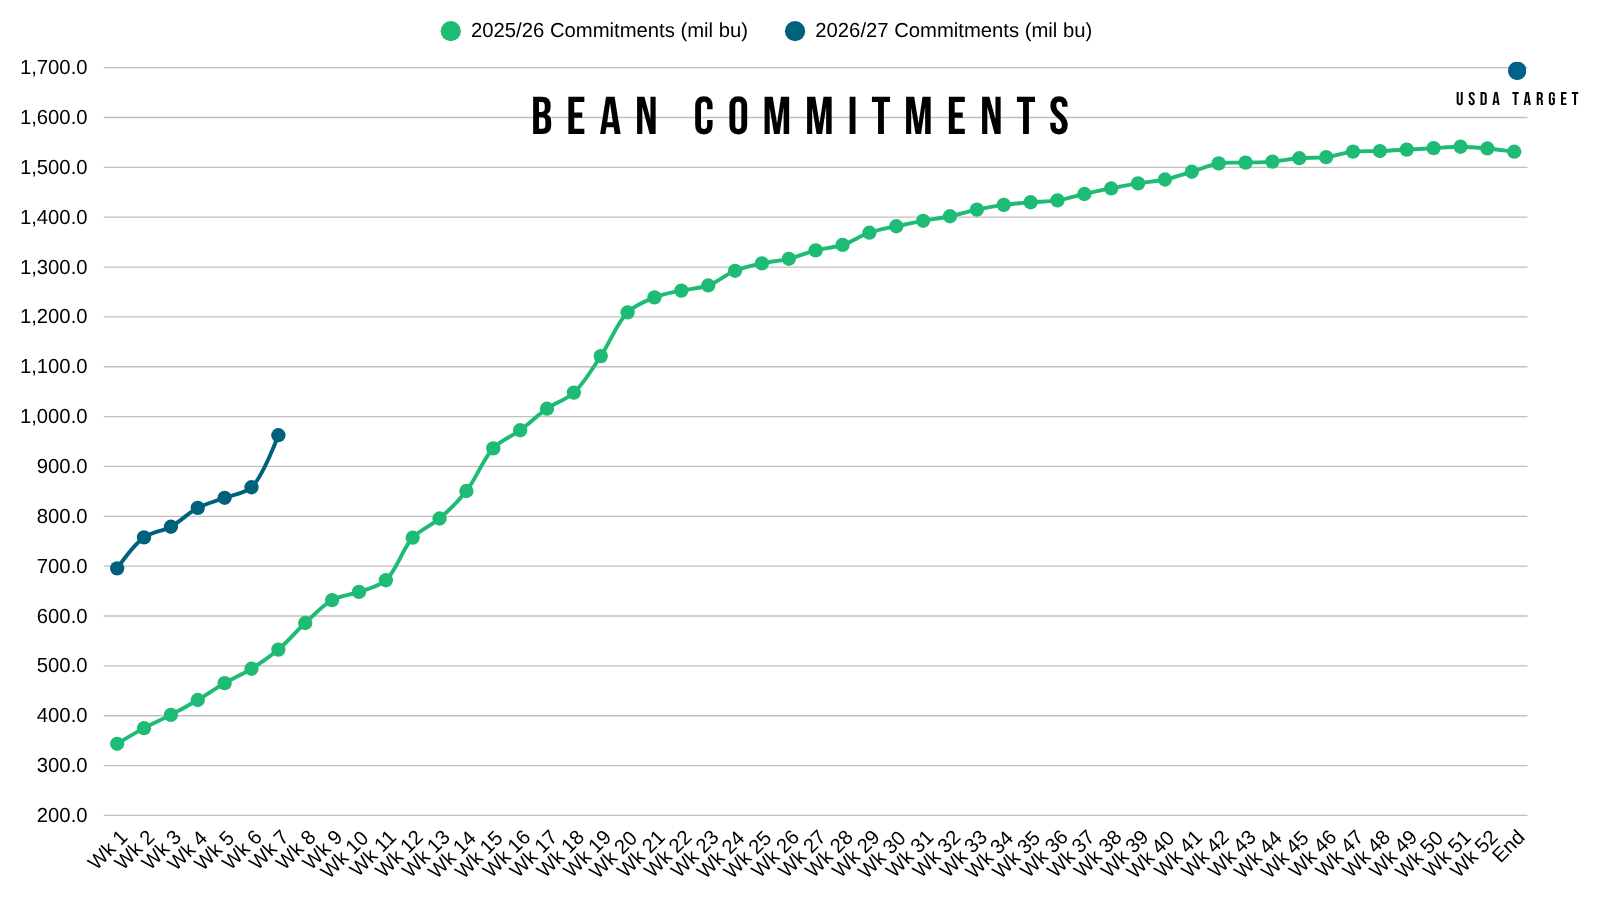
If you remember last year, soybeans exports were awful at the start.
Since elevators only have so much.
Last year we weren’t shipping very many beans, instead it was corn.
This year now that China is in there, we are gonna ship more beans until the places in the PNW switch to corn.
In January we're going to be shipping more corn when soybean business slows down and Brazil comes online.
We can’t do a big number of both at the same time.
If you look at the July to Nov/Dec spreads for 2027, corn has a 10 cent carry where as soybeans have a 60 cent inverse. So there is more demand for soybeans up front.
Last year we just had an unusually fast start in corn because we weren’t doing any business in beans.
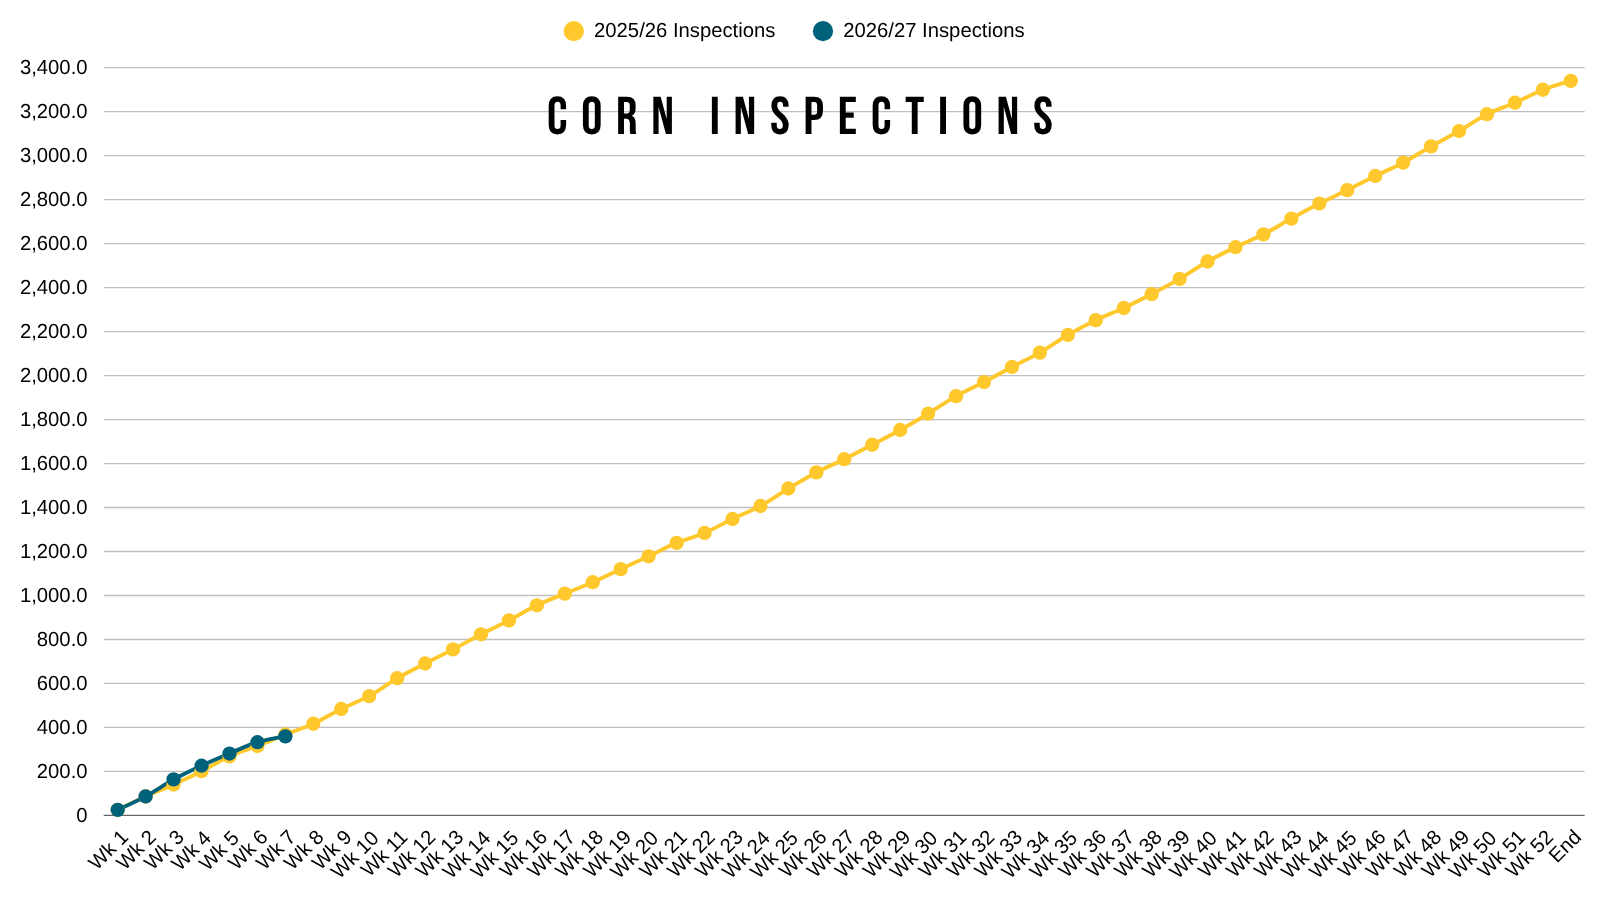
If you look at our export inspections, we're still right on pace with last year currently.
Corn vs Crude:
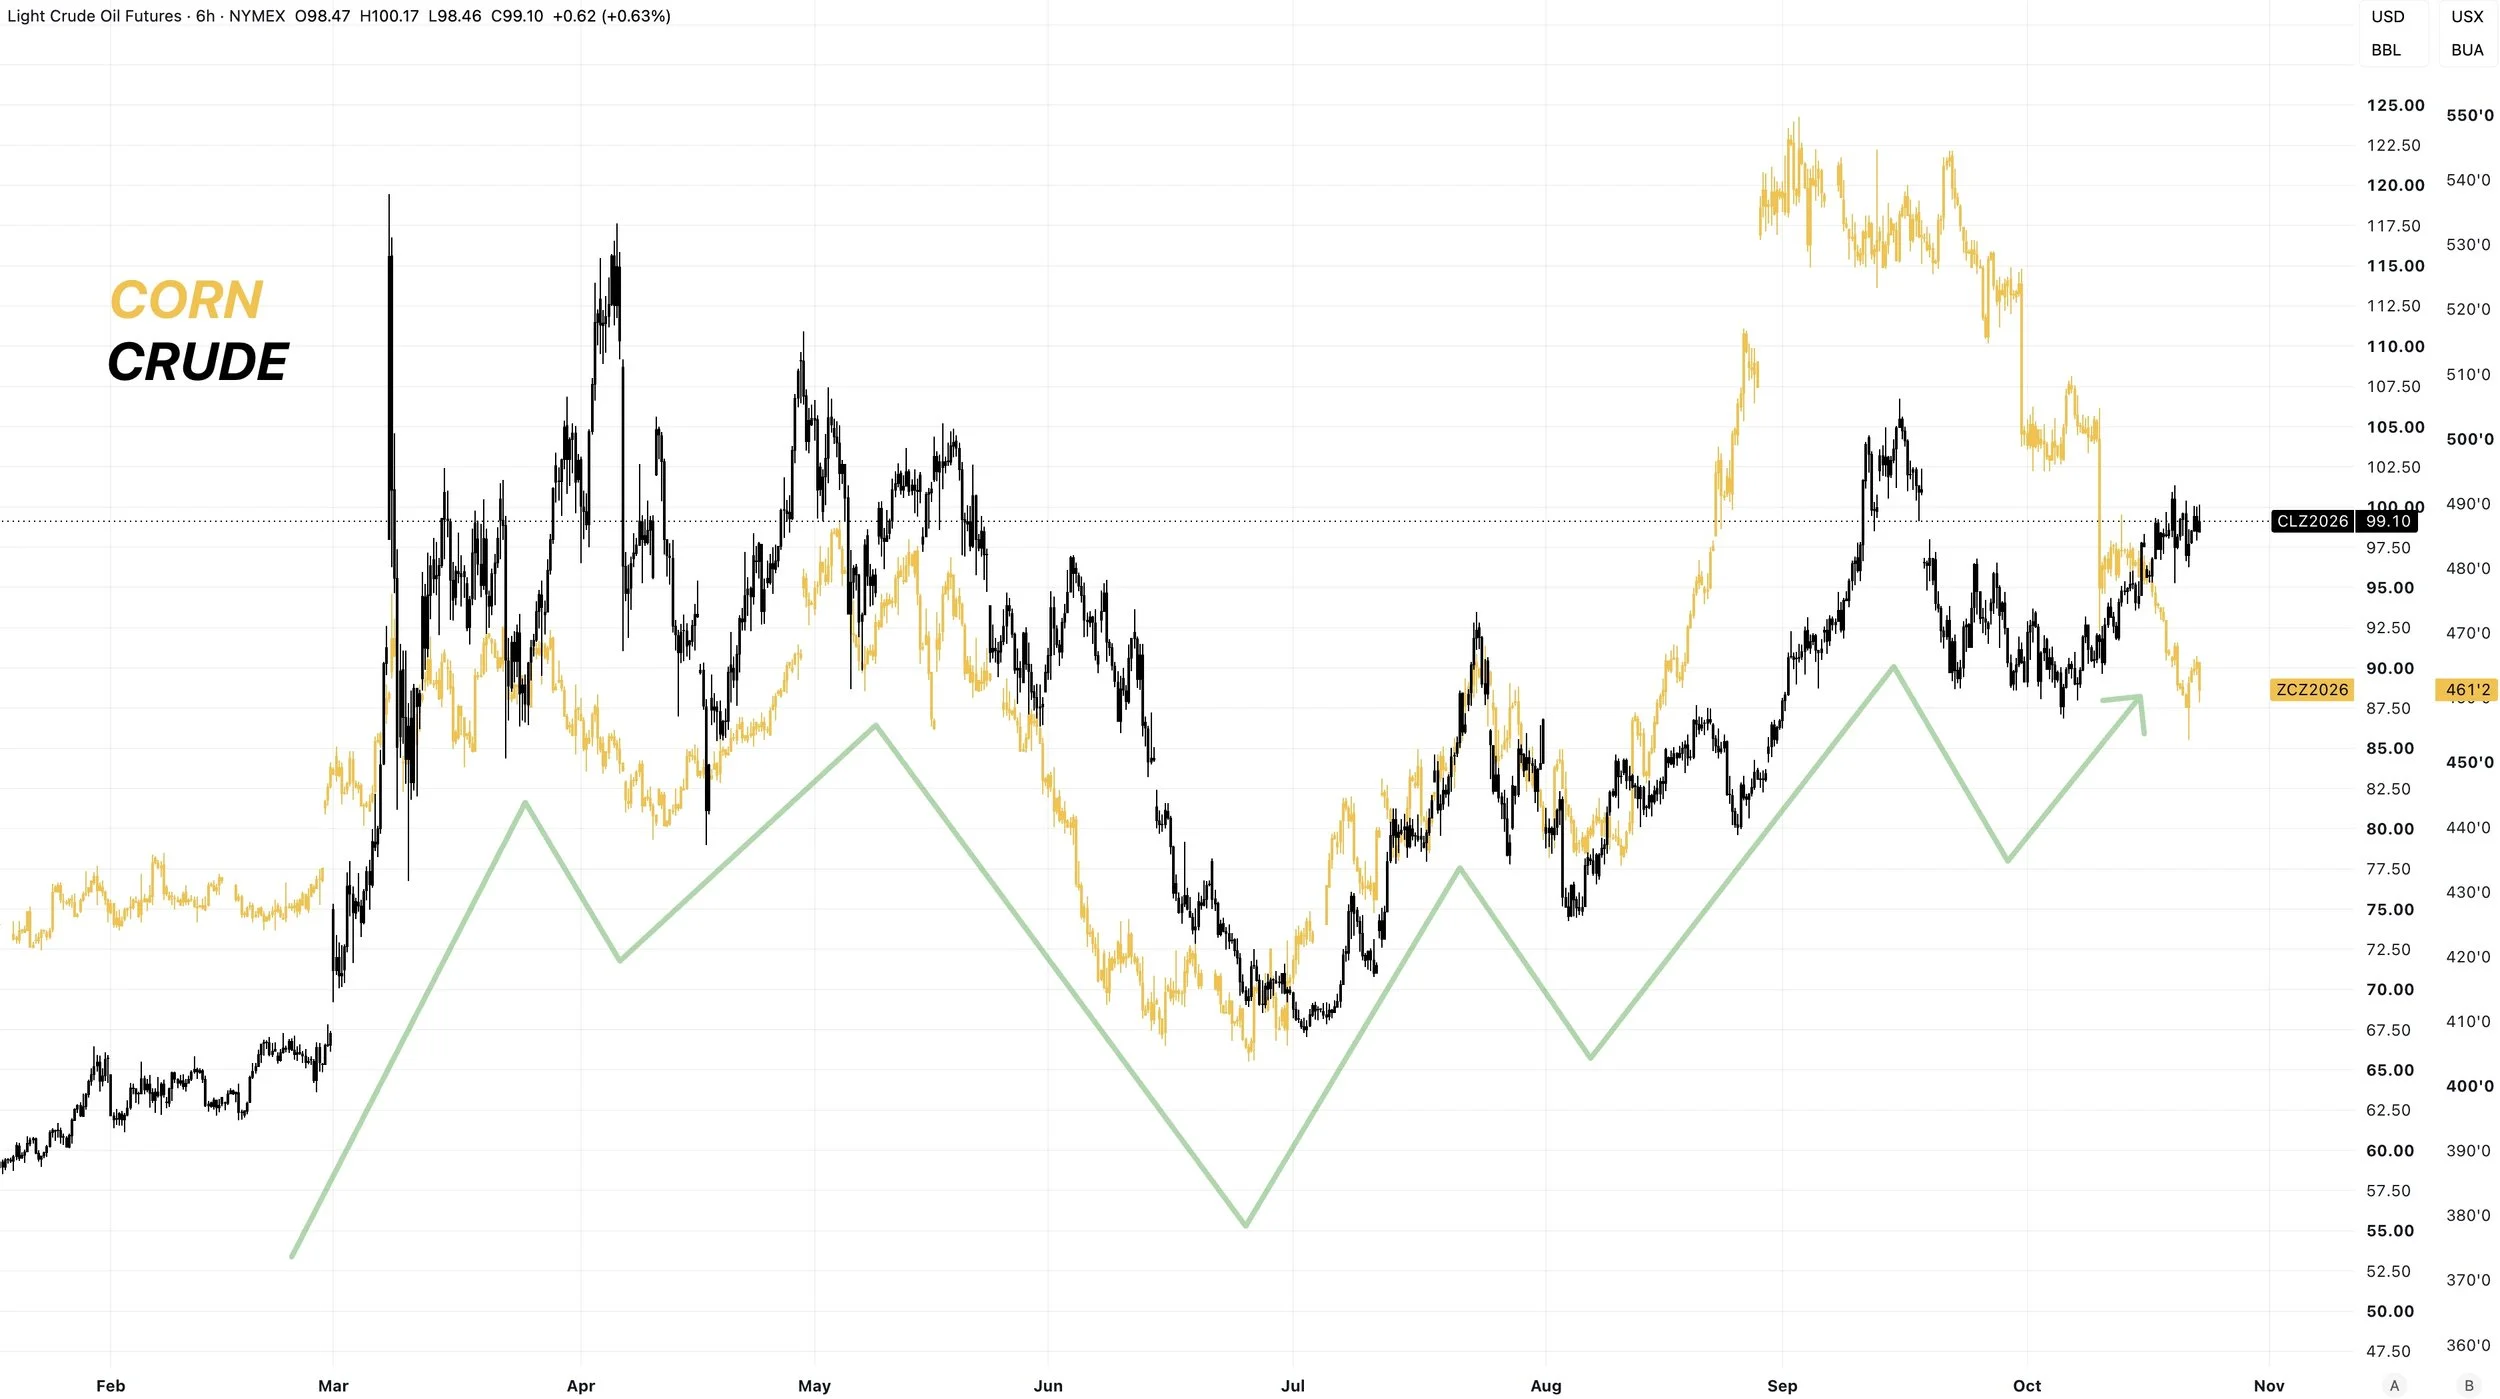
Corn and crude oil have followed each other to a tea virtually all year long.
Right now crude has been running while corn has been falling. This is the biggest divergence we have seen between the two all year long.
If crude stays elevated up here around this $100 range, it's not going to be a bearish item for corn.
Bottom line, yes corn lacks a catalyst to go tremendously higher right now.
If the balance sheet is tighter, the market doesn’t care today.
But that does not mean the corn story is "dead". Long term I still see plenty of scenarios for more opportunities into next year.
I don’t think the crop is as large as the USDA claims it is, but that's not what the market is trading today.
Short term, we are at an intriguing spot on the charts, so let's look at them.
Charts
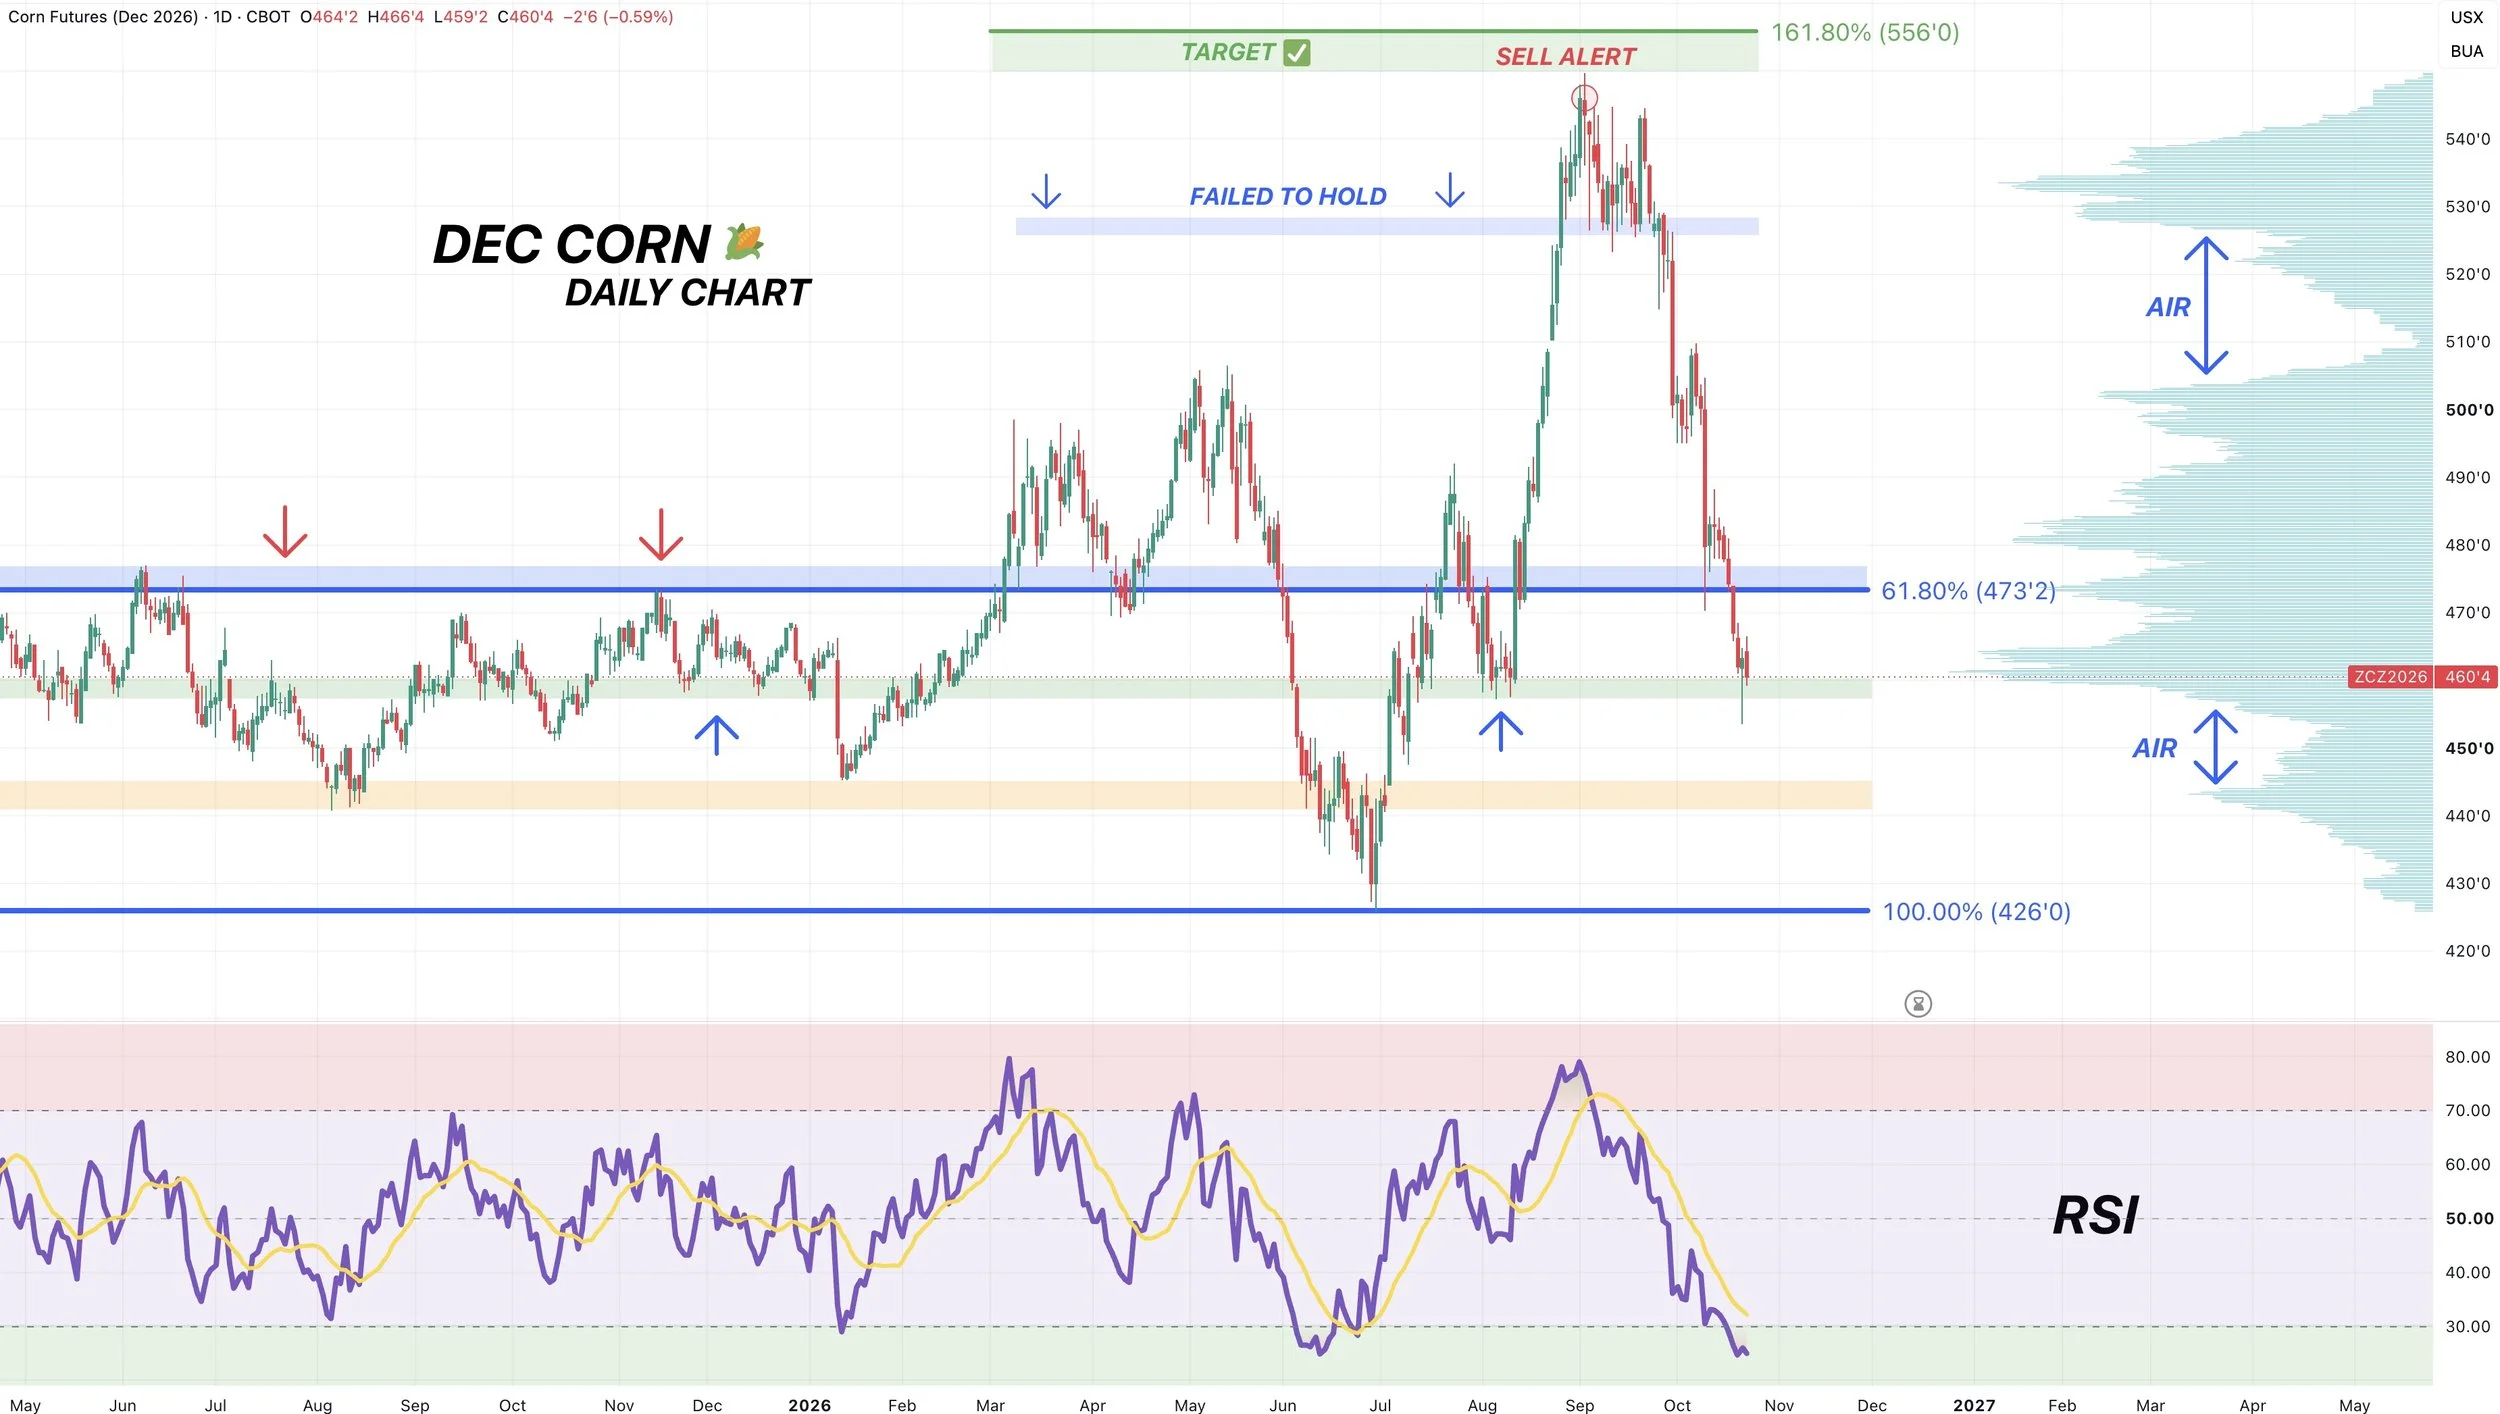
Dec Corn Chart:
Yesterday was an impressive day for corn, although we did not follow it up today, we didn’t do any damage today either.
Yesterday we broke below the August lows, we then reversed +9 cents off the lows and closed green.
So the market broke key support, hit everyones stop losses, and then reversed higher.
This happened at a pretty significant level.
This would be the August lows and the bottom of that old range from last year.
We are also sitting at a massive shelf of volume we'd like to see act as support.
Given this is viewed as support, we do like the idea of re-owning down here.
We sent out a buy signal yesterday for both corn and soybeans if you missed it.
Link to Alert: Click Here
We do have to be mindful that there is a large gap of air to the downside if we fail to hold here. But for now, this is viewed as support.
Yesterday's candle was optimistic, but didn’t 100% confirm a bottom. We need to see this market get some follow through before getting too excited.
3-Day Chart:
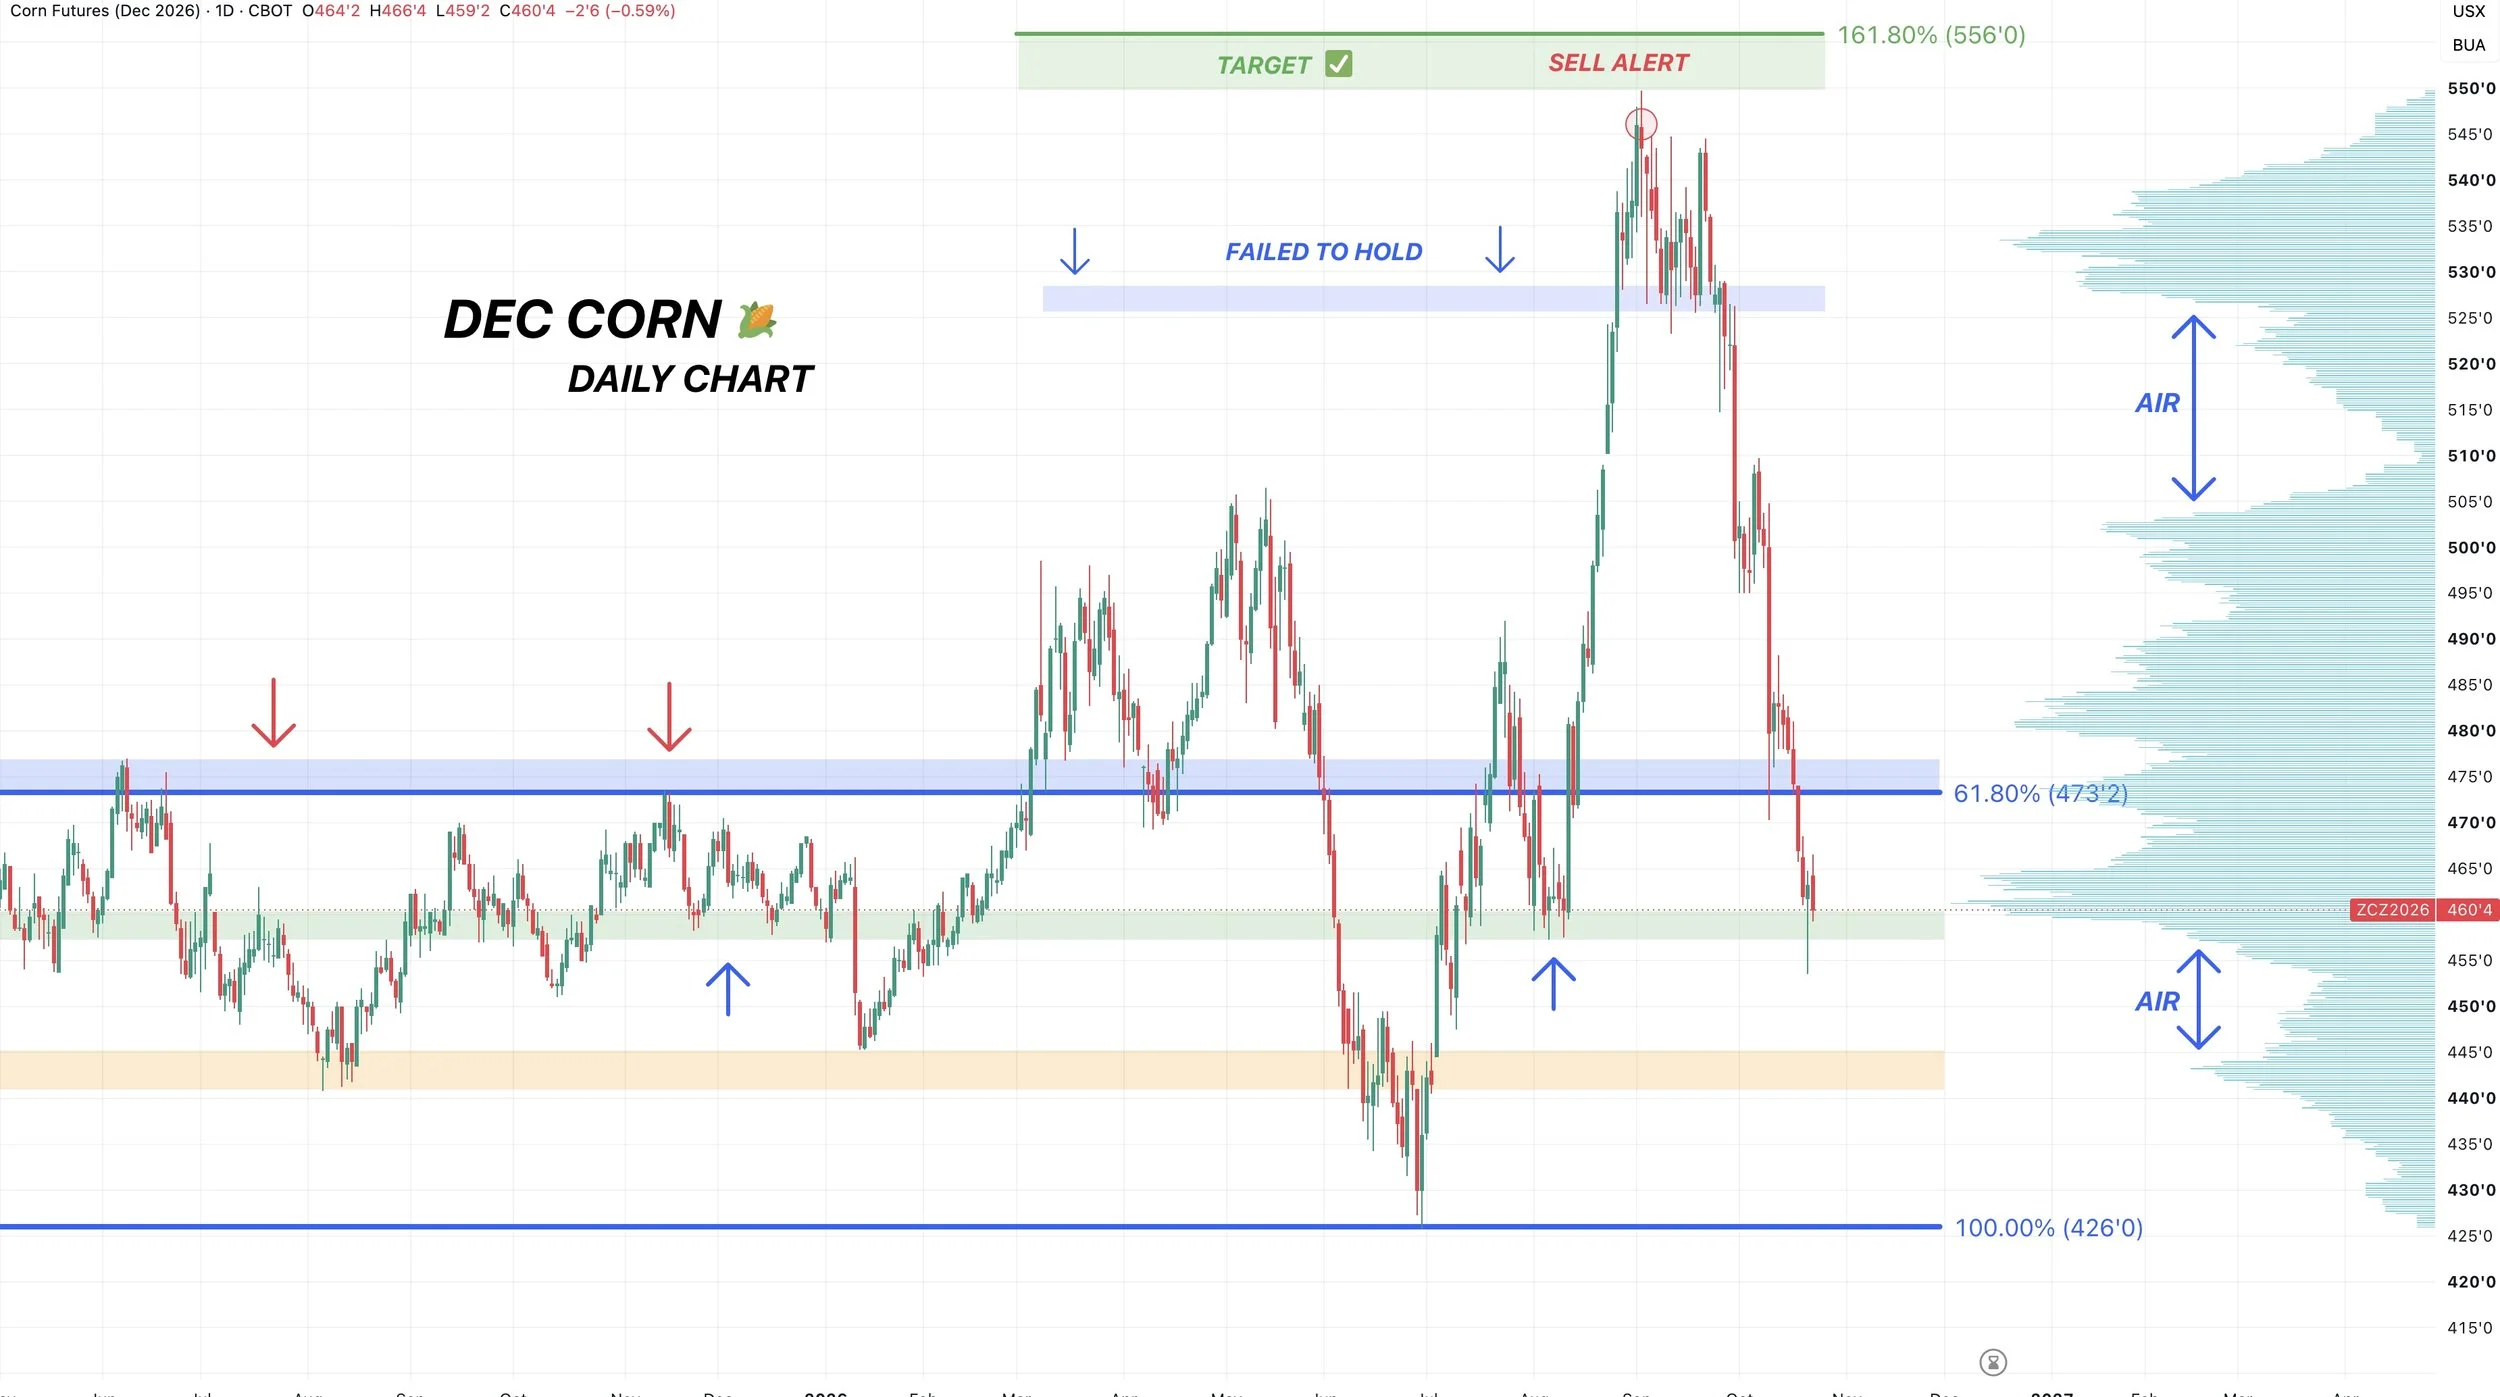
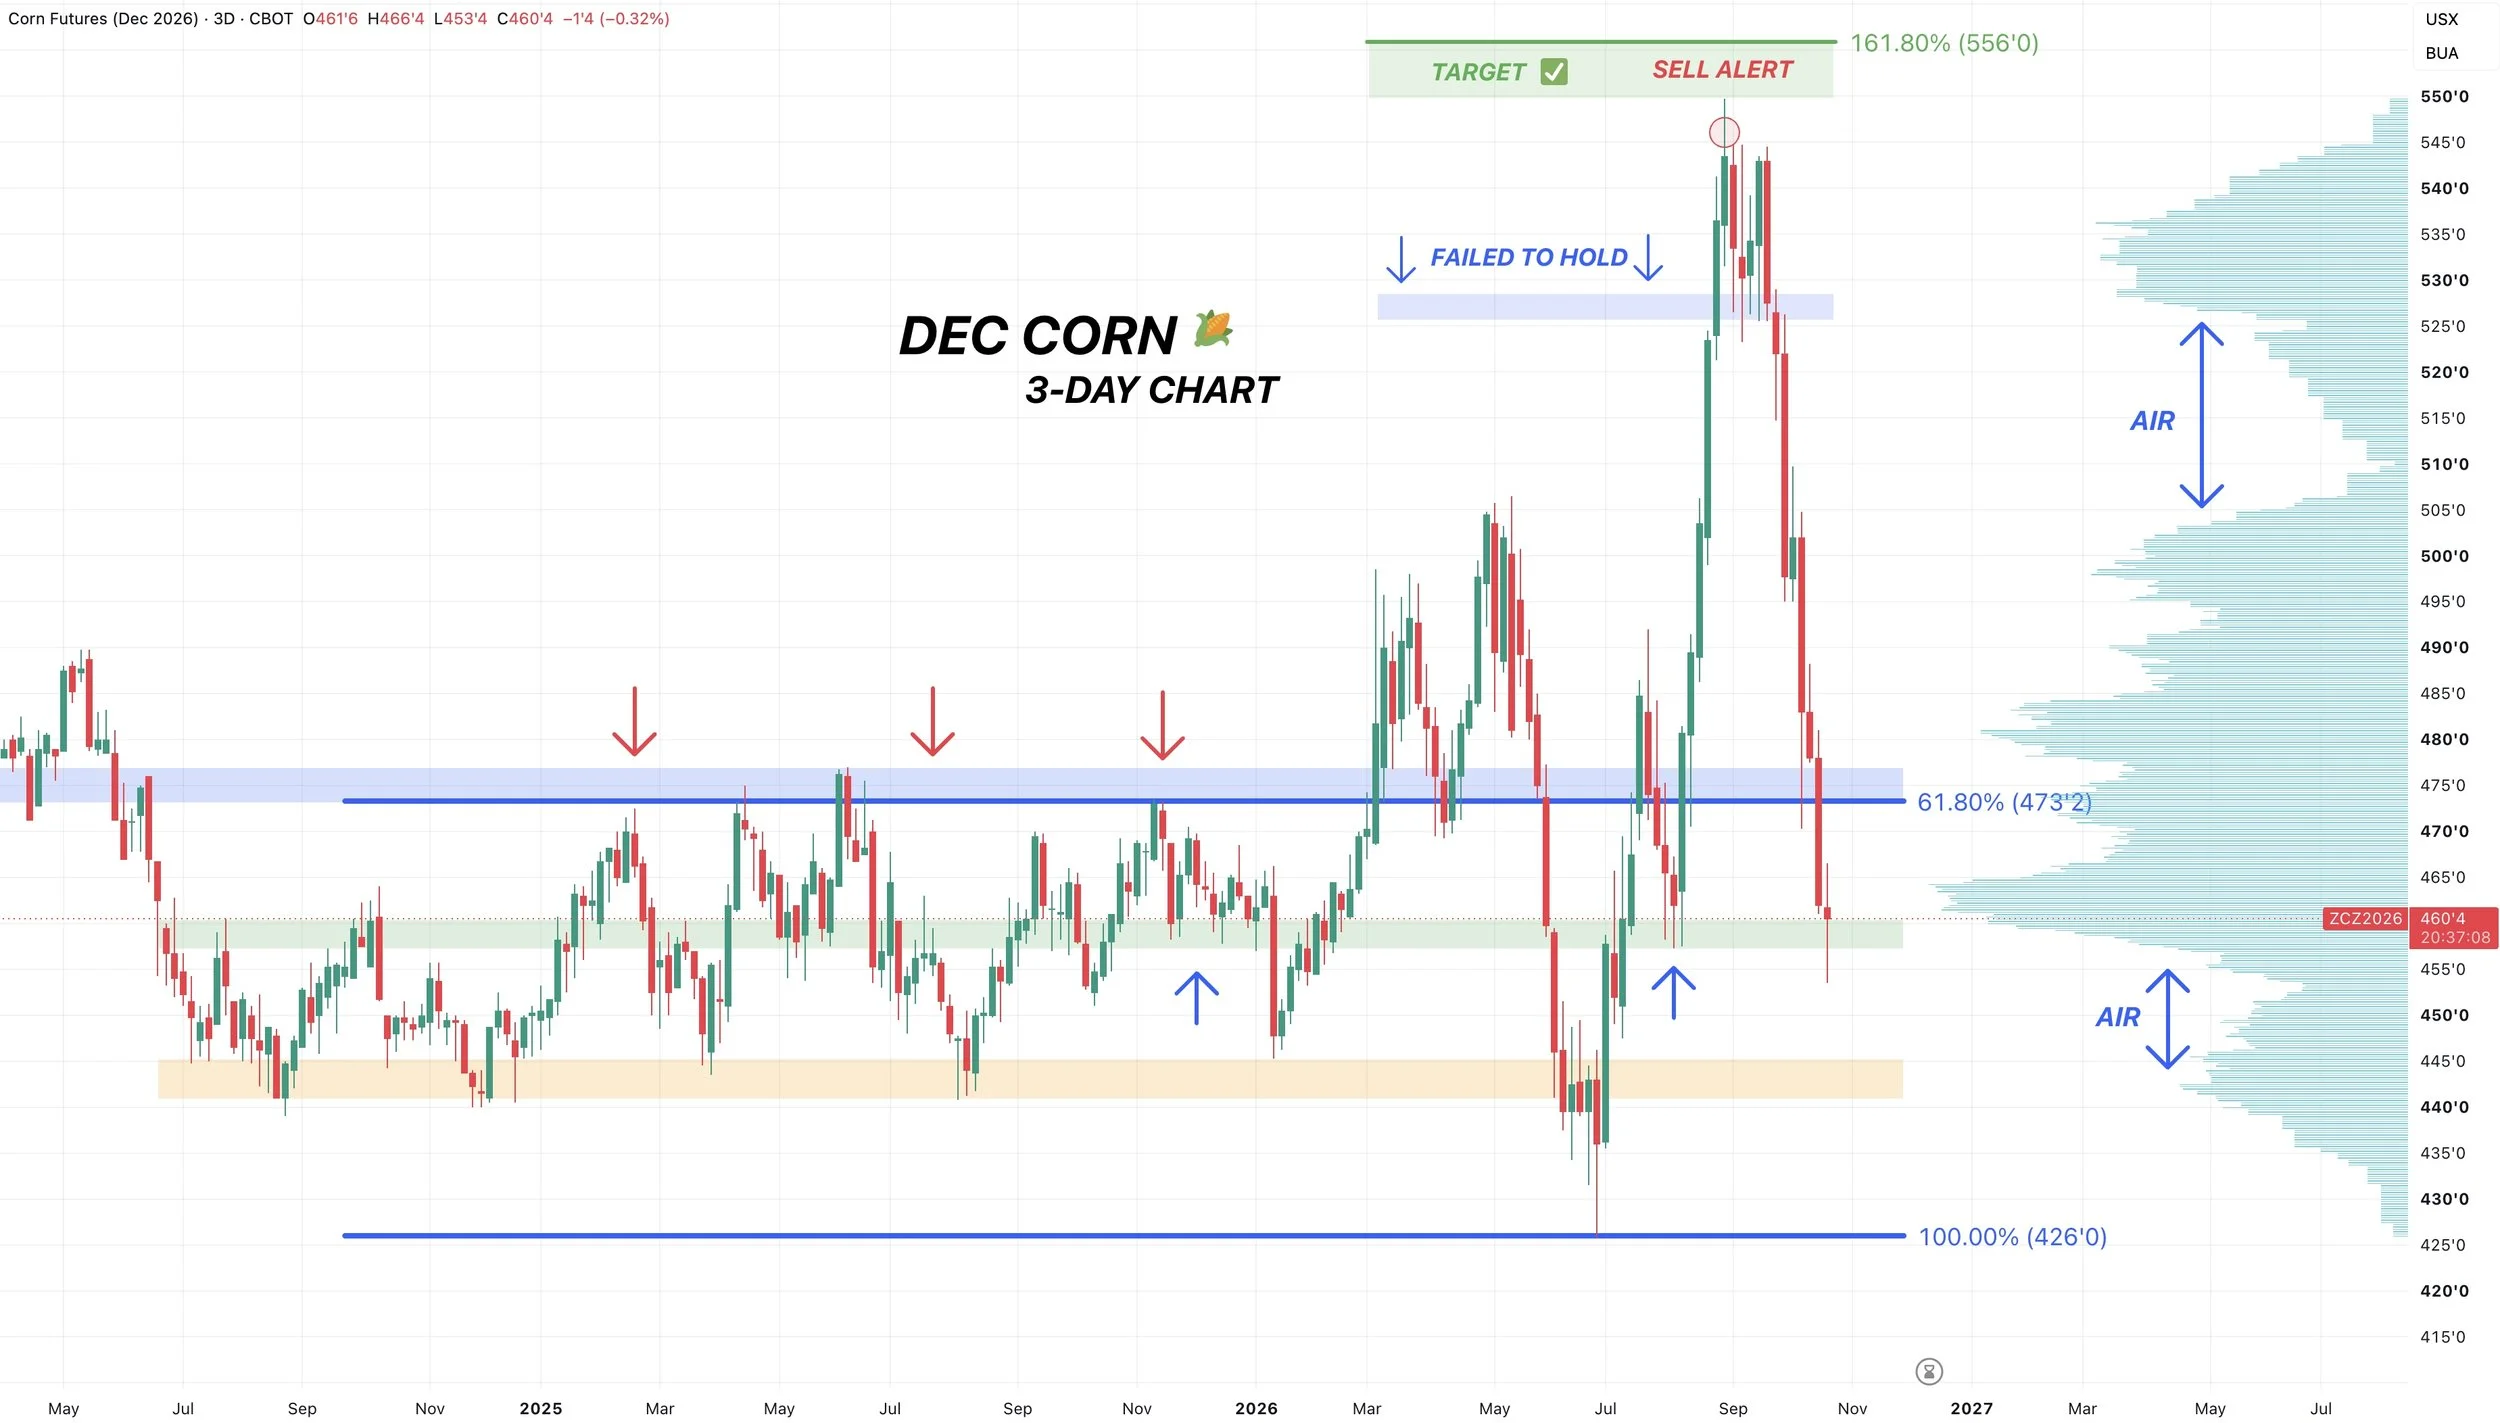
The 3-day chart helps simply things.
As it clearly shows the key levels.
We broke below the blue box and the top end of that old range from last year.
As a result we've now came down to test the bottom of that range.
Once again we have this huge volume shelf that we want to see hold as support. Personally, I would like to think we can hold this area.
However, failure to hold here would result in us dropping towards the orange box. Which is your risk from here. If you notice, there is a big gap or downside air below this support.
RSI: Extremely Oversold
Yesterday Dec corn did hit it's most oversold levels ever for this contract.
This alone does not confirm a bottom, but being this oversold at some key support isn’t the worst sign.
I am not expecting a face melting rally here right away, but I'd like to think the bleeding is almost over.
Front Month Chart:
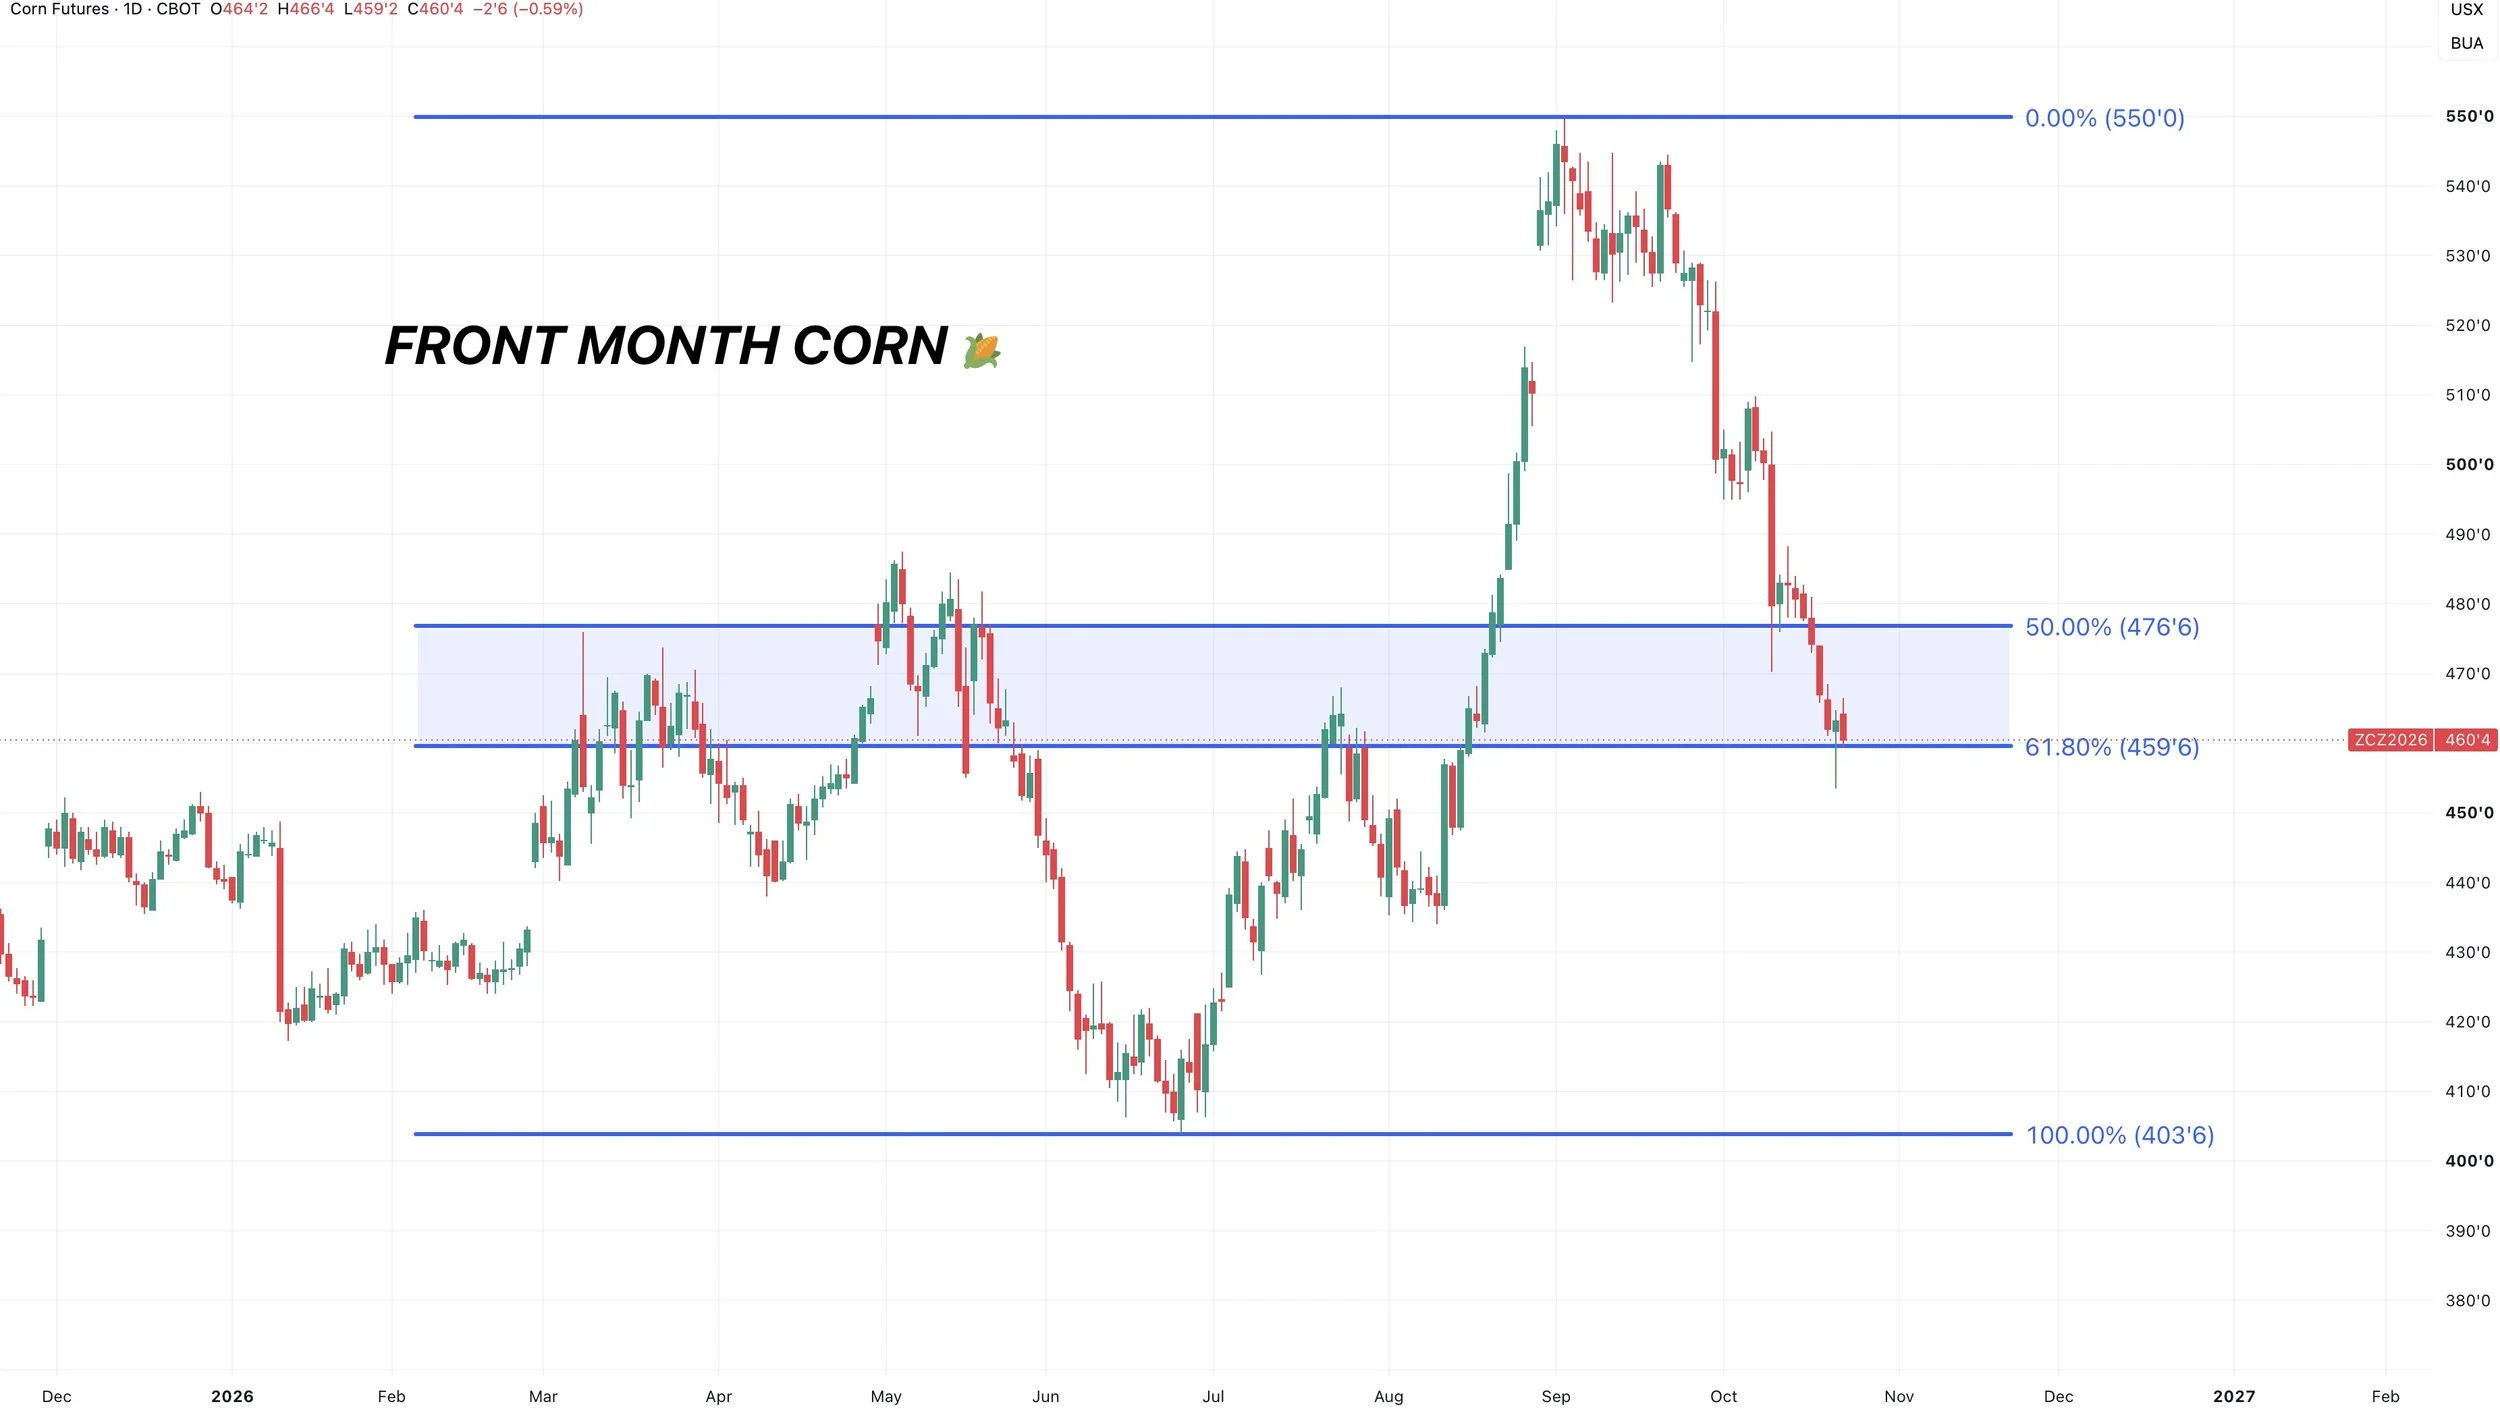
If we look at the front month chart, this also makes this area a big point of interest.
We always talk about the 61.8% retracement level. Aka the golden fib. We failed to hold it on the Dec contract.
But on the front month contract, if you take the yearly highs down to the yearly lows, we are sitting right at that golden fib.
This is also just testing the top end of the yearly range.
Corn vs Wheat:
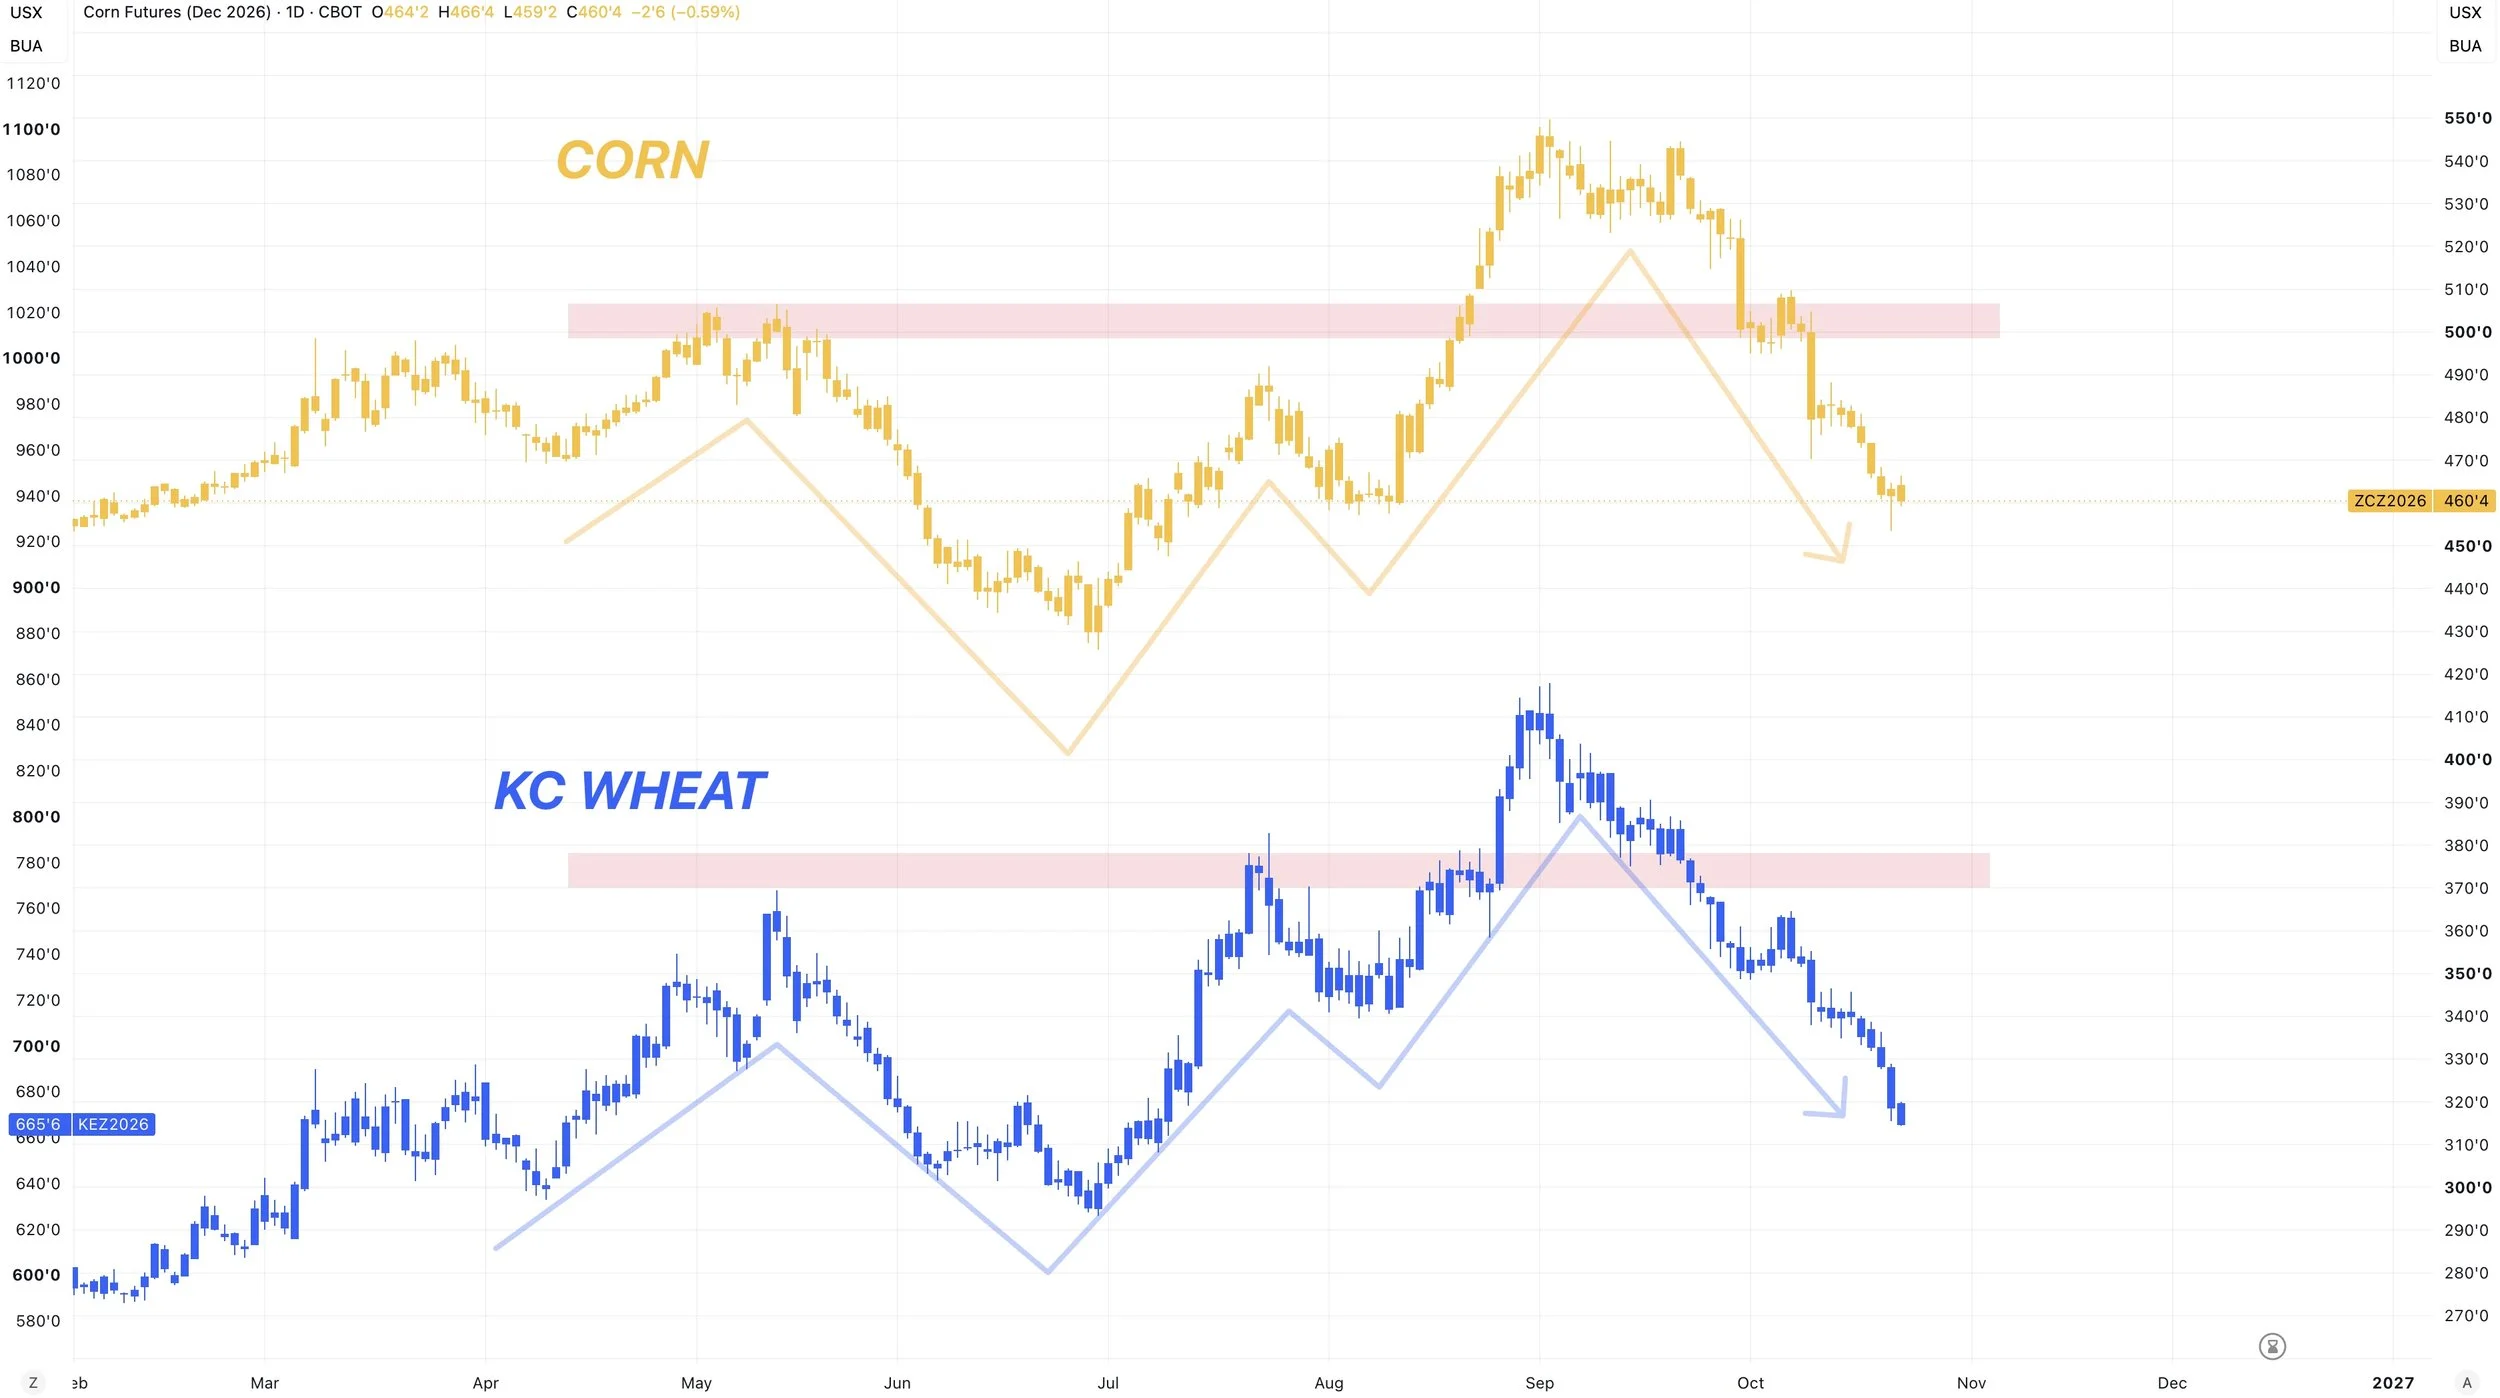
The two of course track pretty closely.
So if wheat would stop falling off a cliff, that would also go a long way in helping corn find some life.
If wheat can’t find some footing, it's of course going to make it harder for corn to gain some strength.
Soybeans
Flash Sales Continue:
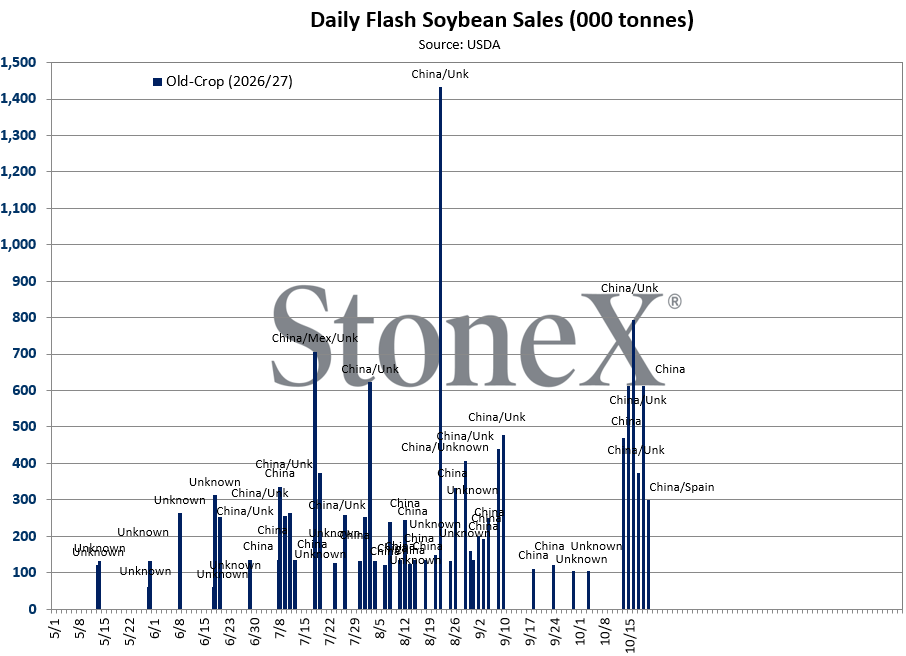
Today we saw our 7th straight day of flash sales of soybeans.
This is the longest streak we've seen in at least 3 years.
Chart Credit: Mike Castle of StoneX
Spain Value Buy?
Yesterday we saw Spain buy soybeans.
Spain has only had a flash sale of soybeans 6 times in at least the last 15 years.
Has this historically meant anything?
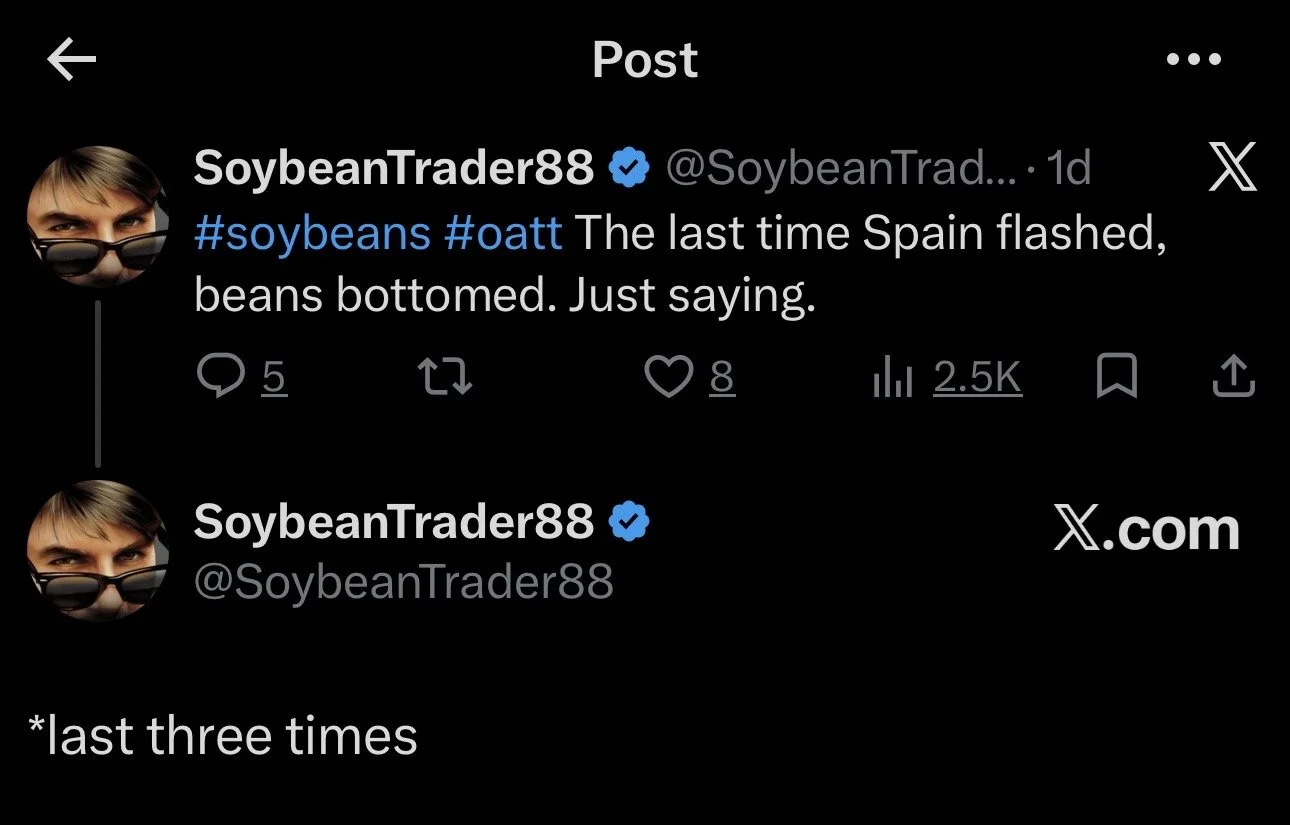
I did not originally find this data, @SoybeanTrader88 on X is the one who pointed this out, but it's some pretty interesting data.
He said the last 3 times Spain bought soybeans, it marked the bottom. So I thought I'd look into this.
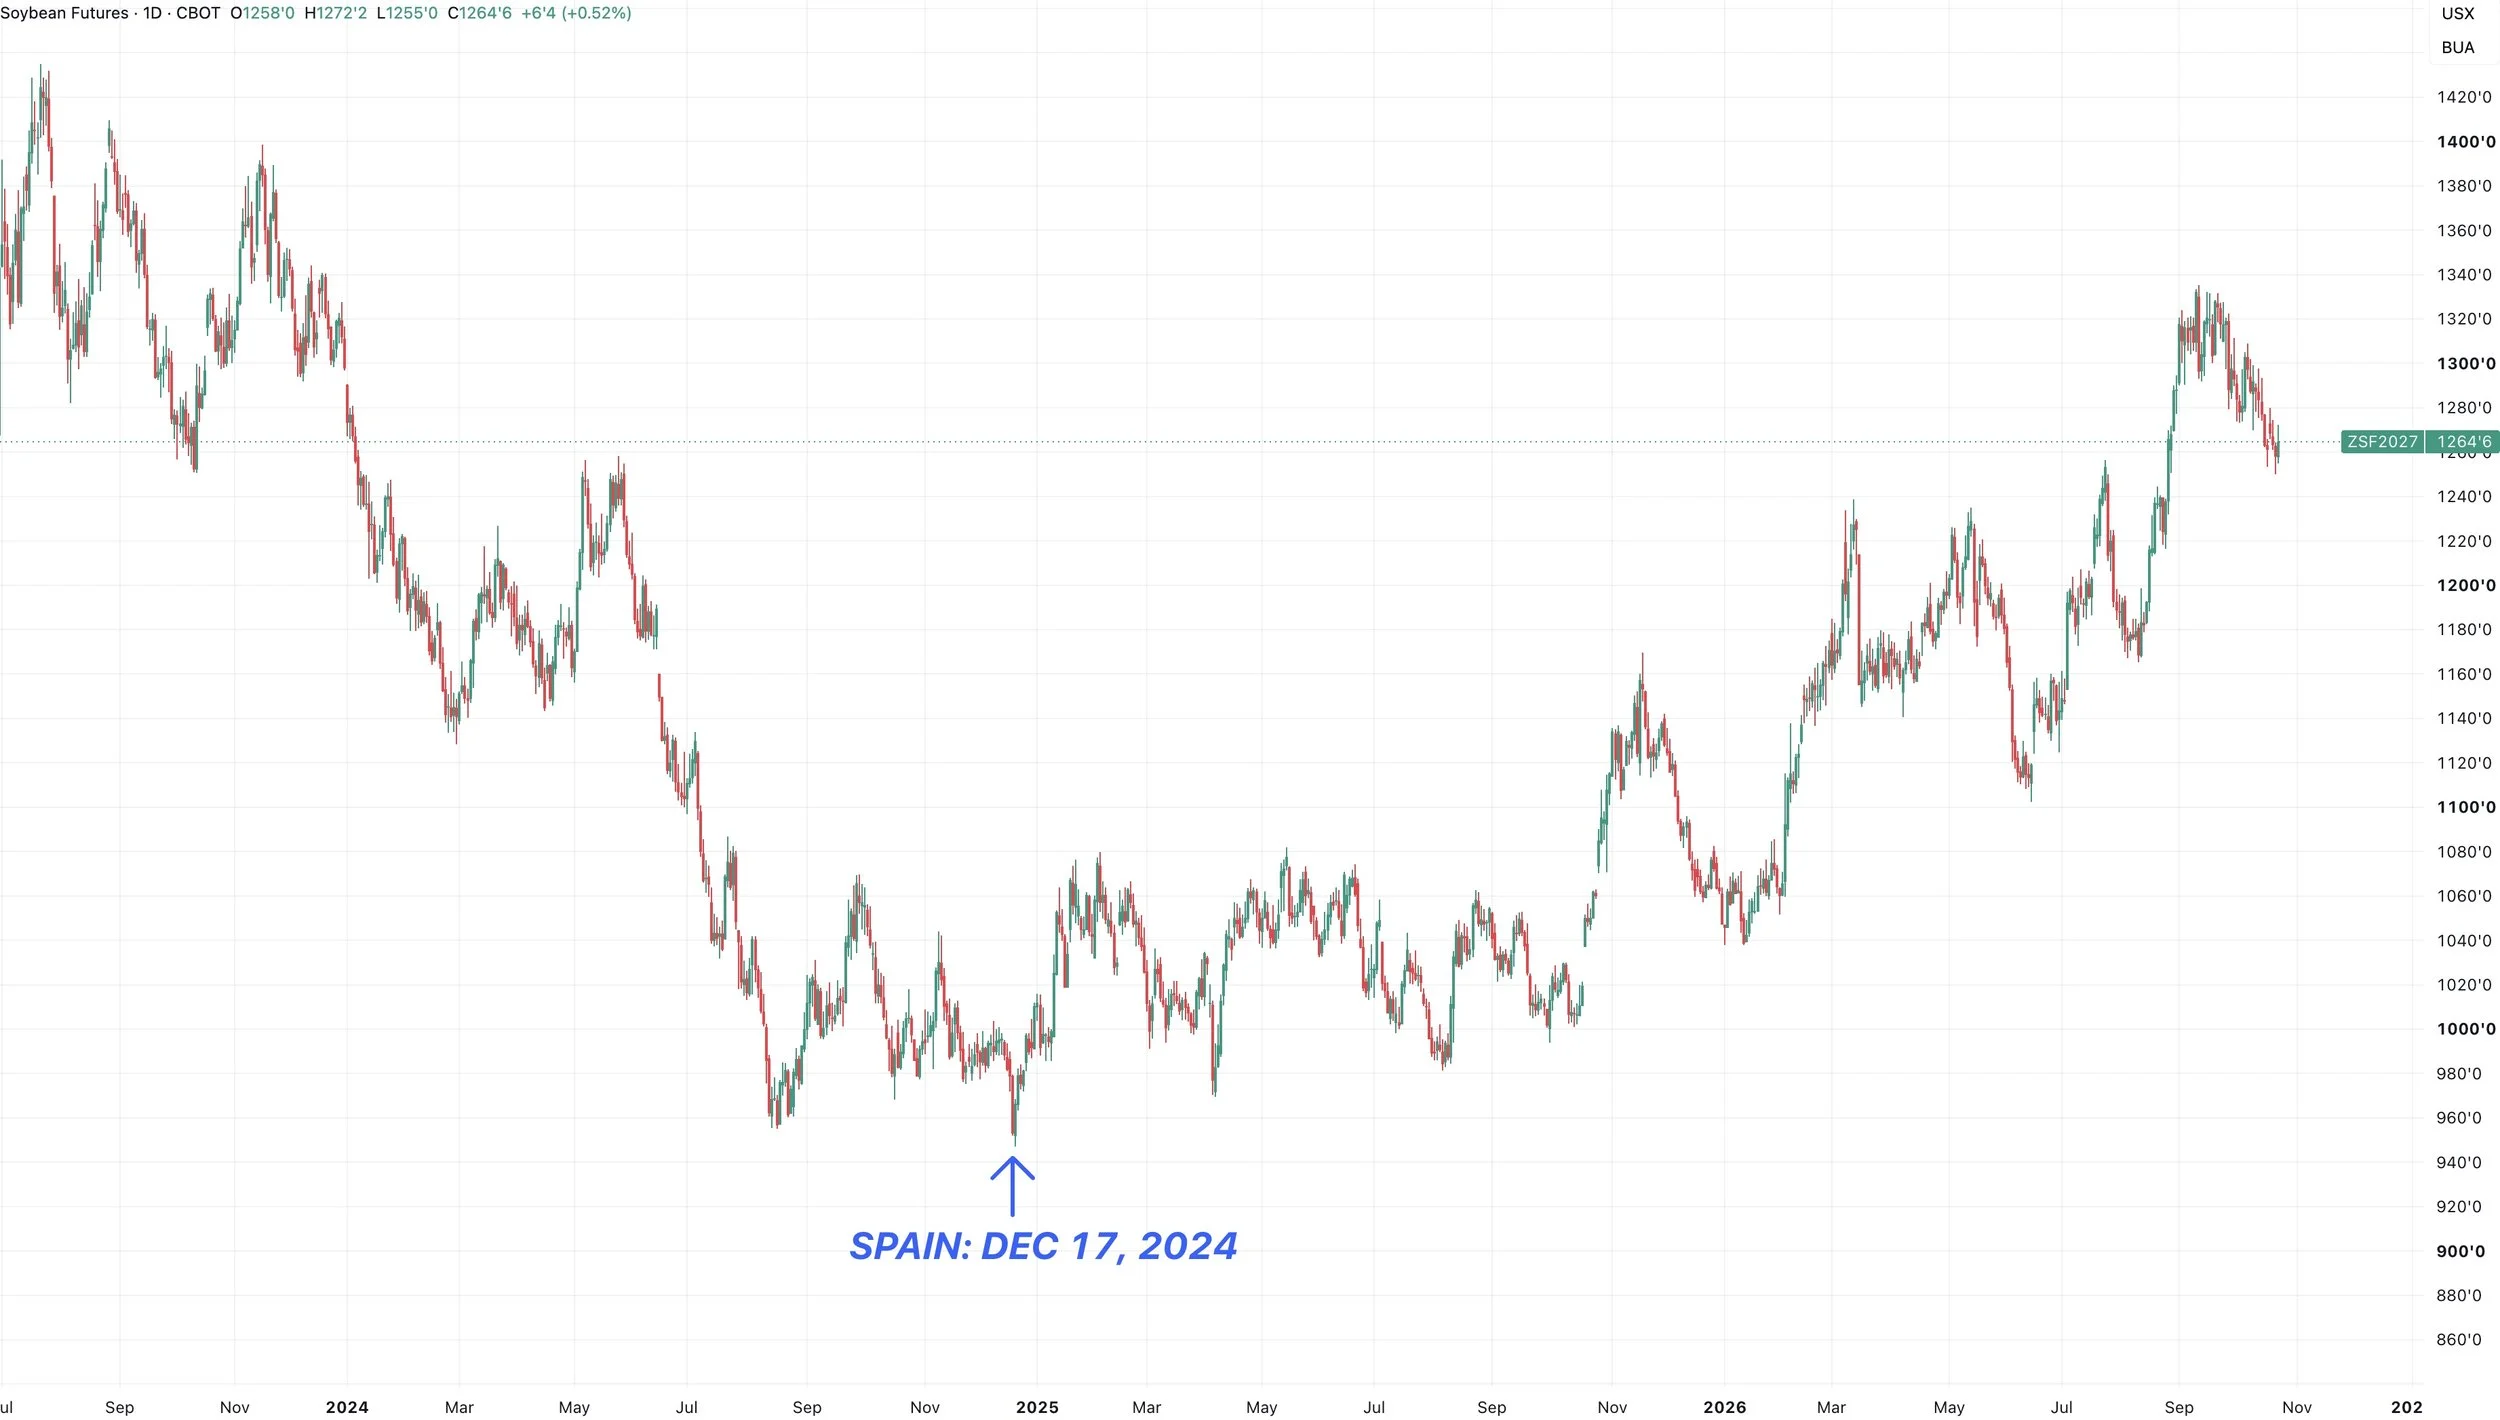
Let's look at all of the previous times Spain has bought soybeans and what happened after.
The last time was December 17th, 2024.
We posted the literal bear market lows for soybeans just two days later on December 19th. Prices have never revisited those levels since.
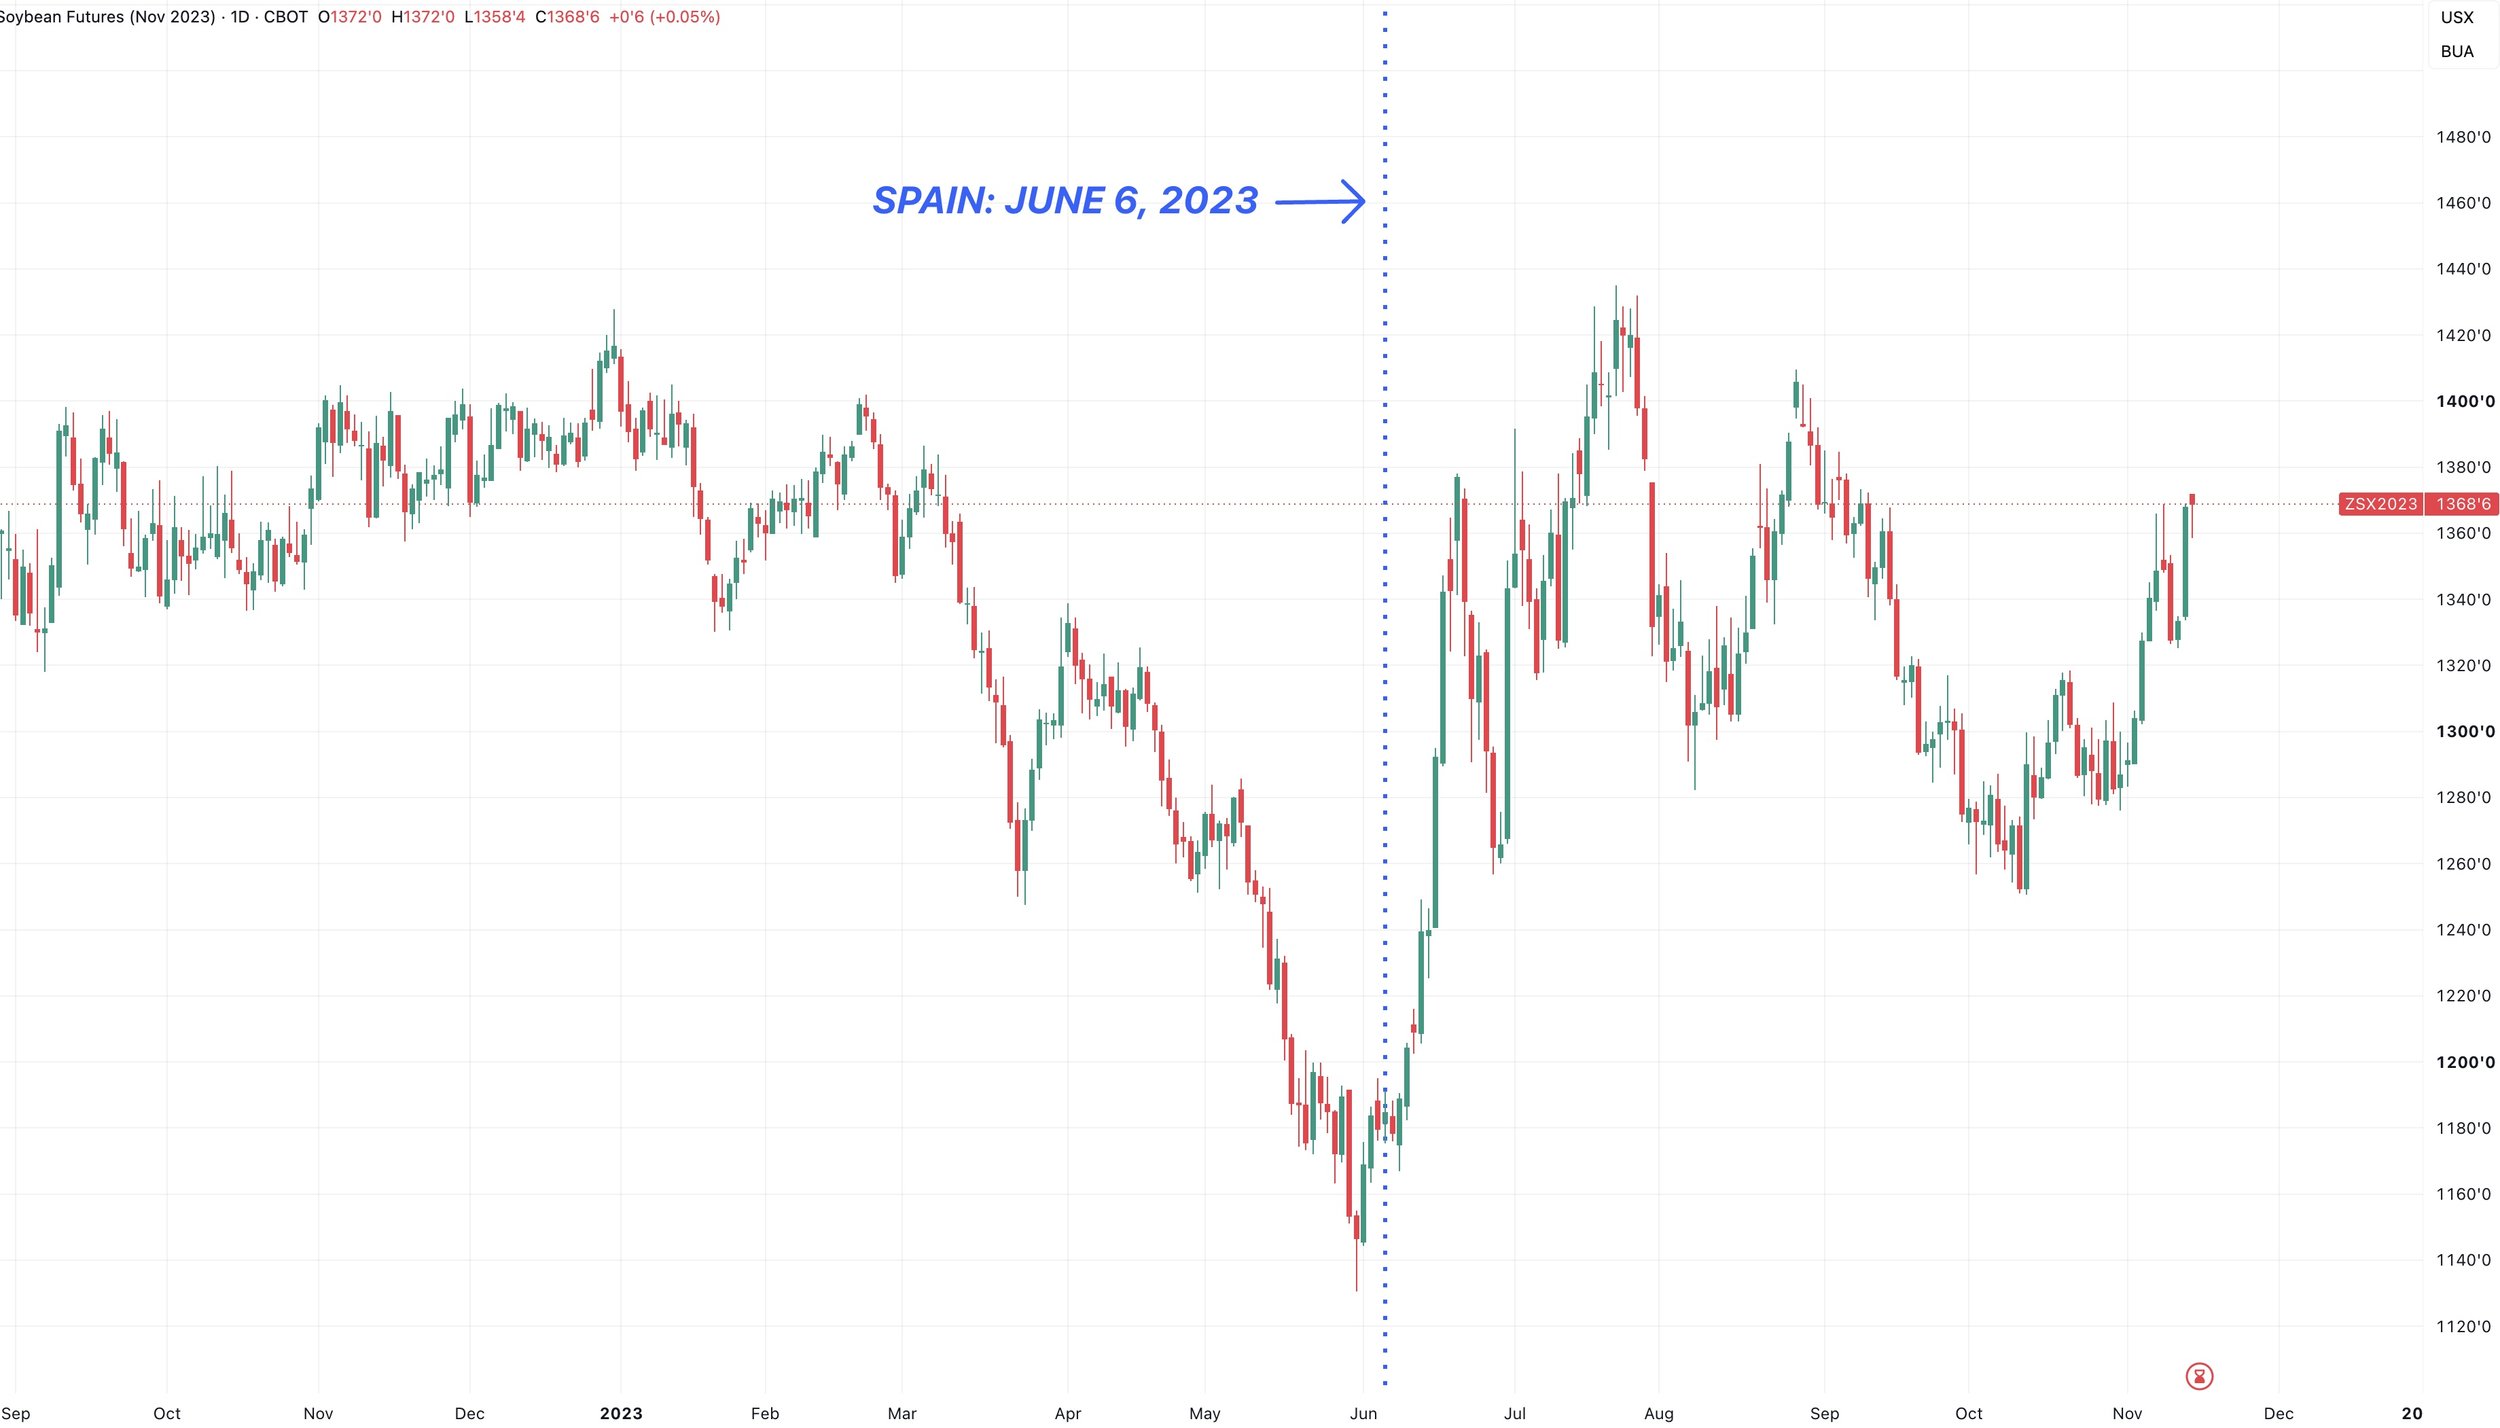
The time before that was June 6th, 2023.
Once again, it marked the bottom.
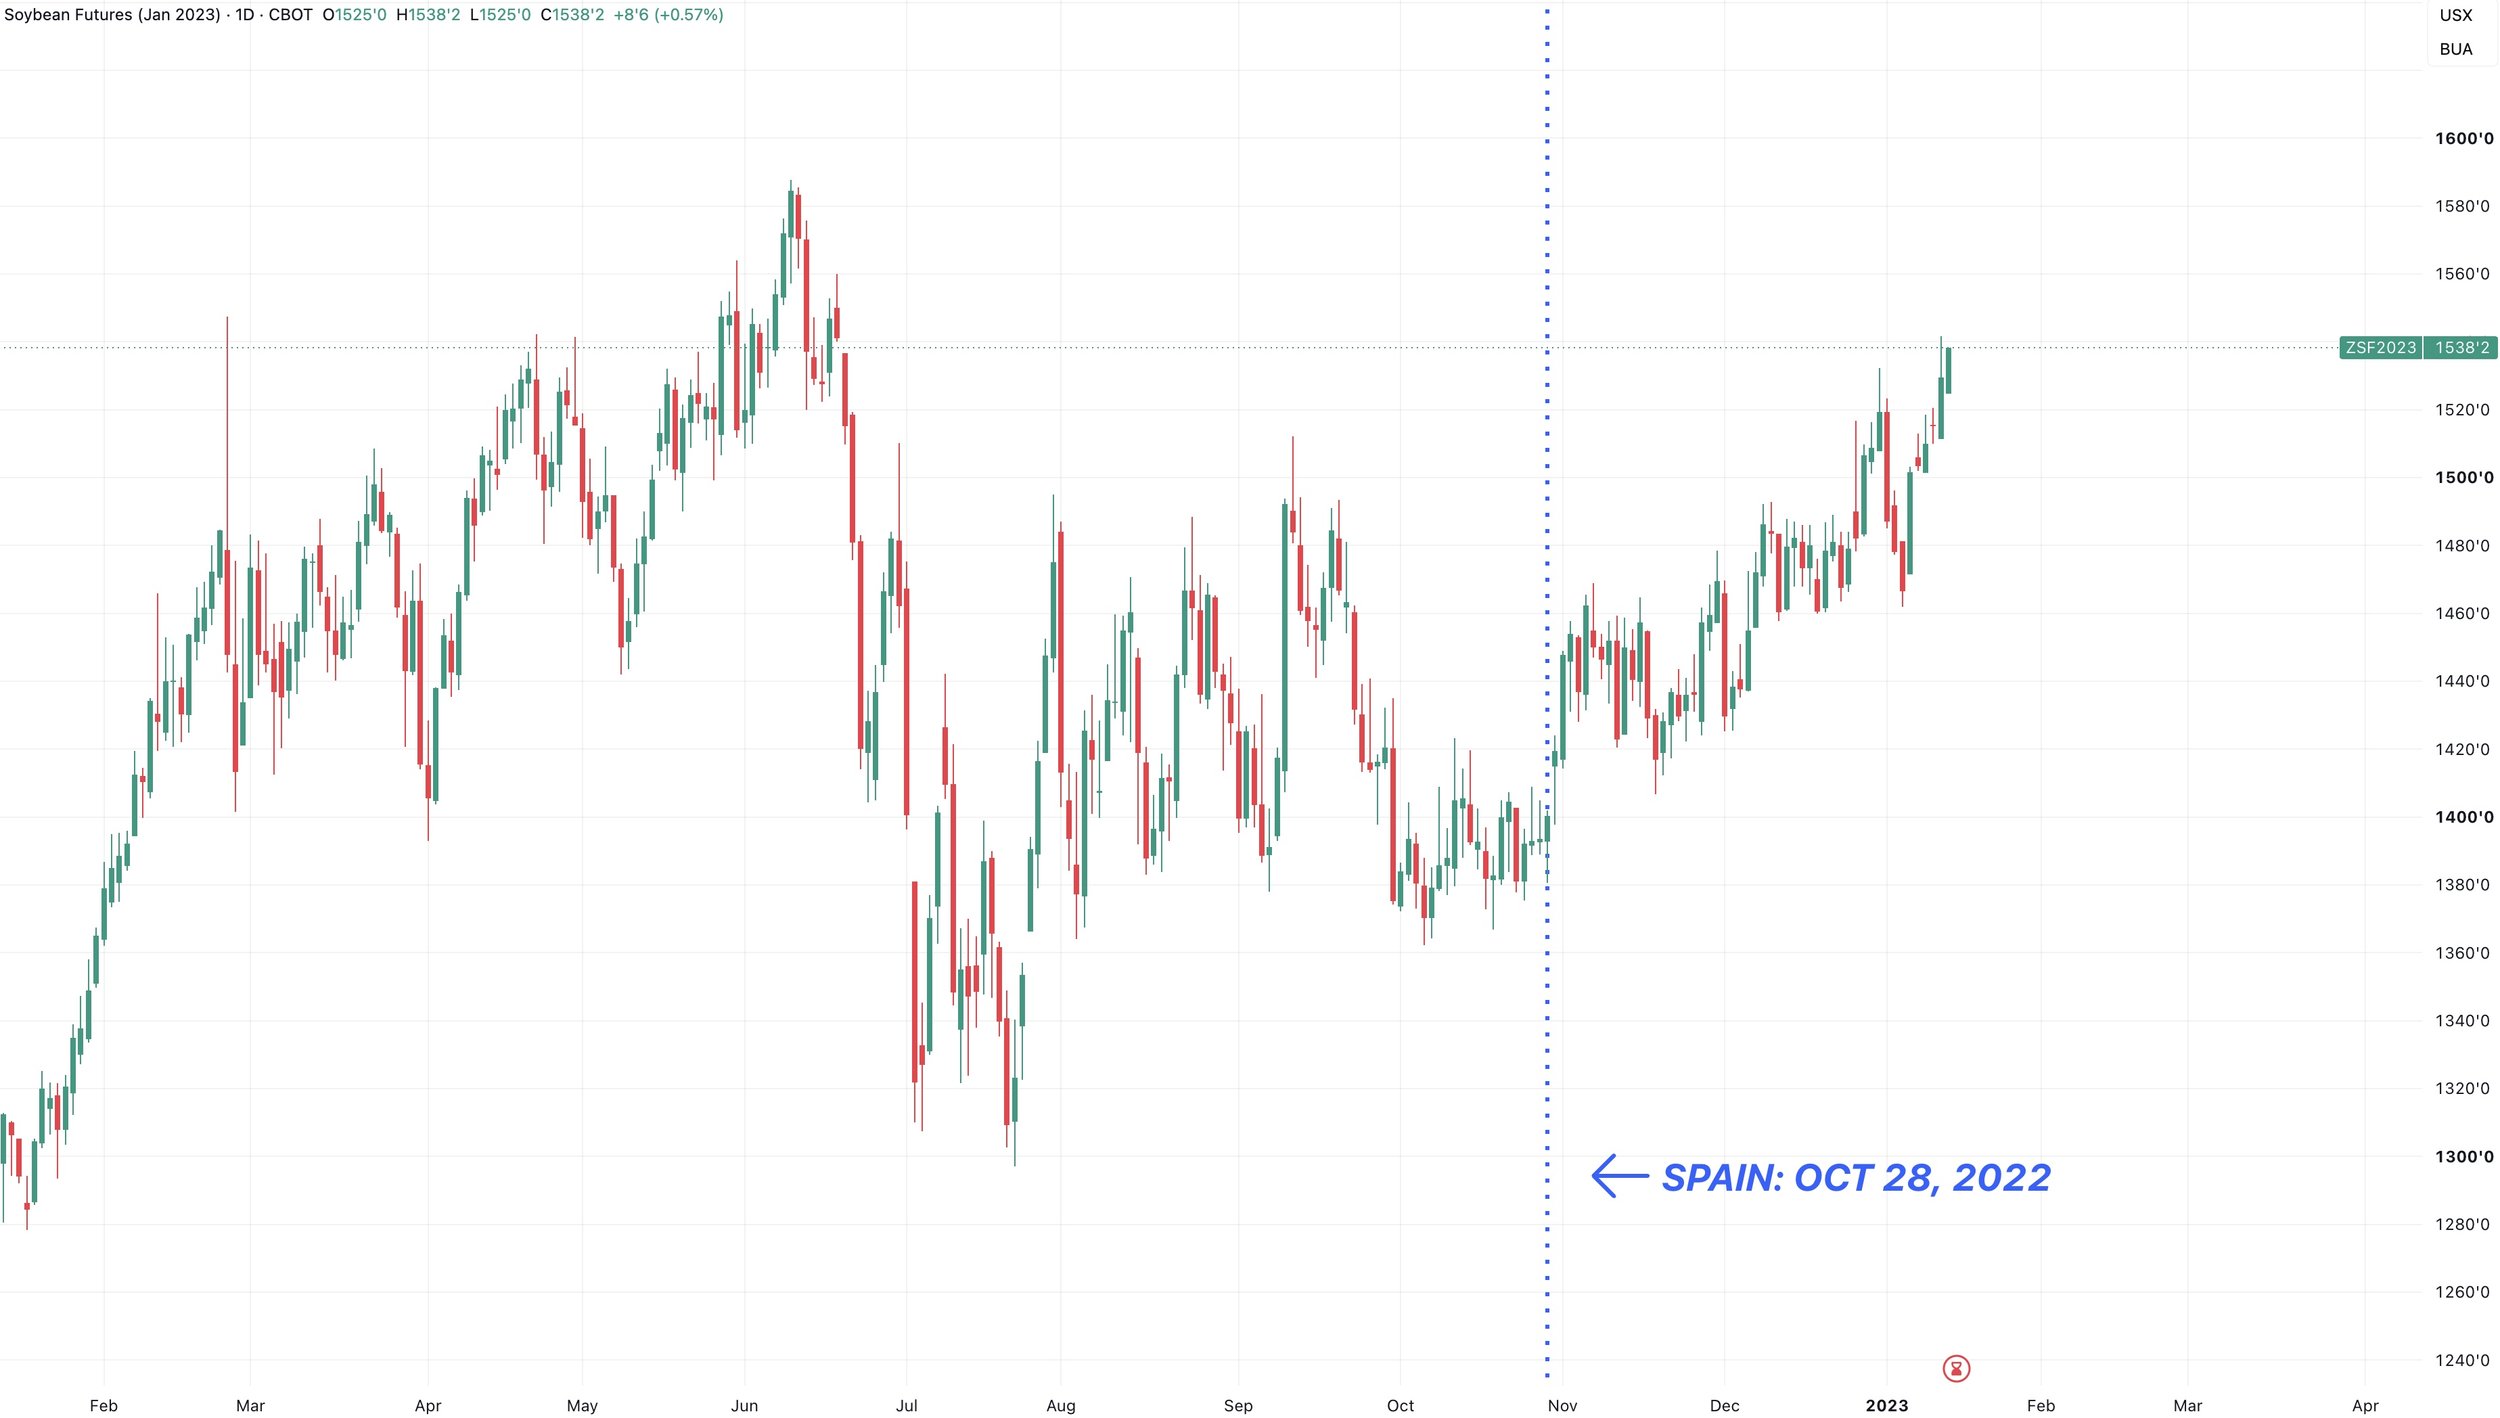
The next was October 28th, 2022.
This one in fact did also mark another low for this market.
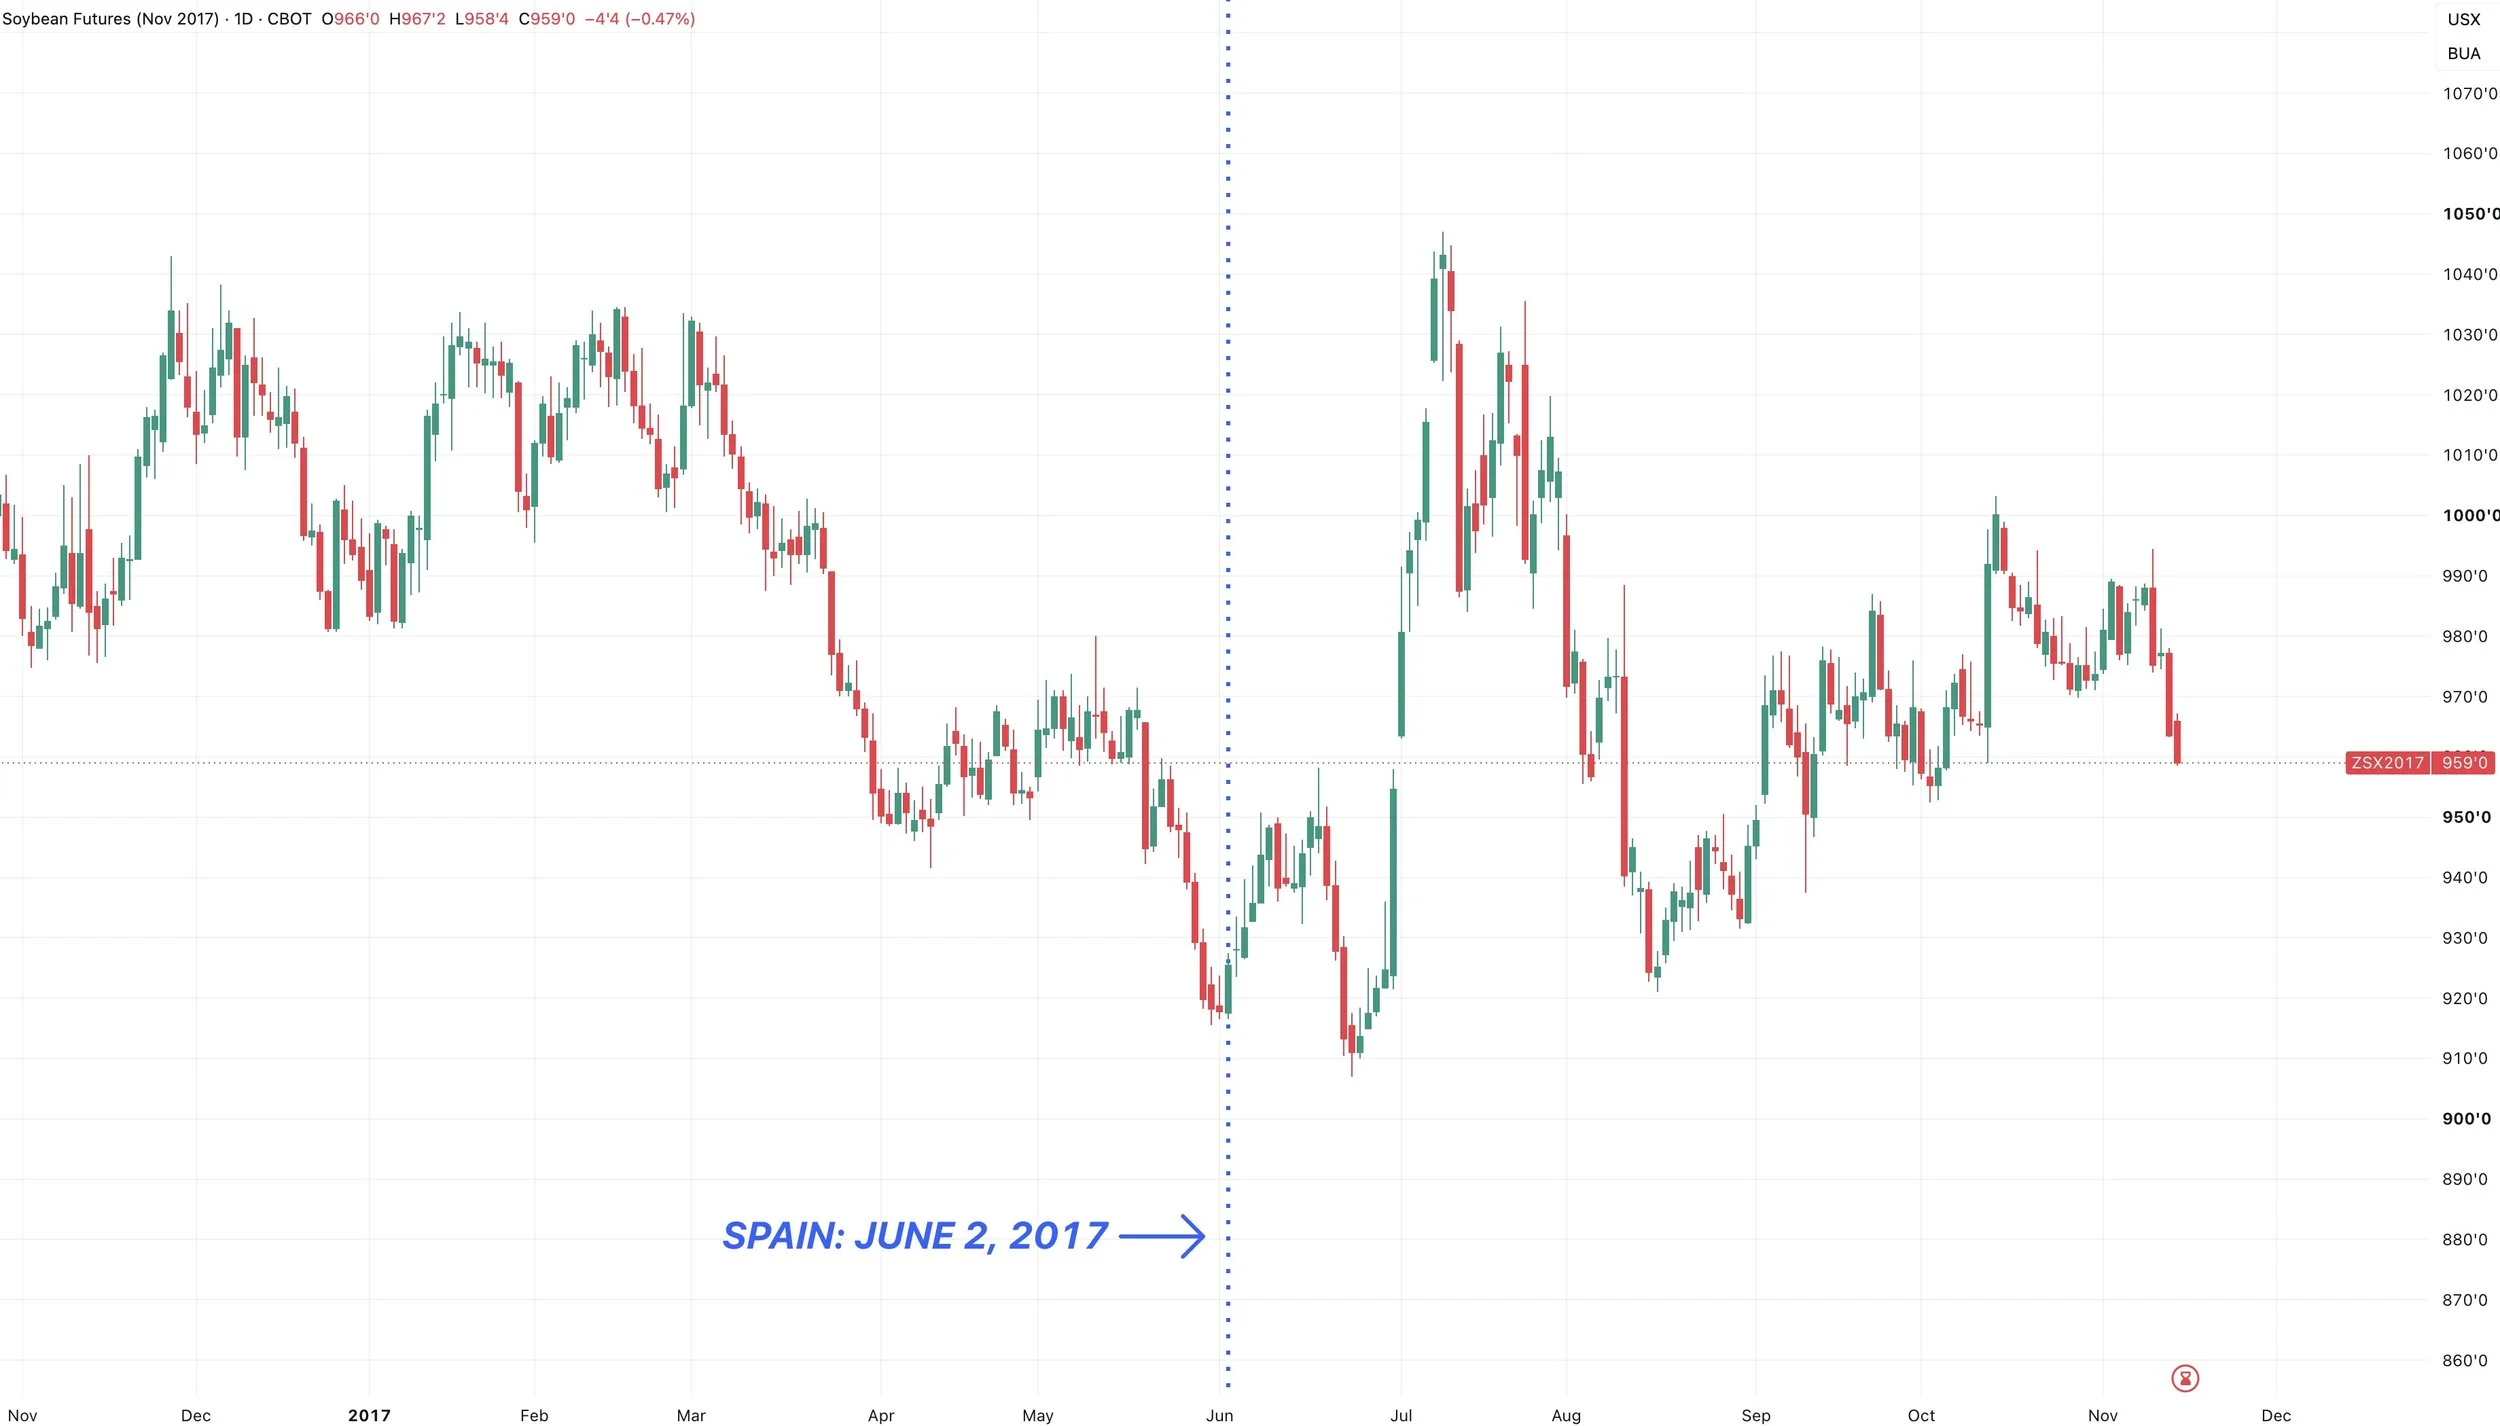
The next was June 2nd, 2017.
This one also pretty much marked the lows for the year.
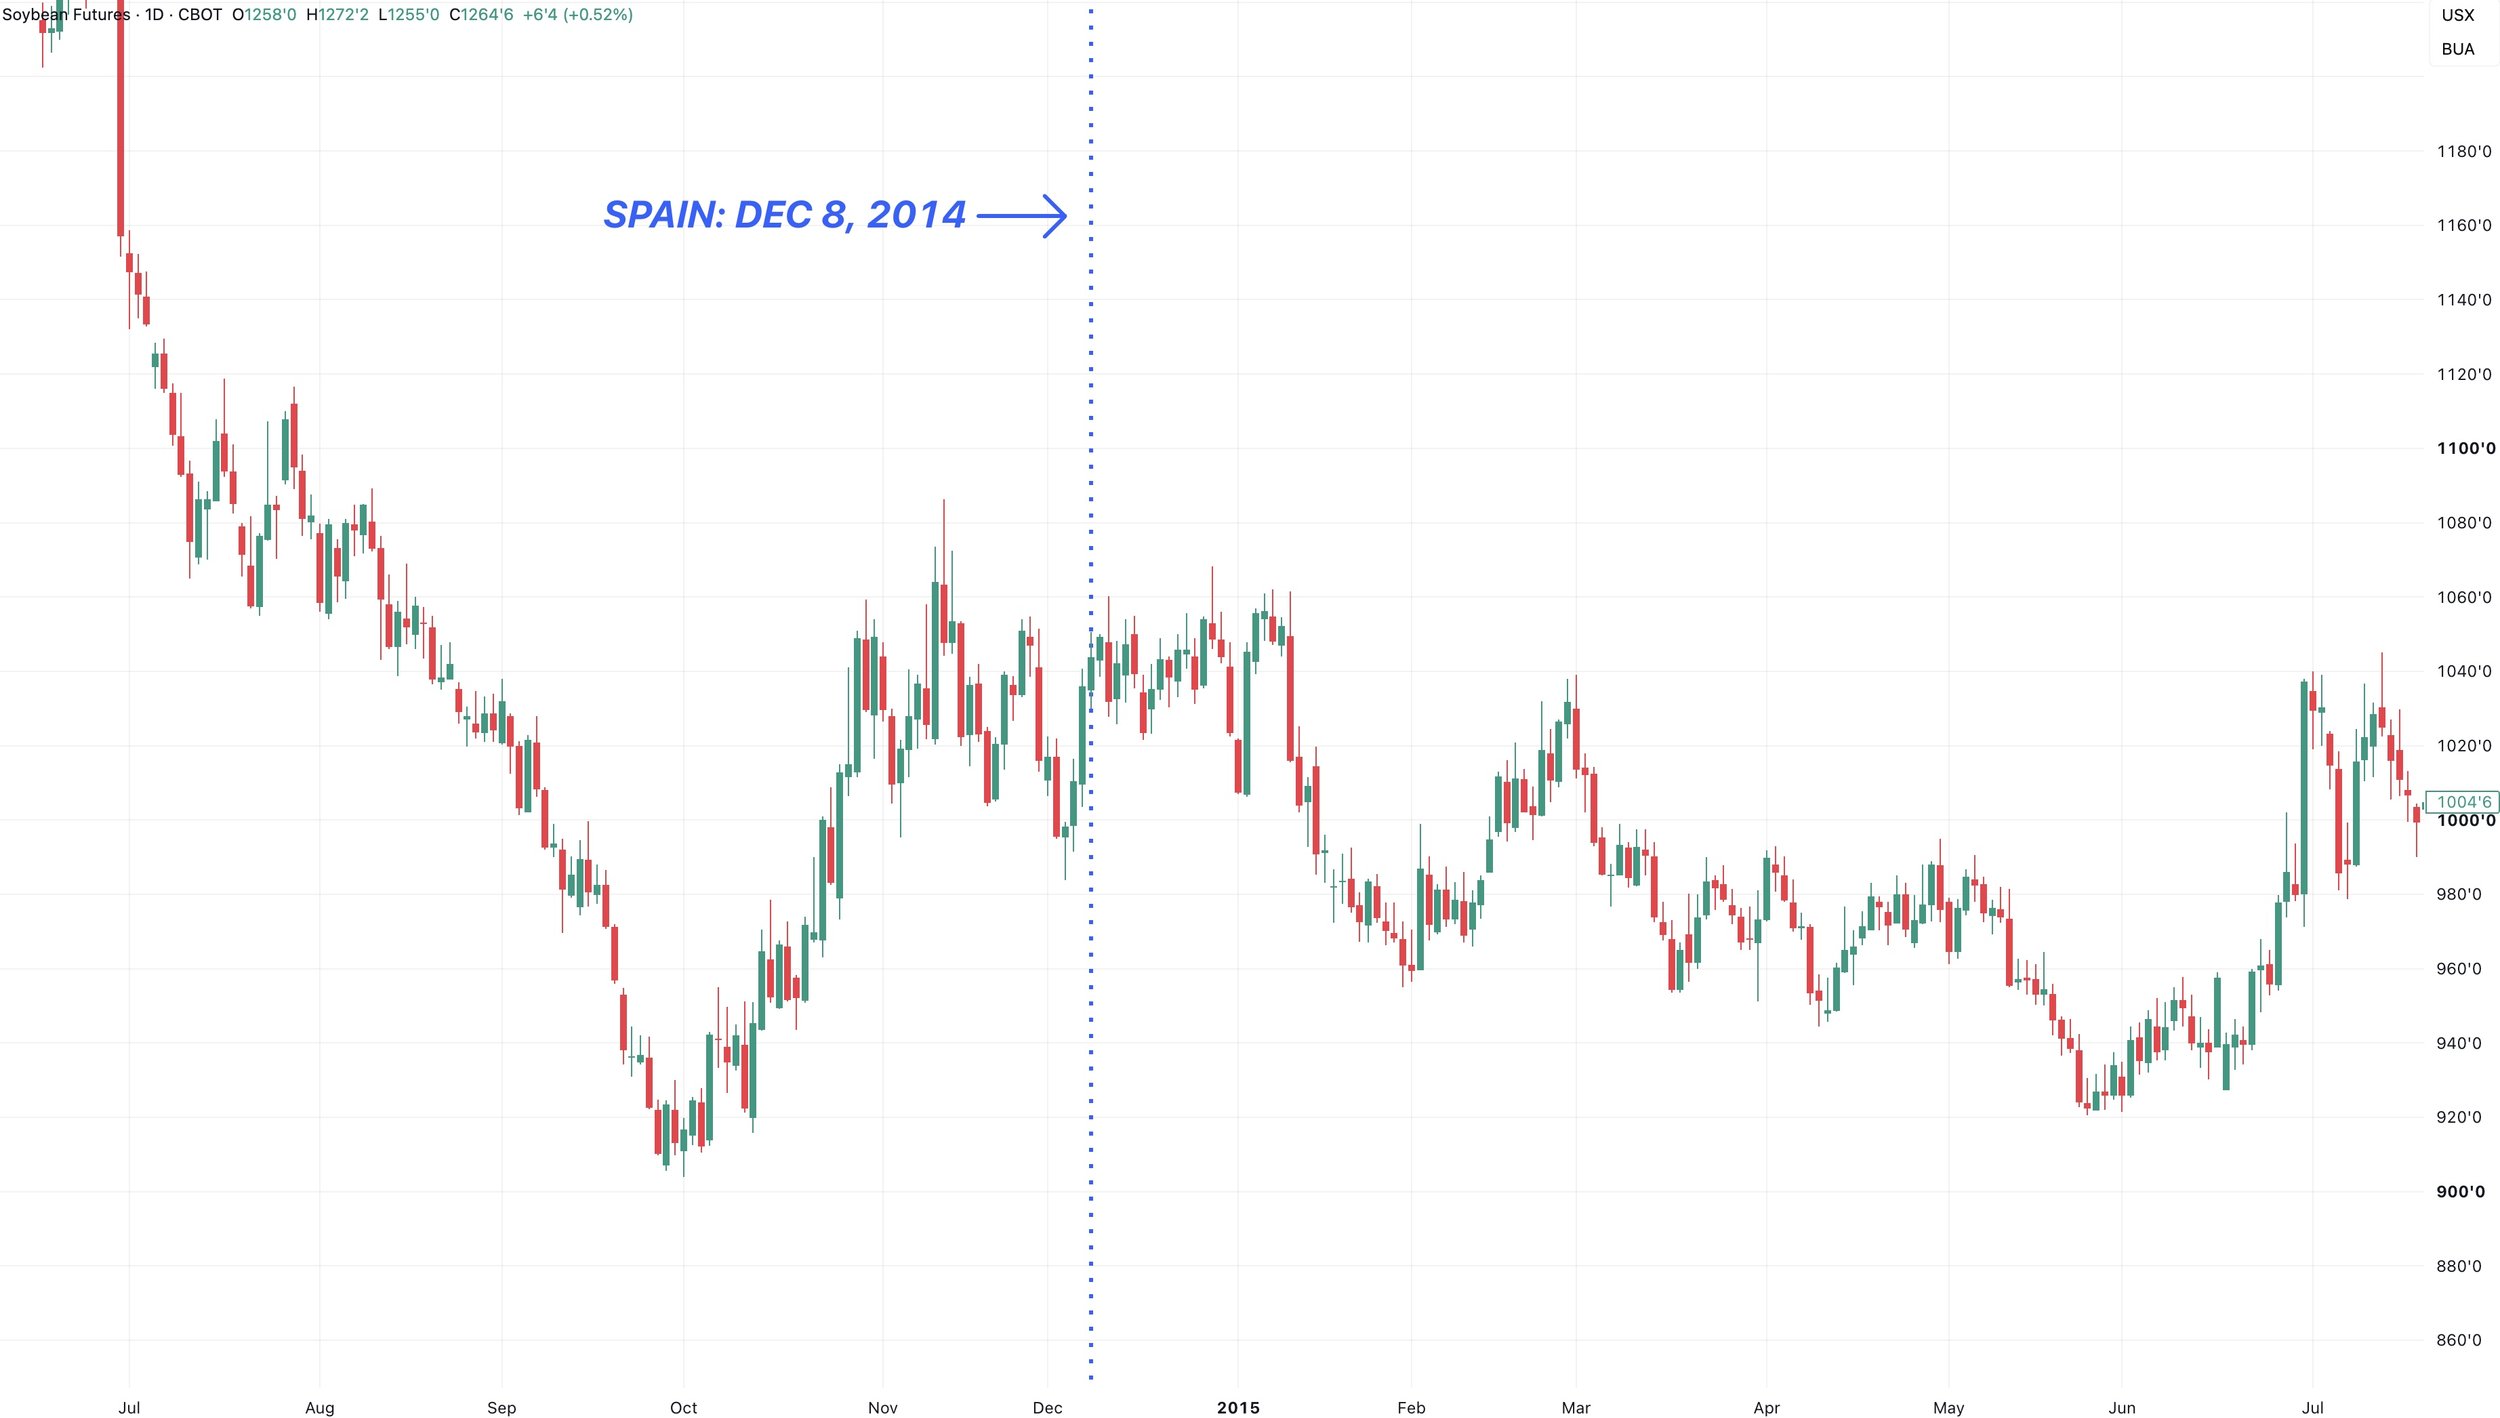
The last one is December 8th, 2014.
This is the only one that did not mark a bottom.
As soybeans pretty much just went completely sideways for the next few months.
What can we take away from this data?
Obviously it doesn’t have to mean anything.
However, in all but one year, a bottom did closely follow which is interesting.
They rarely ever buy soybeans. Just 6 times in the last 12 years.
They only buy when they see value.
So they must think soybeans are cheap here following the recent break.
Demand:
I've talked about this a thousand times at this point.
Demand is still the most intriguing when it comes to soybeans.
We have a record yield and 6 million more acres here in the US, yet the US balance sheet has not grown because demand is that impressive.
We have a world situation where both the US and Brazil have put out record crops, yet the world situation continues to shrink.
That alone tells you how strong demand is for beans.
I do not know what the Super El Niño is going to bring in Brazil. I am not a meteorologist nor an agronomist.
What I do know is that the world situation cannot afford a hiccup in Brazil.
Spread Action:
The spread action the last few days has been supportive in soybeans.
Here is the Nov to Jan spread.
It's started to narrow by a decent amount.
It's the tightest it's been since May now.
When spreads tighten, it's not considered bearish.
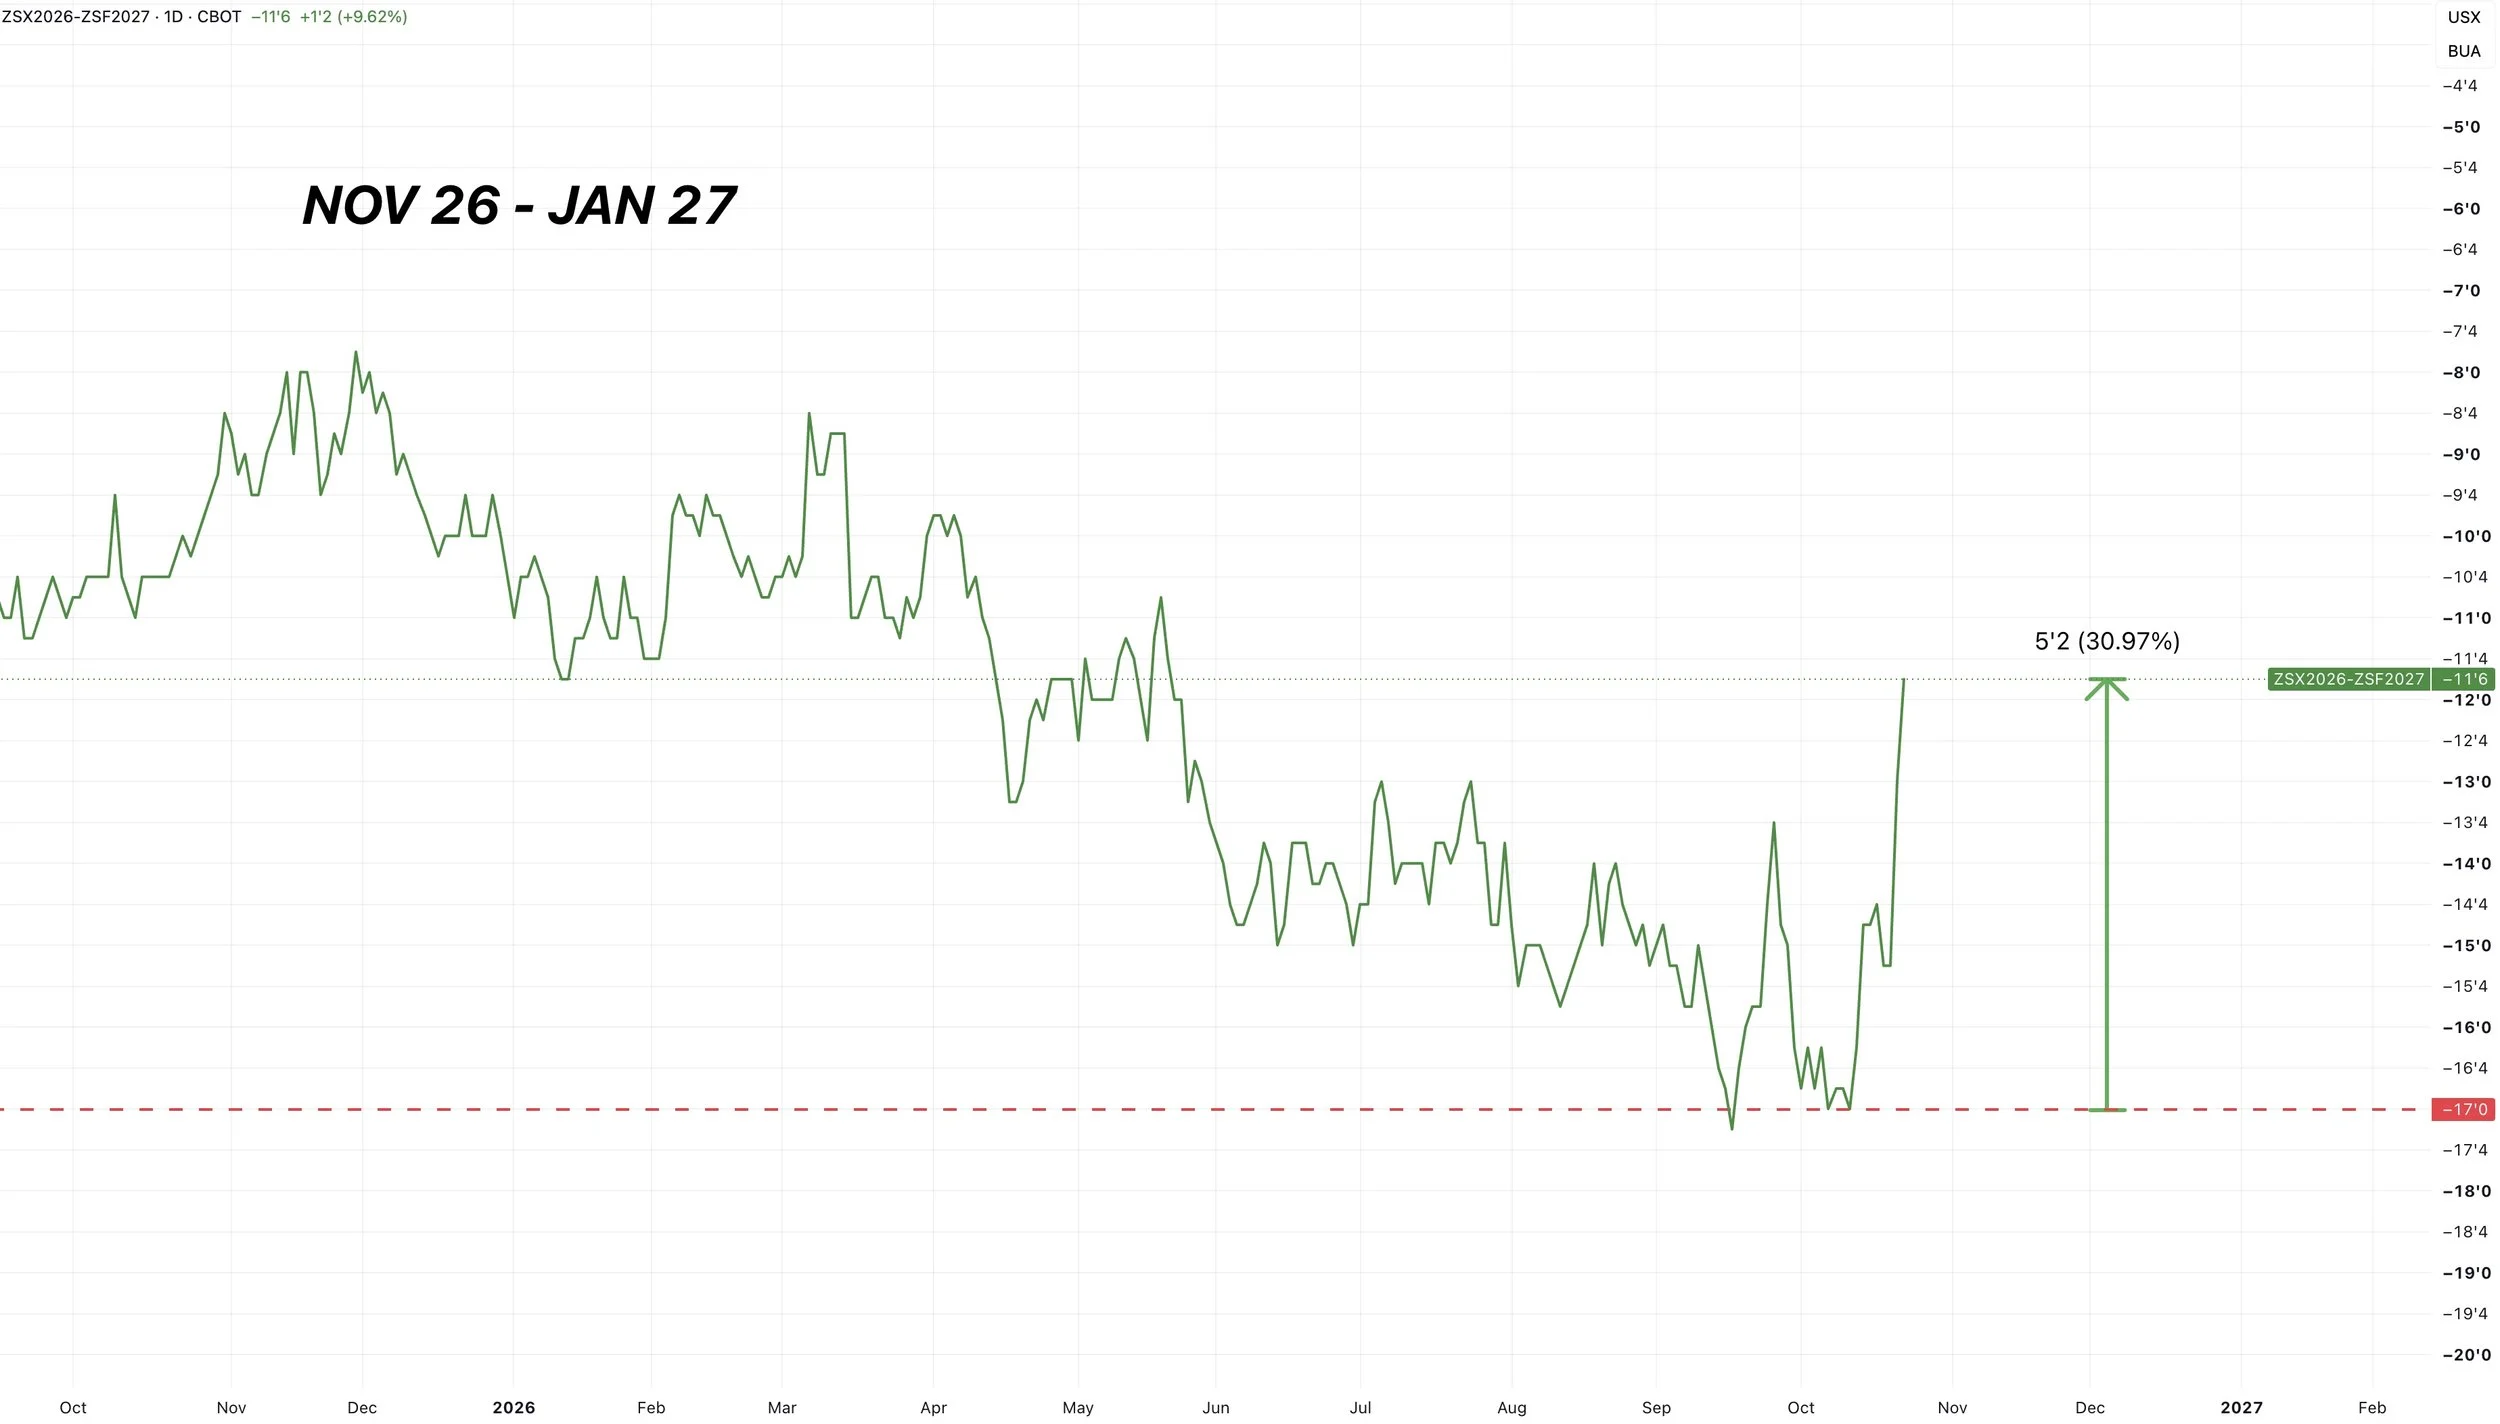
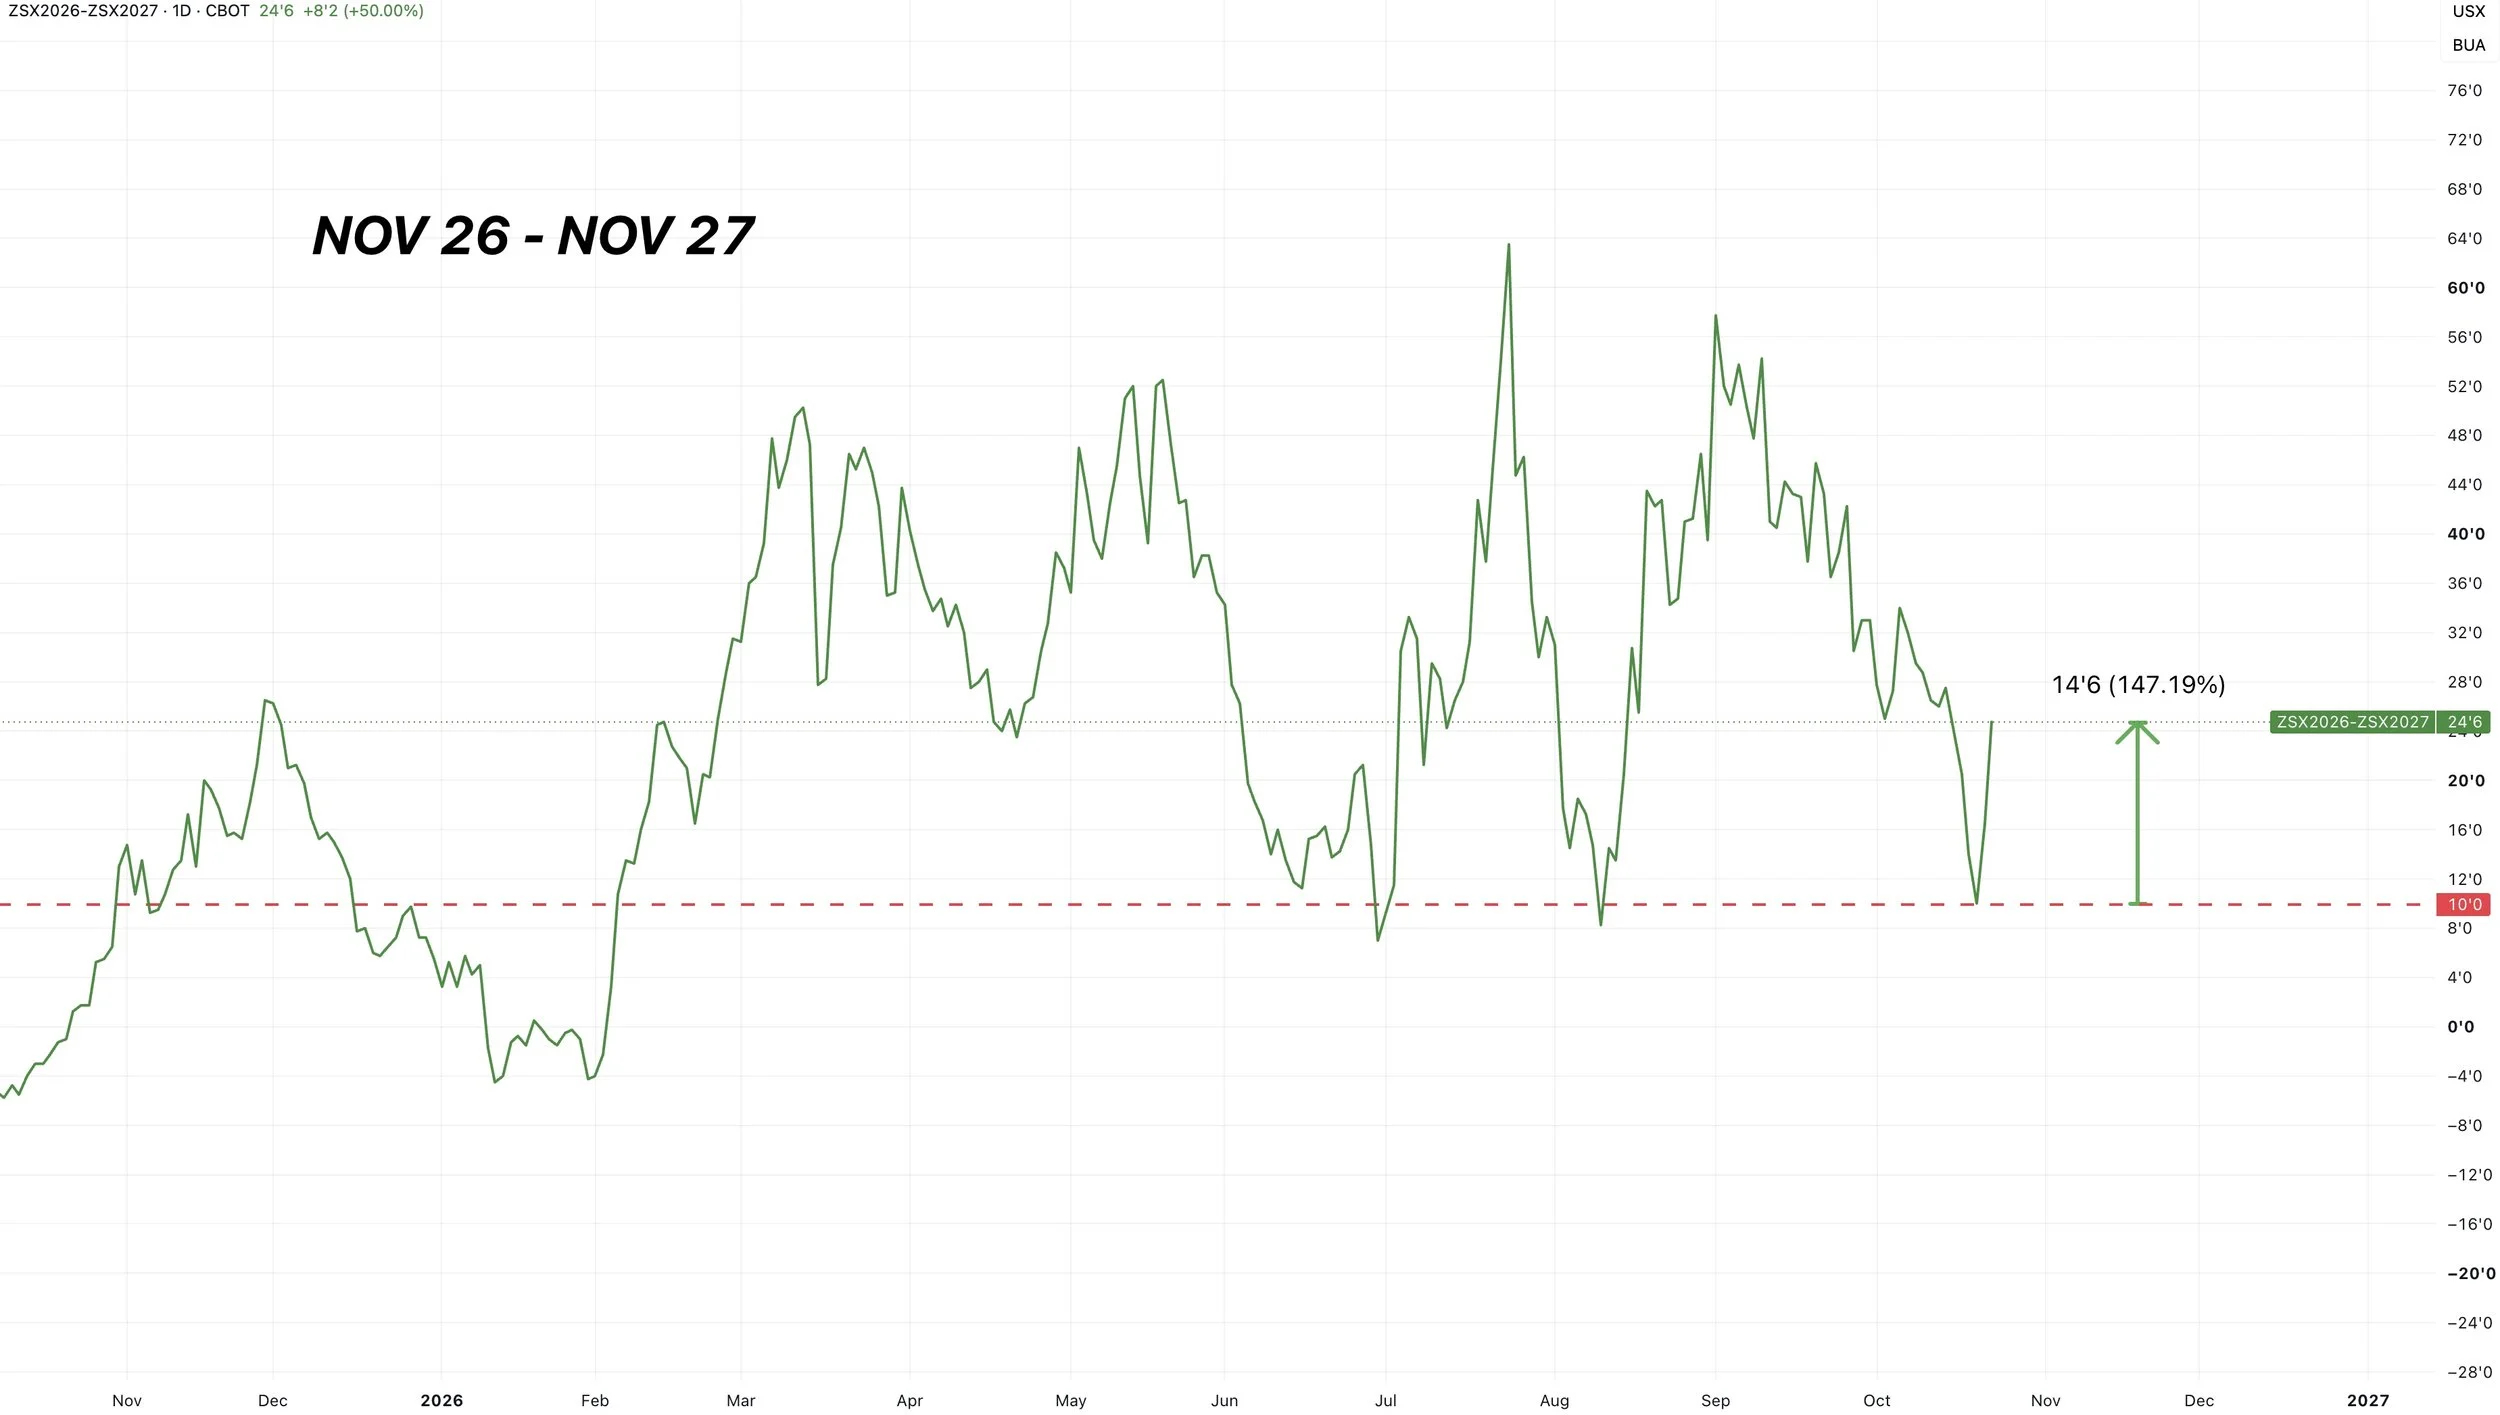
The Nov-26 to Nov-27 spread has also narrowed by a decent amount the last few days.
It went from a 10 cent inverse, to a 25 cent inverse in just 2 days.
This is positive because it shows that the market wants beans.
So this could be a potential hint that the market is getting tired of going down.
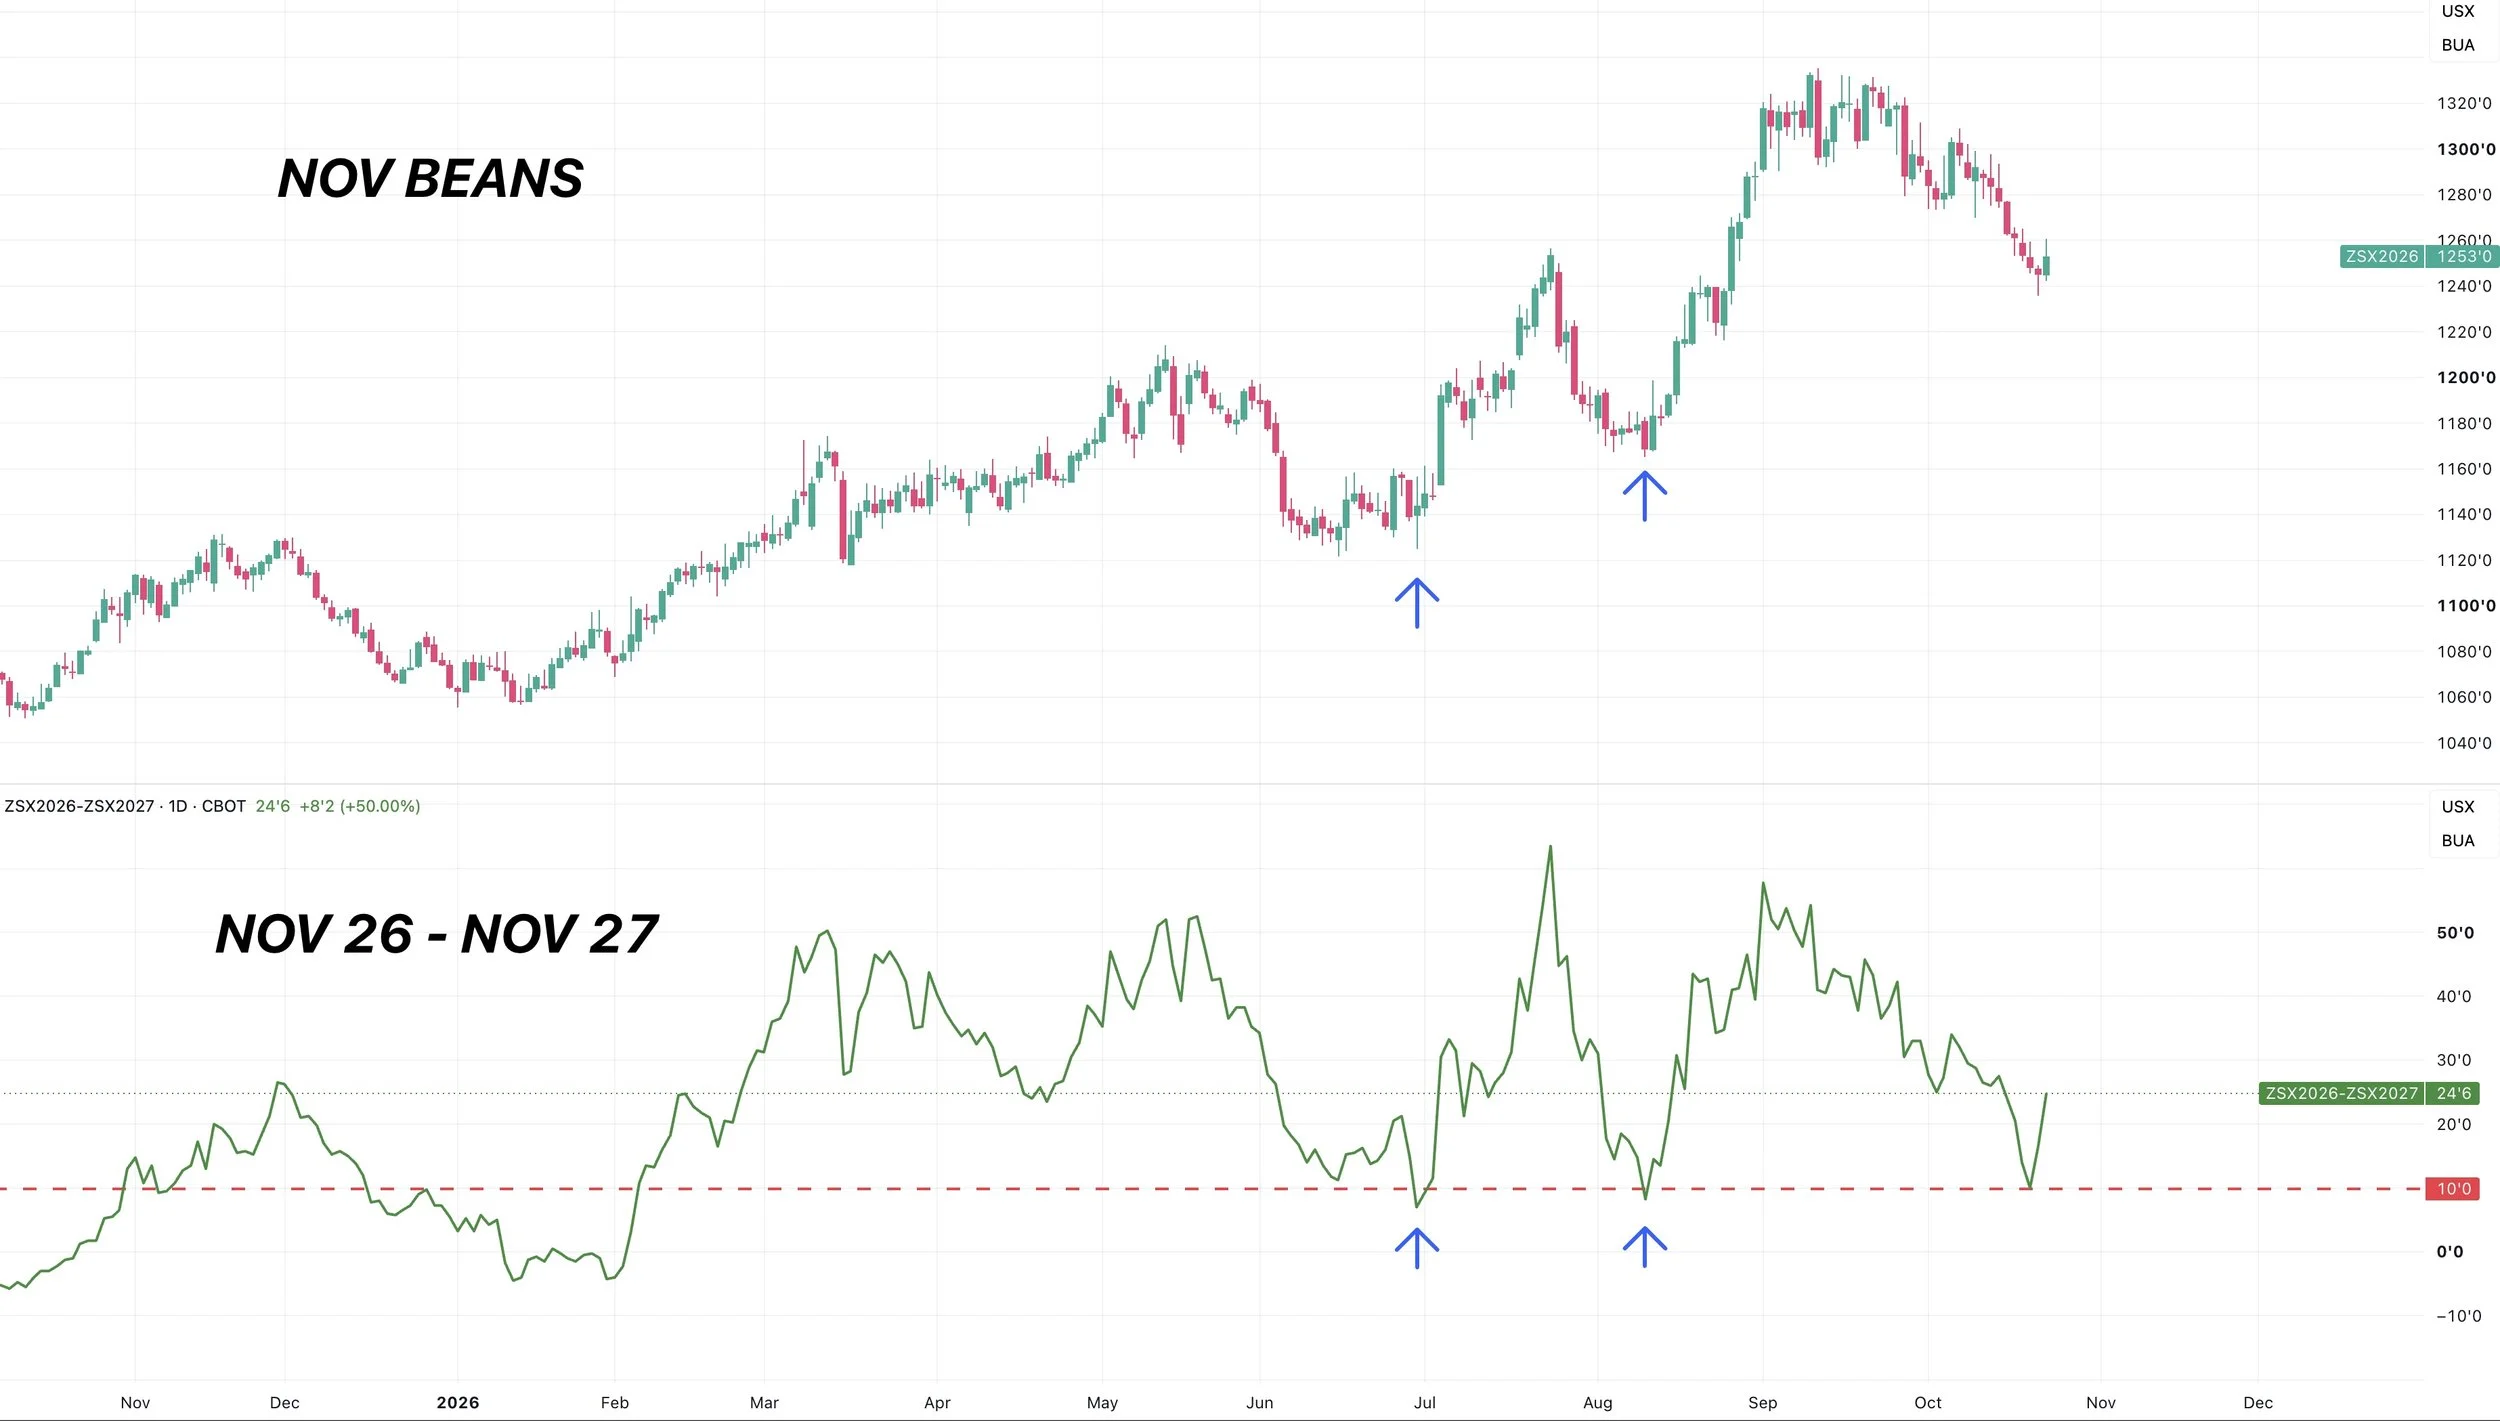
Here is Nov soybeans vs the Nov-26 to Nov-27 spread.
The last two times the spread hit this level and bounced, it did mark the bottom. But need to see the spreads continue to do the work.
Charts
Nov Beans Chart:
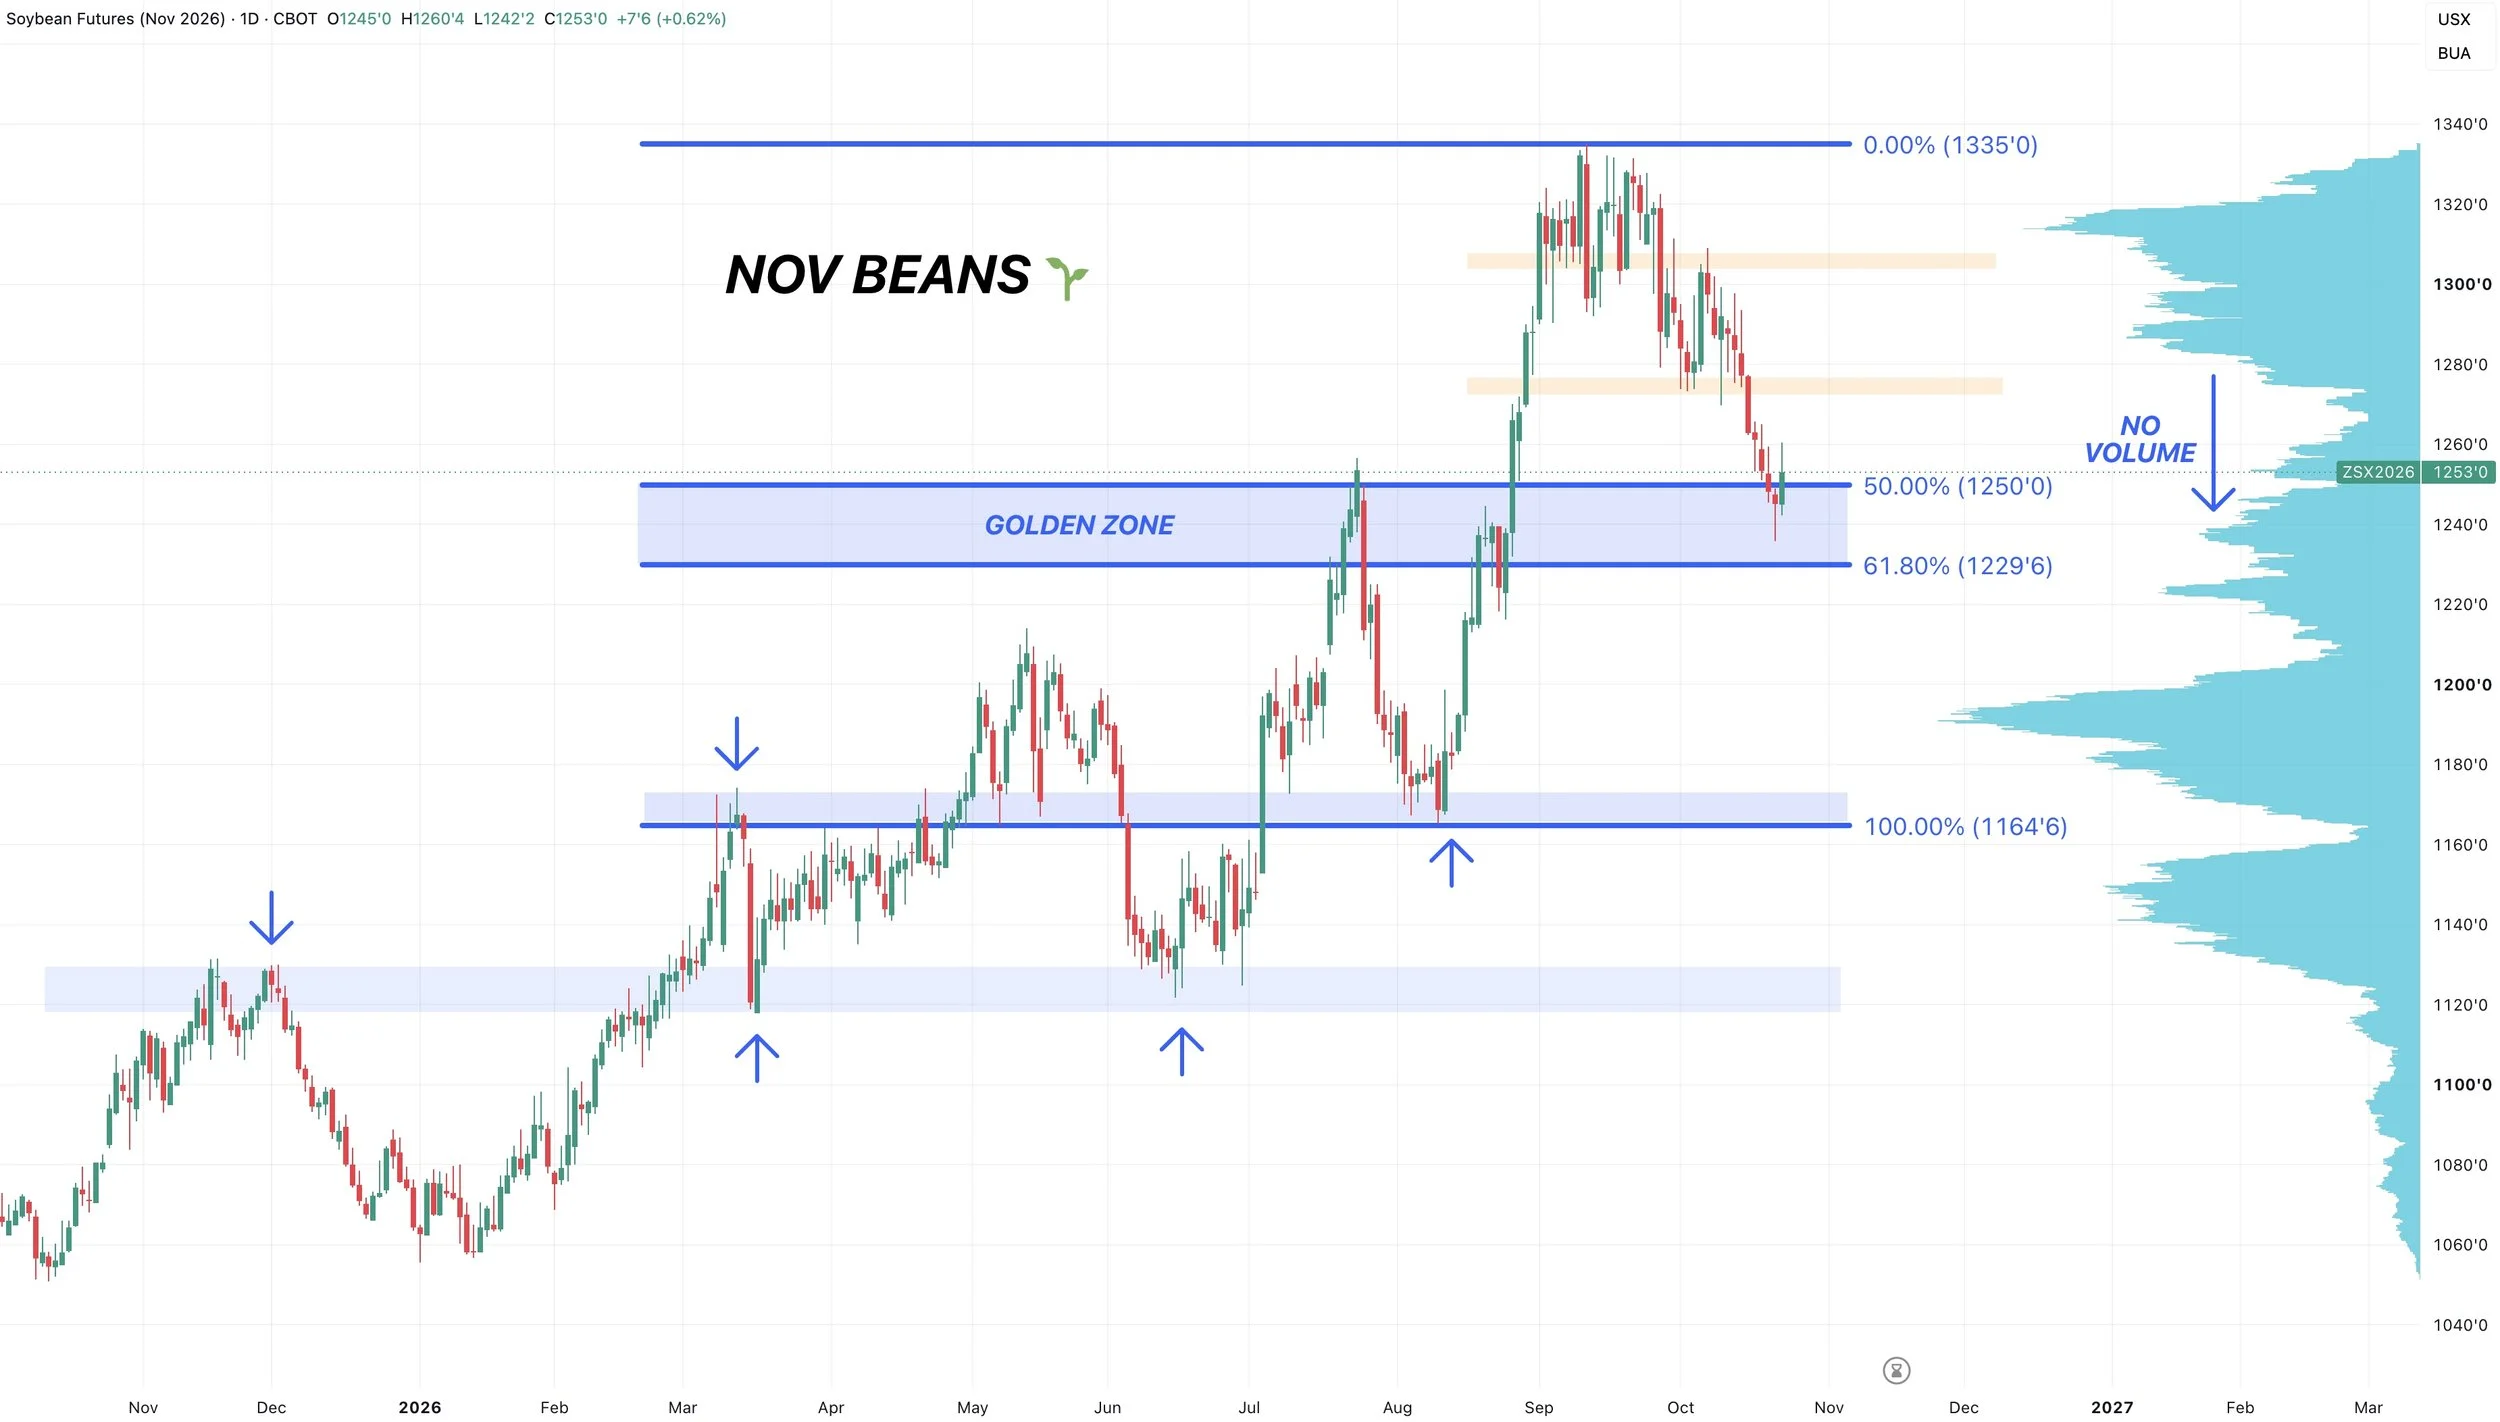
Soybeans followed up yesterday with it's first green candle since October 9th which was nice to finally see.
This box has been my downside target in soybeans for weeks.
As we are sitting right inside that golden zone down to the August lows. The 50-61.8% retracements are the most common area for a correction to end, but add even more confluence when it lines up with other points of interest.
We had that big volume gap to the downside I had been talking about for a long time. We have now sliced through it and went down to the next area of high volume.
At the same time, we are re-testing the highs from July.
Soybeans constantly turn old highs into new lows.
The August lows came at the March highs. The March and June lows came at the November highs.
So this would be a big area of interest for us to carve out some lows.
However, we need to hold that $12.30 level or it will open up further downside towards $12.00. But for now, this is where we'd like to find support.
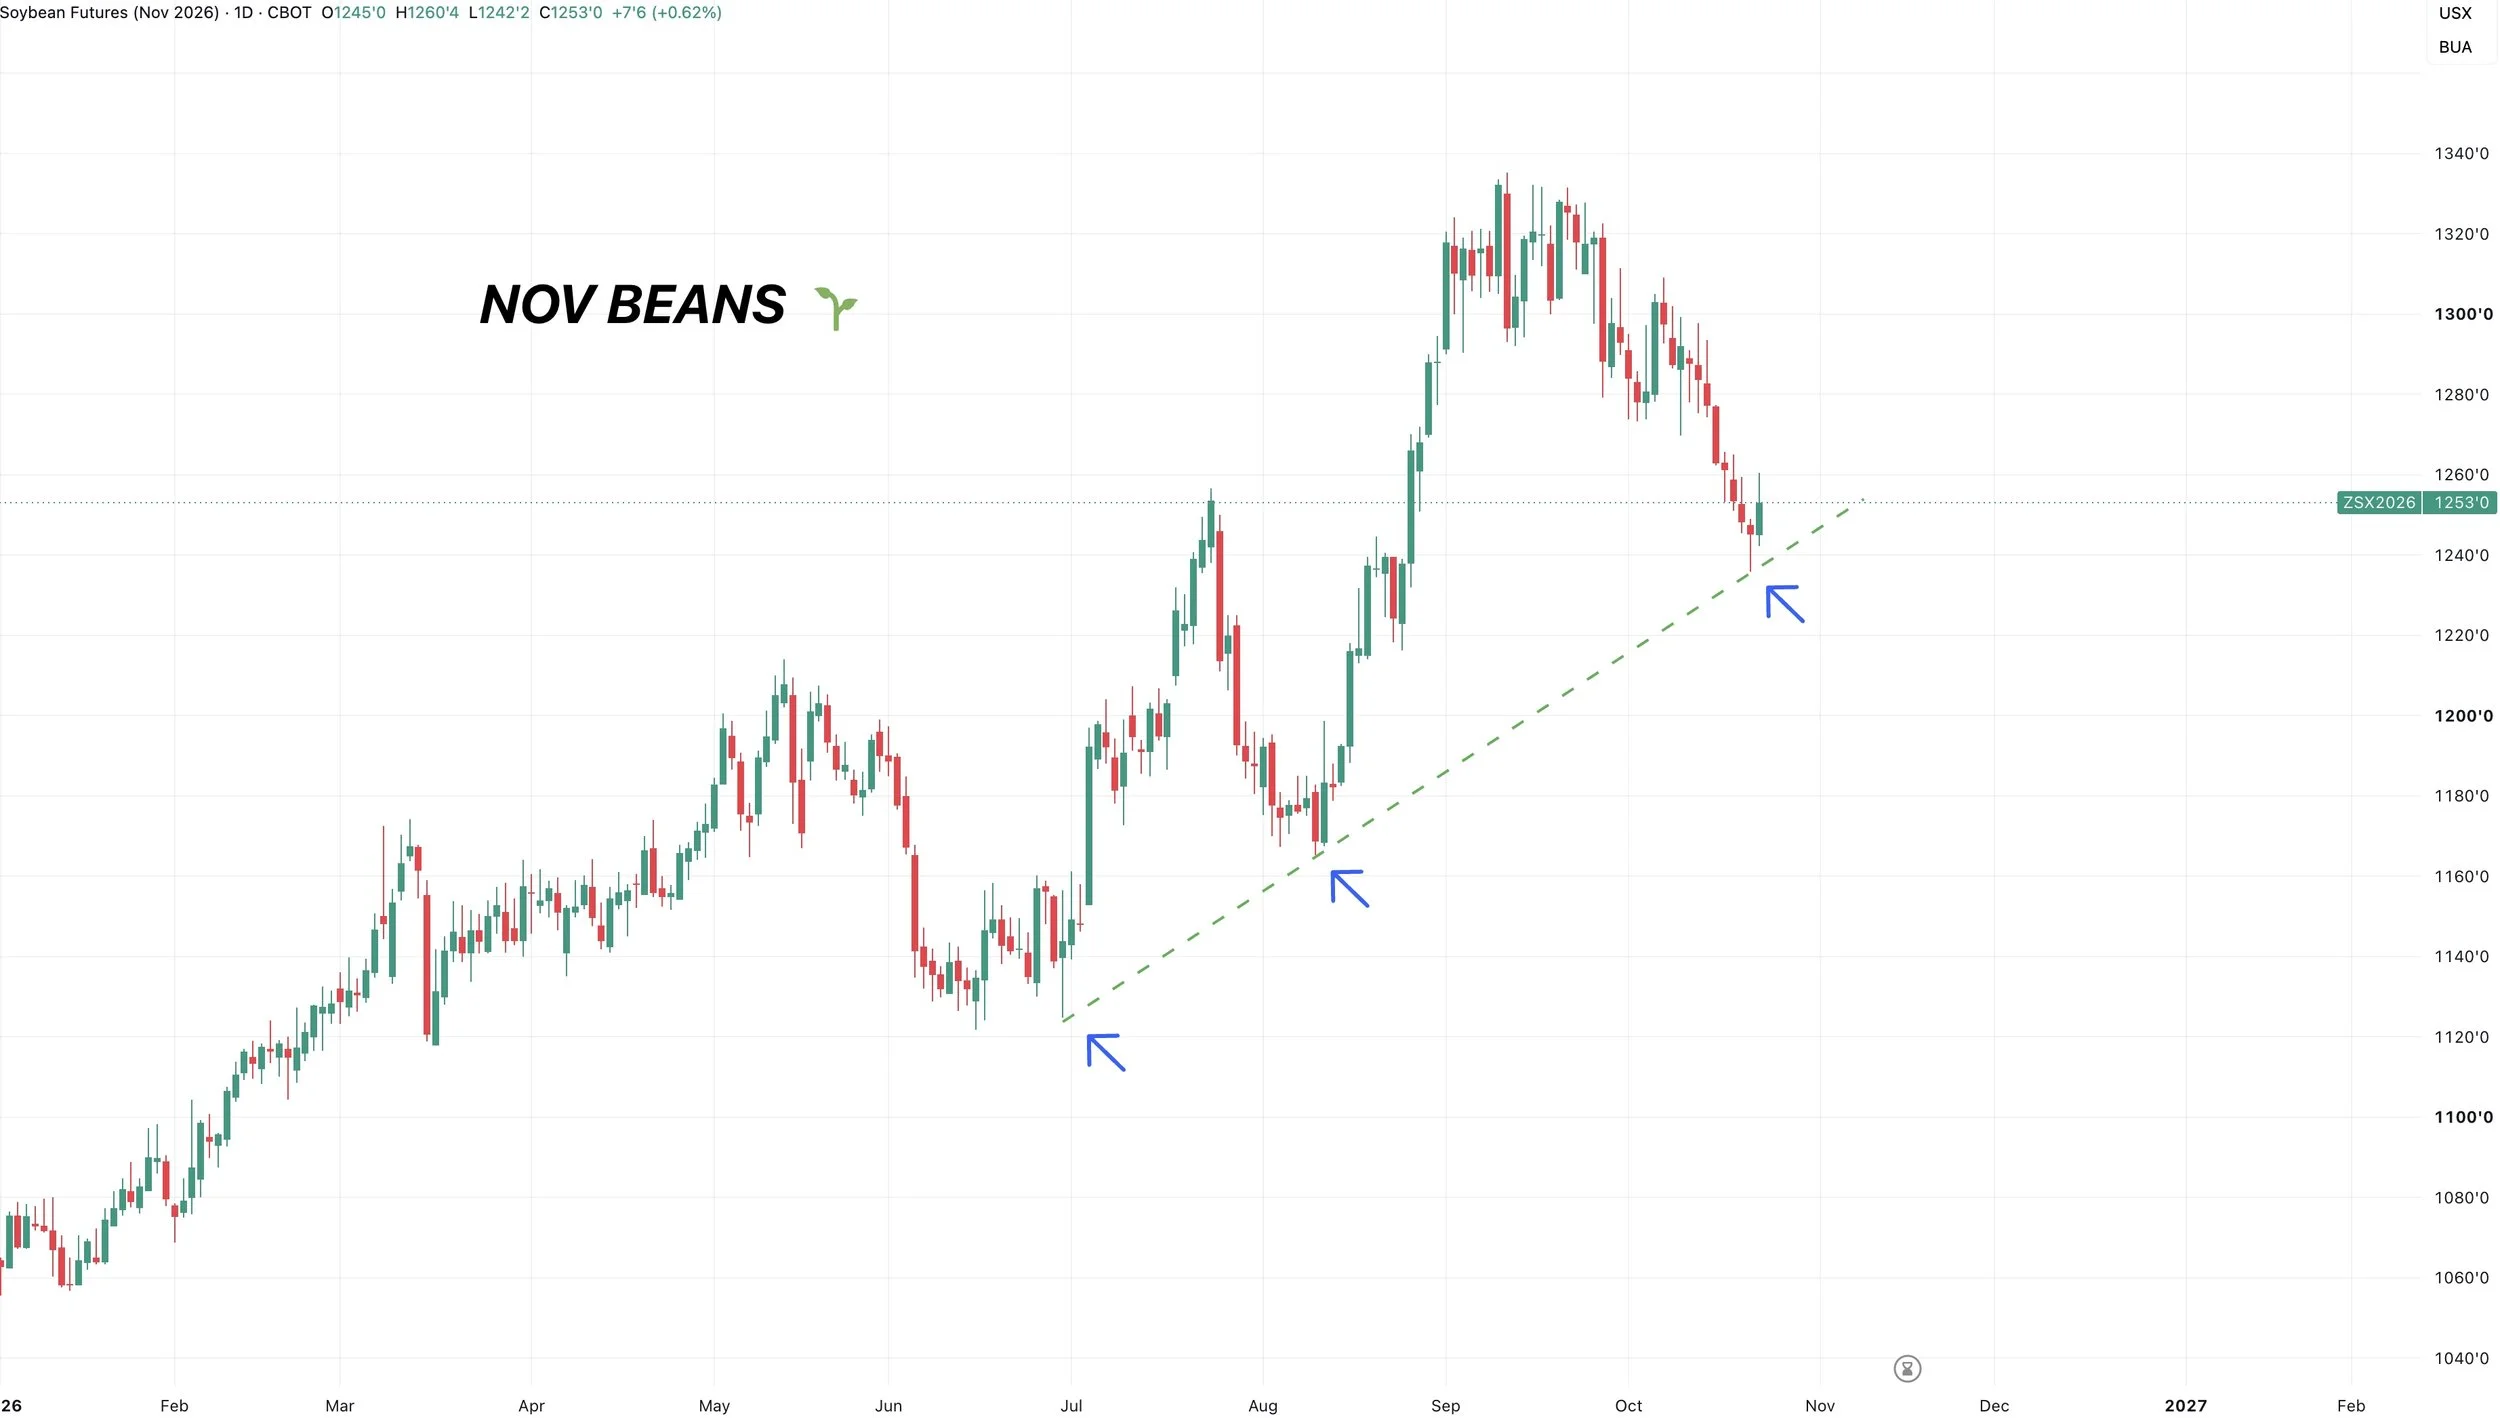
Trend lines can be subjective depending on how you draw them.
But soybeans did bounce off of some trendline support as well which was nice to see.
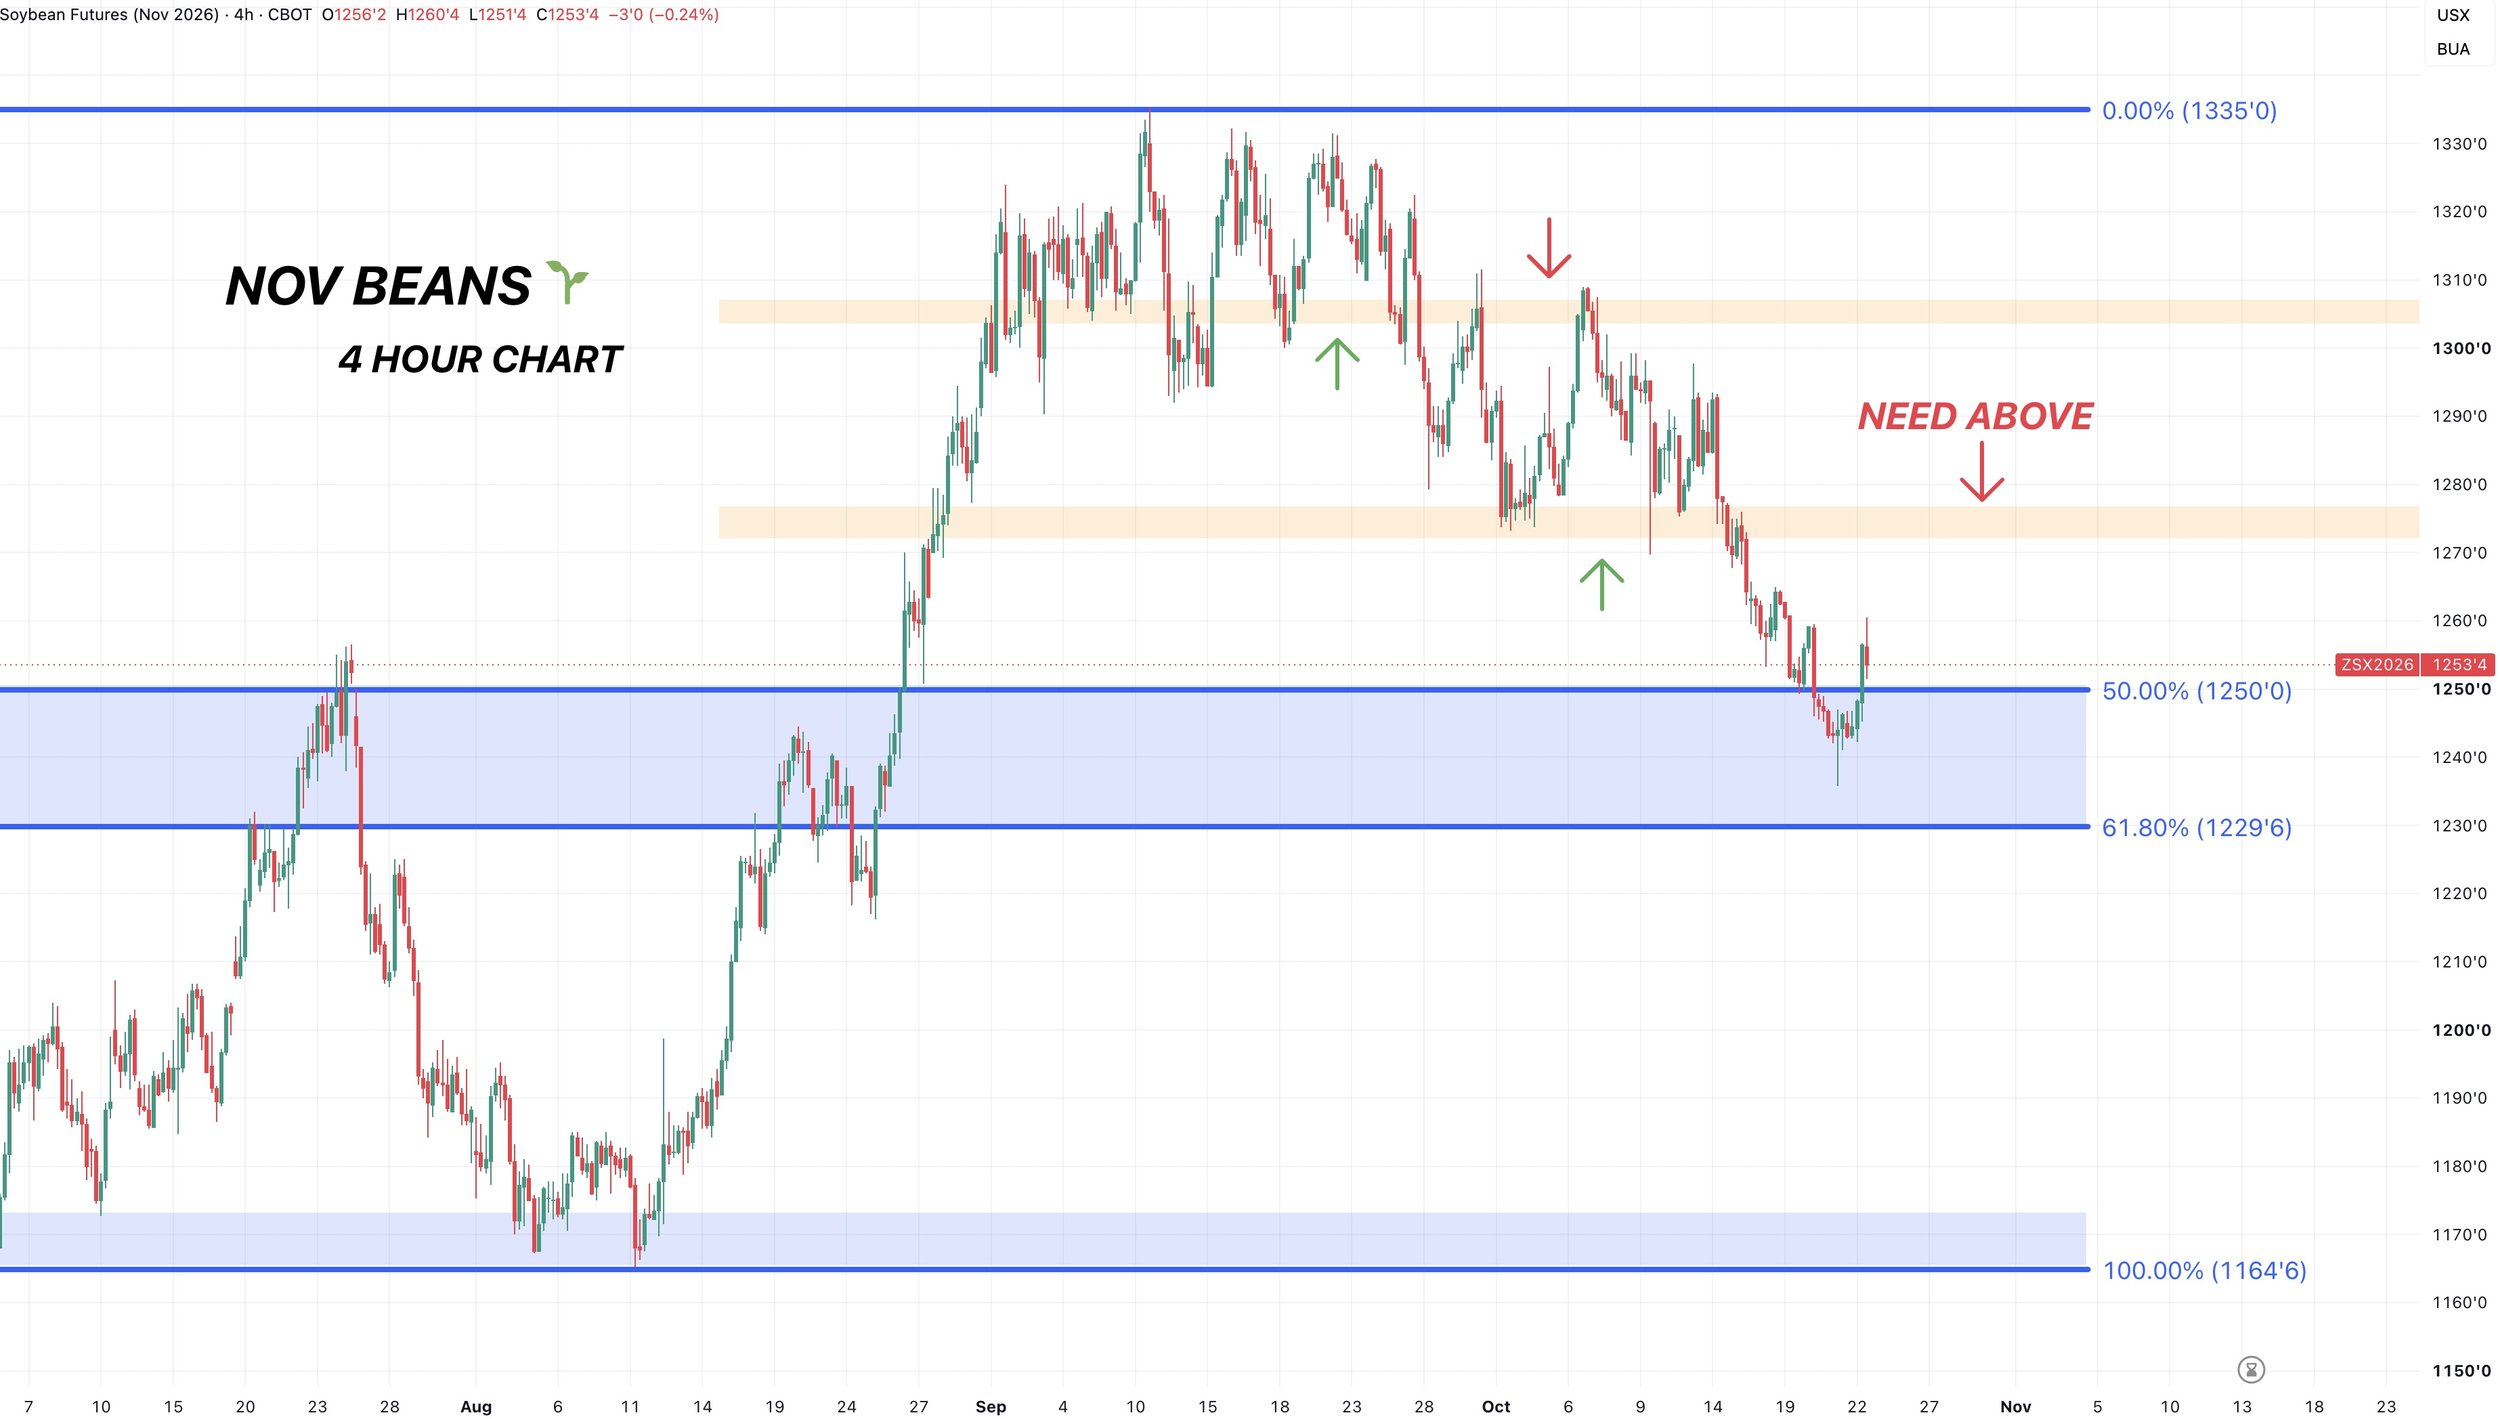
4-Hour Chart:
To be confident we are out of the woods, we need to see soybeans break back above that prior support in the $12.75 area.
That would reclaim the lost support, putting us back into the old range.
As prior support can act as resistance.
Just like we saw a few weeks ago. At the end of September we broke below that first range. We then came up and tested the prior support before rejecting and heading lower.
So we need to break above the bottom of that second range.
3-Day Chart:
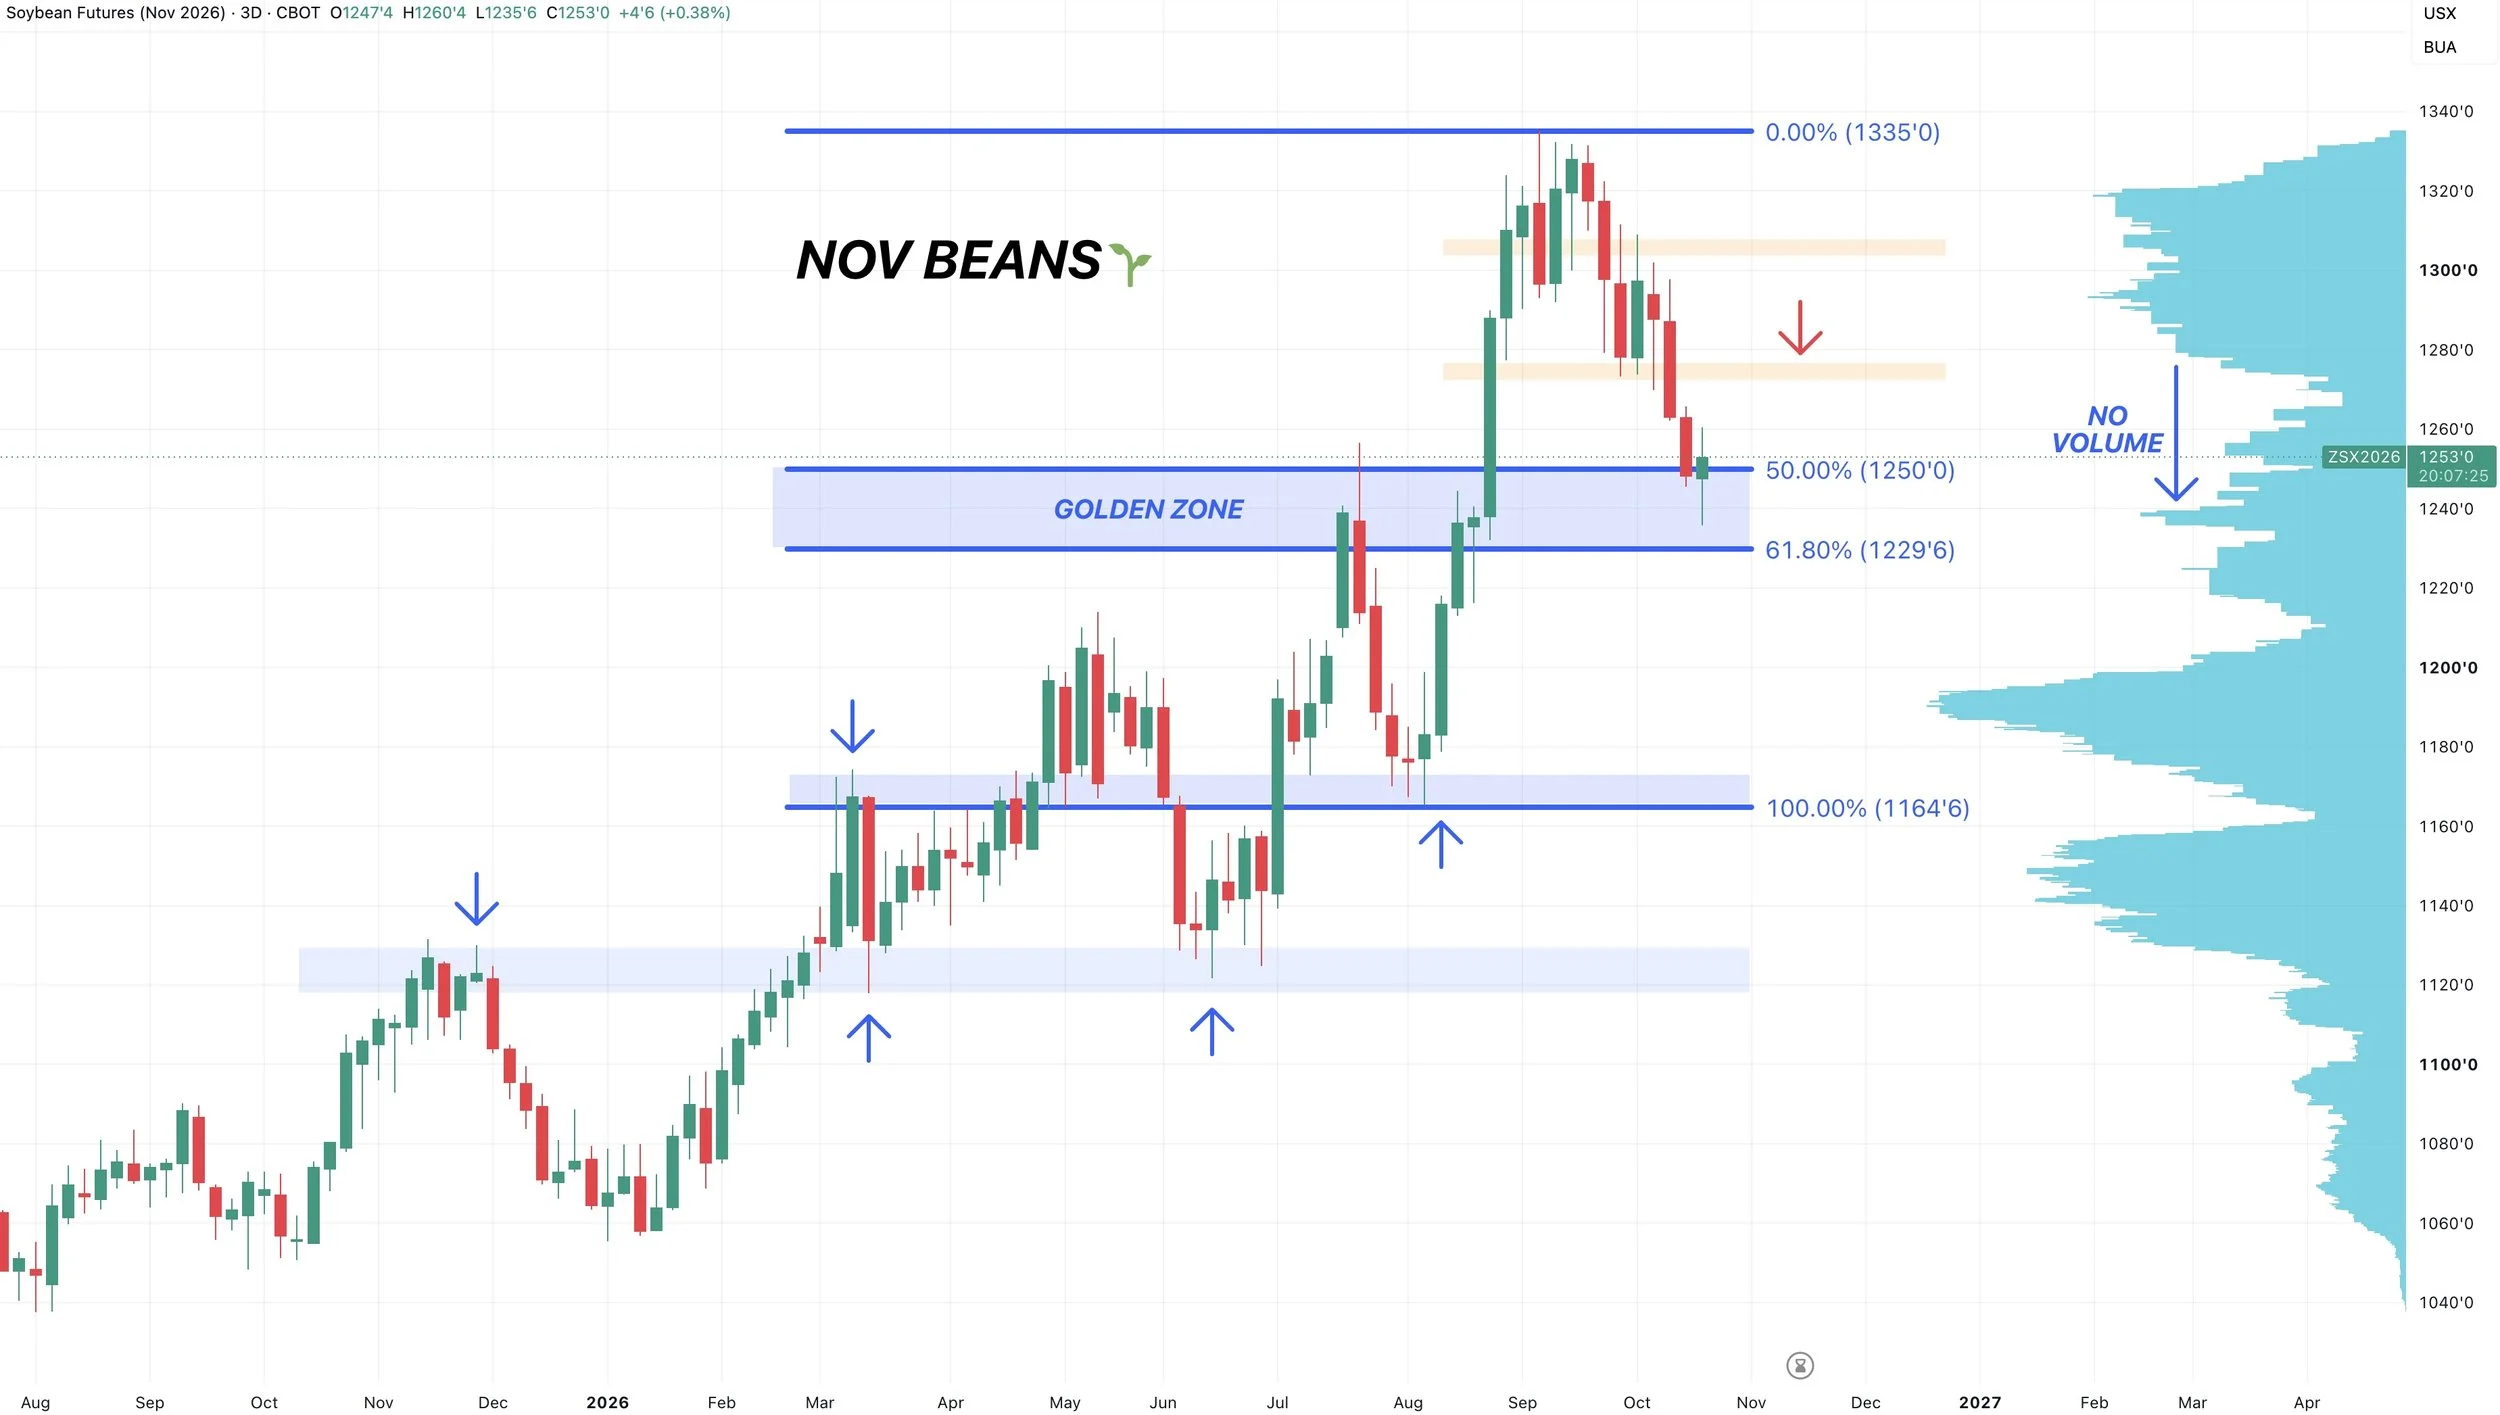
Here is the 3-day chart for a cleaner perspective.
Sitting right inside that golden zone after falling through the volume gap.
Re-testing the prior highs just like we've done several times before.
Failure to hold $12.30 opens further downside.
Past Corrections:
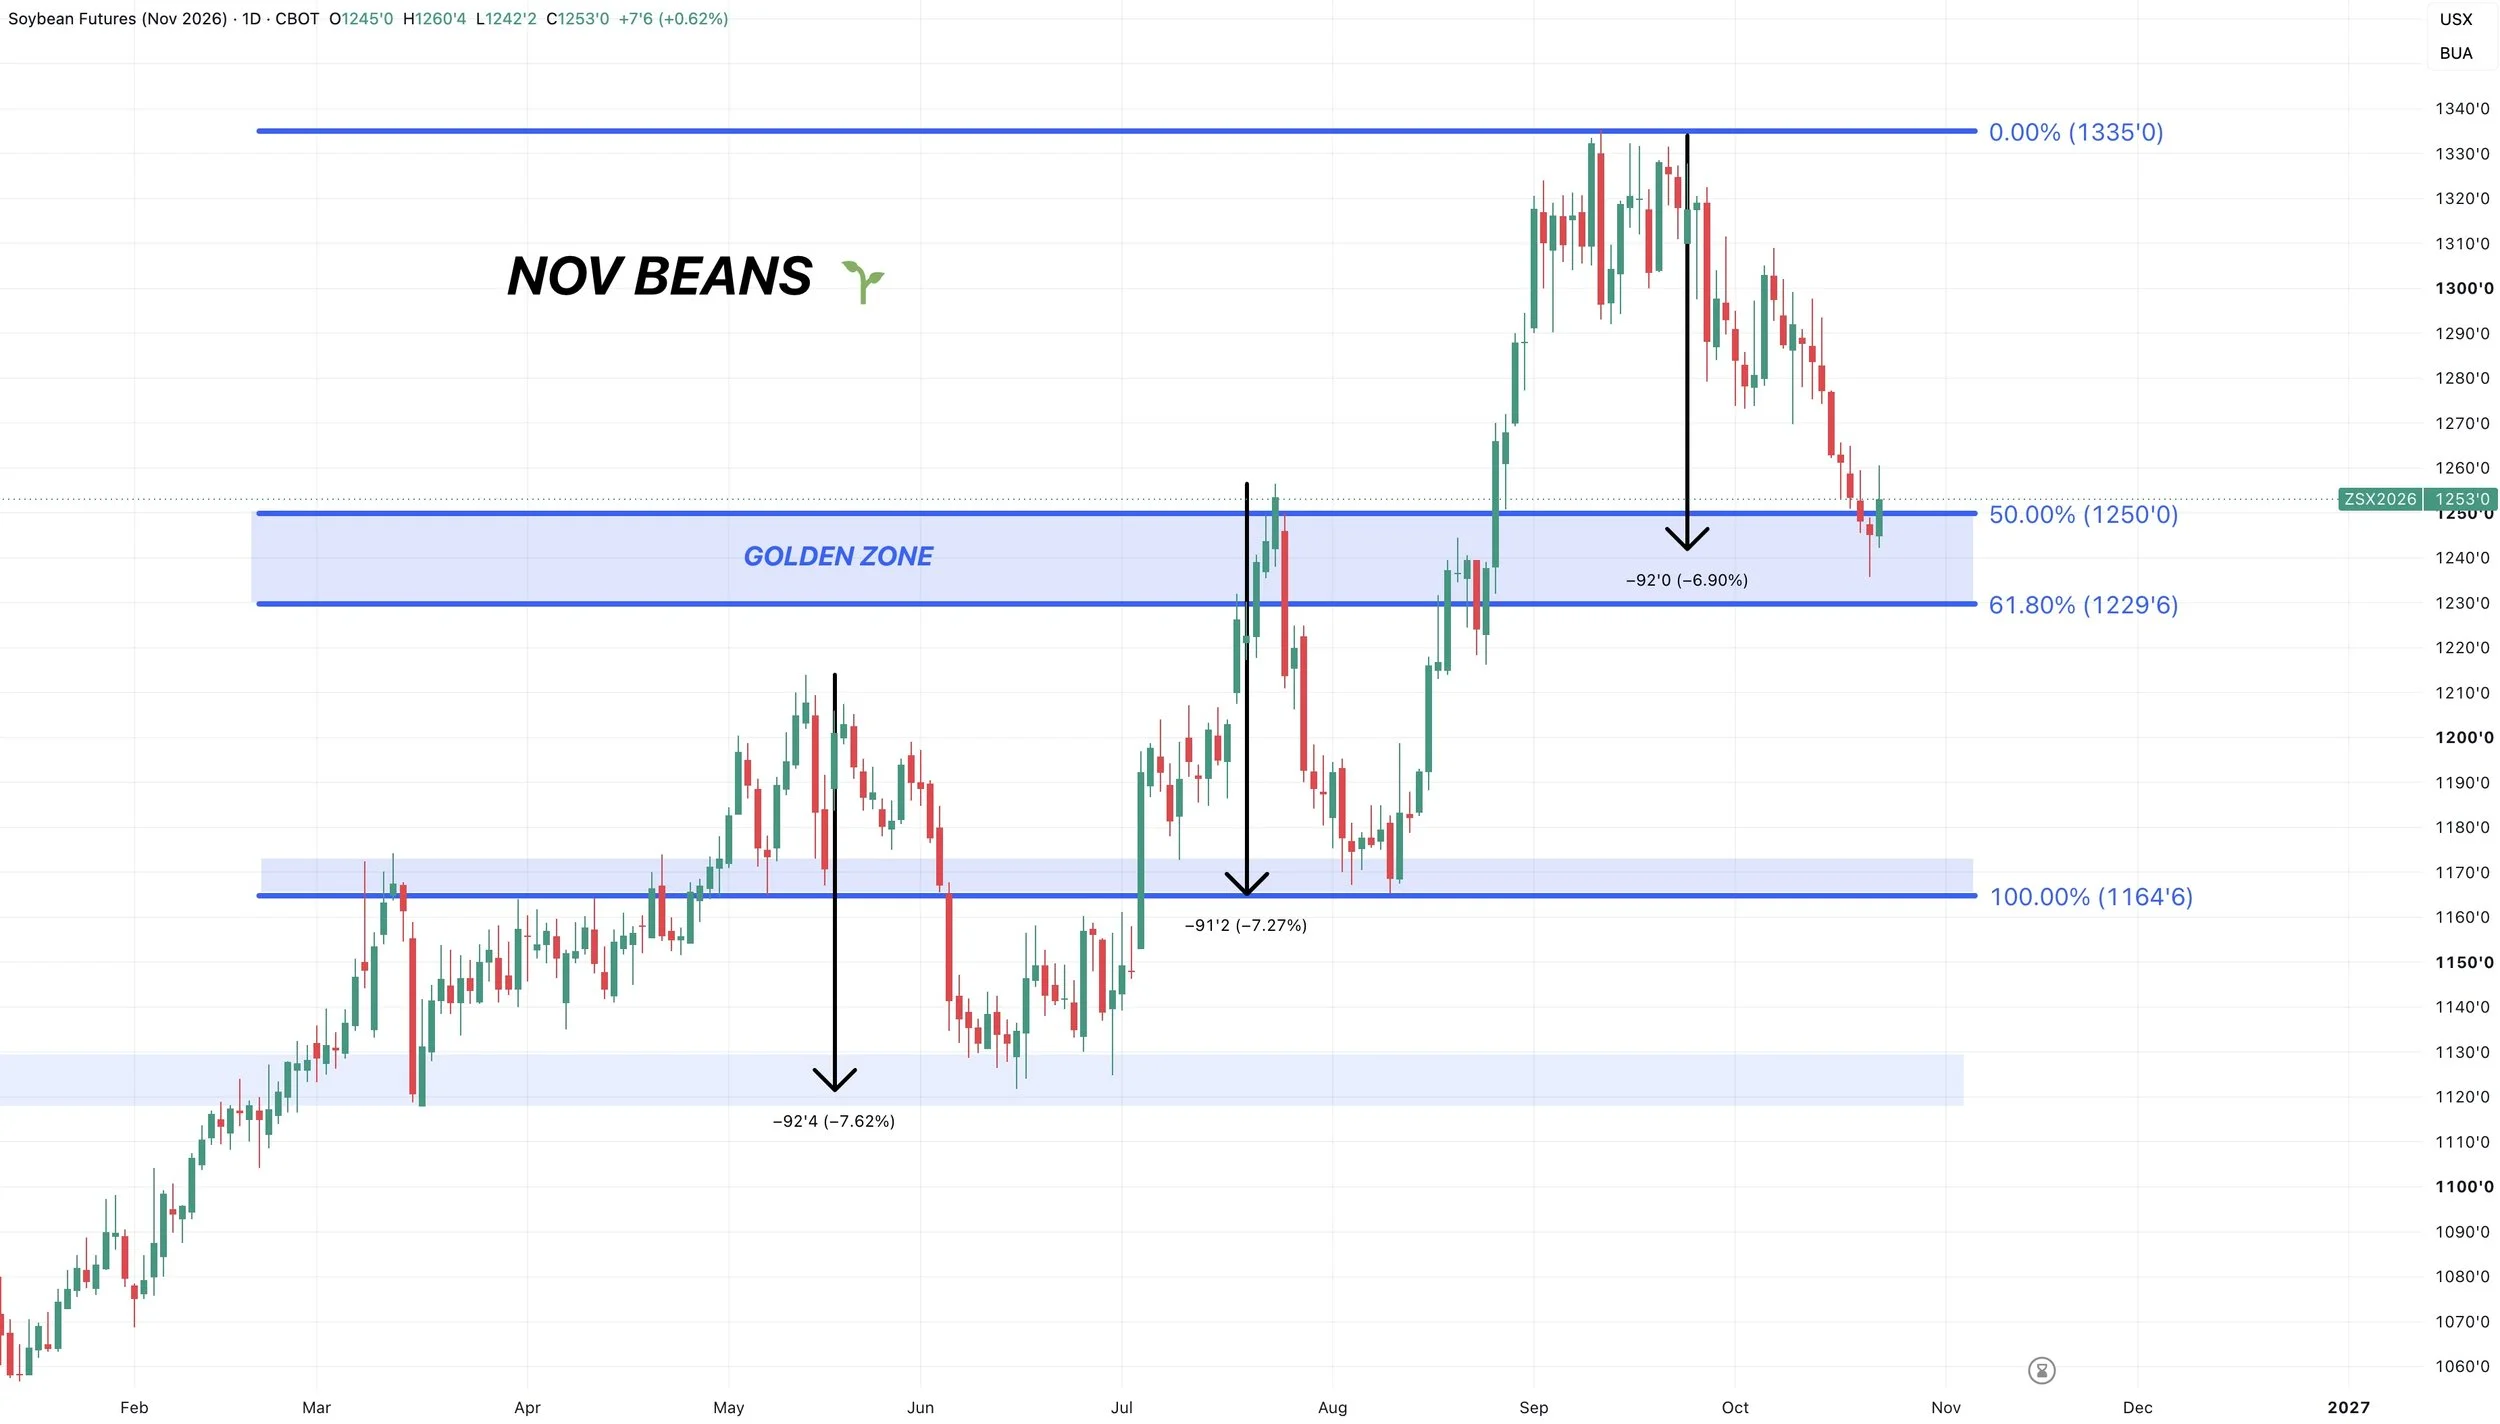
One last reason I think this area could offer support is this.
The June sell off was -92 cents.
The August sell off was -92 cents.
This market just dropped about the same exact amount as the first two sell offs.
Jan Beans:
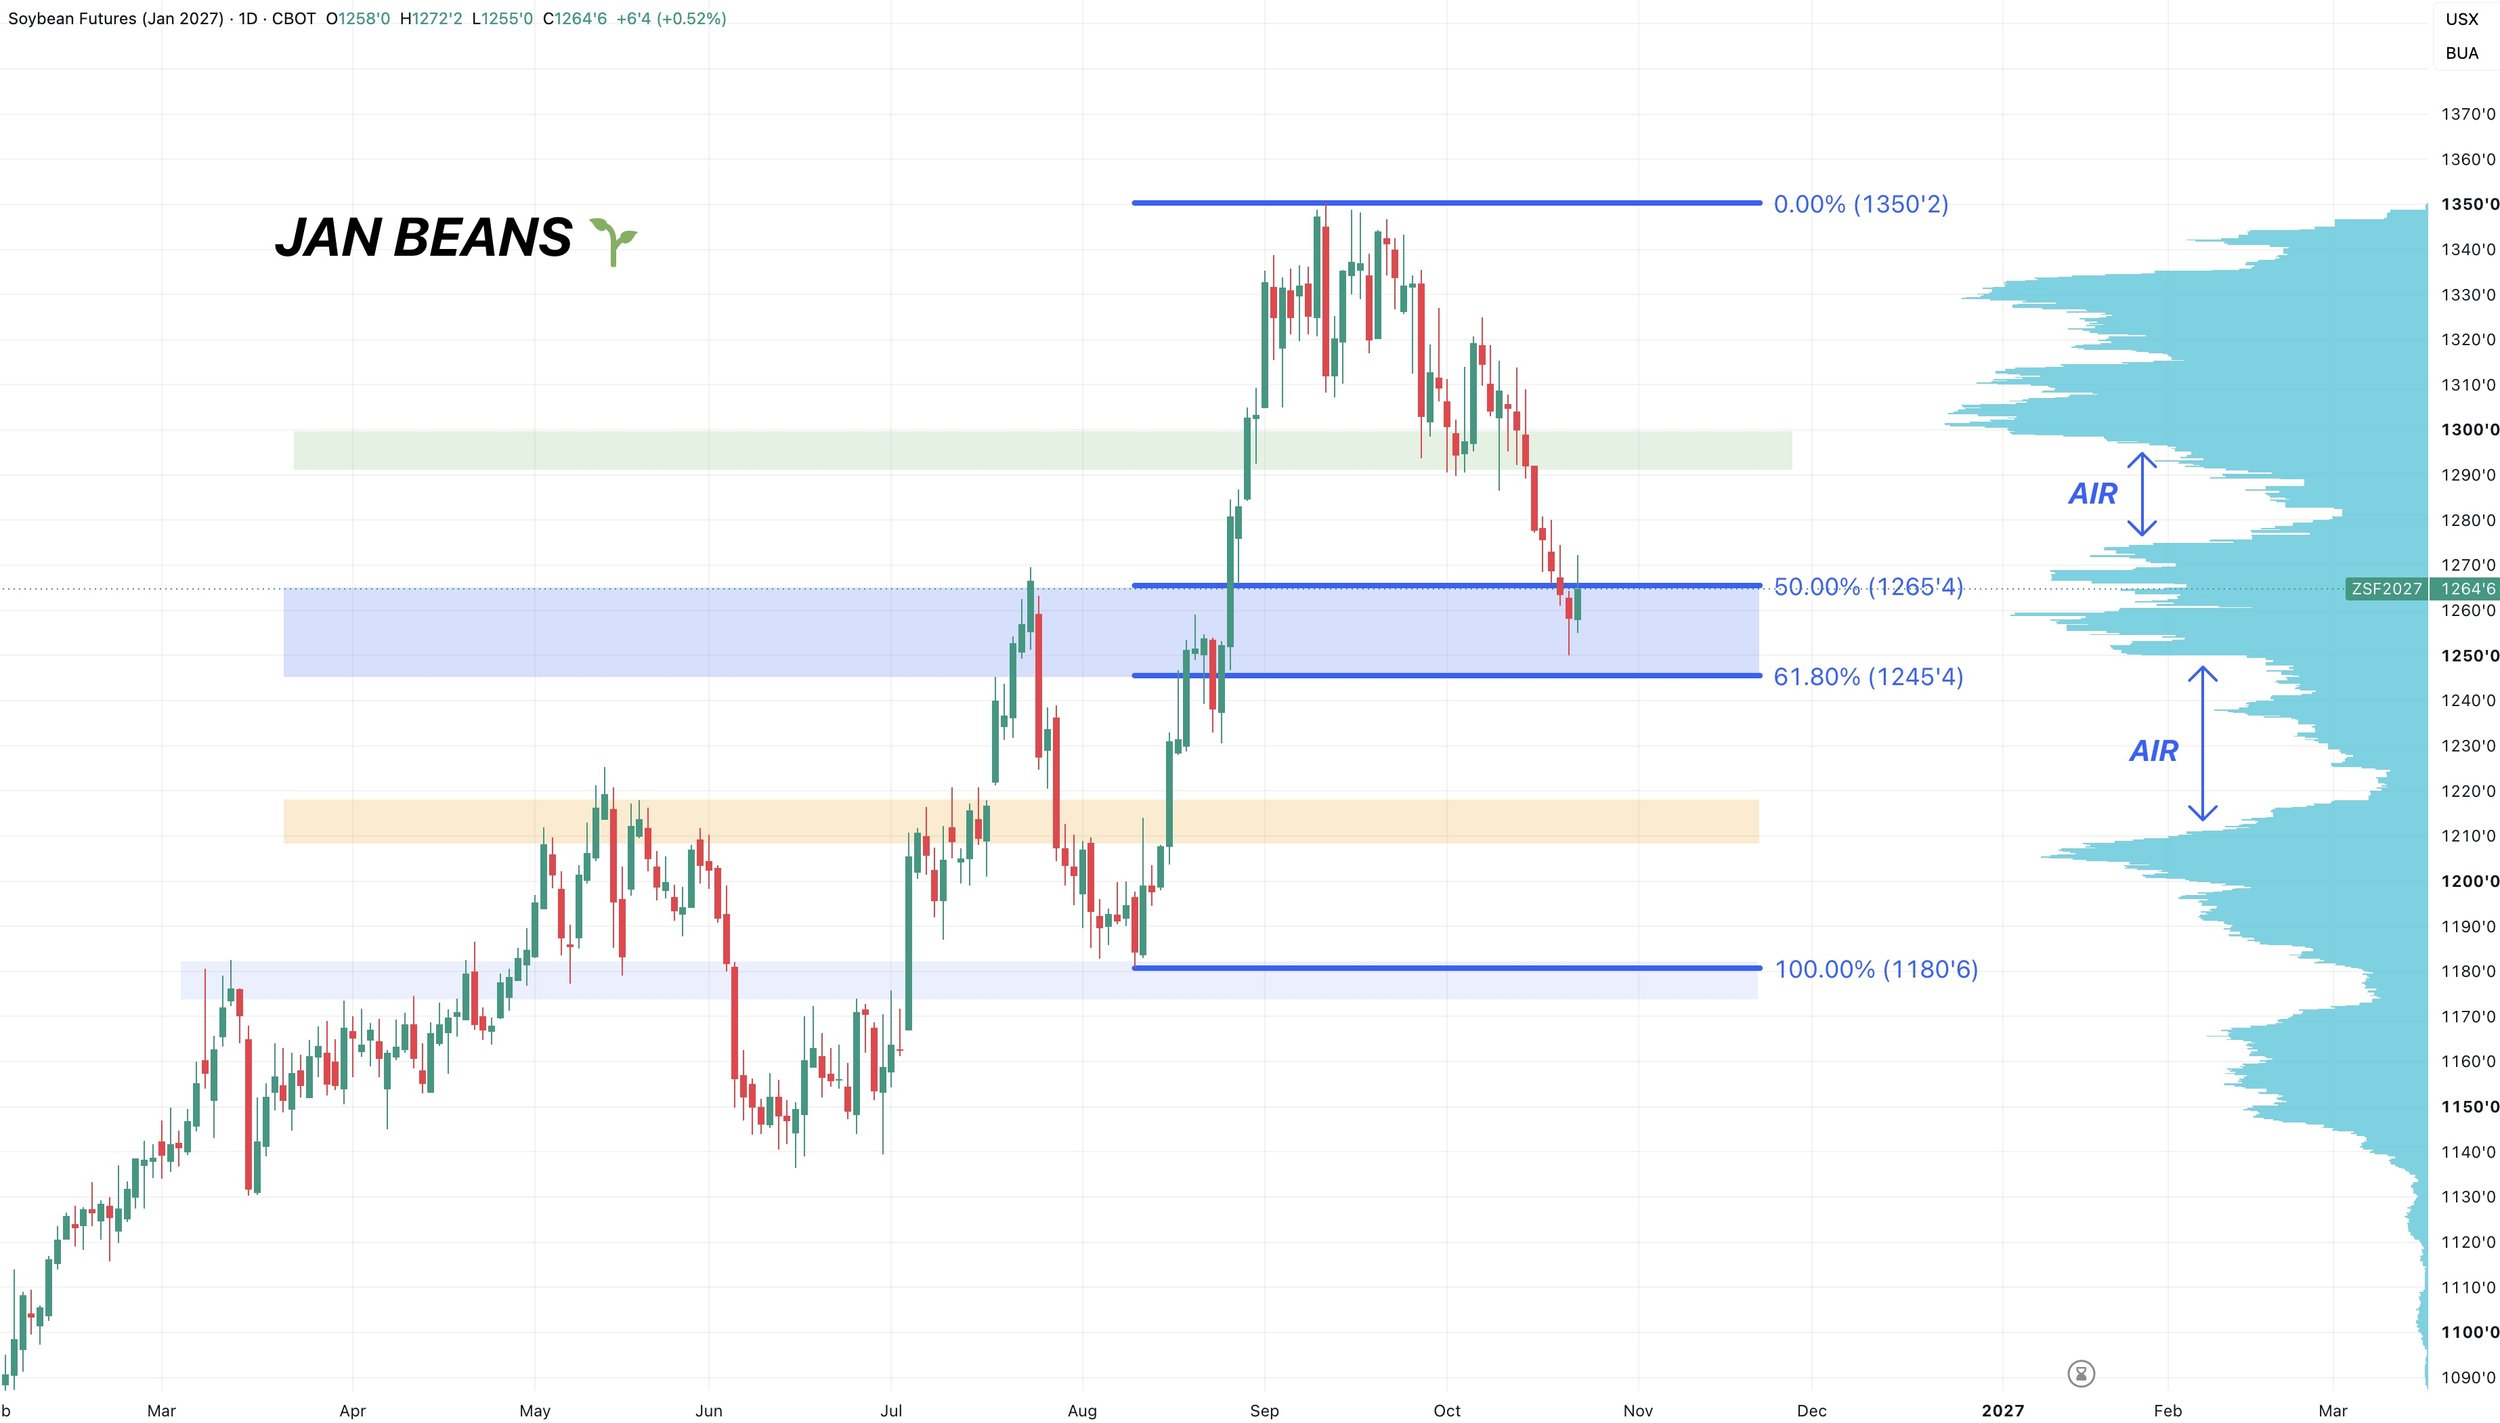
The focus will be on Jan beans soon.
Very similar look here.
You have some clear levels to watch.
We are right inside the golden zone down to the August lows. Testing the prior highs.
We are sitting right at a big shelf of volume, with air to the downside and the upside.
So if we fail to hold $12.45 it could be a fast trip lower towards those May highs.
On the flip side, we need to break back into that prior range and back into that top volume shelf to be confident beans are ready for the next leg.
As that old support is our new resistance.
Wheat
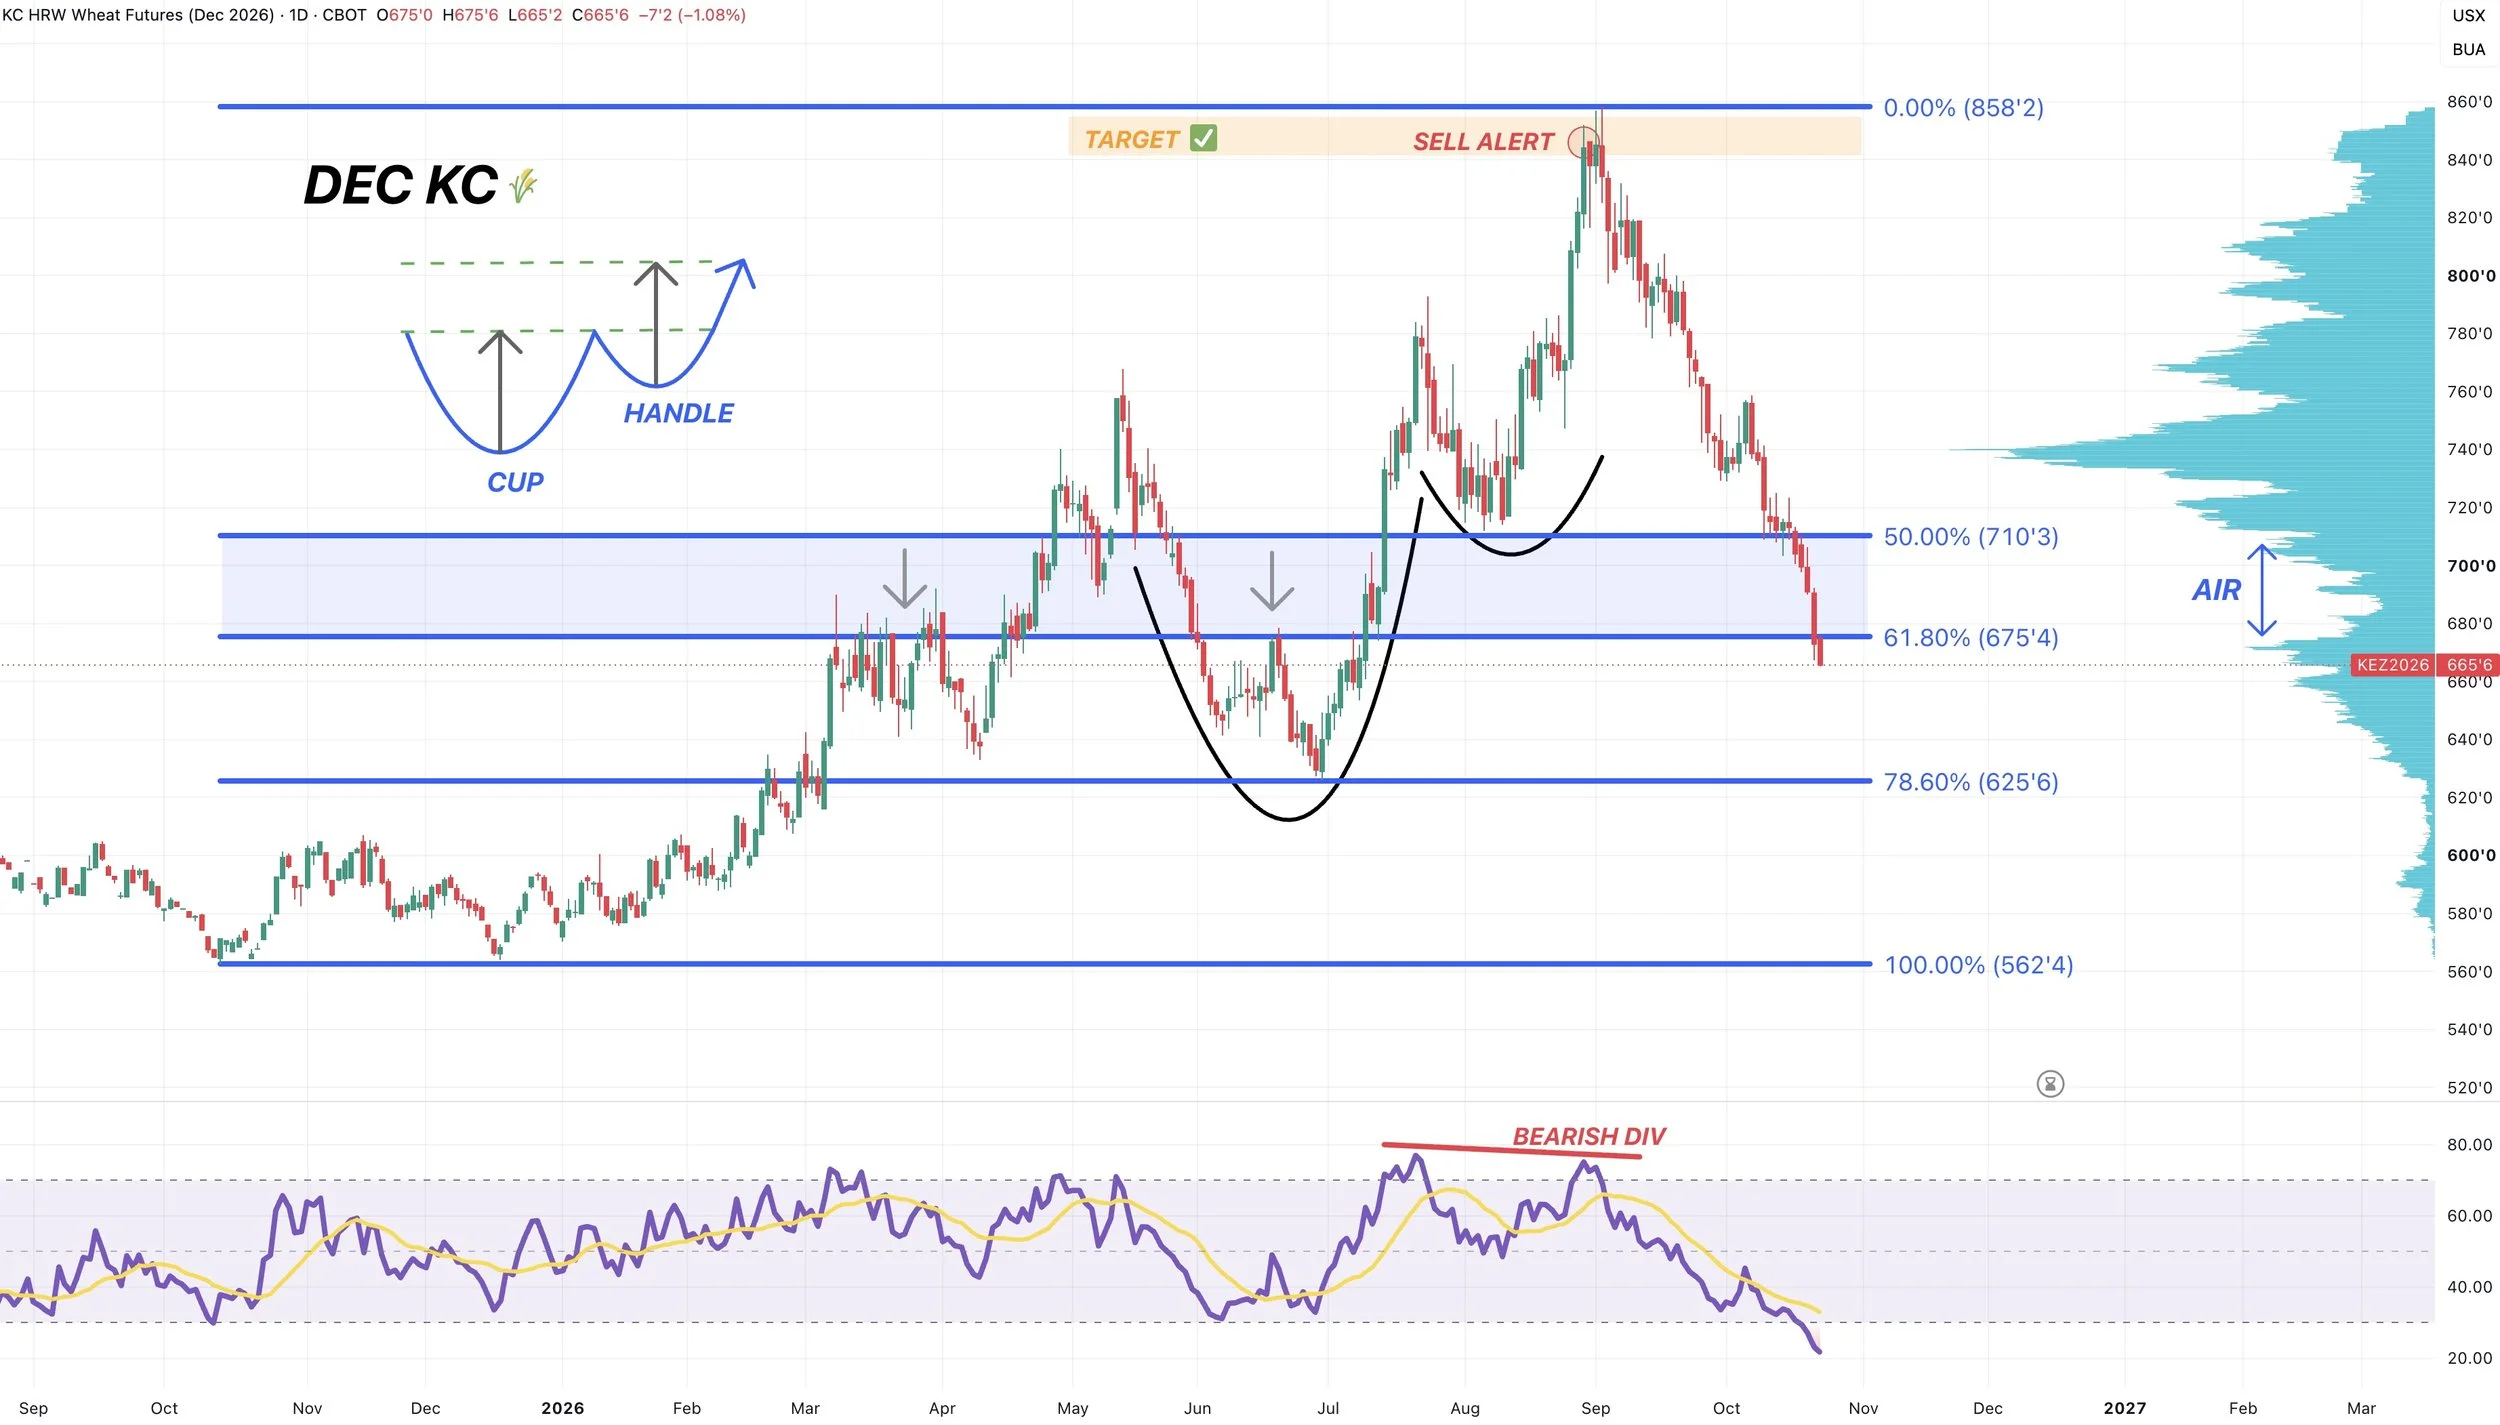
Dec KC Chart:
The brutal price action continues in wheat.
As we've broken nearly every support.
The Black Sea story hasn’t went anywhere but the market seems to care. This market has zero premium built into it.
Long term, it does feel like the market is discounting the impacts this could have. As Black Sea exports are projected to be down -40% vs last year.
To me it feels like wheat is a sleeper, and wheat will have its day again, but this is simply a catch a falling knife water fall type of market for the time being.
The one positive is that KC wheat is now in extreme oversold territory.
By far the most oversold it has ever been in this contract.
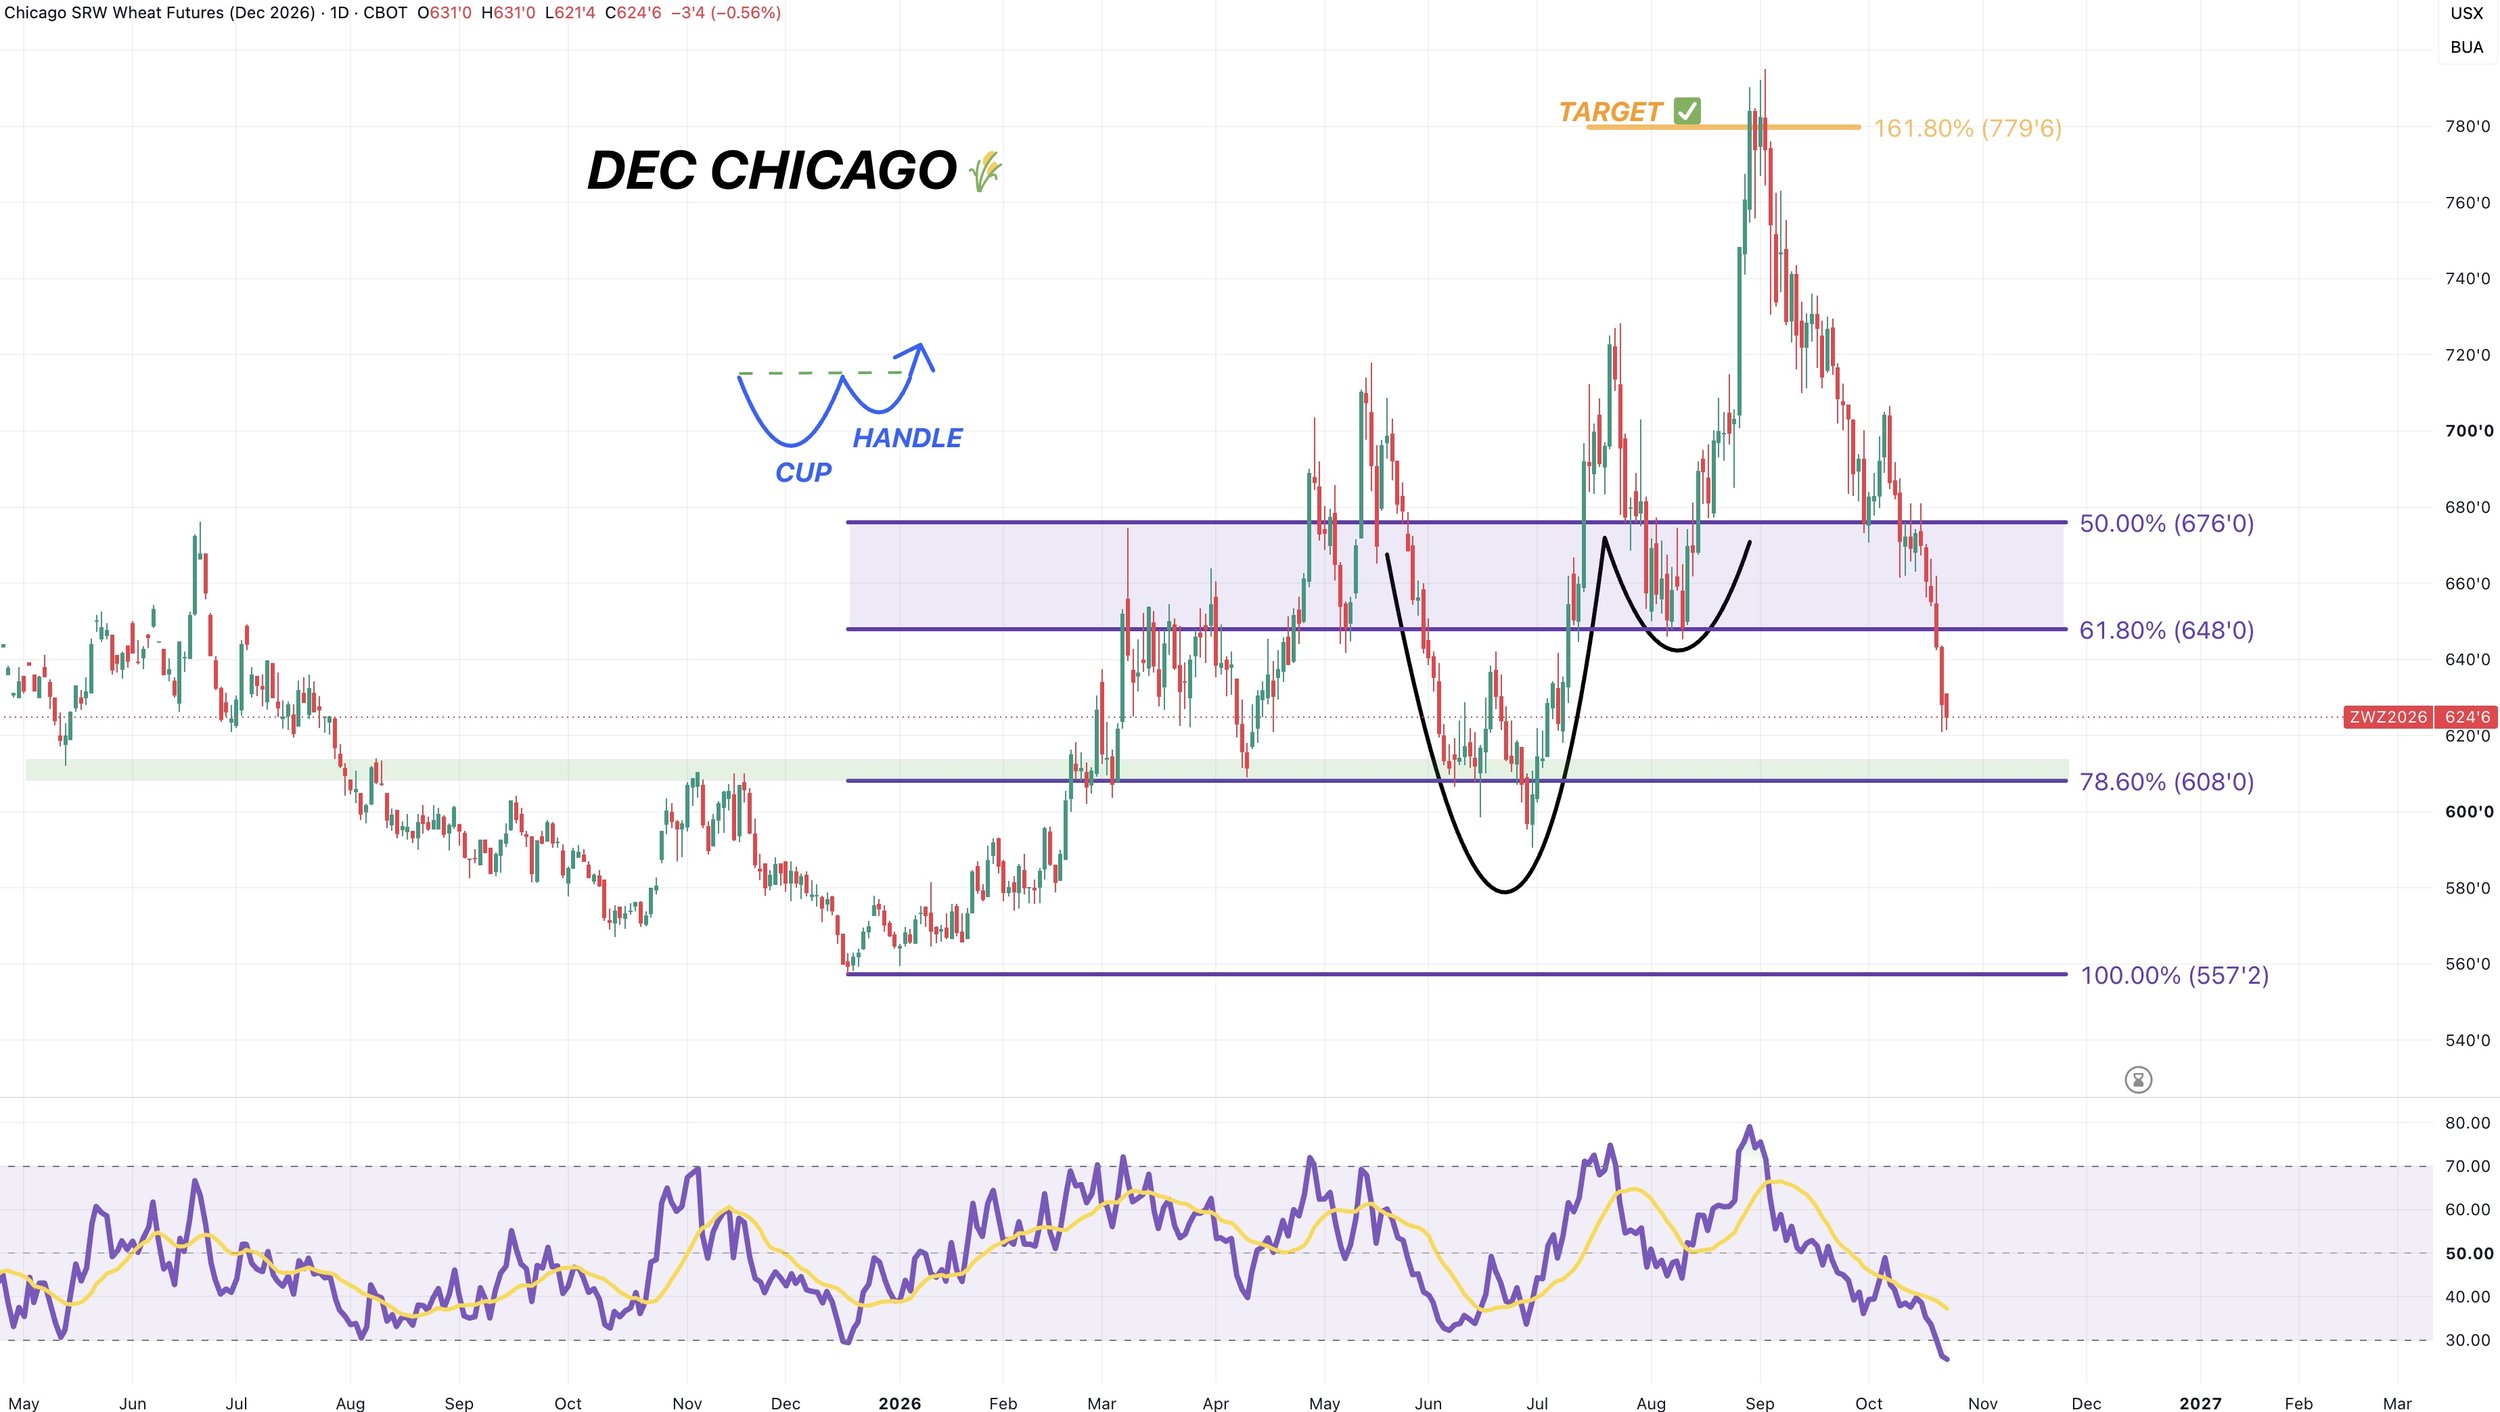
Dec Chicago Wheat Chart:
Chicago also continues to free fall and slice right through every single support.
The only support you have standing between the contract lows is that $6.08 to $6.15 range.
Like in KC, now sitting at it's most oversold levels ever for this contract.
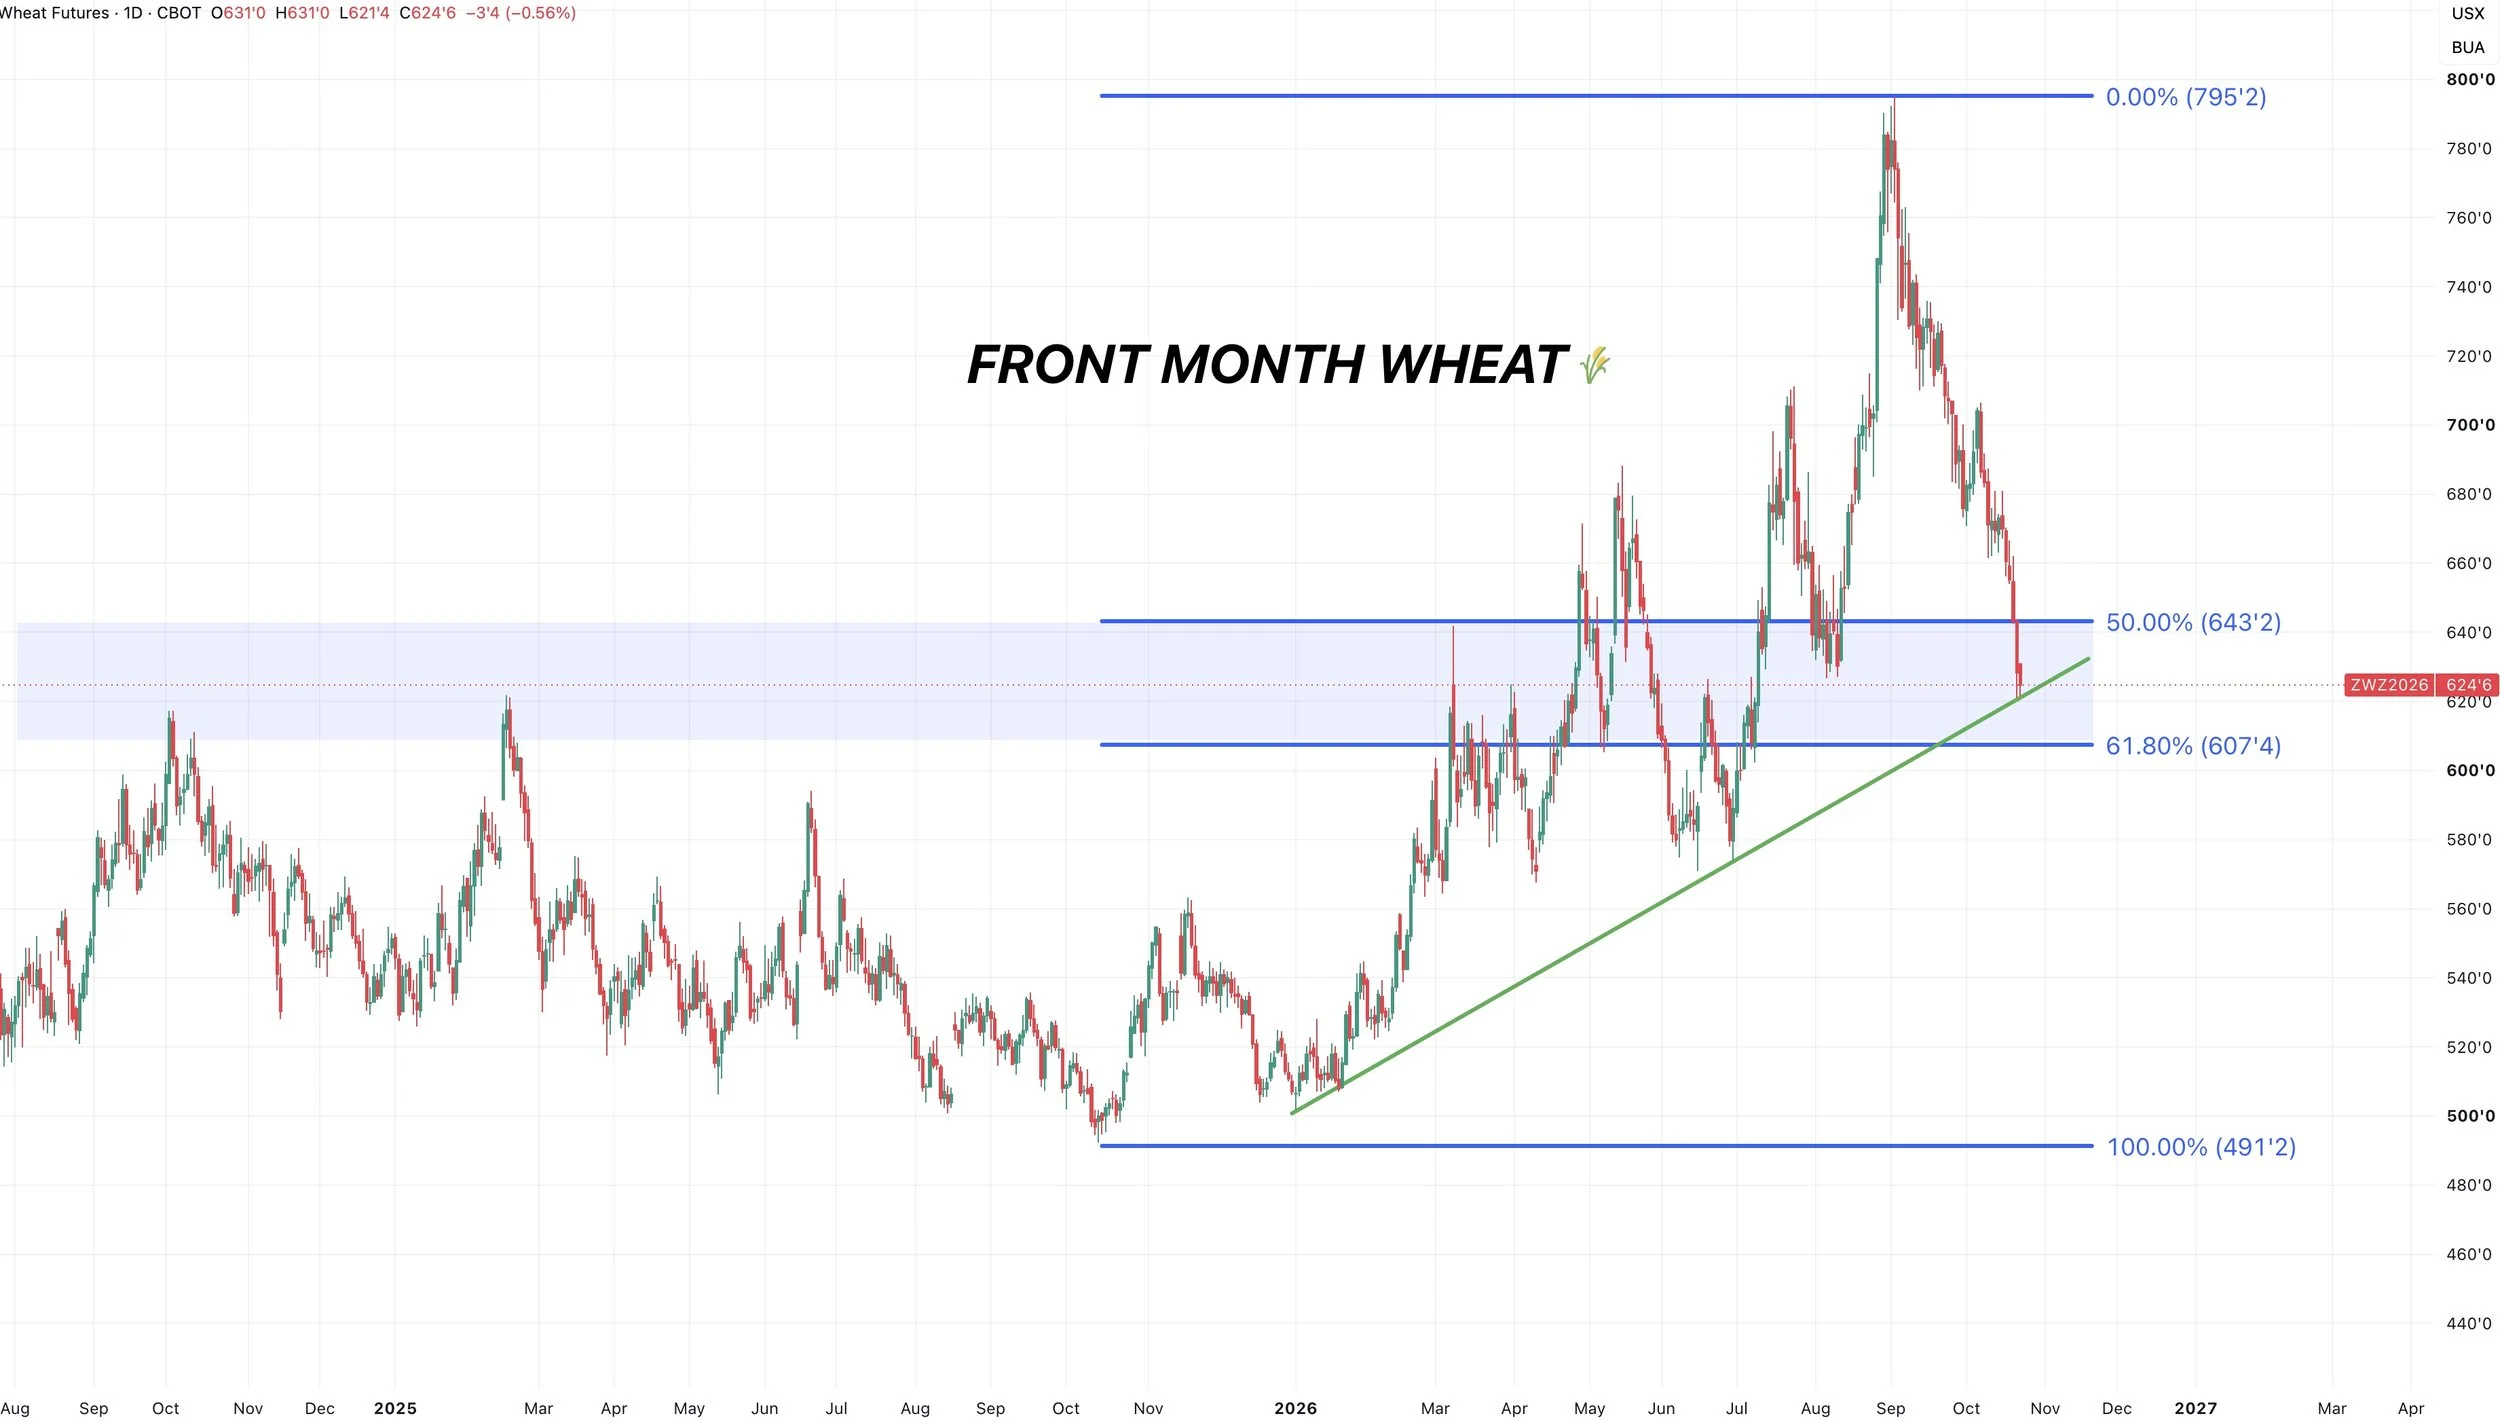
Front Month Chicago:
Here is the front month chart.
The Dec contracts have busted most of the supports. So it's obviously ugly.
However, the front month chart is still sitting at a big area of support.
The golden zone from the highs all the way down to the 2025 lows.
We do also have some potential trendline support sitting here as well.
I think wheat is undervalued here, but we just need to see some sort of confirmation and sign of life.
Cattle
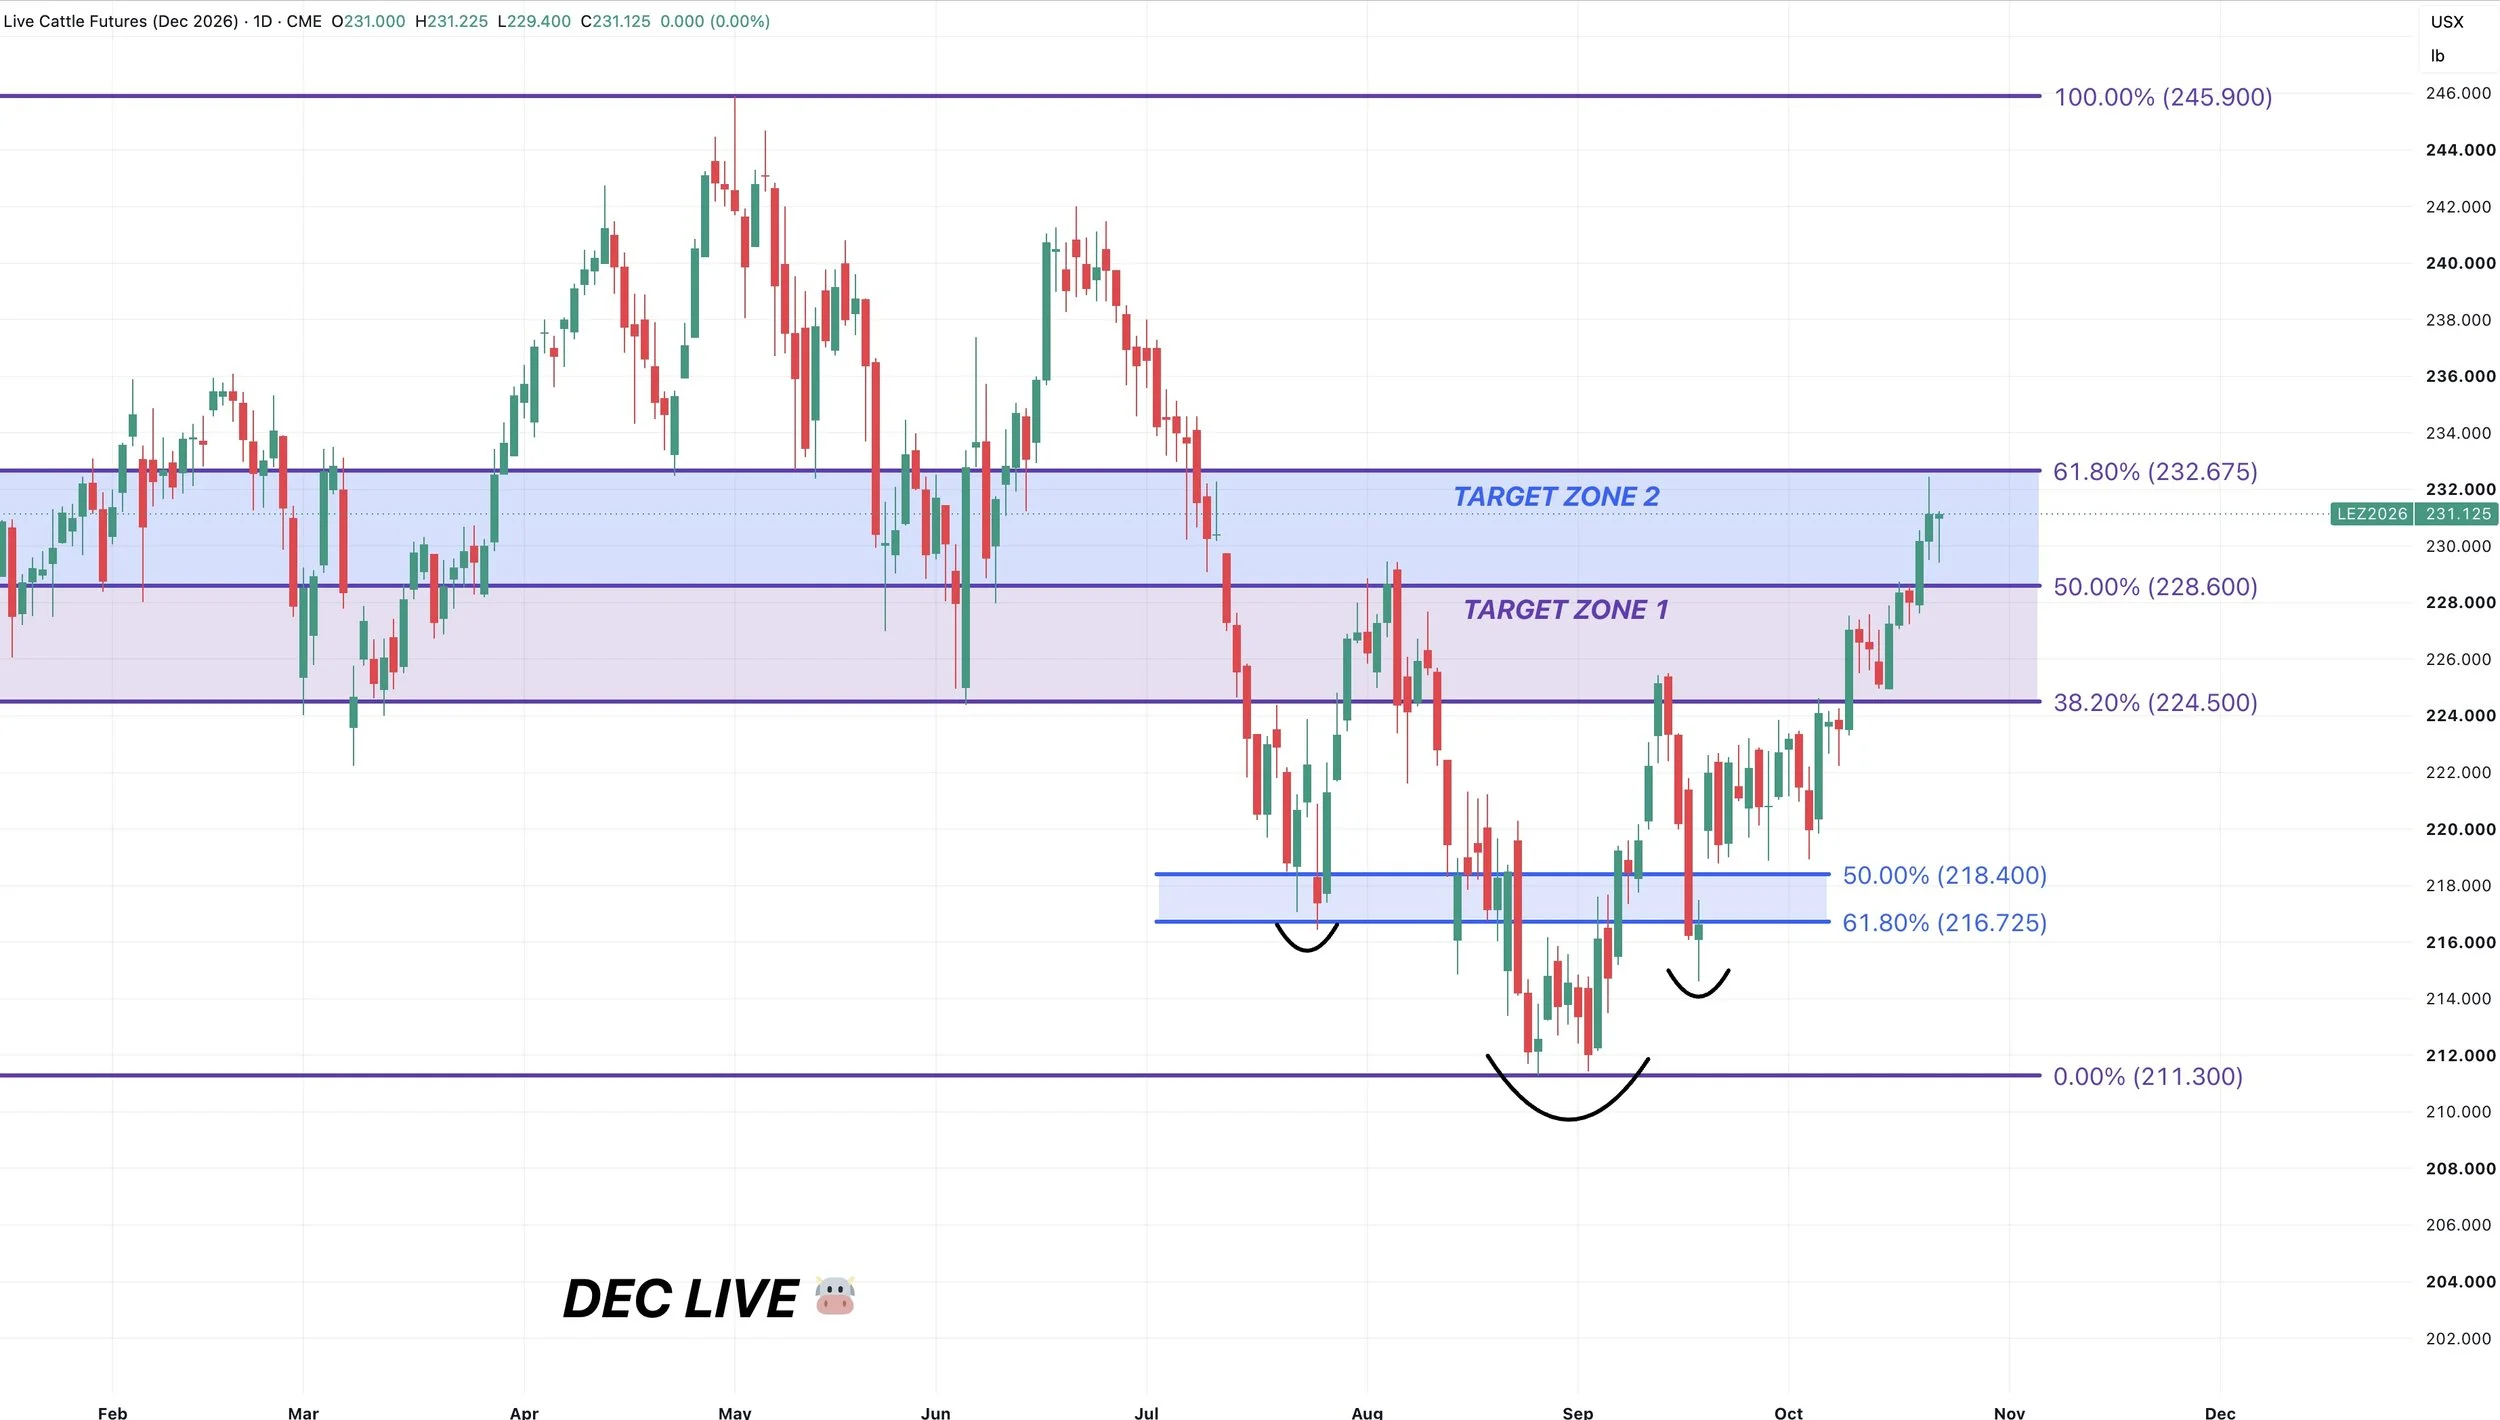
Dec Live:
We recently had a hedge alert up at these levels. So we do like managing some risk up here if you have not yet.
Dec live cattle perfectly tagged that 61.8% retracement up to the May highs.
If this is just a corrective rally inside a broader downtrend, this would be a very common area to stall.
So it's viewed as resistance for now until we break through.
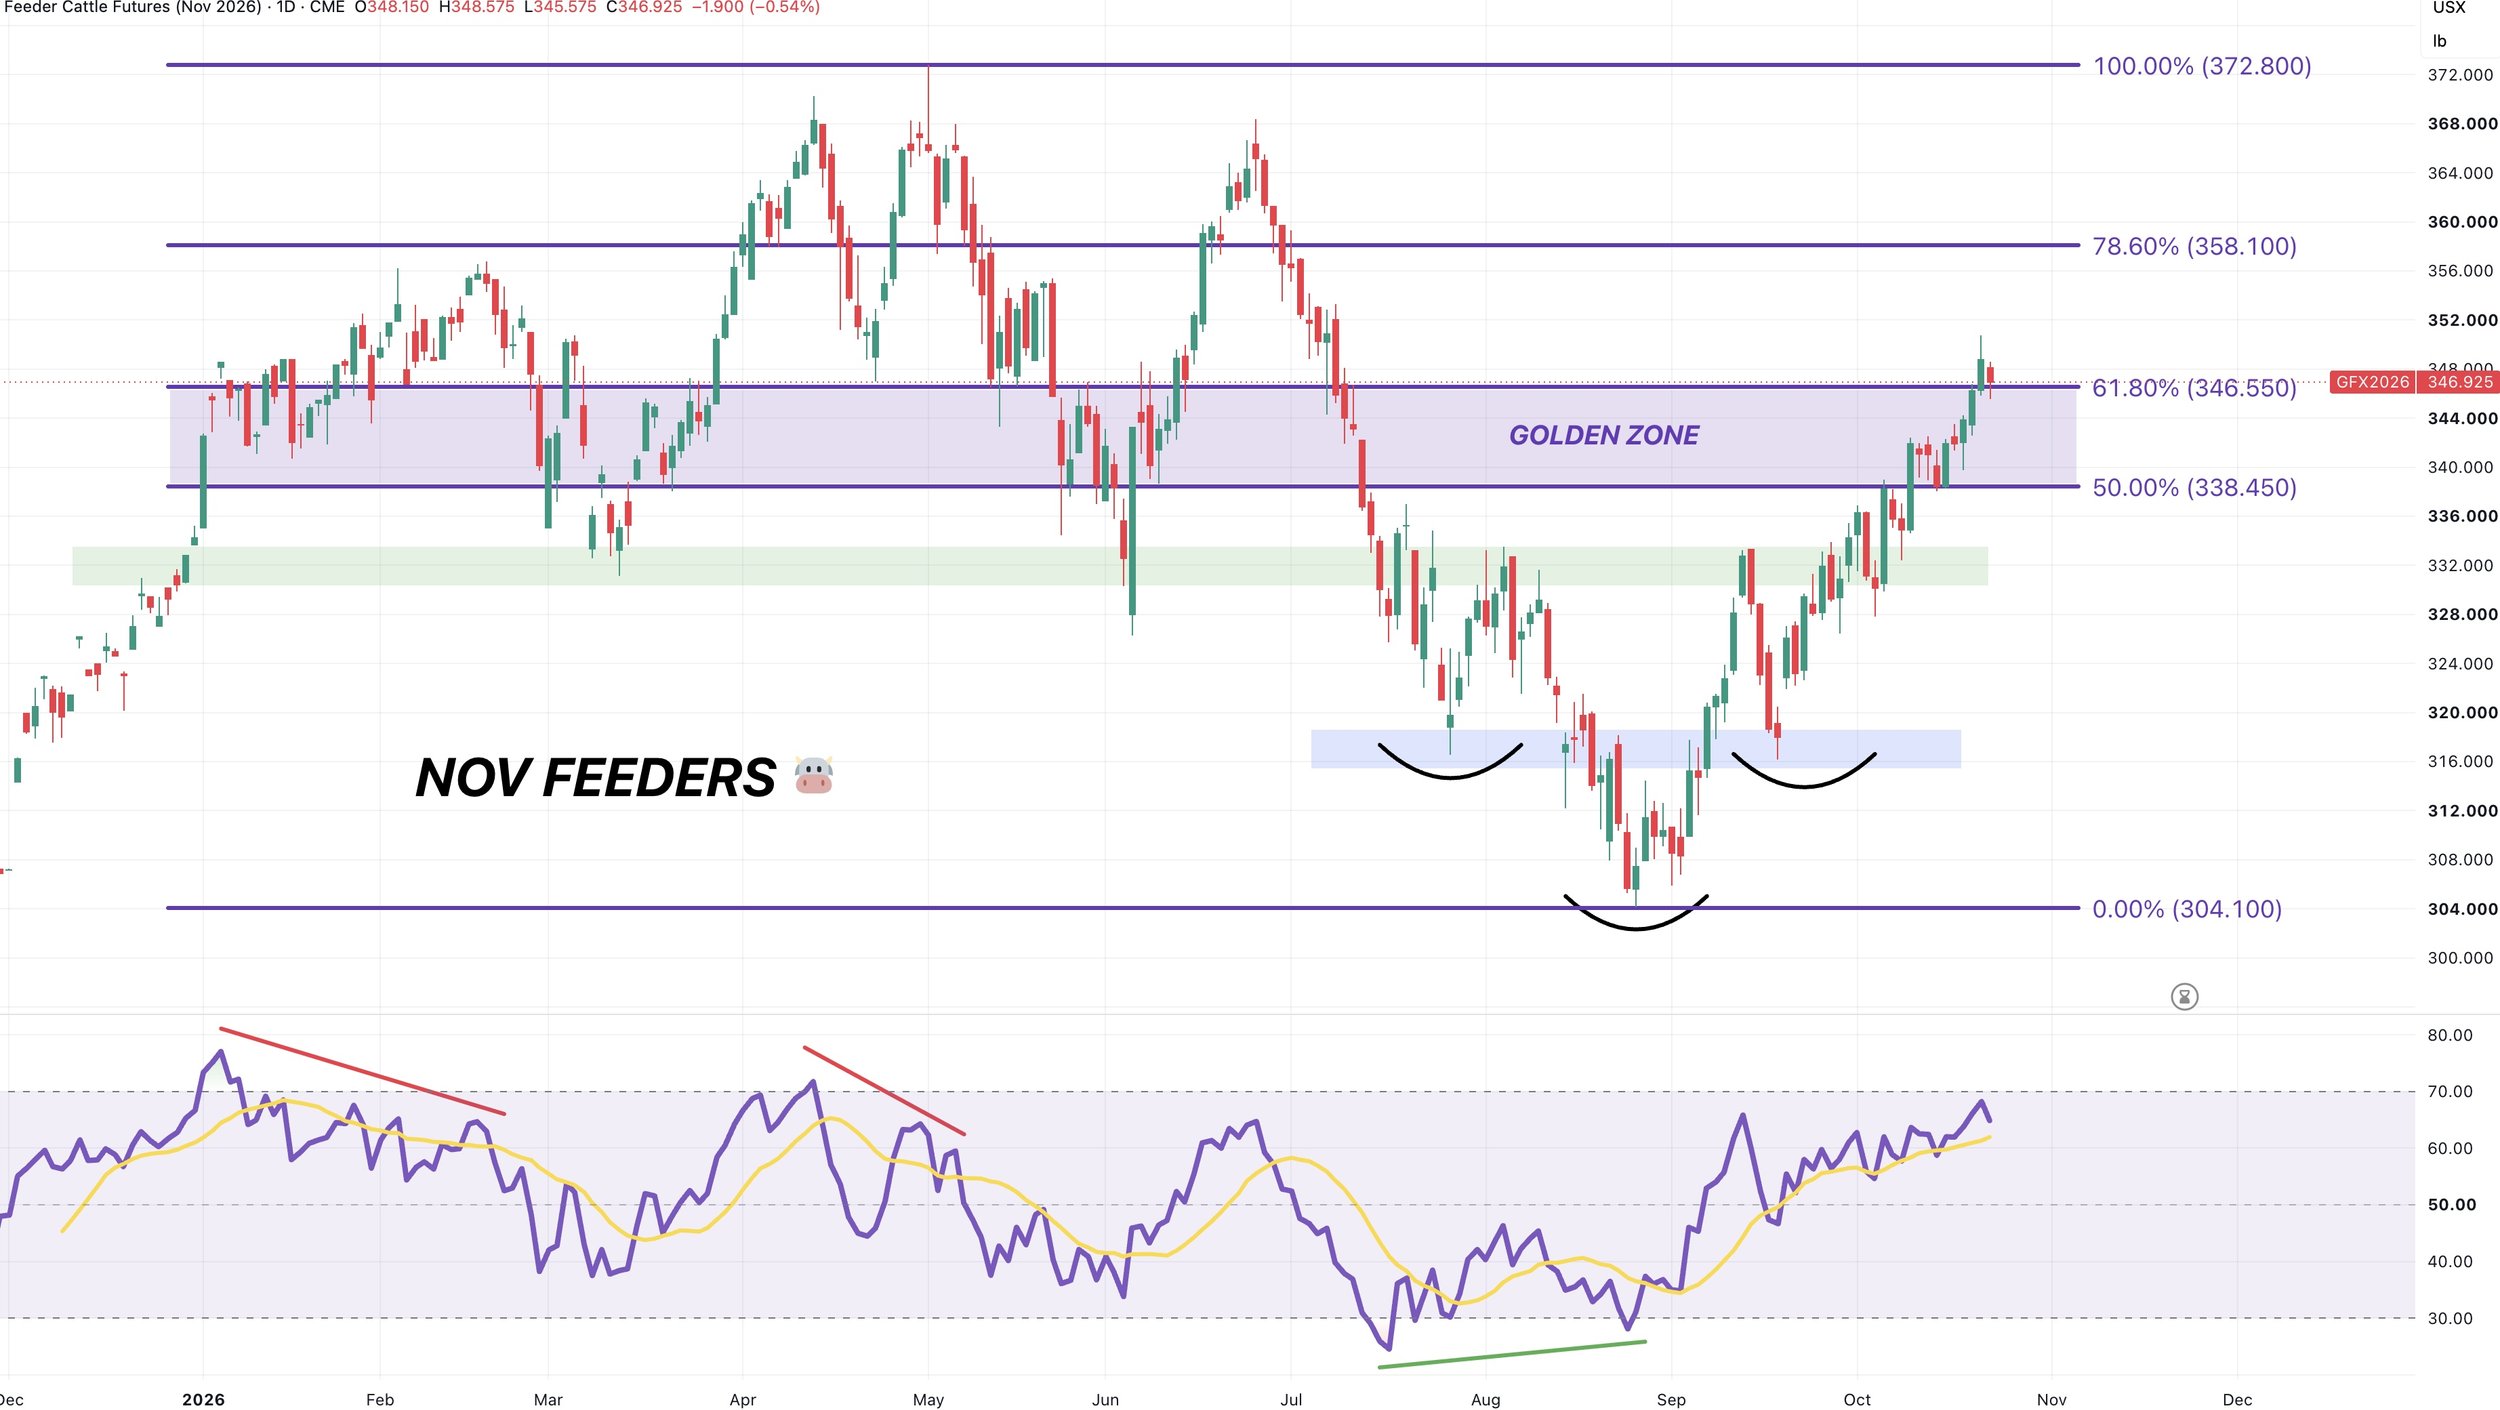
Nov Feeders Chart:
Feeders did manage to break above that target box slightly.
And we are no longer showing bearish divergence as the RSI posted new highs. However, now starting to enter overbought territory.
We could still push higher from here, but I still view this as a good spot to manage some risk.
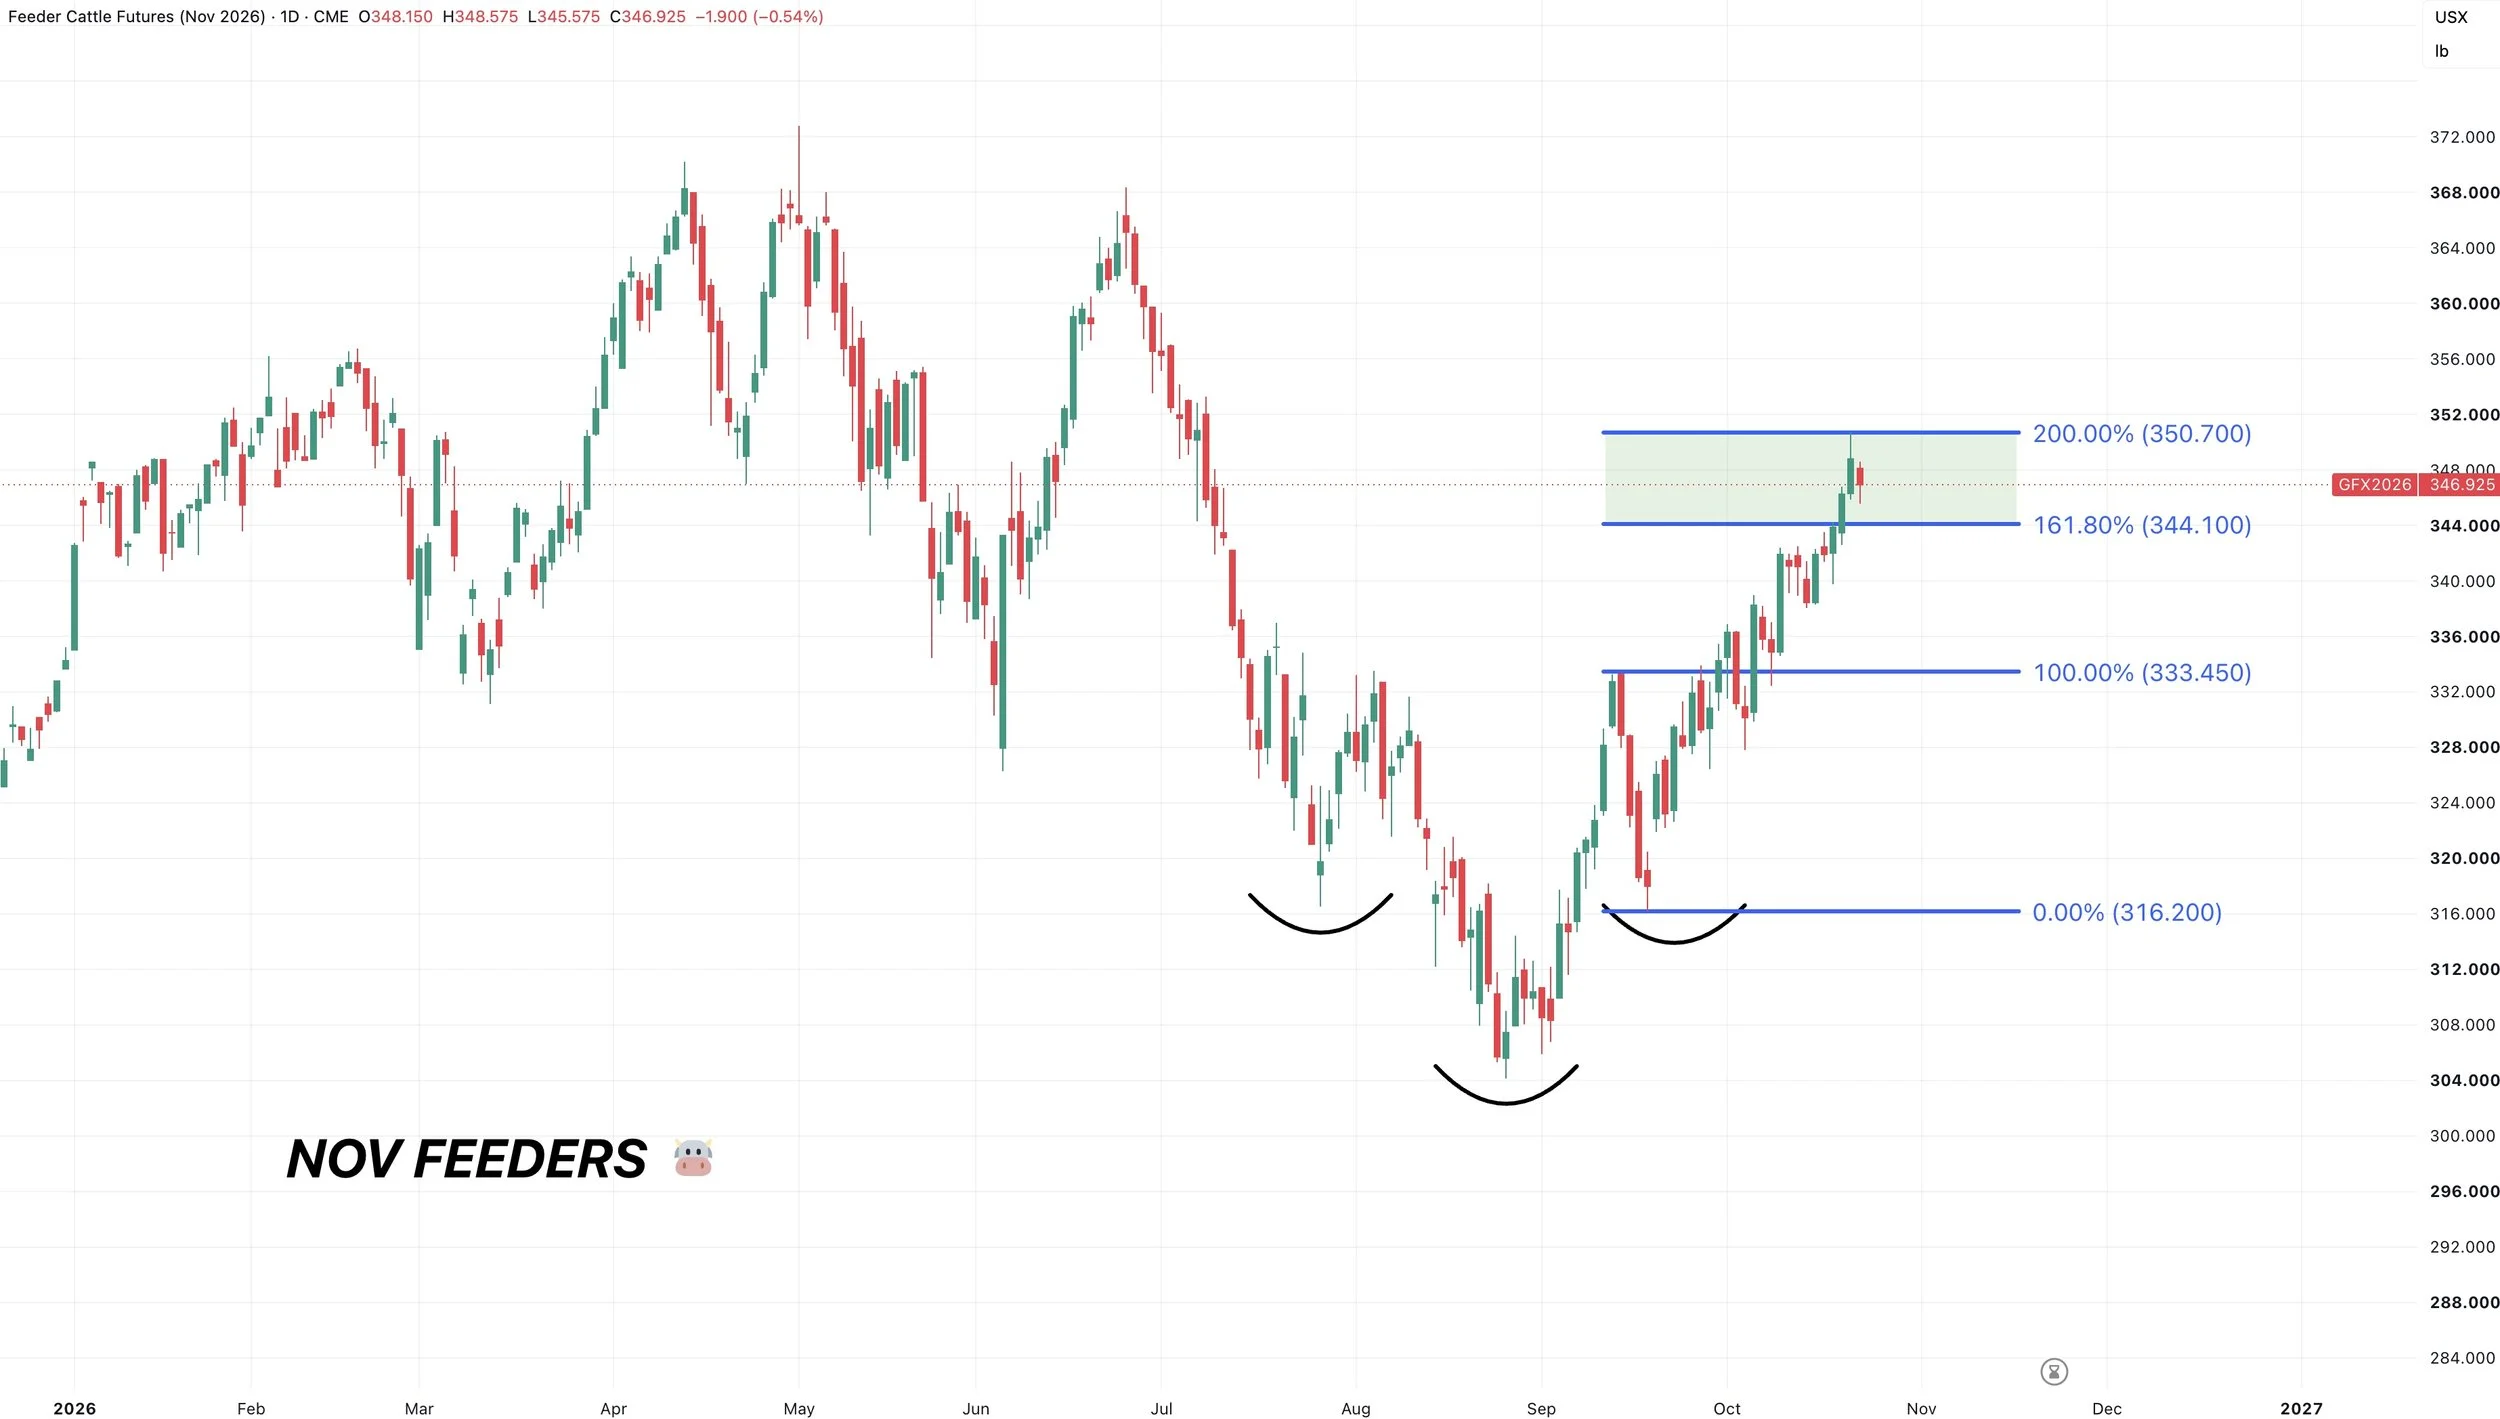
Feeders also hit the 200% fib extension from the first rally off the lows.
The 161.8% level is more common, but the 200% level is not uncommon either.
Just another reason I like getting a start on defending these levels.
Want to Talk?
Our phones are open 24/7 for you guys if you ever need anything or want to discuss your operation.
Jeremey & Office: (806)484-1214
Sebastian: (605)280-1186
Email: sfrost@dailymarketminute.com
Hedge Account
Interested in a hedge account? Use the link below to set up an account or give us a call.