
START OF A BULL MARKET?
MARKET UPDATE
You can scroll to read the usual update as well. As the written version is the exact same as the video.
Timestamps for video:
Overview: 0:00min
Corn: 4:00min
Corn Charts: 9:05min
Beans: 10:40min
Bean Charts: 14:45min
Wheat Charts: 16:10min
Cattle Charts: 18:00min
Want to talk?
Office: (806)484-1214
Futures Prices Close
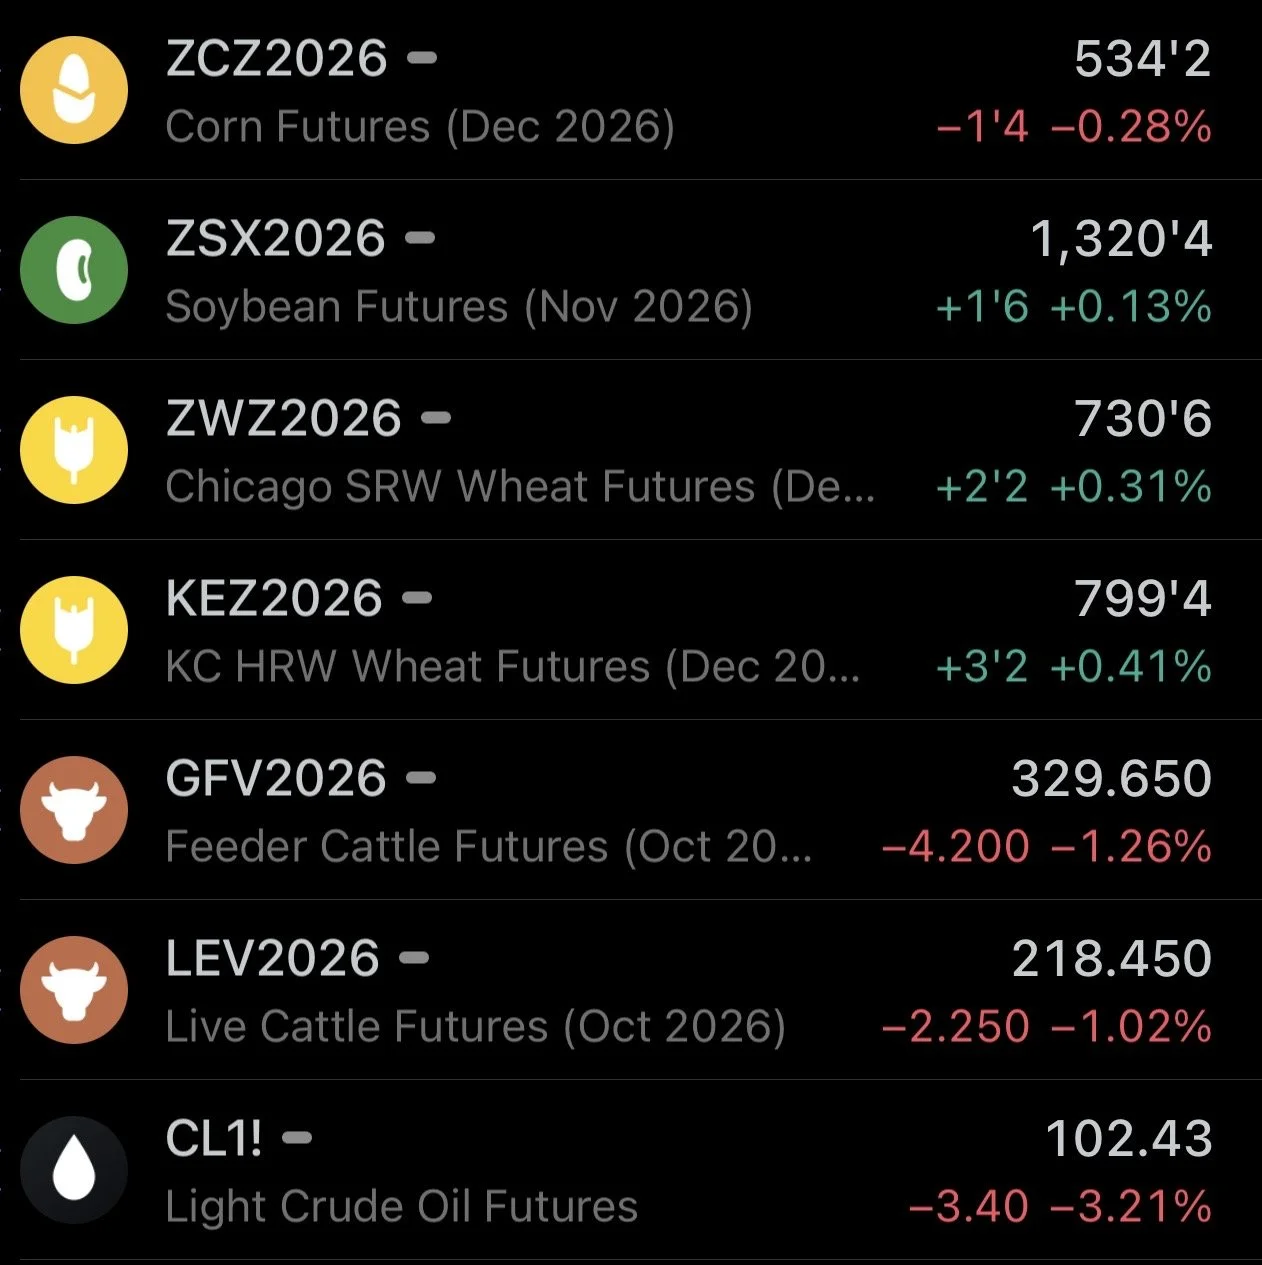
Overview
Grains were higher overnight, then spent most of the day in the red leading into the Feds interest rate decision. After the decision the grains found some life and bounced into the close.
But soybeans specifically faded well off the early highs. They tested contract highs overnight but ended the day -12 cents off the highs.
The price action has been pretty much sideways this week, as corn and soybeans have yet to break out of the big ranges we saw on the day of the USDA report.
Meal has been supporting the bean market as it just posted new contract highs.
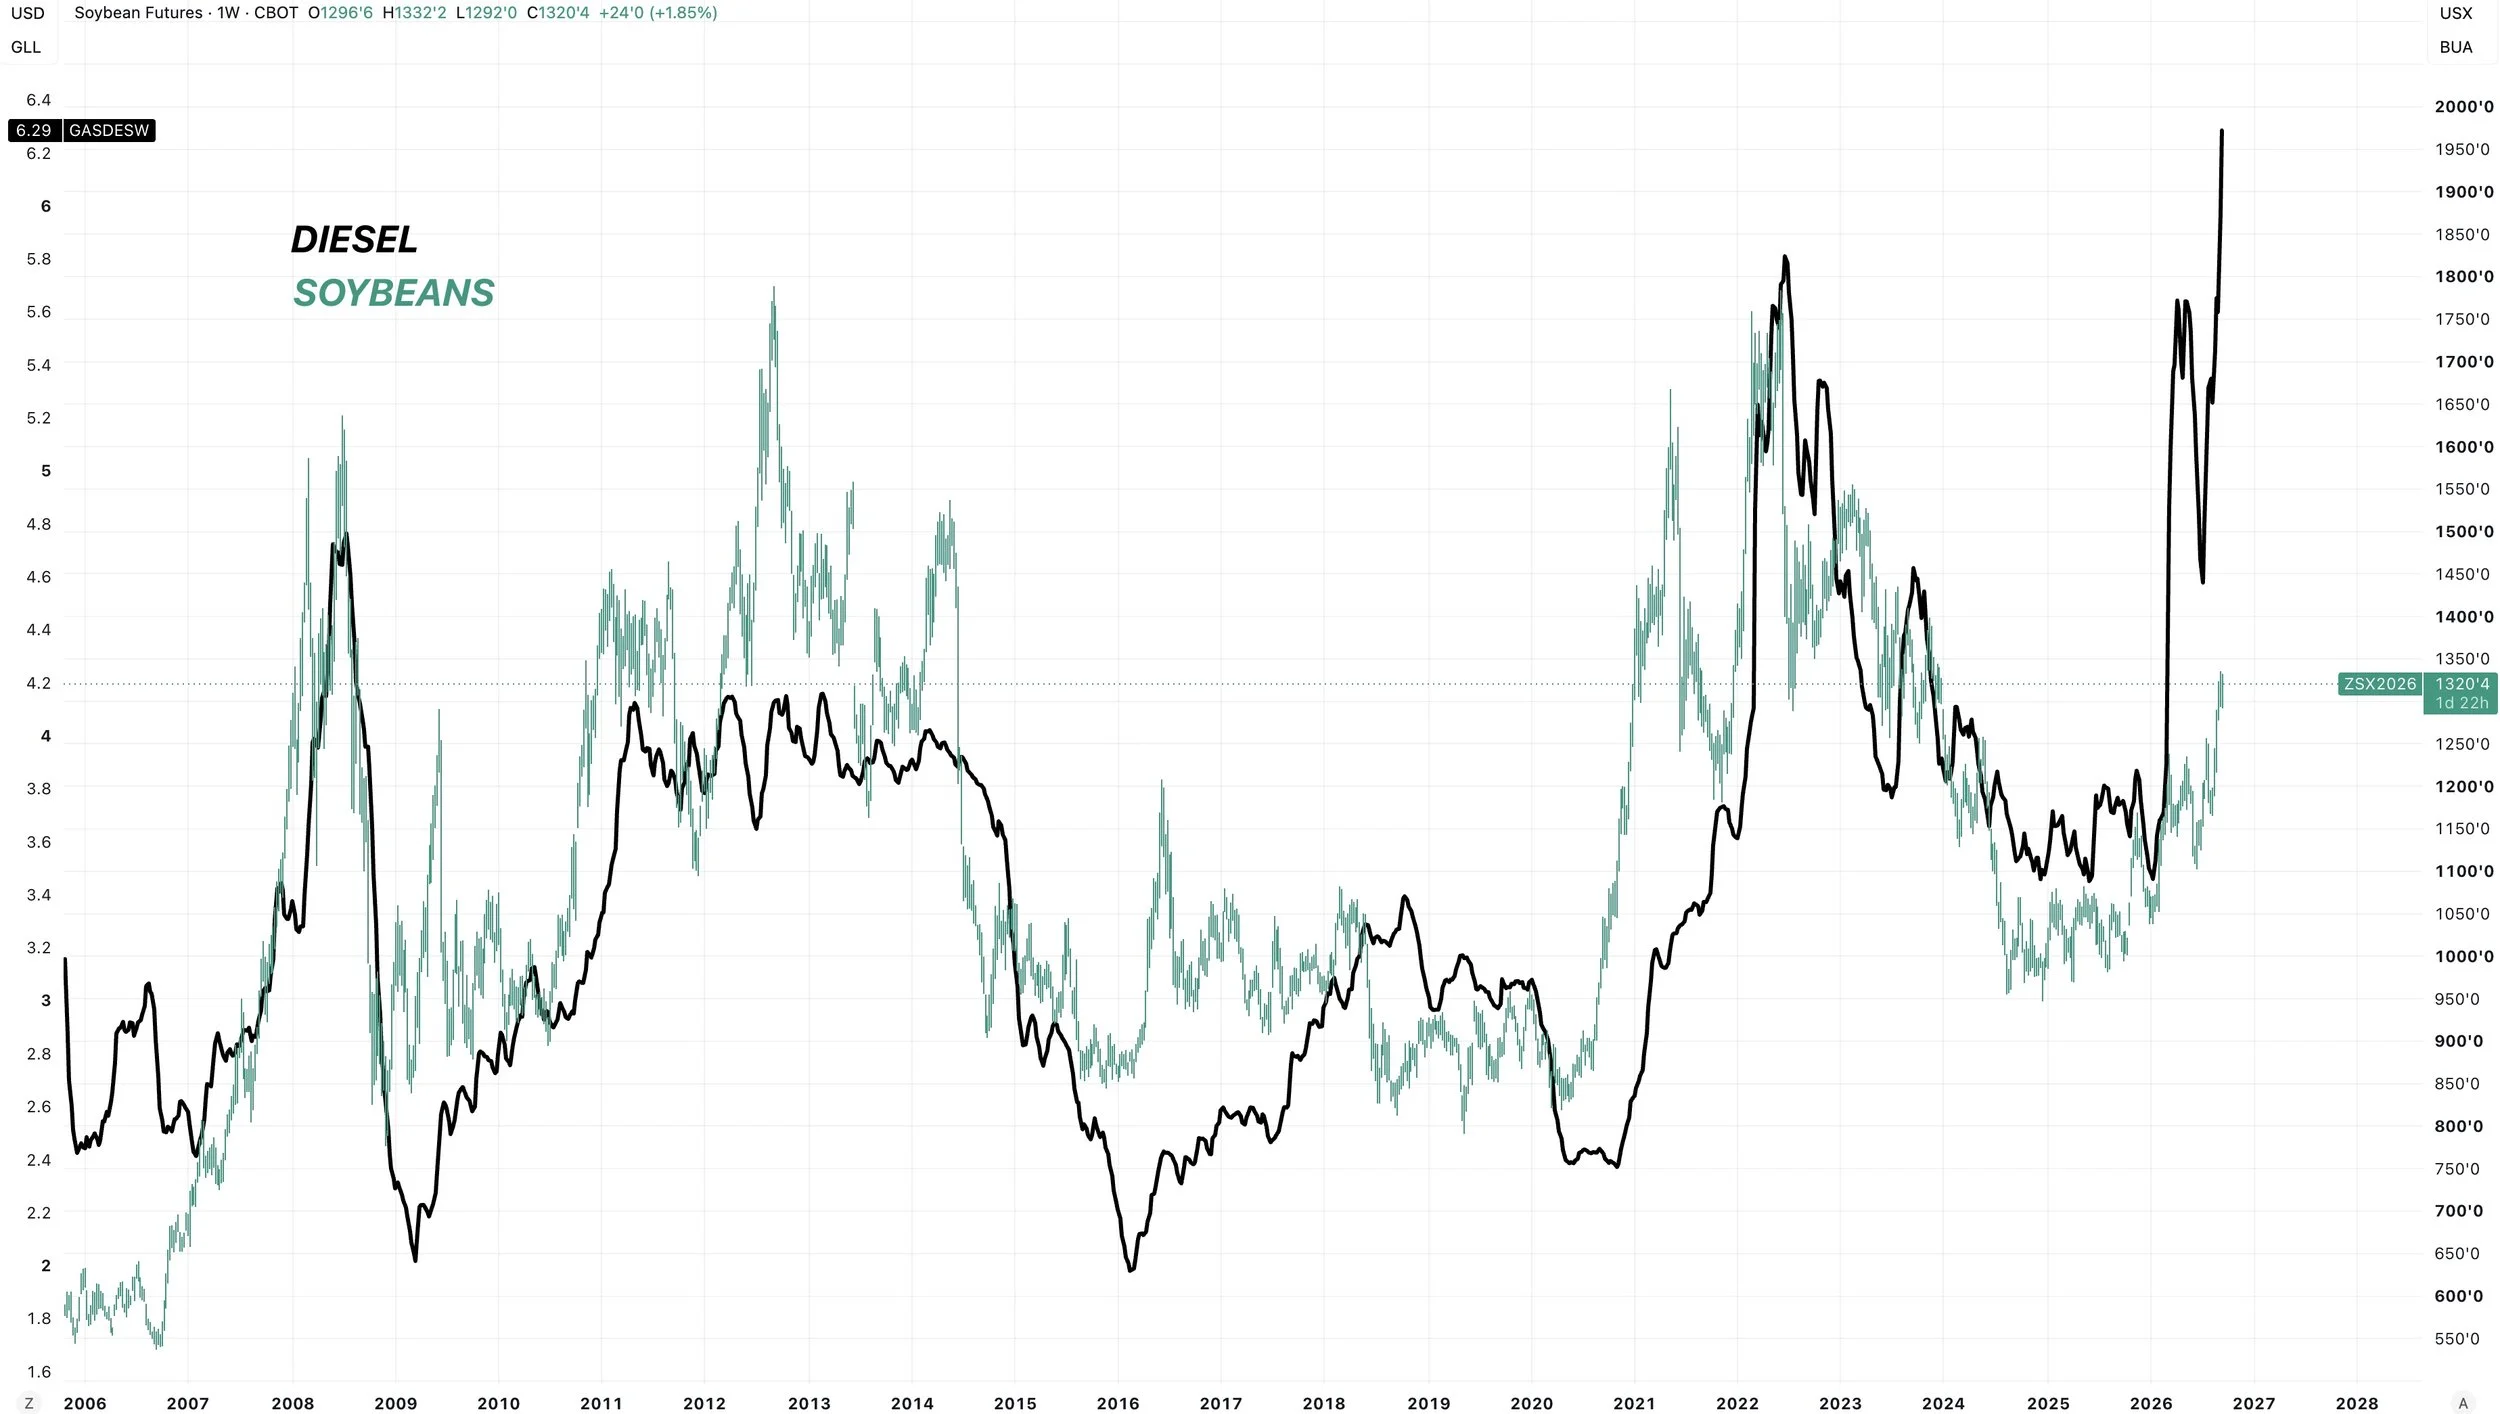
High diesel prices are also helping give soybeans a story. As diesel has ran up to an all-time high.
Here is a chart that compares diesel vs soybeans. They do tend to have a decently high correlation.
So soybeans have been jumping on this story.
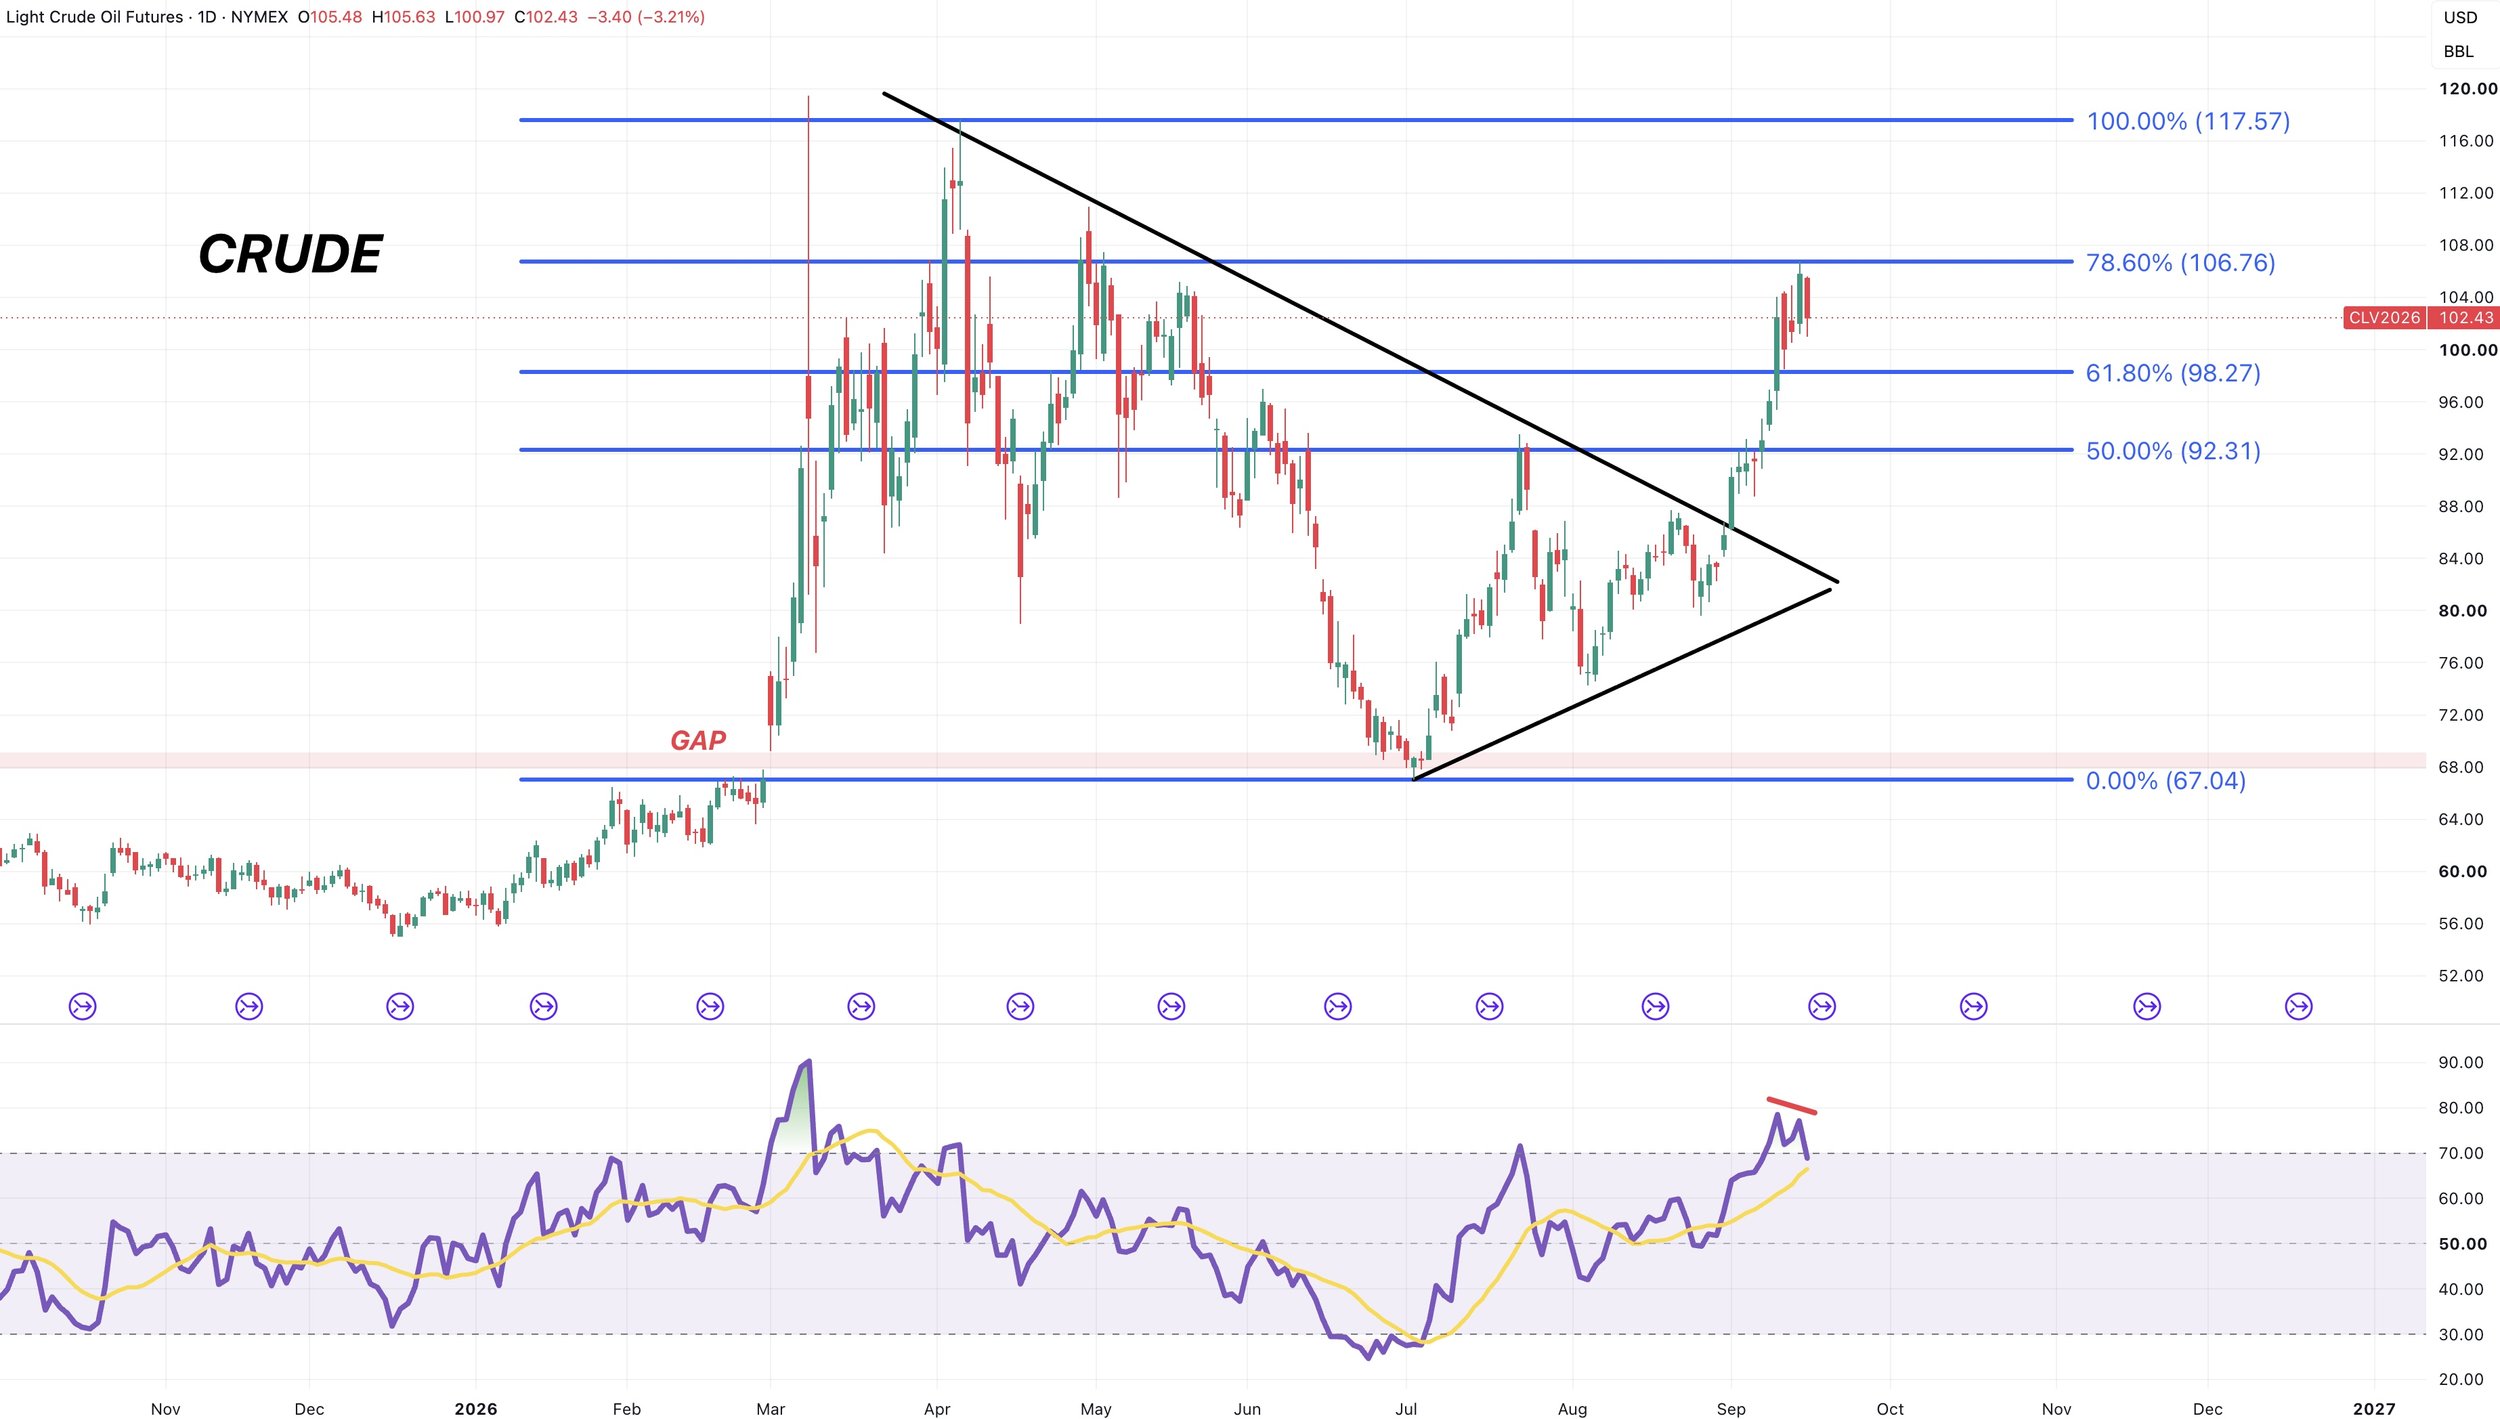
Crude oil was down a good chunk today following the recent run up.
As it had been running higher with inflation concerns.
Currently, it's rejecting the 78.6% retracement.
We also have some bearish divergence.
So a pullback would not be a surprise unless we break above these recent highs.
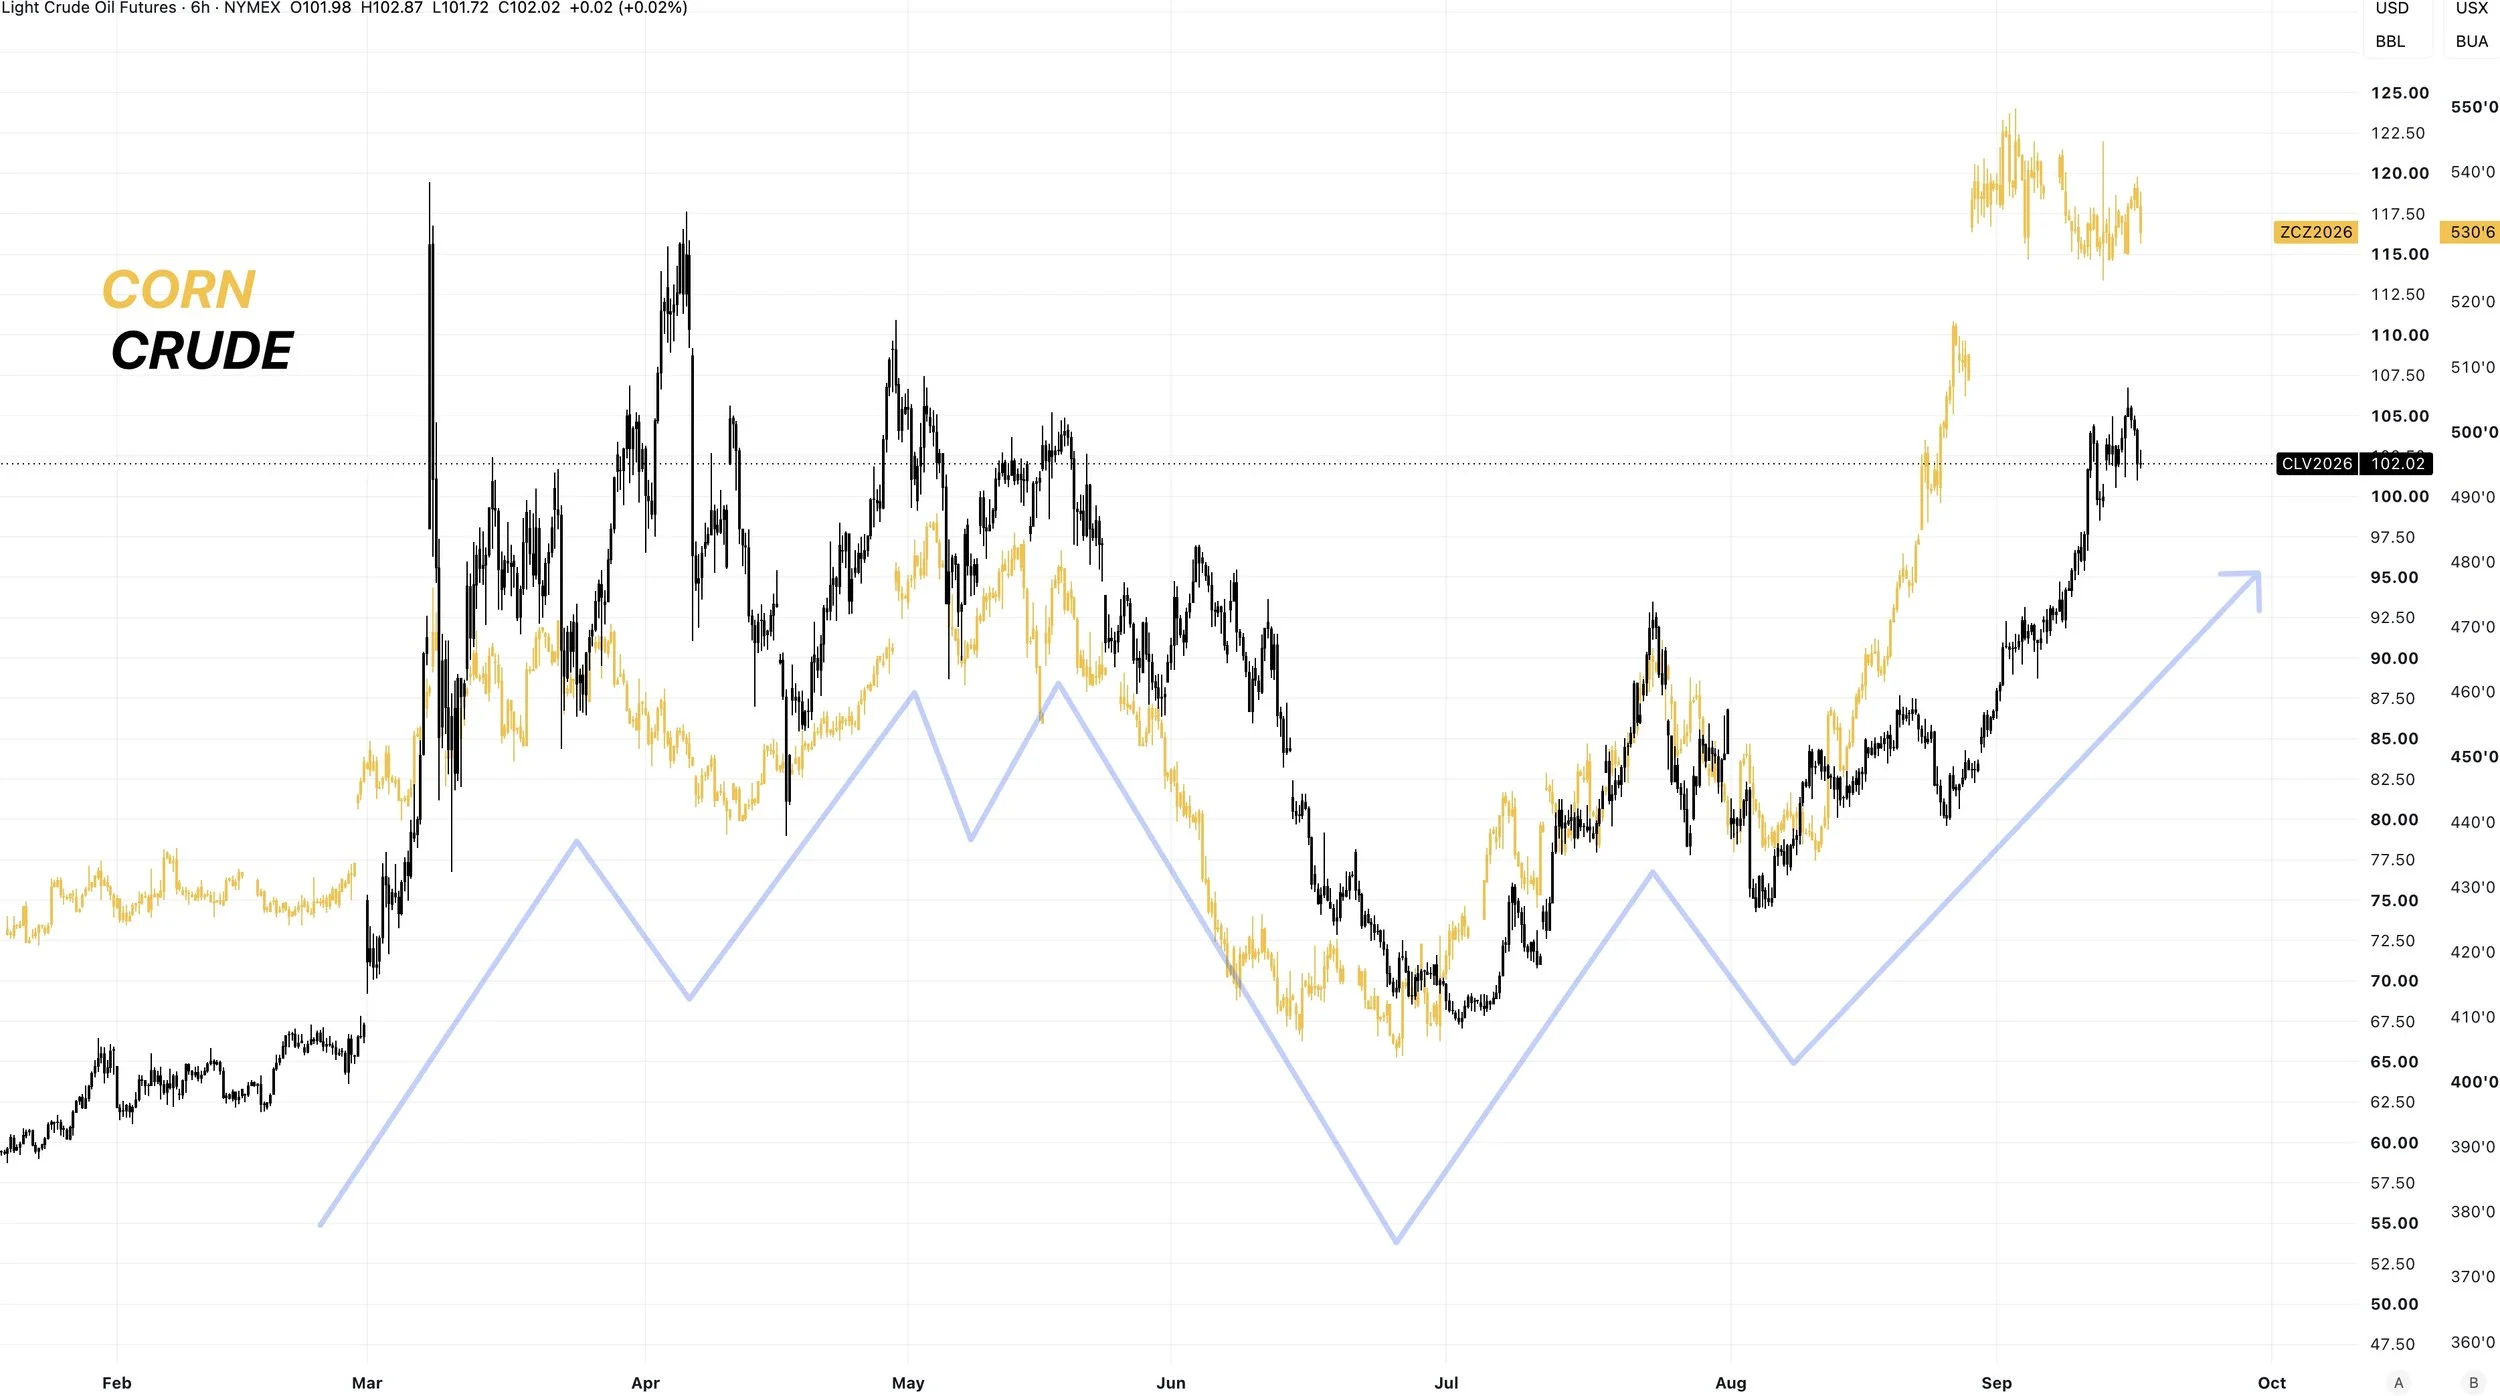
Where crude goes from here is going to be impactful.
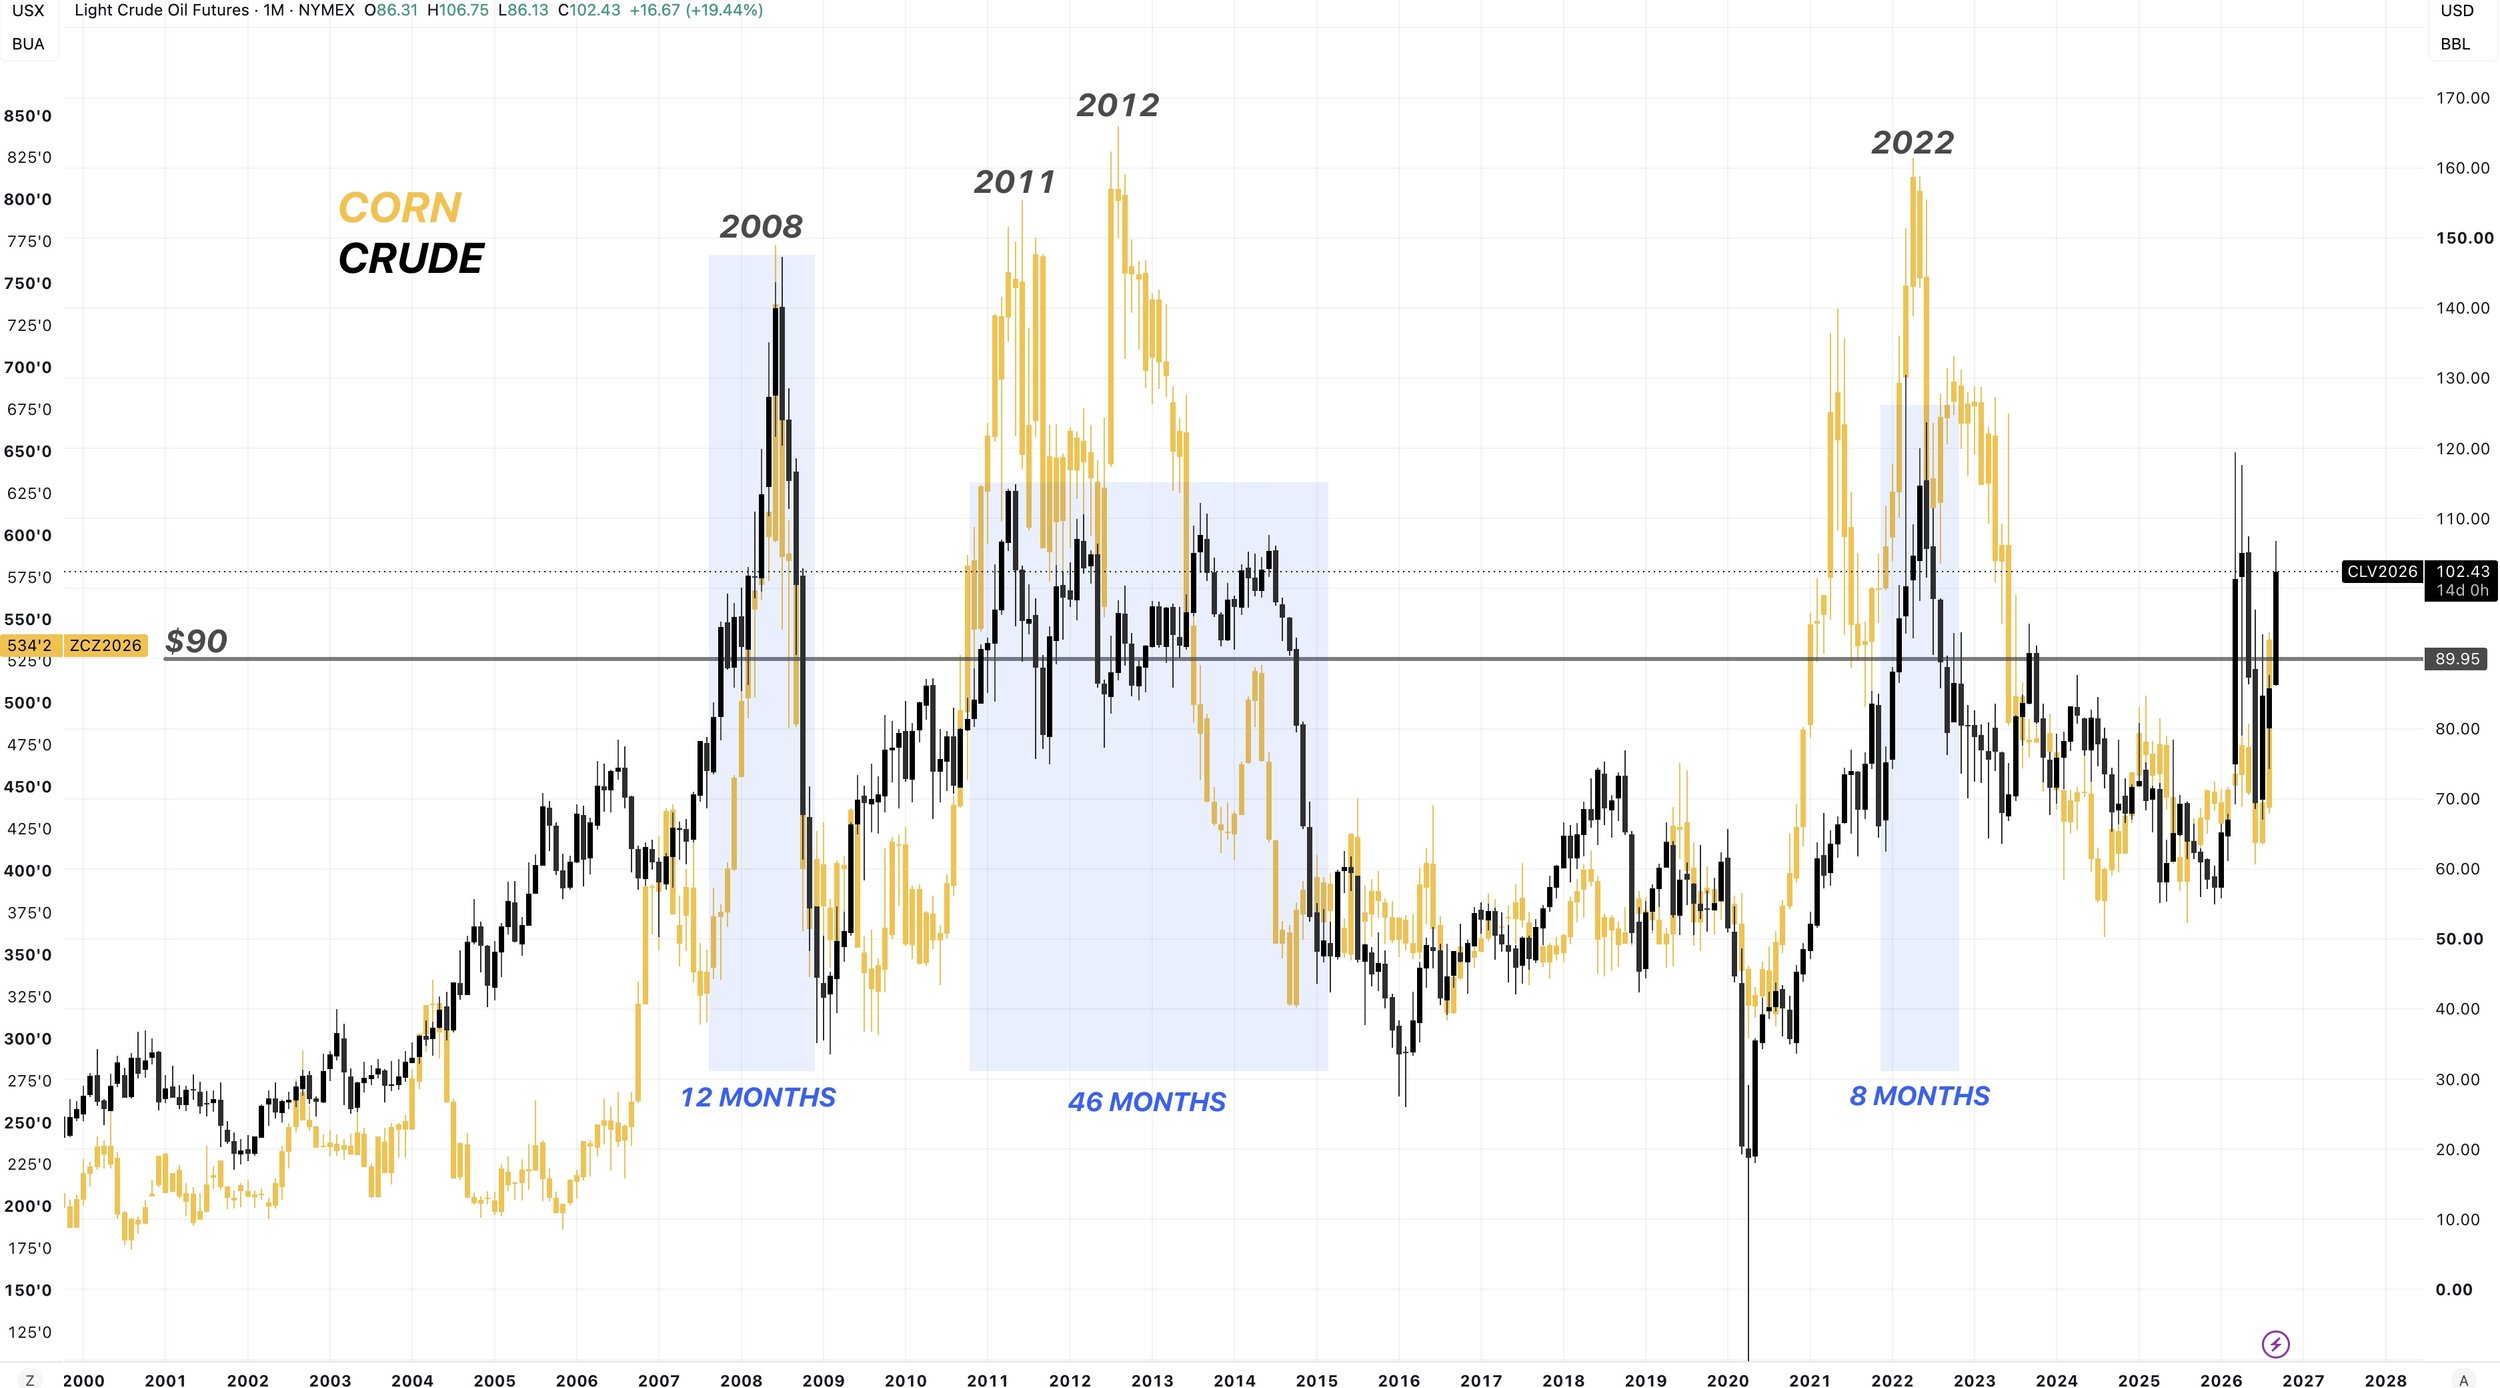
There is no day to day correlation, but the overall trend in crude and corn does tend to be the same pretty often.
As they've gone hand in hand in every major run higher and lower this year.
I'll show another yearly correlation in the corn section.
Feds Hike & Inflation
The feds hiked rates by 25 bps today.
This was the first rate hike since July 2023.
It was a unanimous decision from the feds.
They are currently projecting one additional 25 bps hike in 2026, followed by two hikes in 2027.
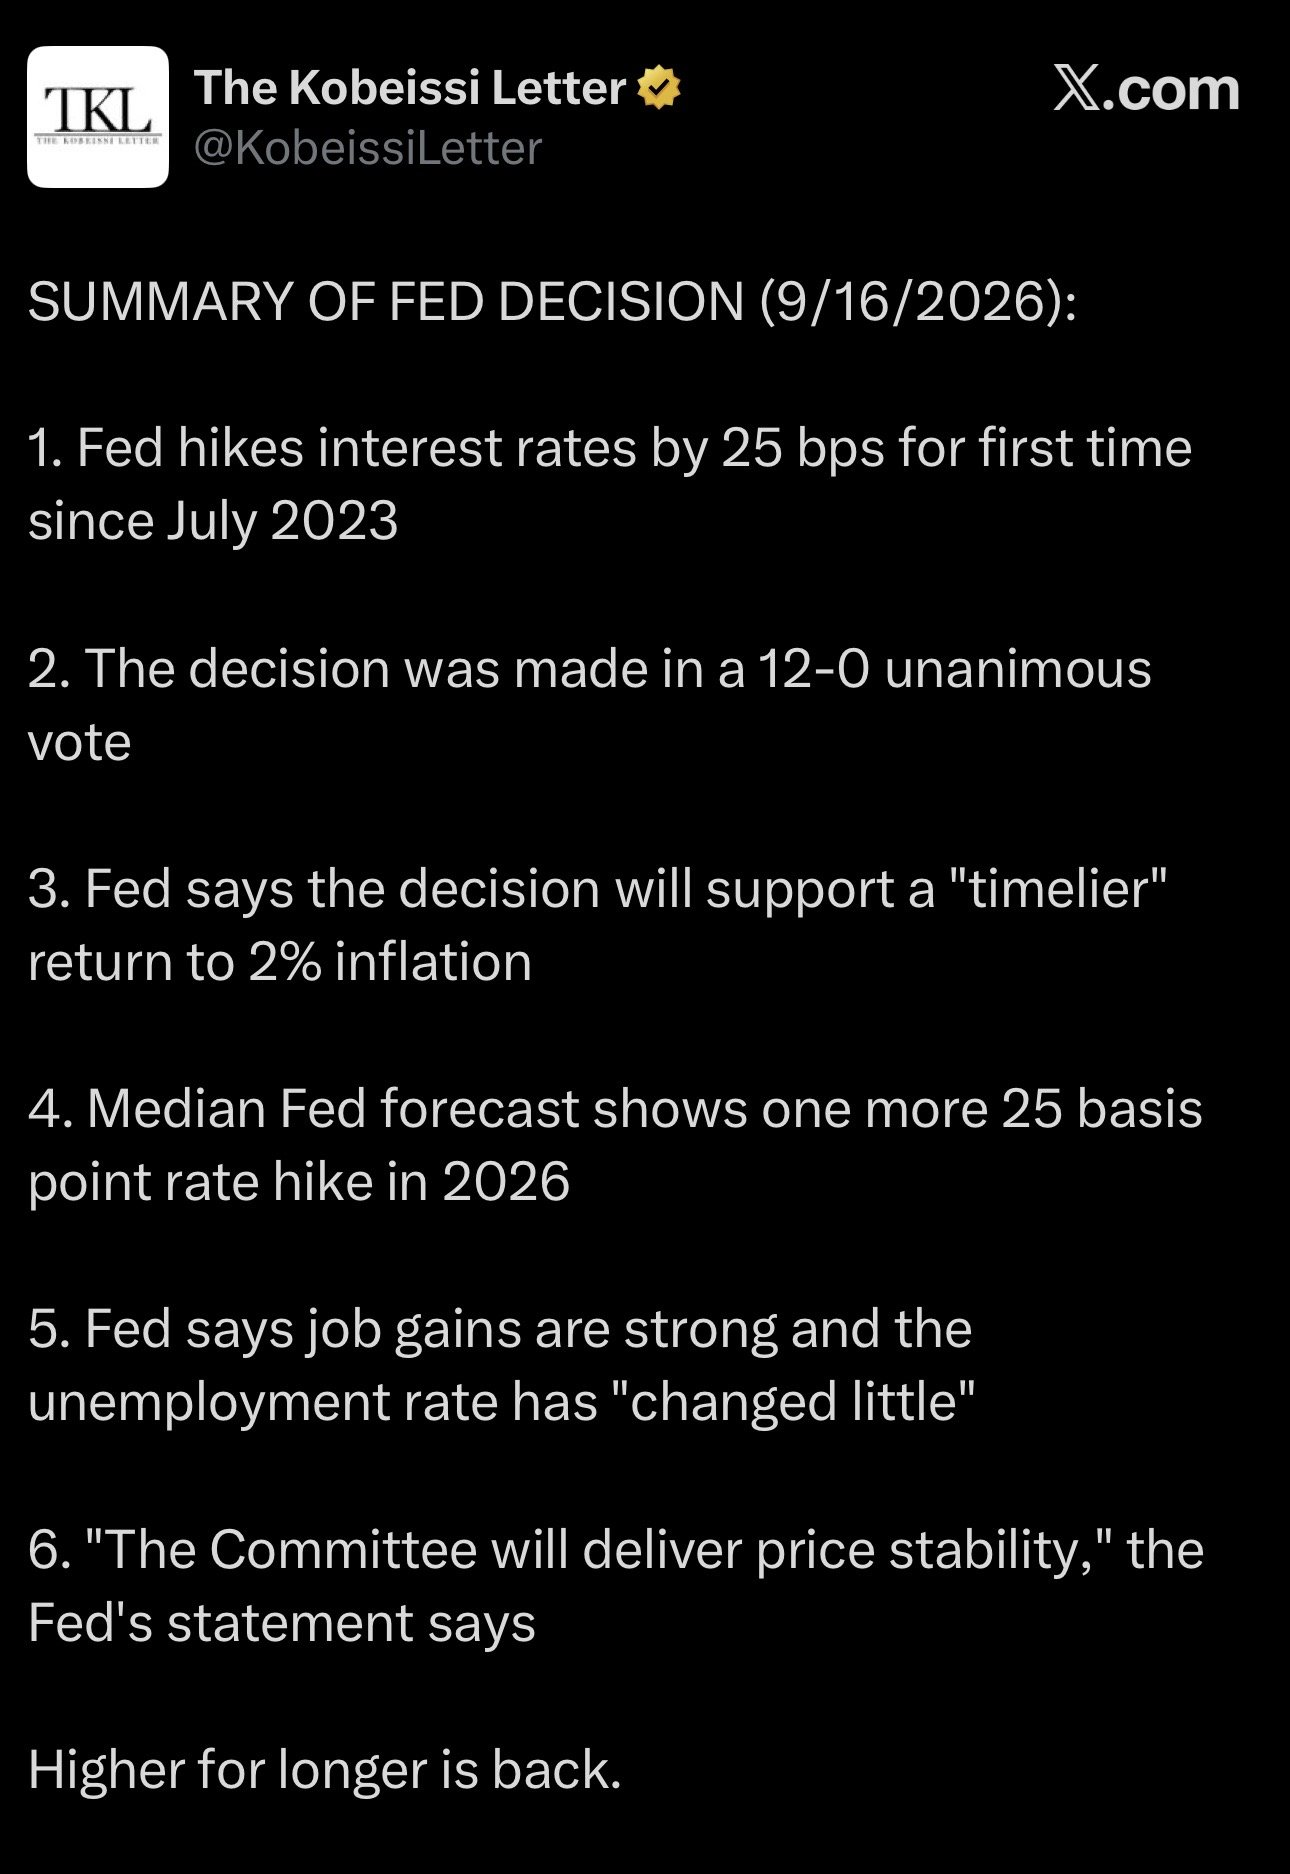
Why did they hike rates?
They want to keep inflation from getting more out of hand.
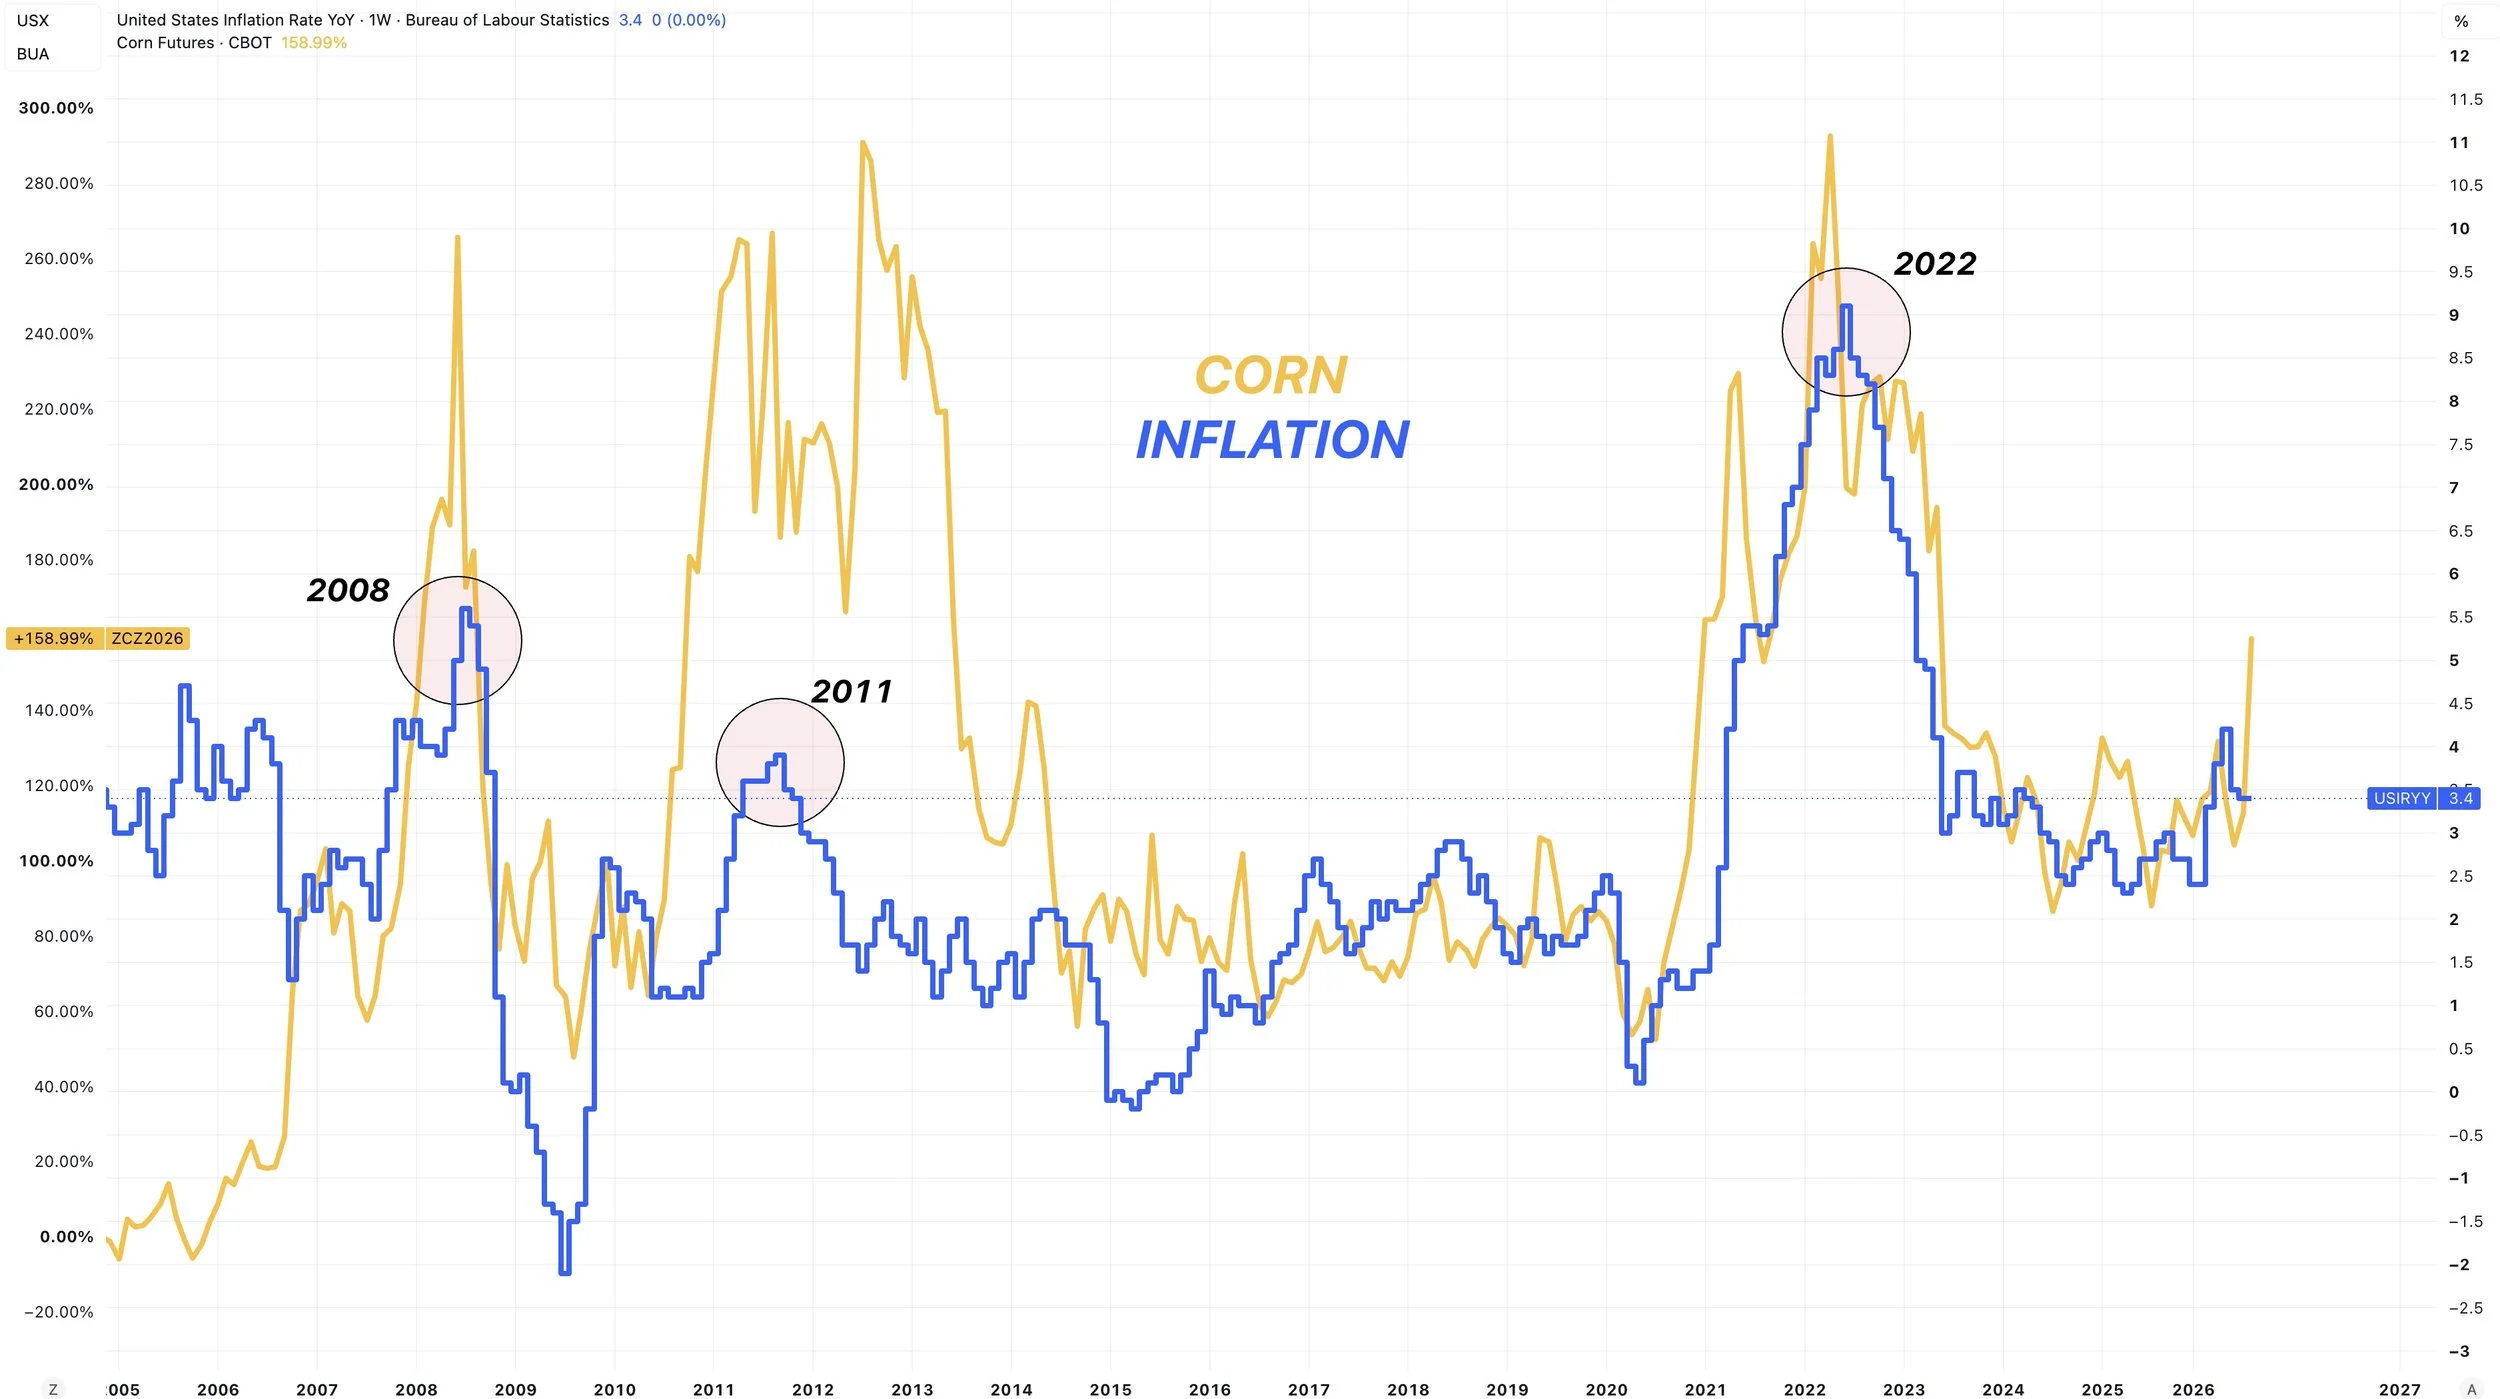
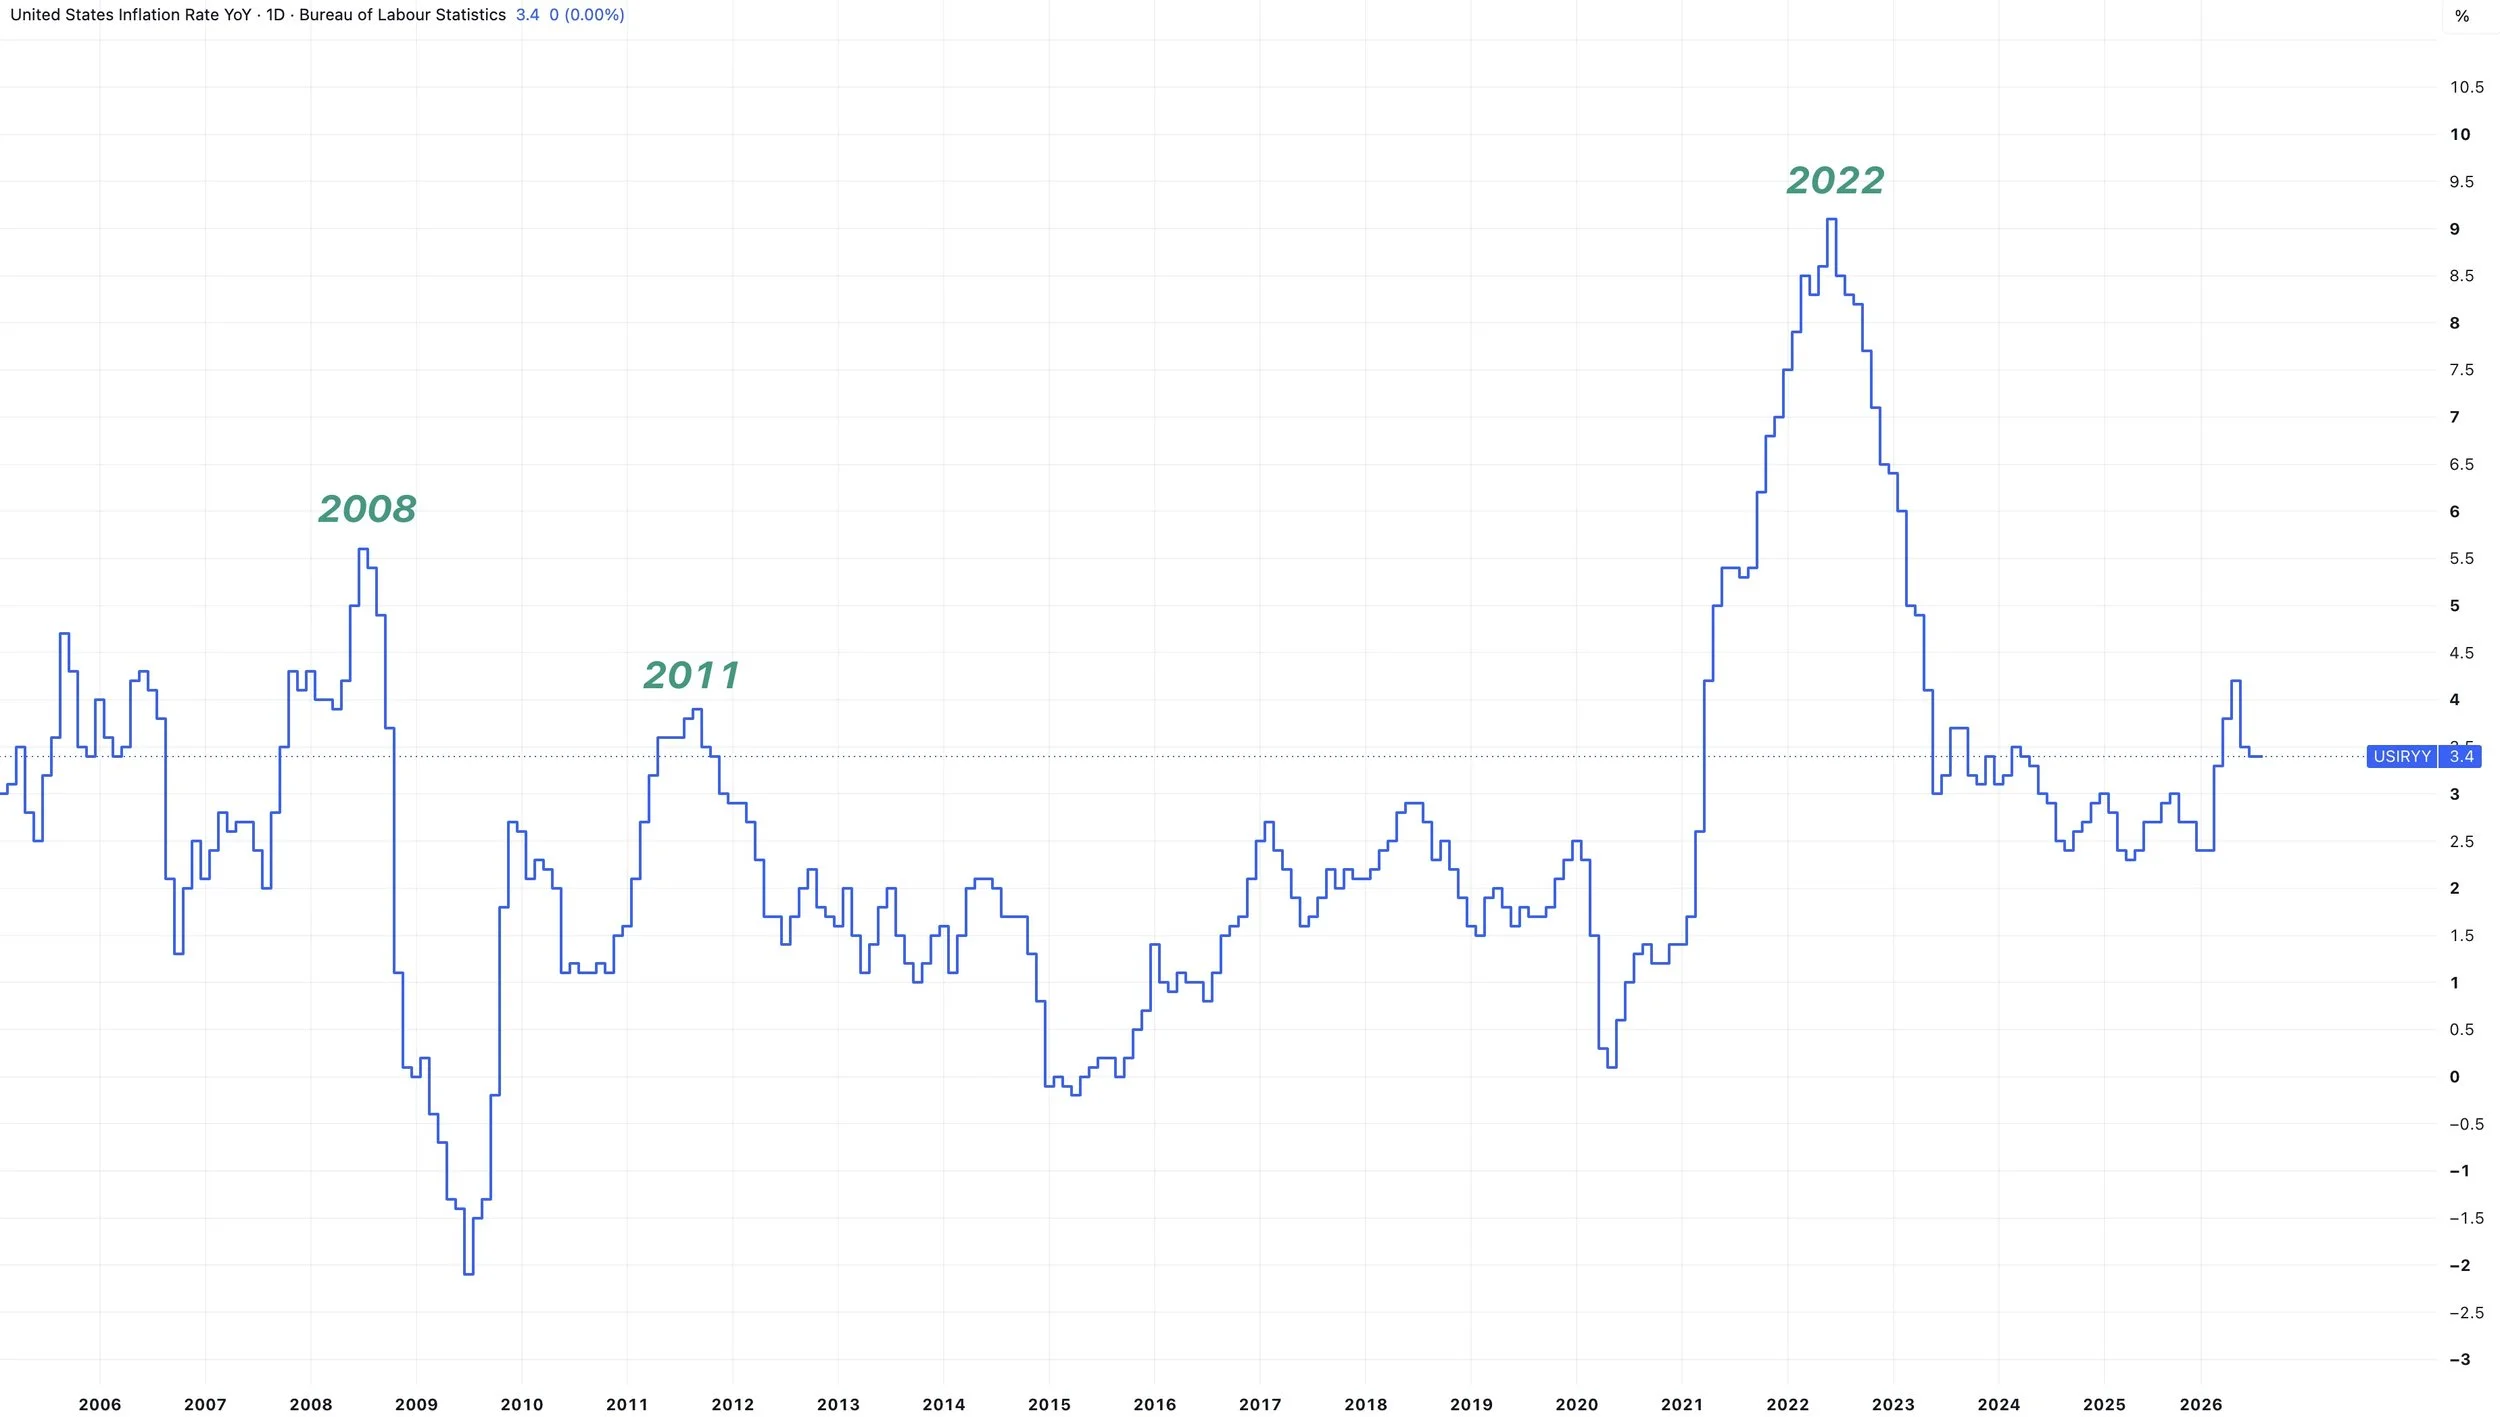
I've shown this chart before. This compares corn prices to inflation.
Periods of high inflation have coincidentally coincided with bull markets in corn and the rest of the grains.
Corn will of course always have it's own story. And corn absolutely has a fundamental story of it's own going on right now. But inflation and the macro backdrop is definitely another reason the funds are as long as they are.
One hike isn’t going to magically solve everything such as the problems over in the Middle East. As a hike can’t solve an oil supply shock.
Today's hike was pretty much already priced into everything. By itself, I don’t see this as having a major impact on grains.
What matters more is what happens next. If they decide they want to continue to aggressively hike rates down the road, that could be a negative factor to the whole inflation story. But for them to do that, I'd assume inflation would need to get more out of hand.
Which is similar to something we saw during the bull market of 2022.
Inflation was through the roof. Corn was at record highs. The fed then decided to hike rates at one of the most aggressive paces in history.
However, I do not expect that to happen right now. I think this rate hike was simply a one and done for the time being.
And one hike doesn’t mean the inflation story is over, which could support higher priced grains long term.
Ag Complex Chart Update: Start of Bull Market?
I showed these charts a while ago.
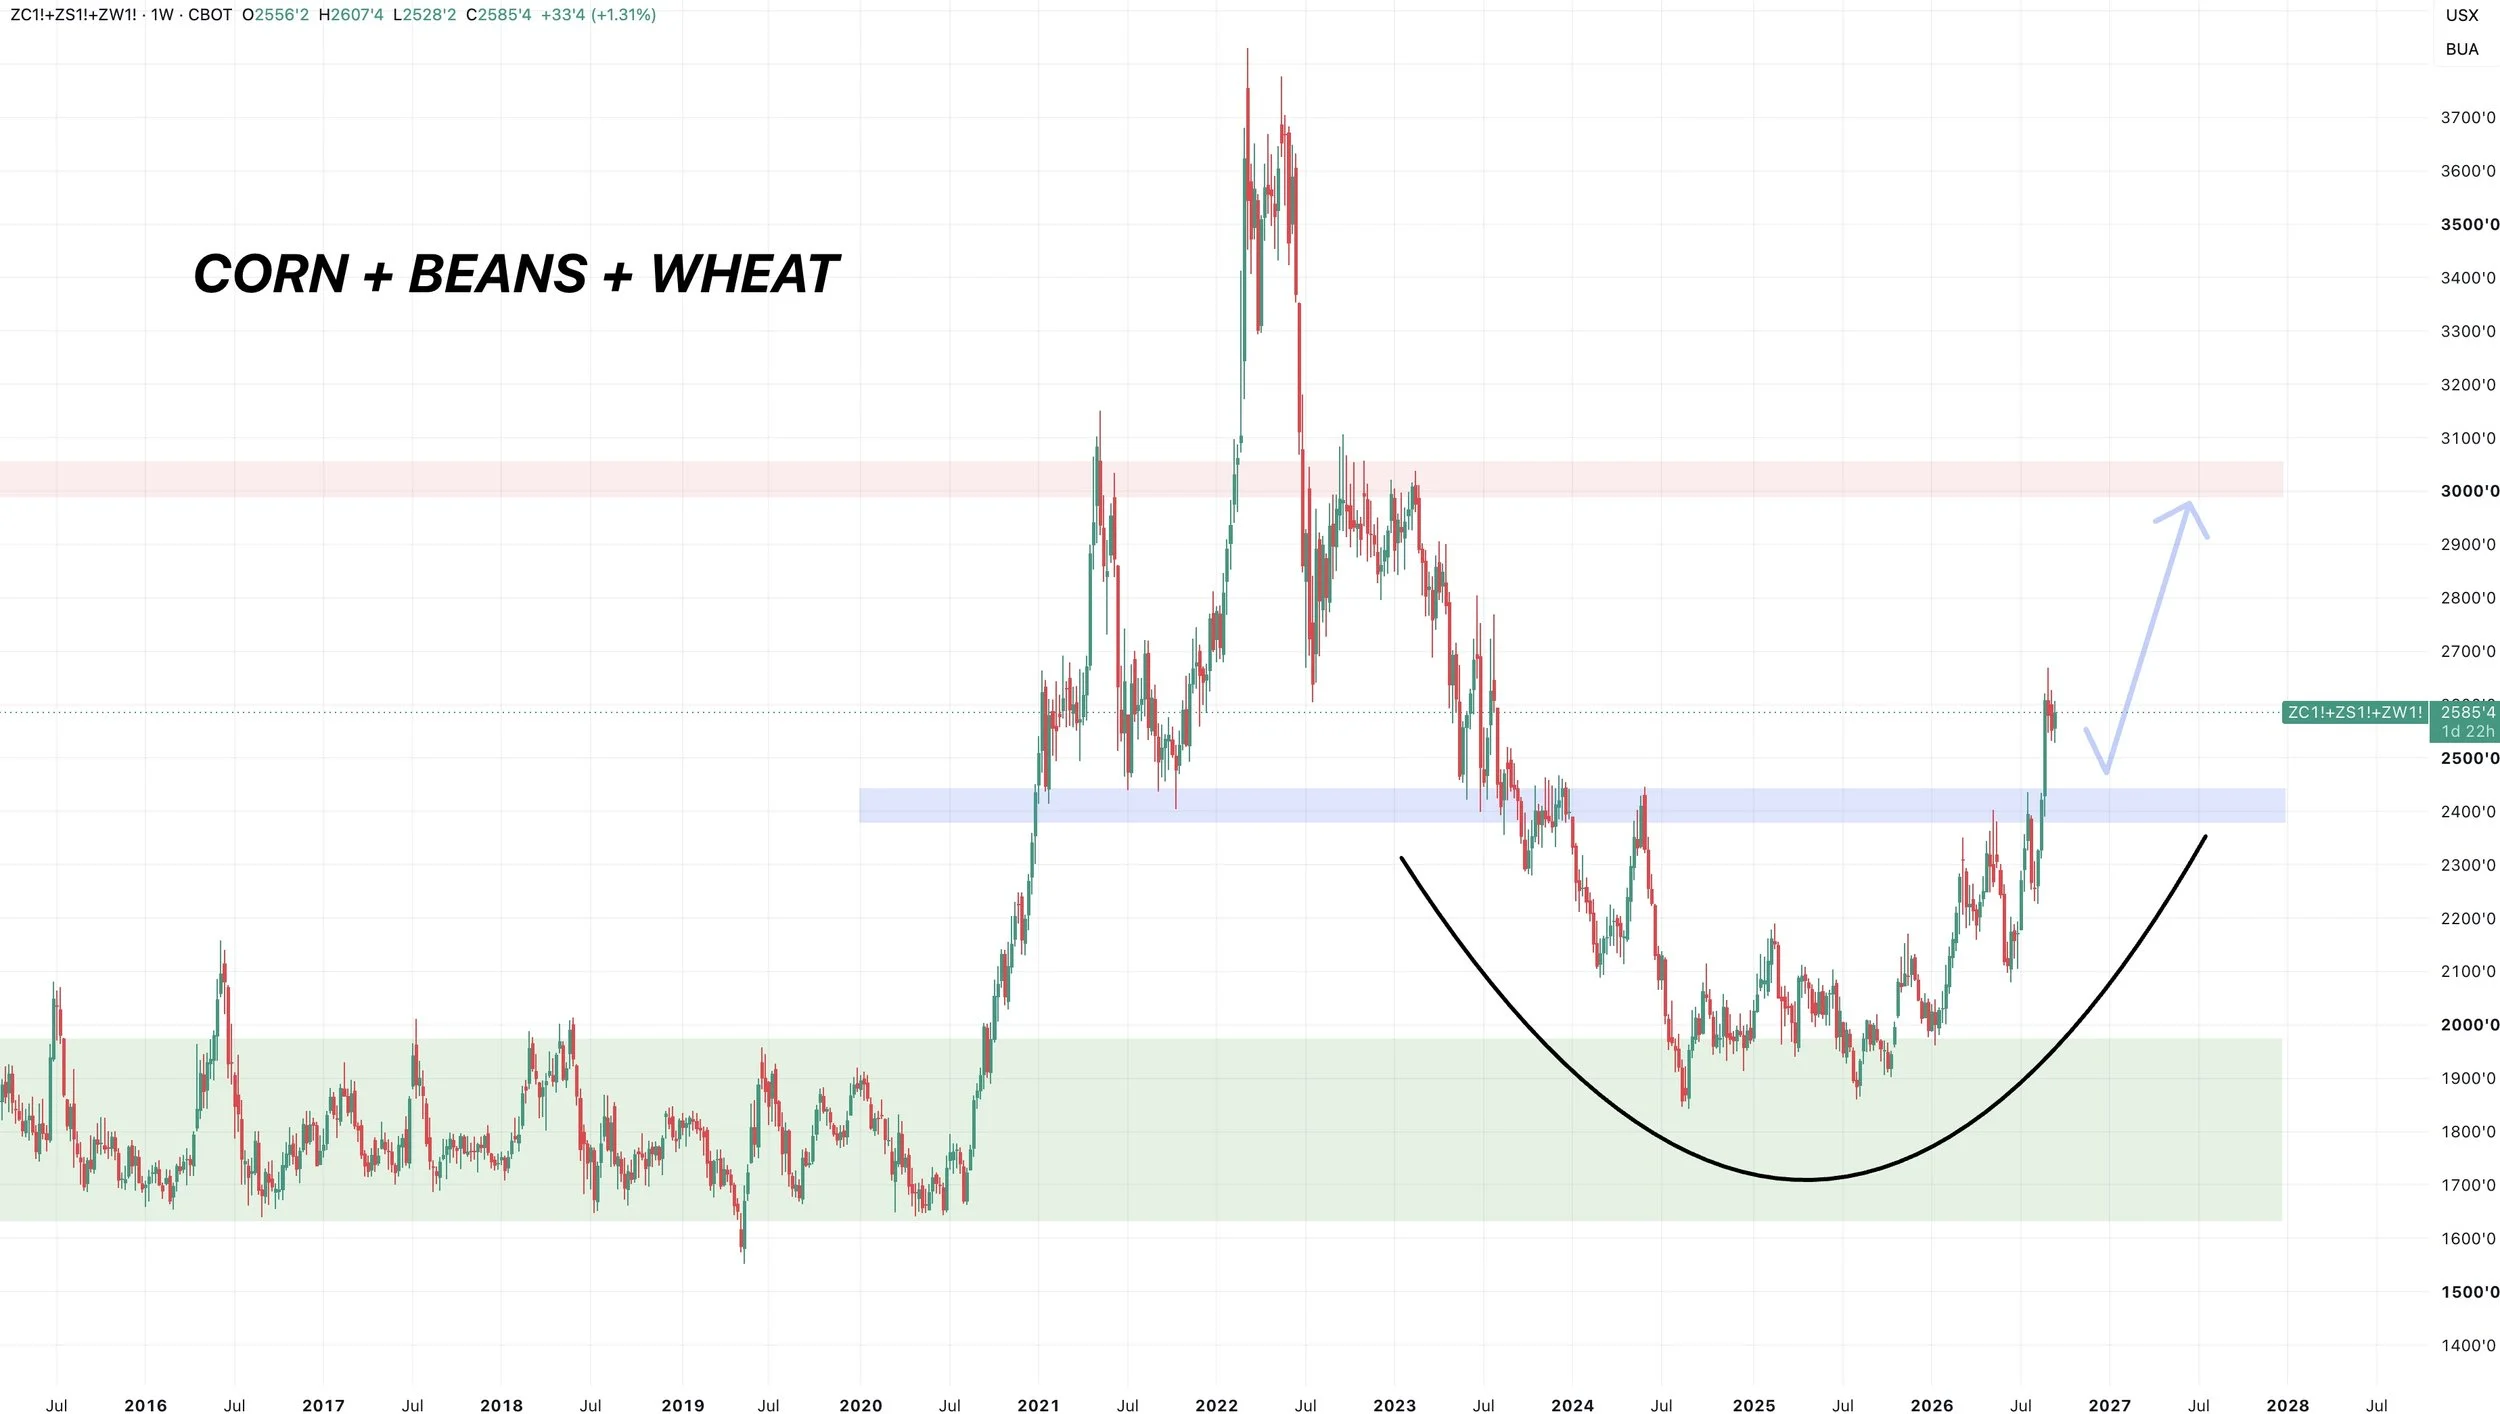
This chart combines corn + soybeans + wheat.
This first one is the weekly view.
Nice rounded bottom.
We have a clear breakout. Taking out the lows from 2021 and highs from 2024.
We could possibly get a slight pullback and re-test those old highs, but either way this chart looks like it has plenty of upside.
It's not a bearish look long term for grains.
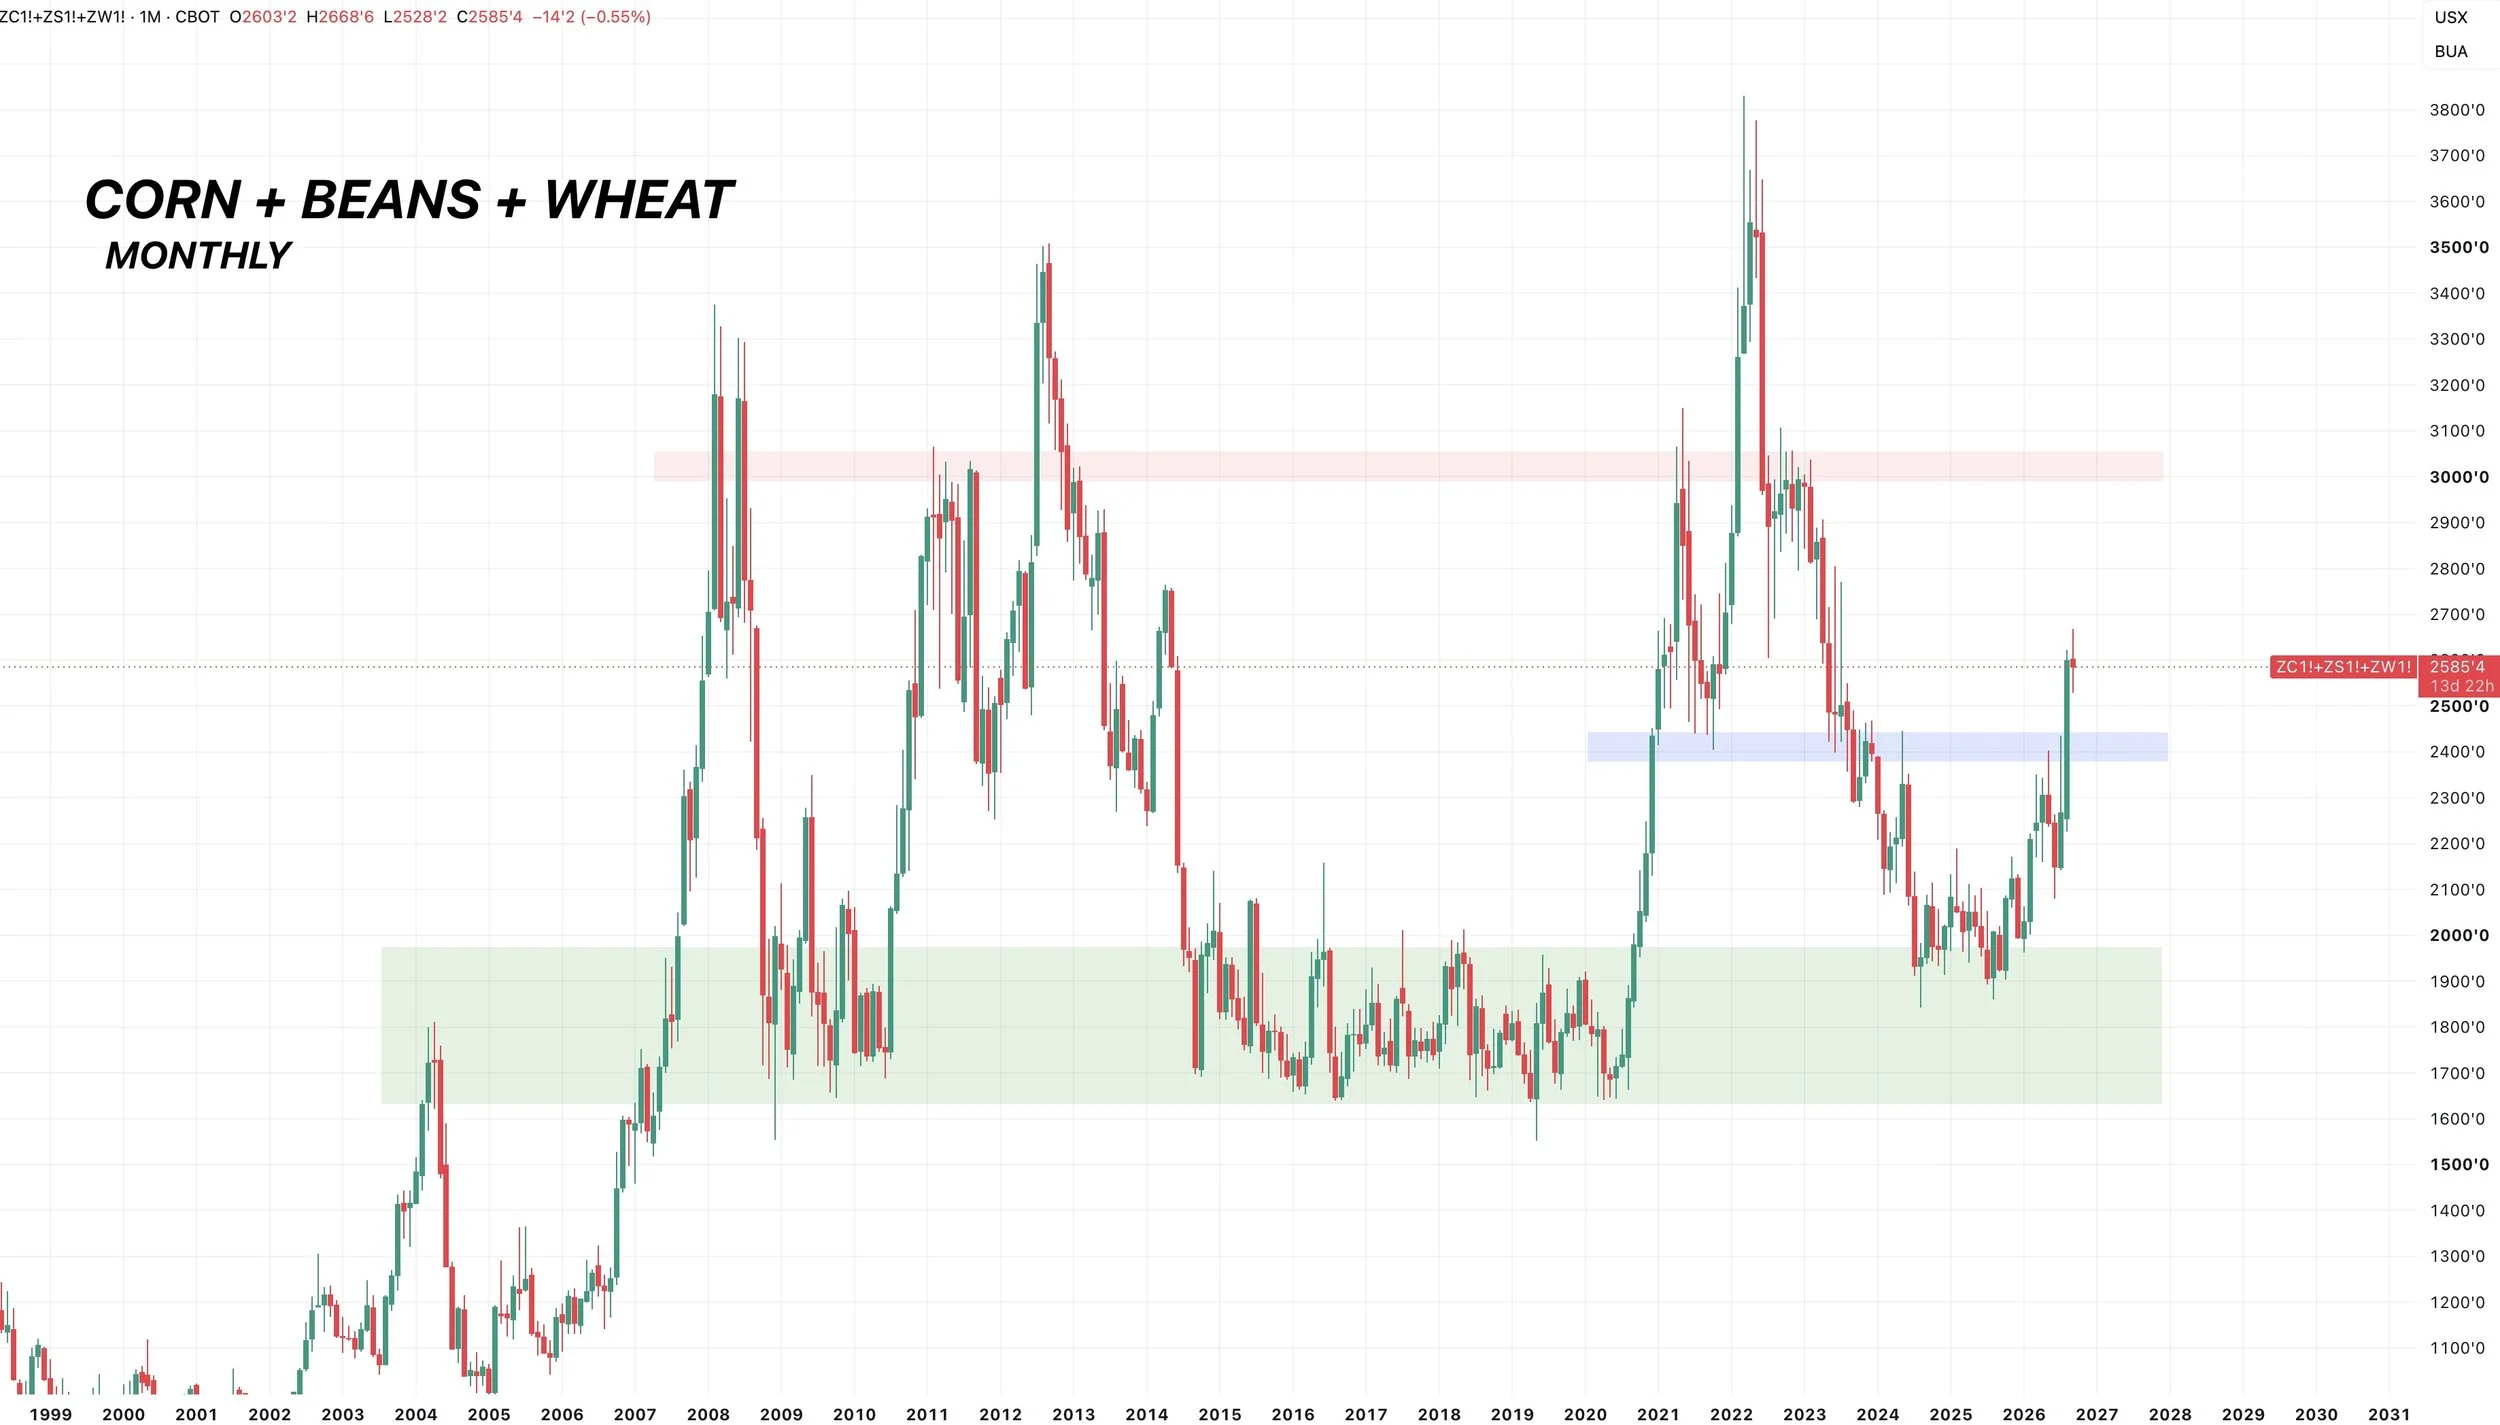
Here is the monthly view.
Again, a clear breakout.
Looks like this could very well be the start of a bull market to me.
Each run has resulted is us testing that red box. So you'd like to think we have plenty of room to go higher long term.
Today's Main Takeaways
Corn
Fundamentals:
Last week's report didn’t add any fuel to the fire for bulls. As the smaller crop was already priced into this market.
But the corn situation is not bearish at all.
We officially have a sub 10% stocks to use for the first time in years.
Which is usually associated with a bullish balance sheet and higher prices if it remains tight.
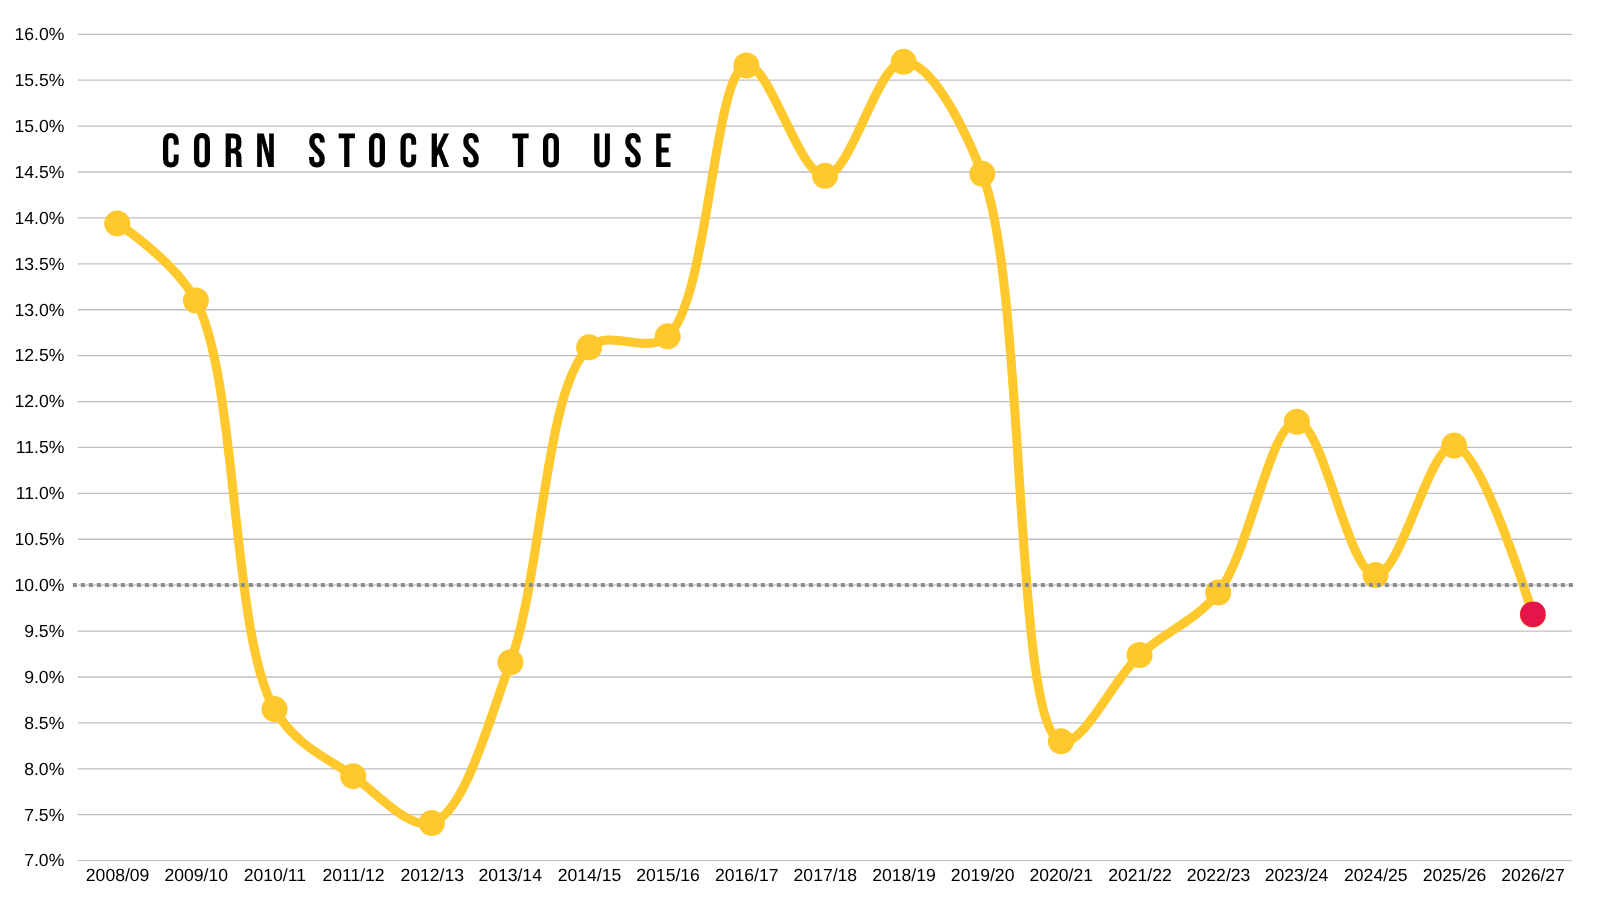
We are no longer in a bear market.
Not quiet on the level of 2021 and 2022, but getting close.
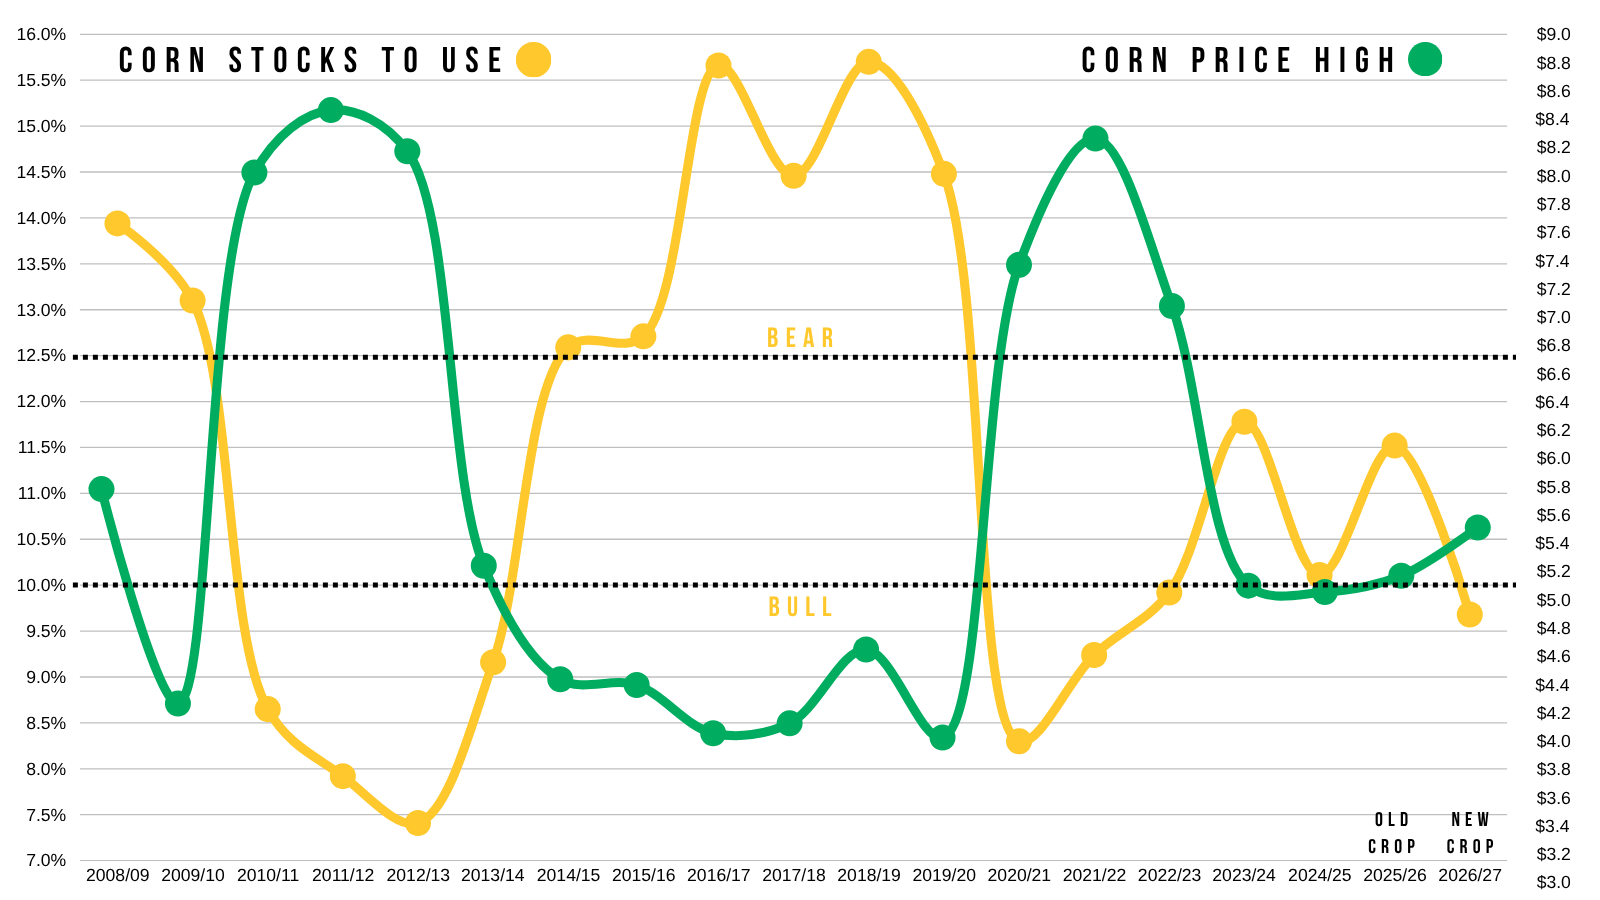
I still think there is a decent chance we see this balance sheet get even tighter.
First off, I could see the old crop exports beind bumped up further which would help further eat into the new crop balance sheet.
But it feels like yield could very easily slip further from here.
There is a reason they say that small crops get smaller.
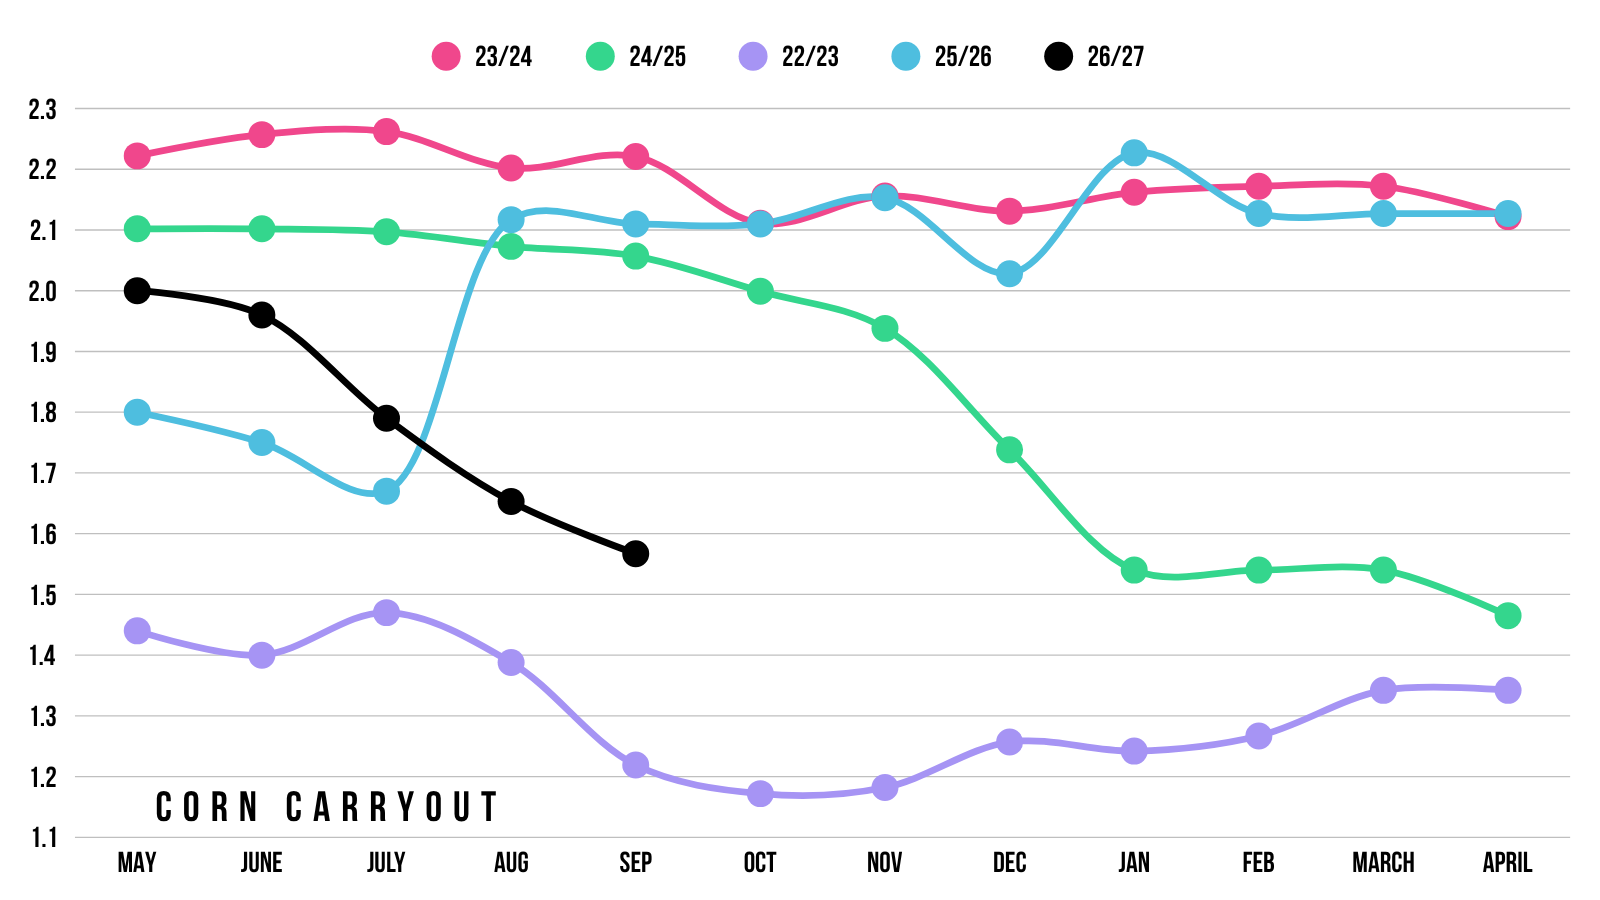
Here is a chart that shows how our carryout has changed month over month.
The trend is clearly tighter. As the situation has became tighter month after month.
We talked about this last week, but even if yield slips slightly from here there is a realistic chance that stocks to use gets awfully tight.
We are sitting at a 9.68% stocks to use today.
Even a 177 yield brings that below 9%, before touching demand of course.
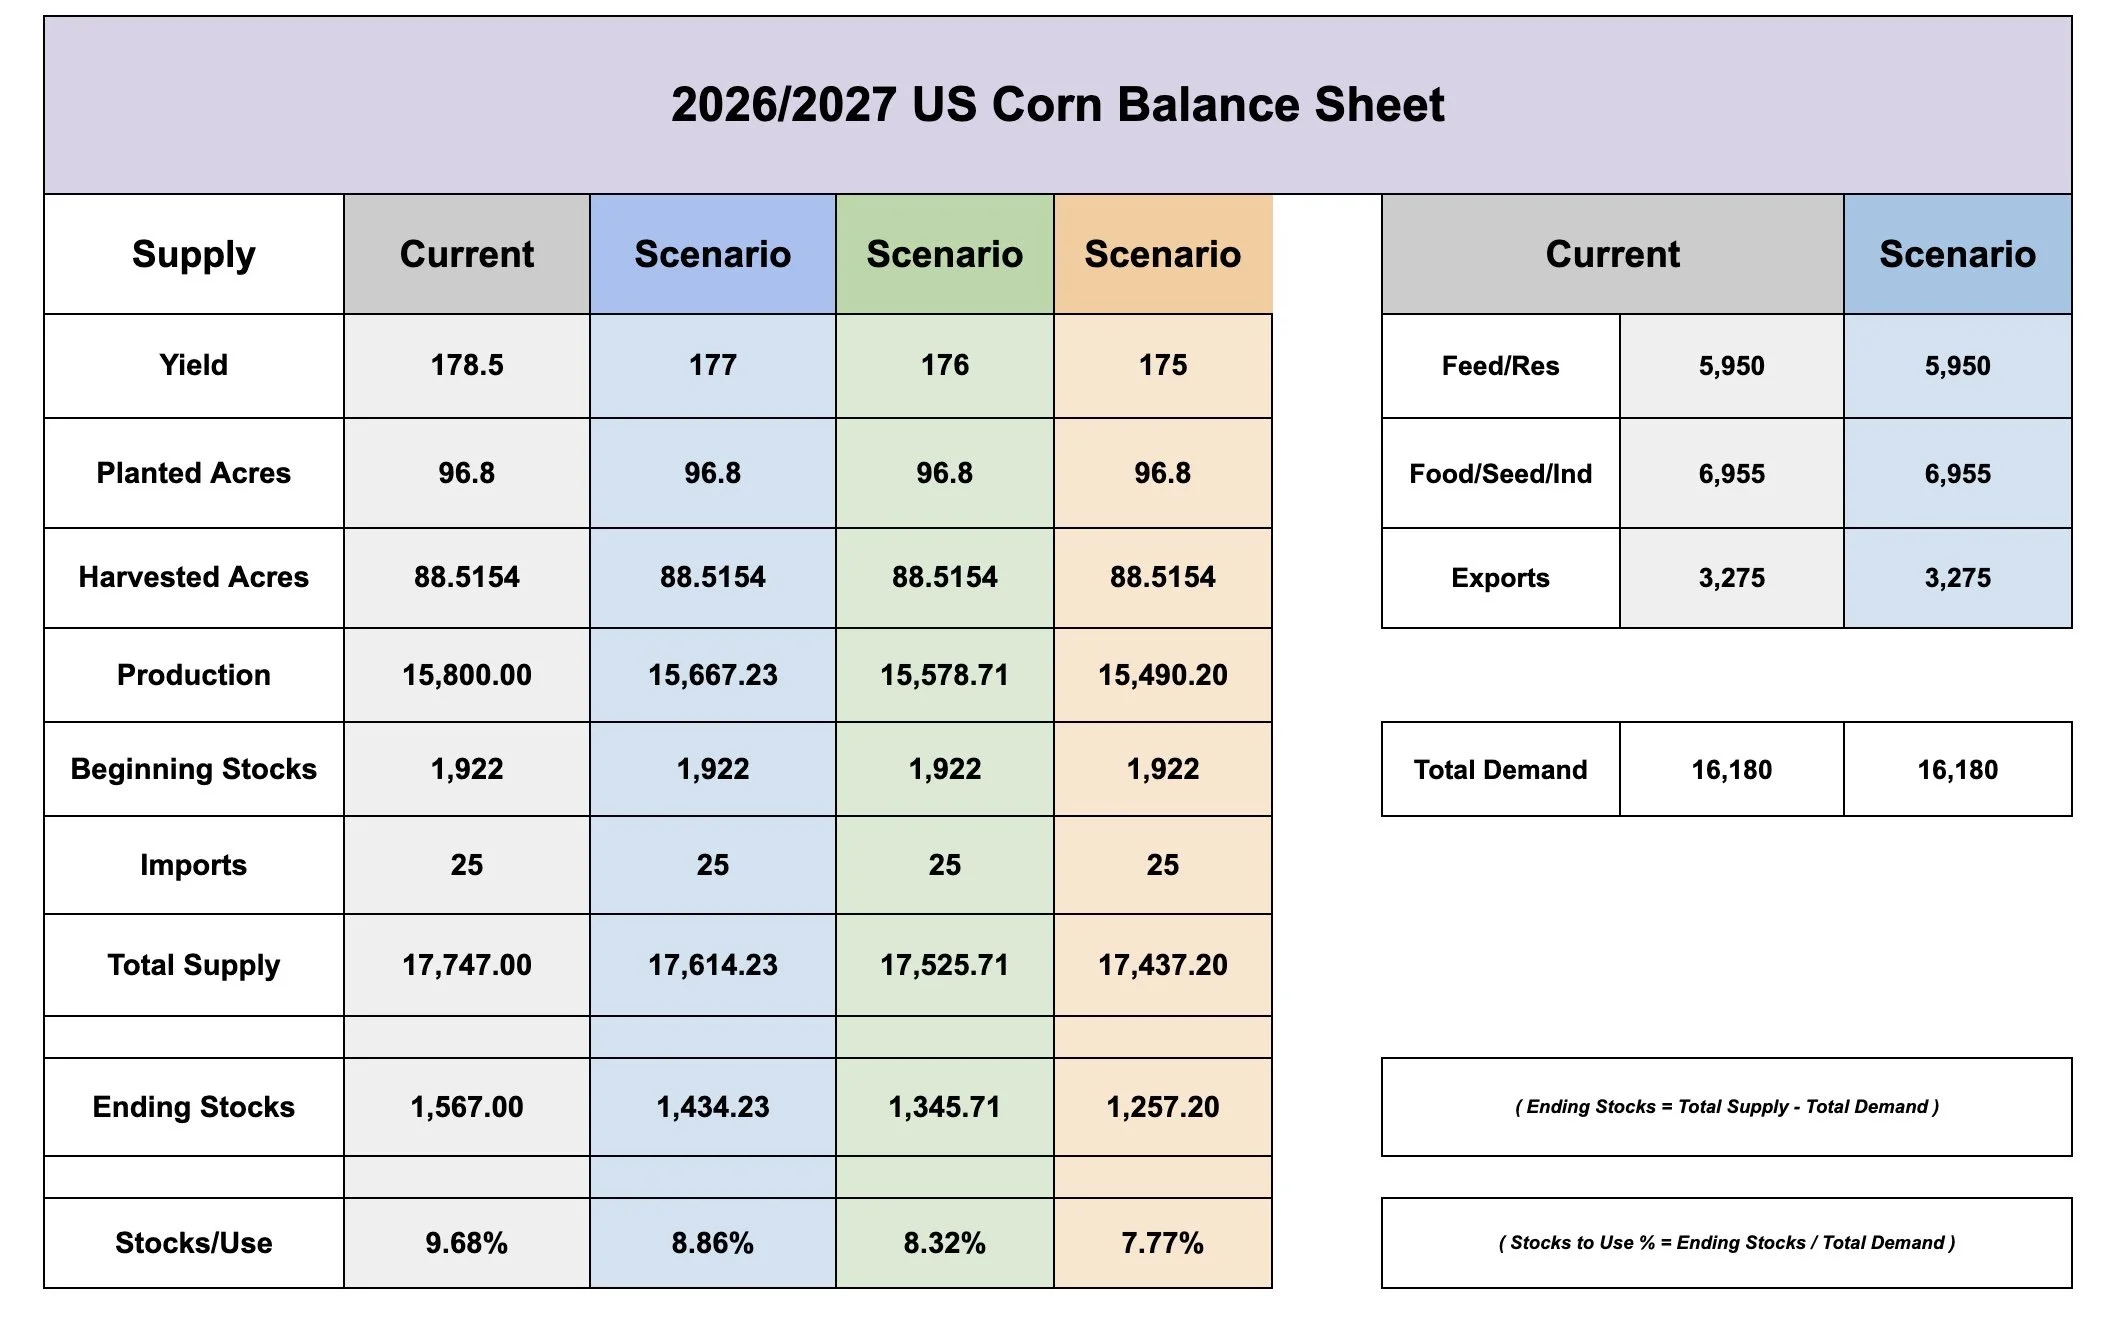
If supply gets any tighter from here, we very well might have to ration demand.
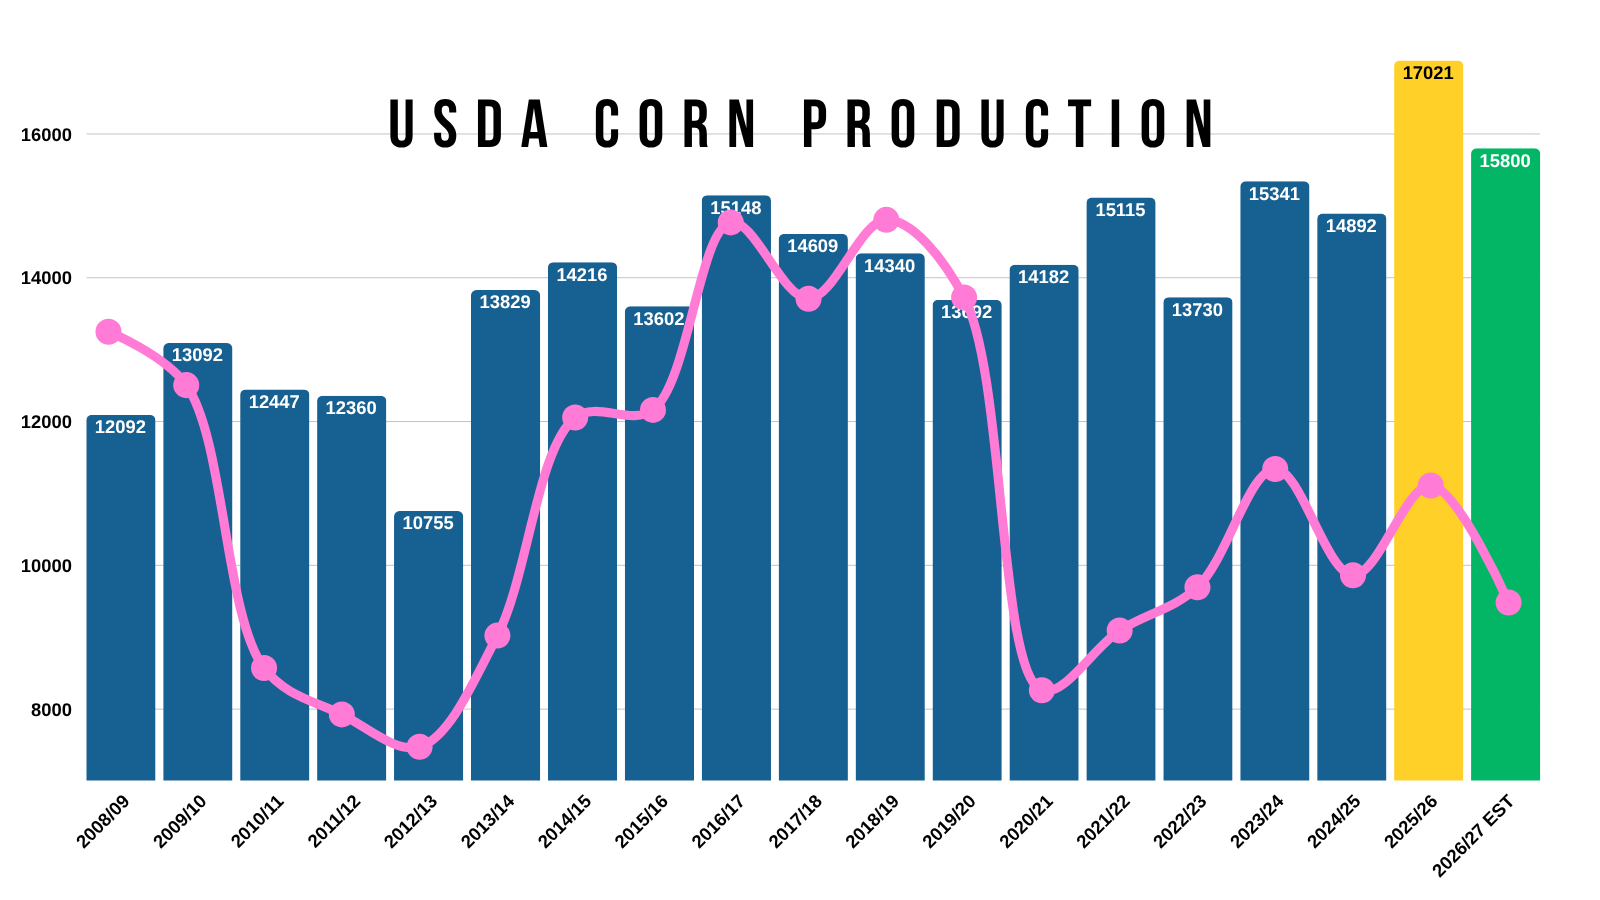
Here is corn production through out the years compared to our stocks to use.
Look at last year. We had a massive crop.
We chewed through that supply because demand is that strong.
This year we could still literally have the 2nd largest crop on record, yet enter bull market status on the balance sheet.
That's what happened in 2021/22. We had record production, yet record prices.
Our demand isn’t going to vanish into thin air simply because our crop is smaller. We might have to incentivize the market to lose that demand.
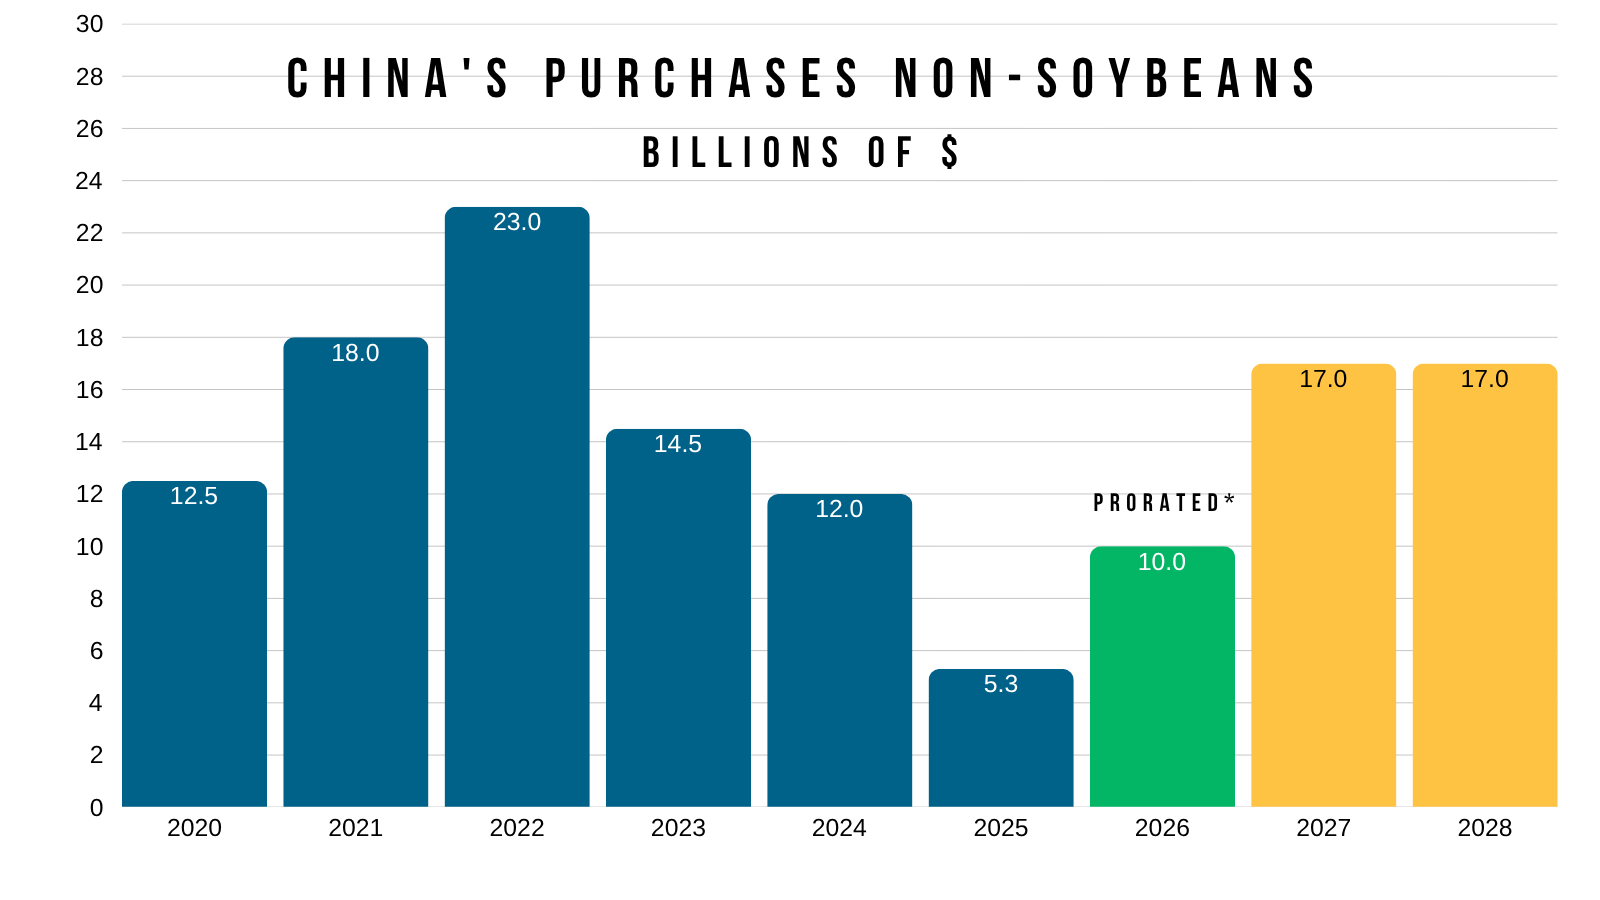
The other big wild card is China.
They said they were gonna buy plenty of non-soybean products.
So far they are living up to their agreement to buy soybeans, but not much outside of that.
I would like to think at least part of that non-soybean buys will be some corn.
China or not, corn still has a story. But some Chinese demand on top of this would make the corn market very intriguing.
Trump and China meet next week. So we will have to see if that provides any additional clarity or not.
Corn has a great story.
Corn has a tight US situation. The tightest in the last several years. We have the tightest world situation in over a decade. We have record demand. We have the inflation, fertilizer, crude oil and the rest of the macro story.
You have all of these friendly factors potentially aligning at once.
The corn story has a ton of potential.
However, short term we can’t forget we are heading into harvest.
So short term some harvest pressure could potentially cap our upside.
The funds are record long and we are going into harvest.
This doesn’t mean they'll get short by any means. But I could find it being hard for them to add more on top of that record length here.
I could easily see them take some chips off the table here, then once farmers are forced to sell off the combine, they jump back in and run it higher.
I do, however, believe they are going to defend that long position and stay long for a long time.
Every time the funds have been long +400k contracts they have stayed long for 2-3 years.
The other two times this happened were 2010 and 2020.
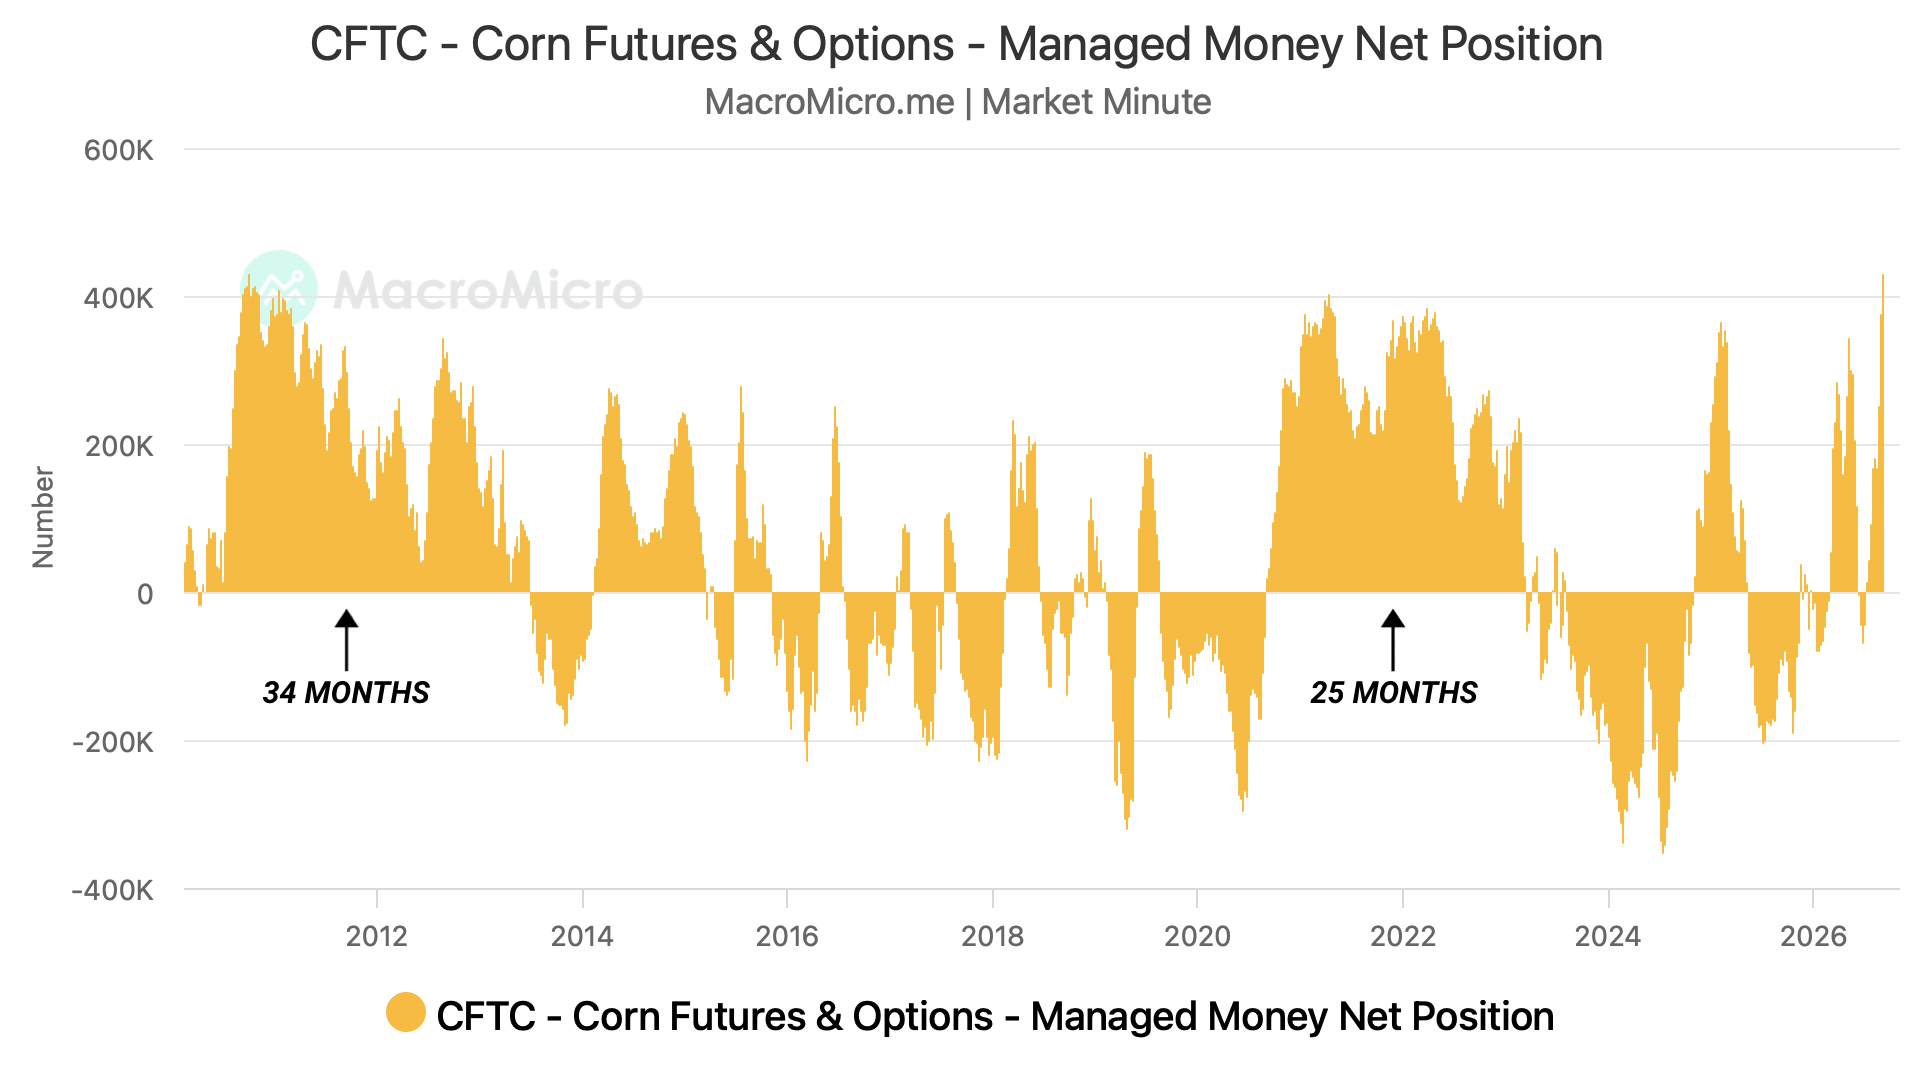
It's hard to ignore the simularities with 2010 and 2020.
Not only do we have similarities with the funds..
You've got the possible inflation story.
You have crude..
Each bull market in corn has also been accompanied by a prolonged rally in crude.
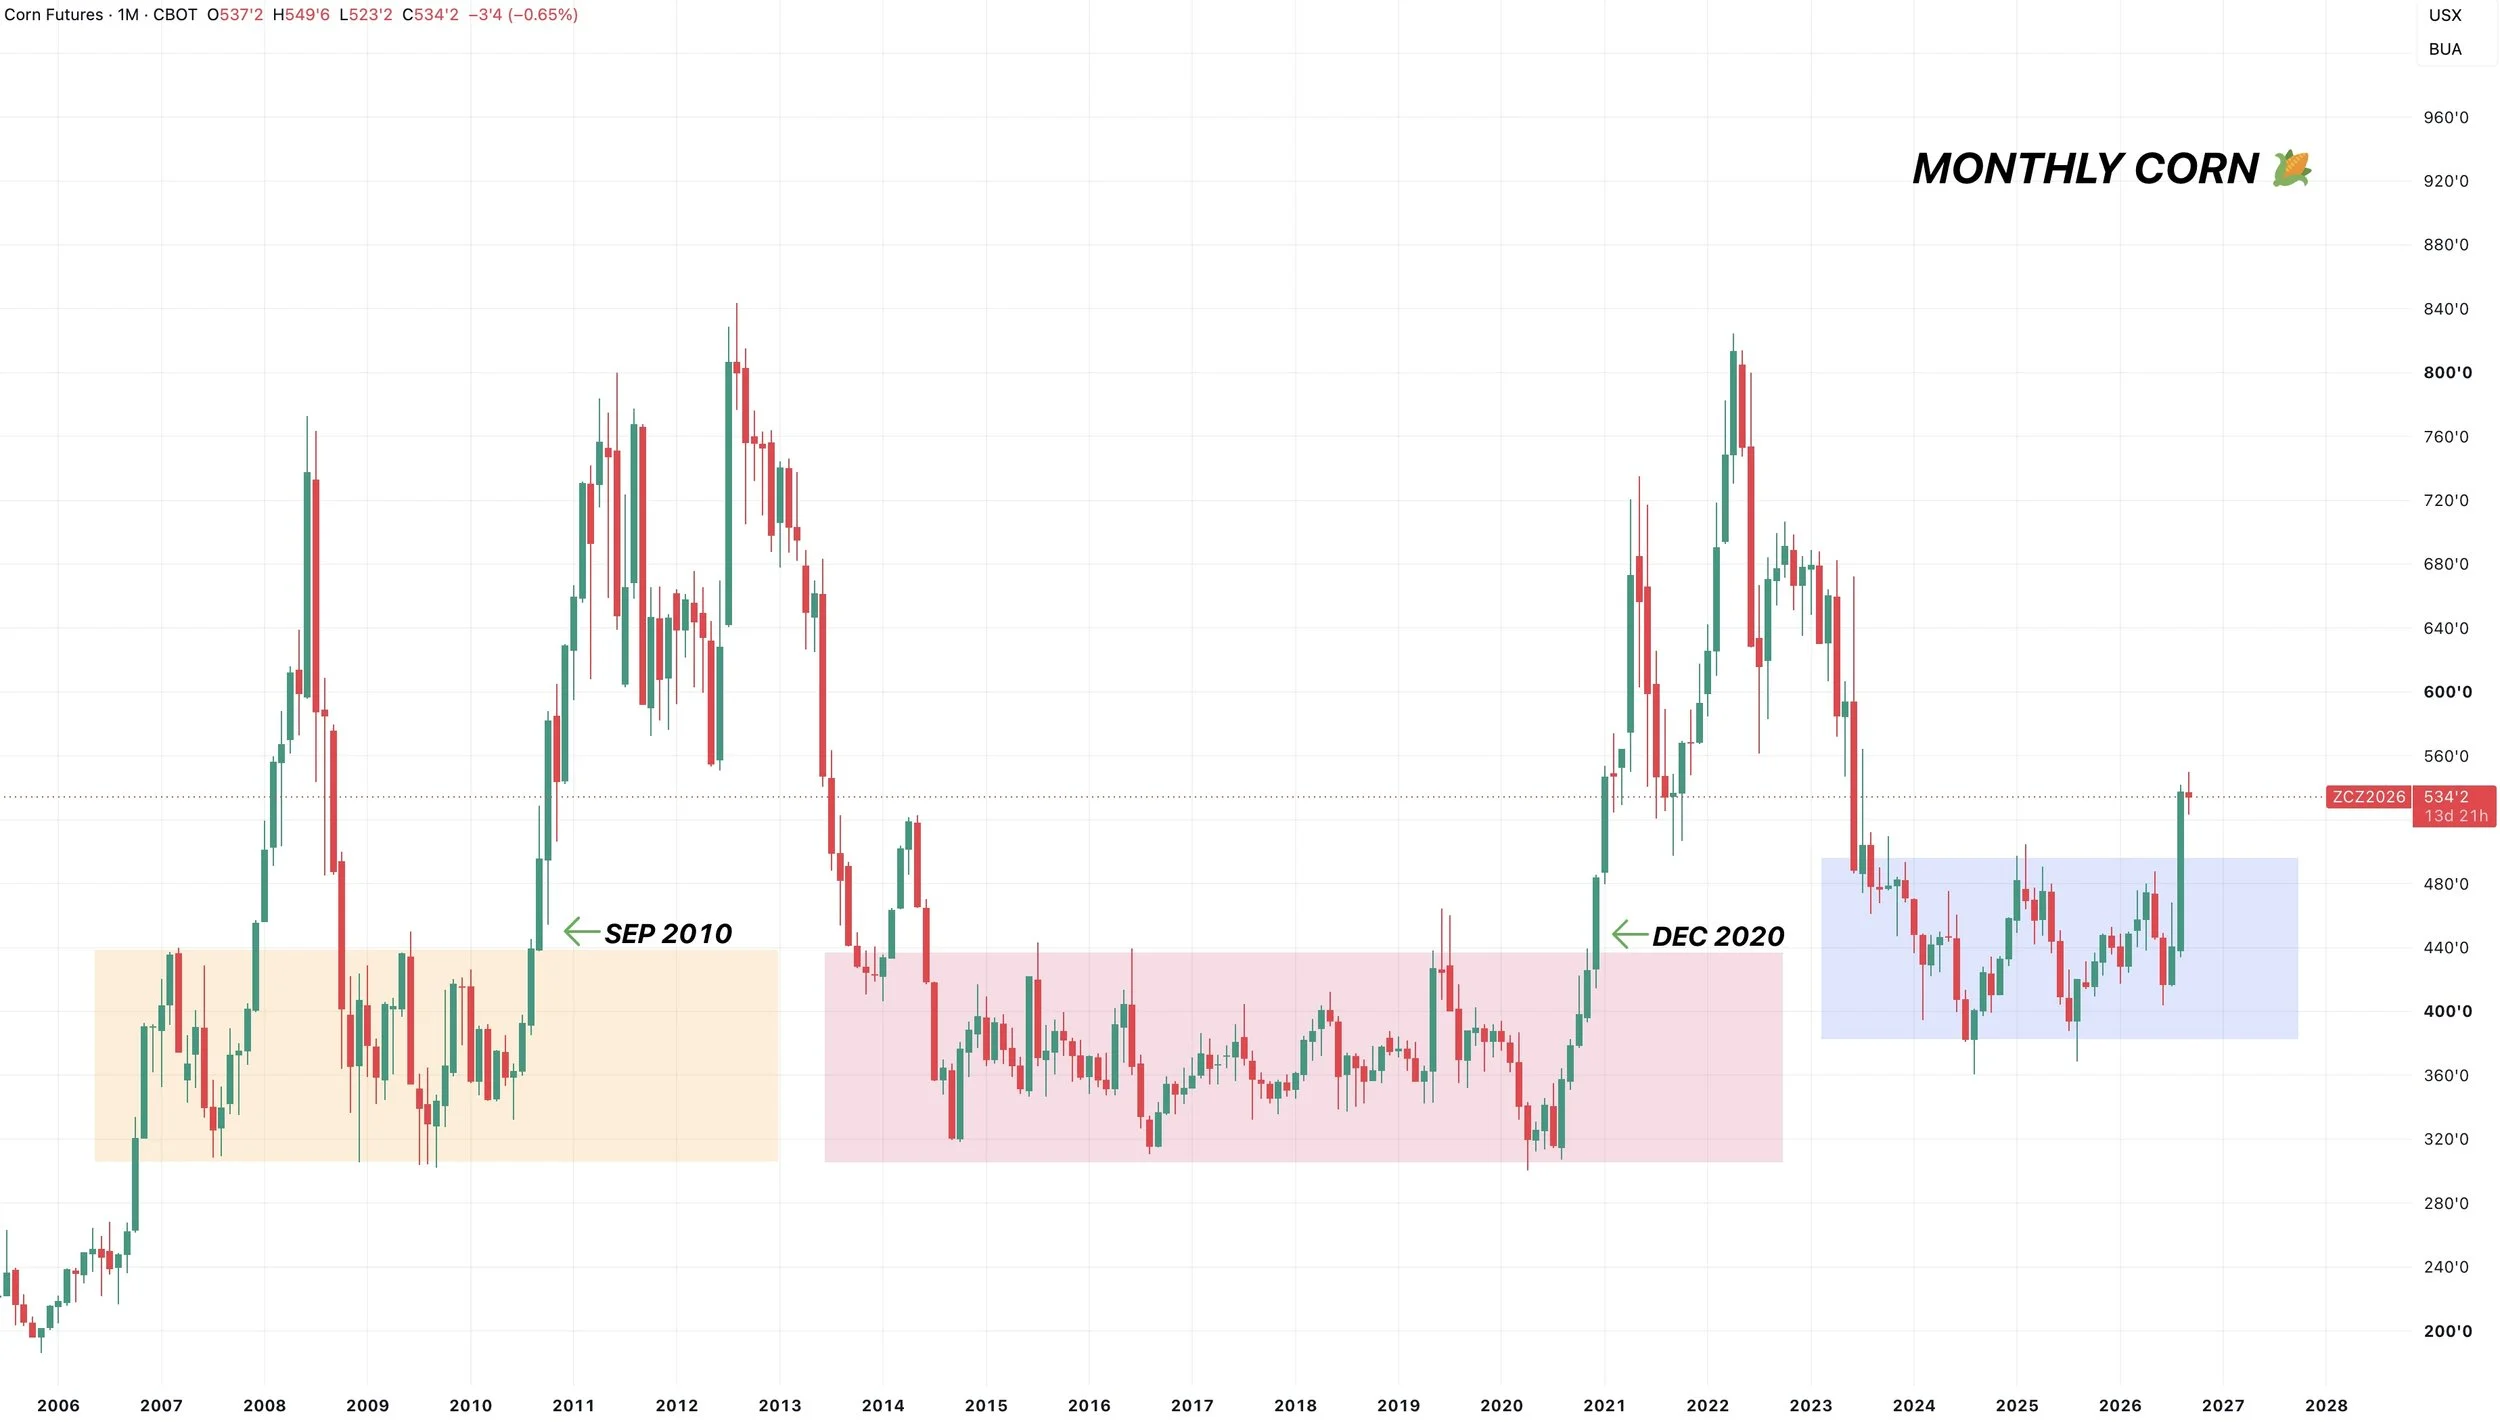
You have a monthly break out from a multi-year range.
With the last two being in 2010 and 2020.
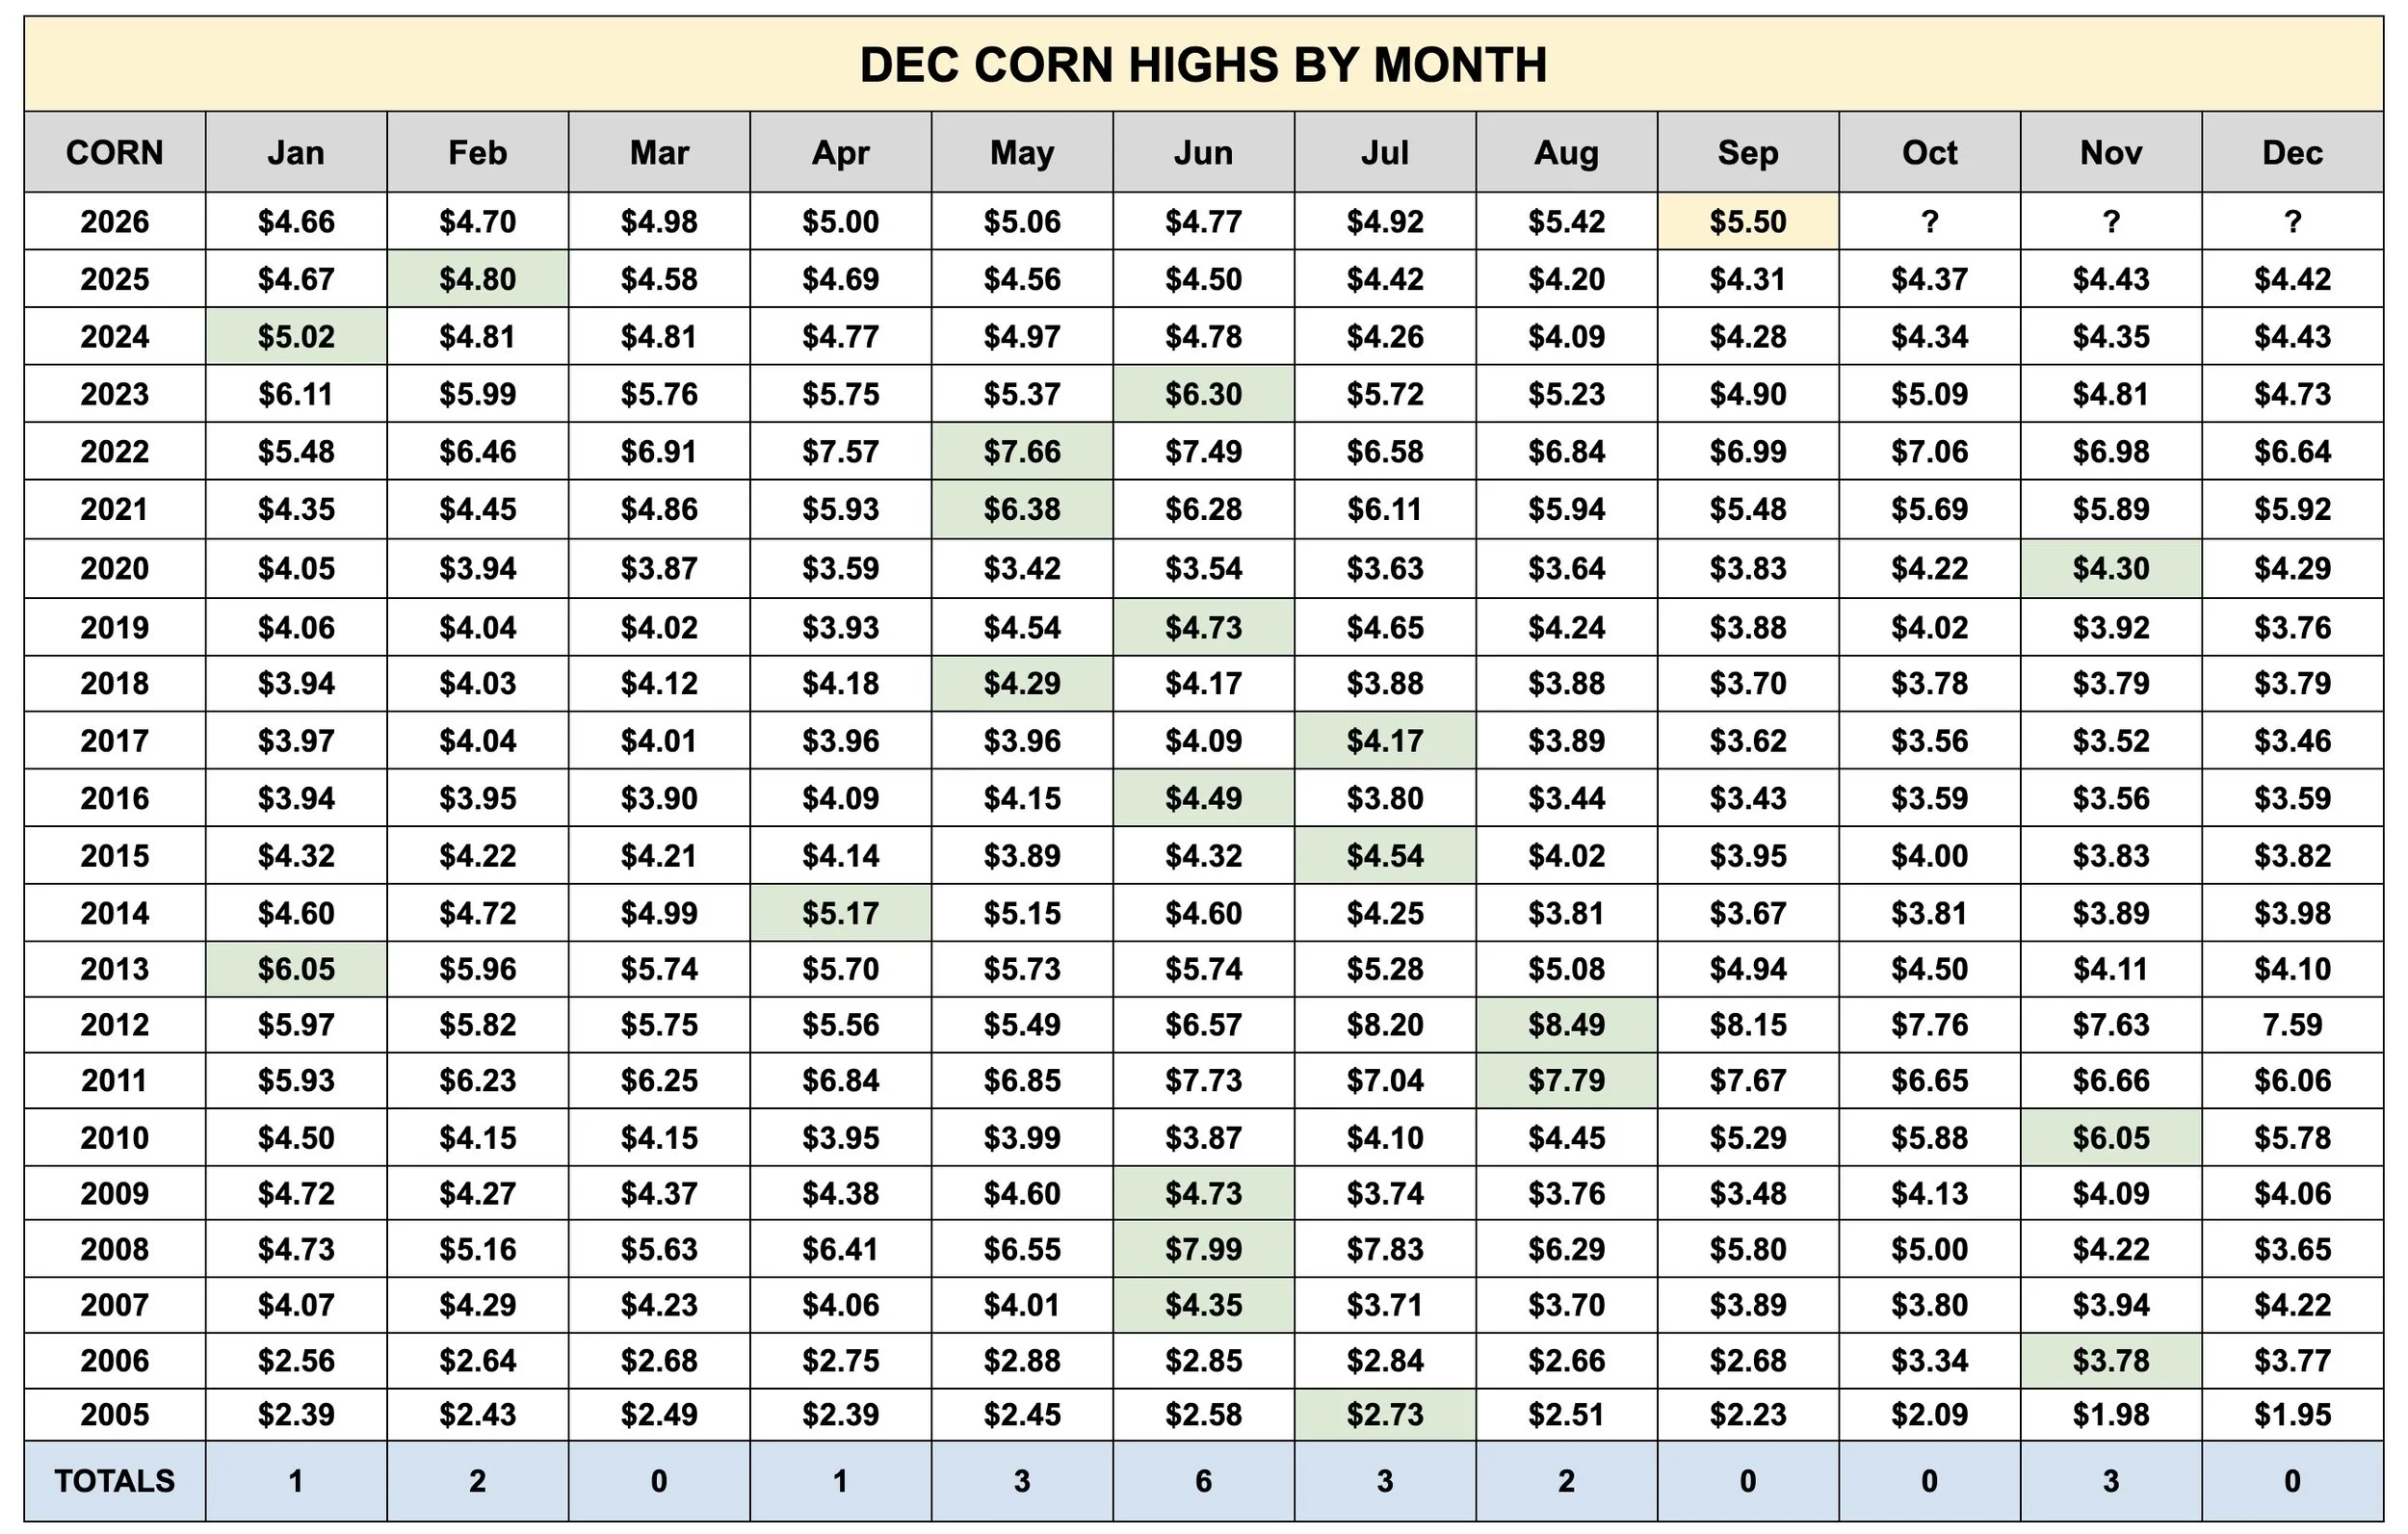
Since at least 2005, corn has never topped in September or October.
That doesn’t mean it couldn’t happen, but history favors higher.
The last two times we posted our highs later than August?
2010 and 2020.
So there are several things are awfully similar to other pre-bull market years.
None of this means corn is definitively going to $6, $7, or $8.
But it's hard to deny some of the similarities and potential in this market.
Risk Management:
Those of you who are short on time and have to move stuff off the combine, we still think you should be being proactive. Hence the sell and hedge alert at the recent highs.
Yes we think this market has upside potential.
That does not mean there are not short term risks. There is a reason we usually post our lows around harvest time.
The funds are record long and know there is going to be some farmer selling at harvest. Short term I am cautious up here.
Those with plenty of time, we like staying plenty patient. If we see some pressure here heading into harvest, I think it'll eventually be met with buying.
We have the most upside potential we've had in years. We don’t want to miss out on it if it unravels.
Corn Charts
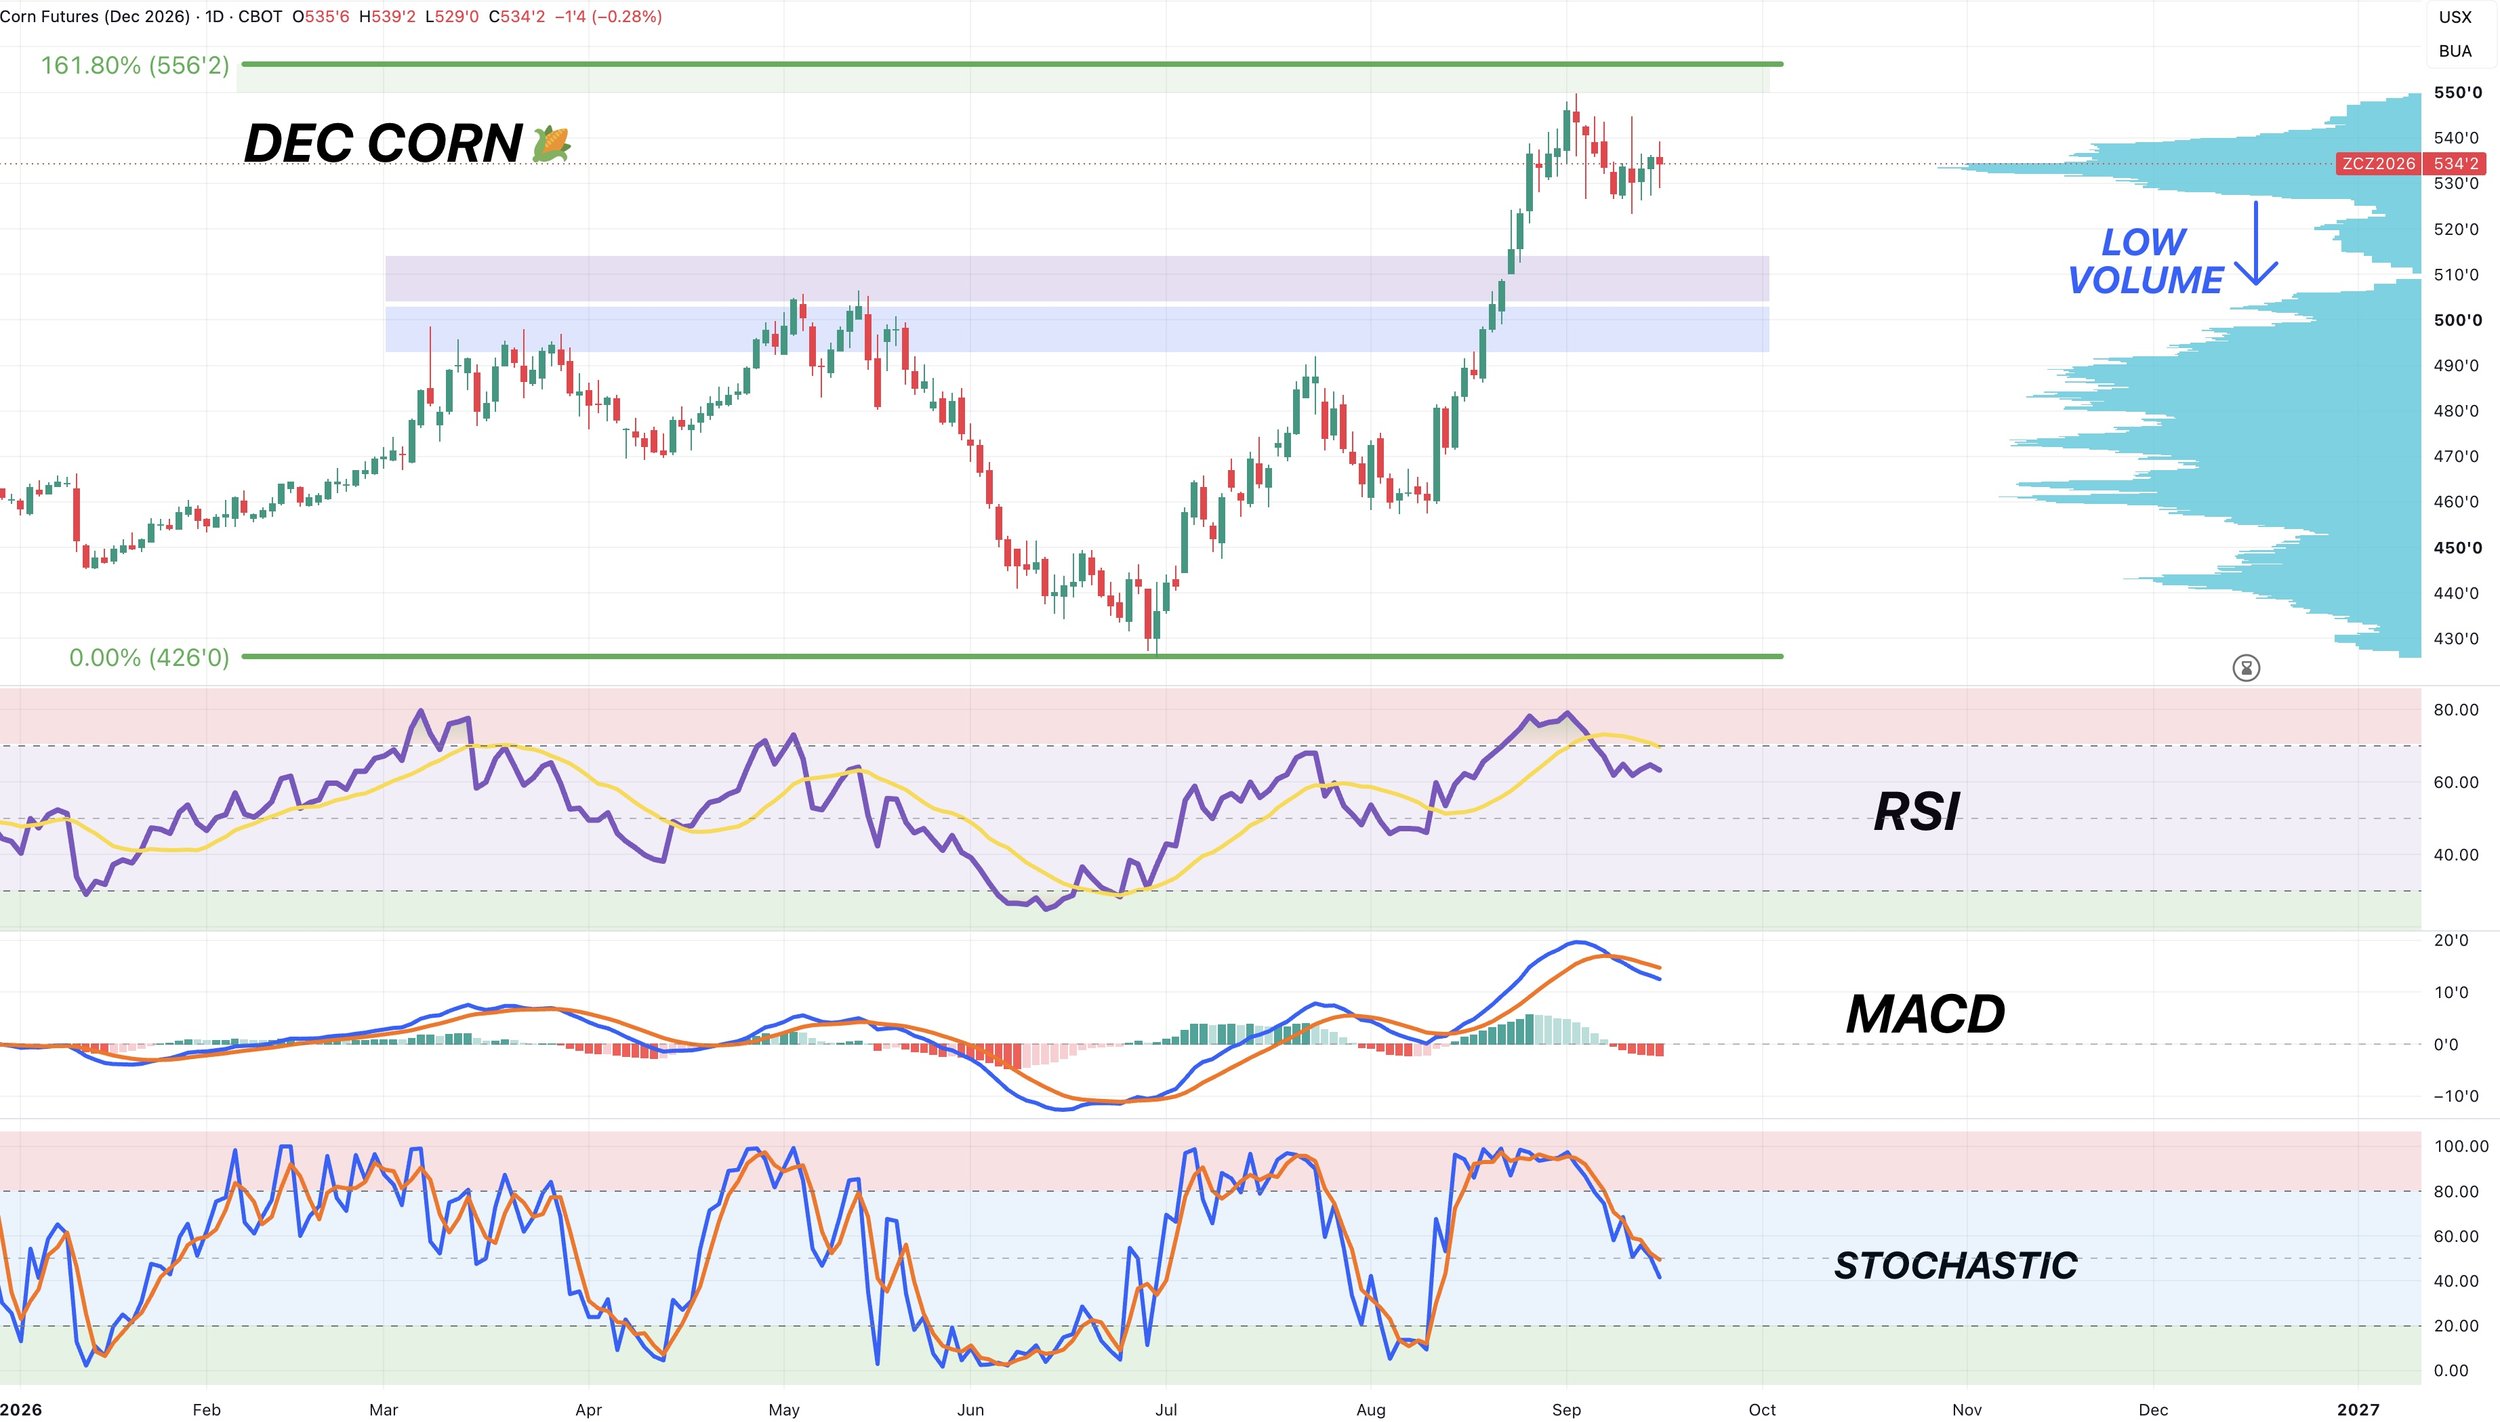
Dec Corn Daily Chart:
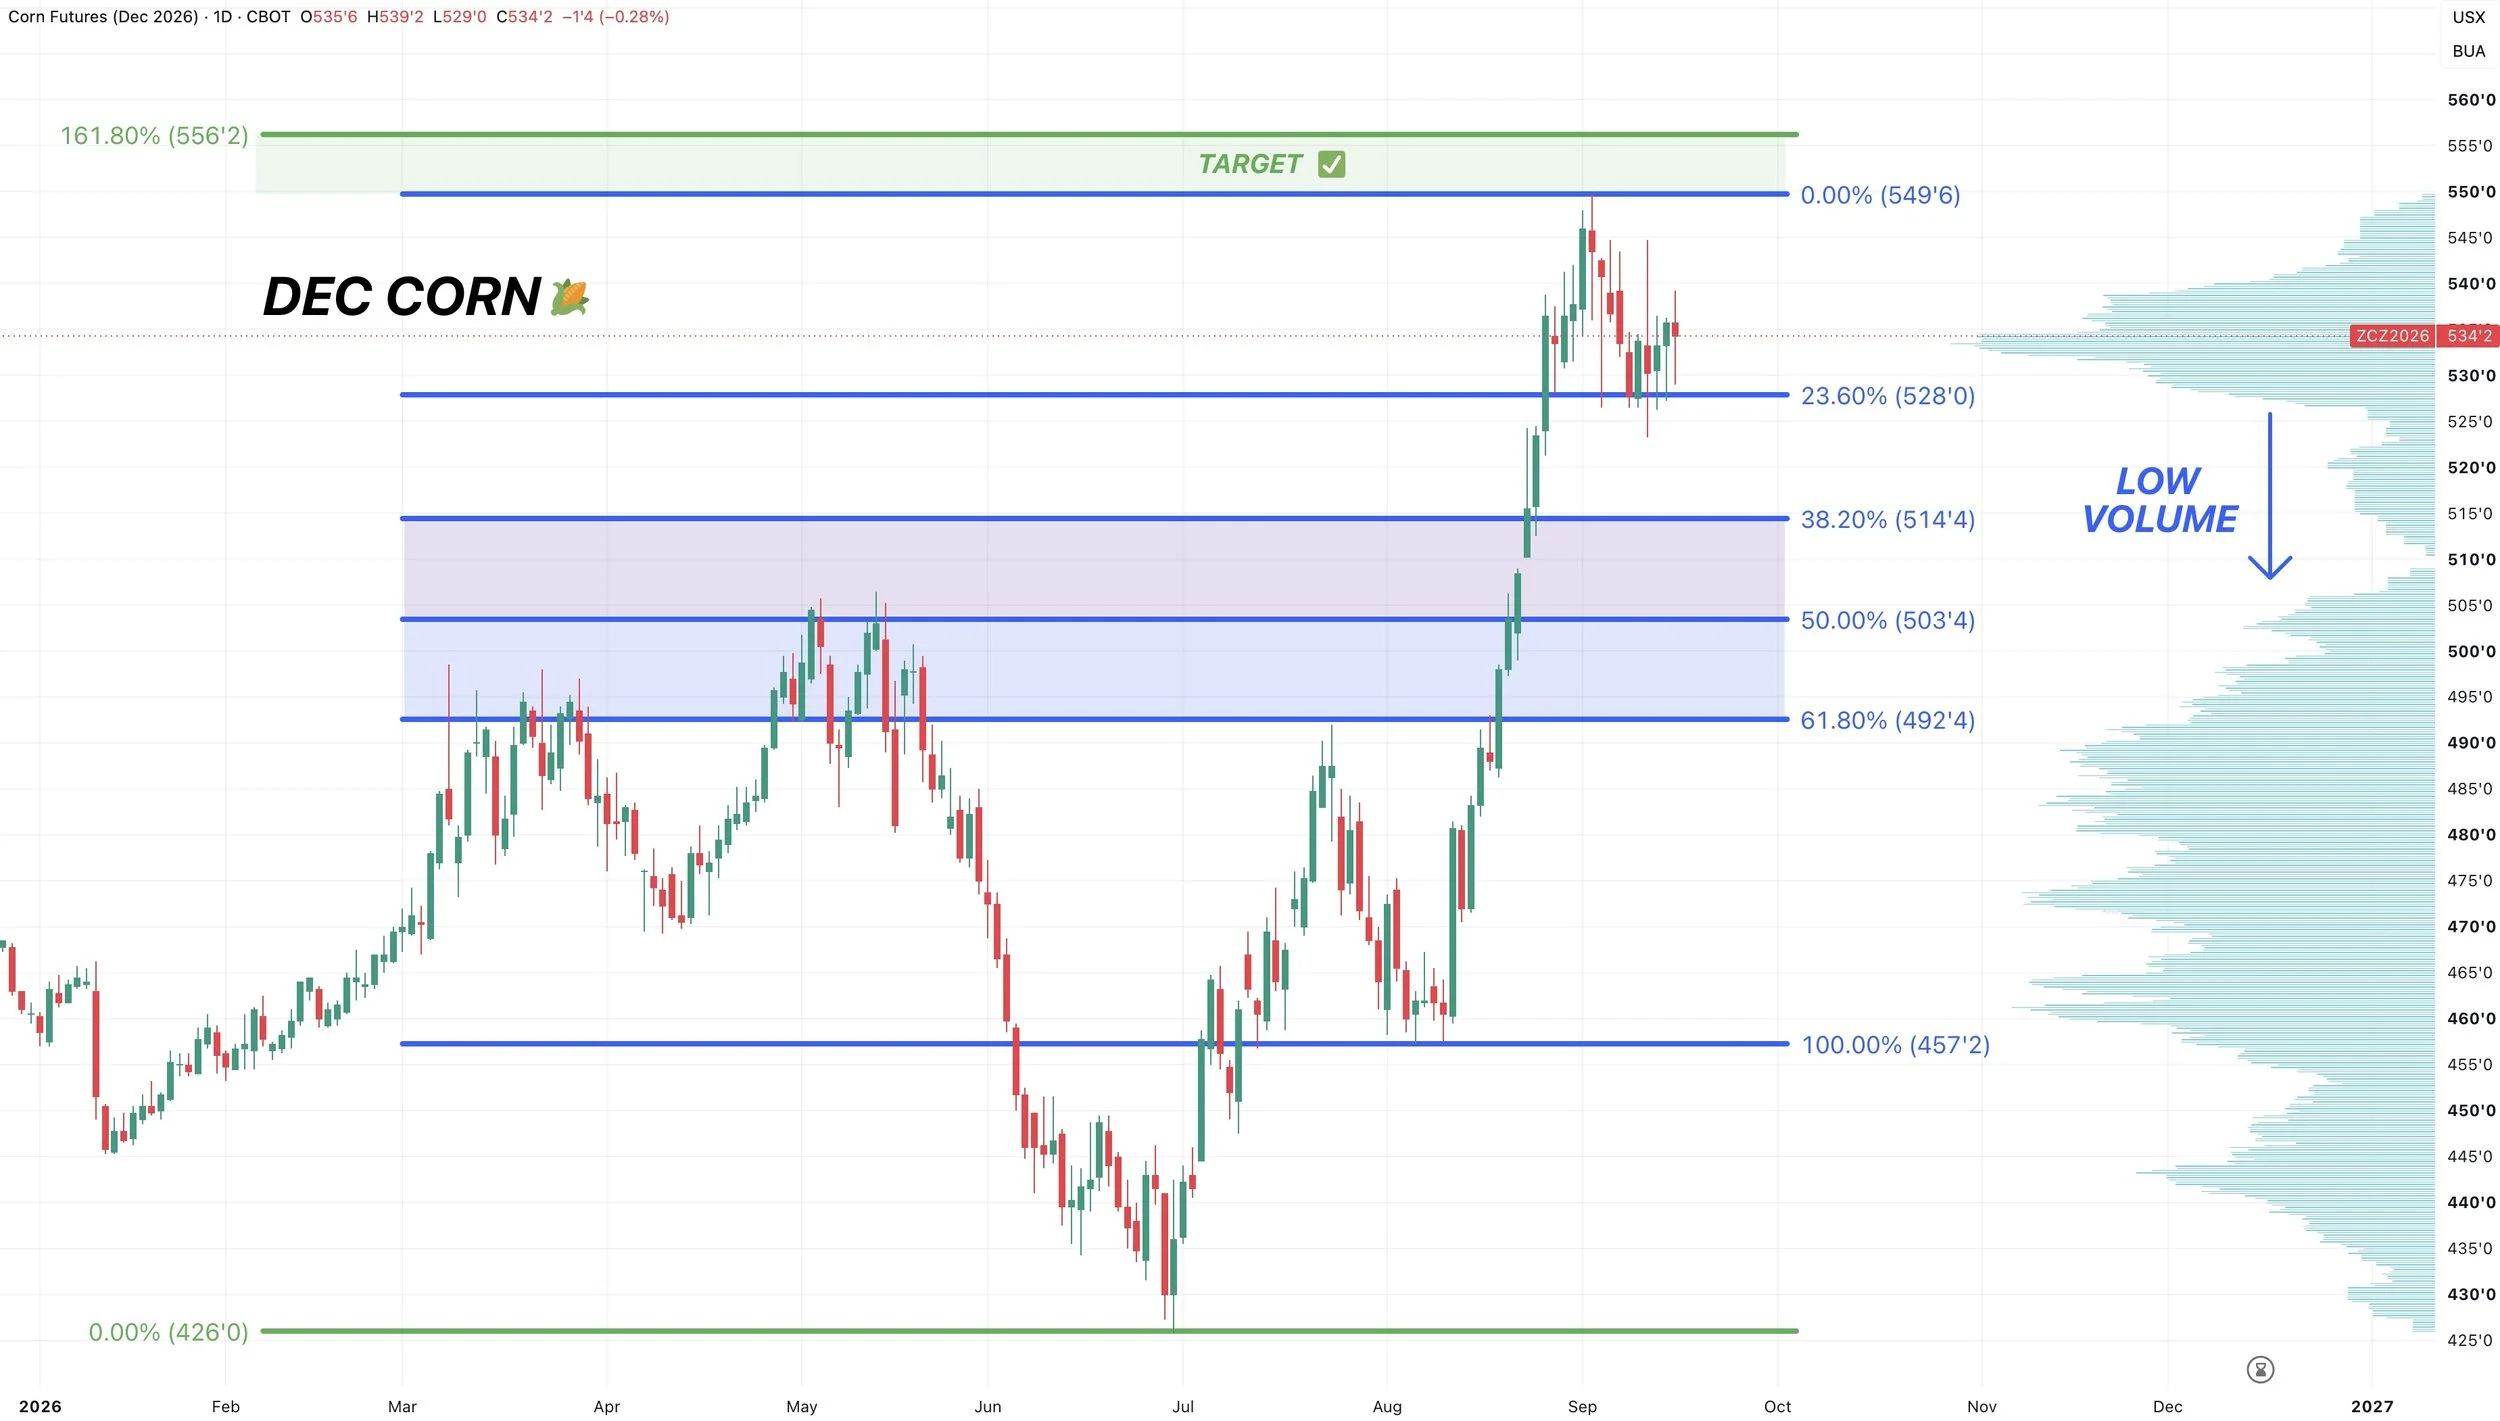
Short term, I am still cautious here. As a short term correction would not be a surprise heading into harvest in my opinion.
The biggest thing to watch is that $5.28 level.
That gives back 23.6% of the rally from August. That is the first retracement level.
We have continued to bounce there. As we have bounced there nearly 7 times now. So bulls want to hold that level.
If we break that level, we probably get a leg lower.
One level I am watching if that happens is that $5.04 range. Which gives back 50% of the August rally and would be a re-test of those May highs.
If you notice, there is zero volume below this level and sideways range we've been trading in. So breaking below could very well spark a good leg lower.
Indicators:
It's still way too early to call a bottom.
If we look at the indicators, the RSI hasn’t cooled off much.
The MACD crossed bearish and is currently still curling lower.
The stochastics have not yet bottomed, but are getting closer than they were.
Weekly Chart: Still Bullish
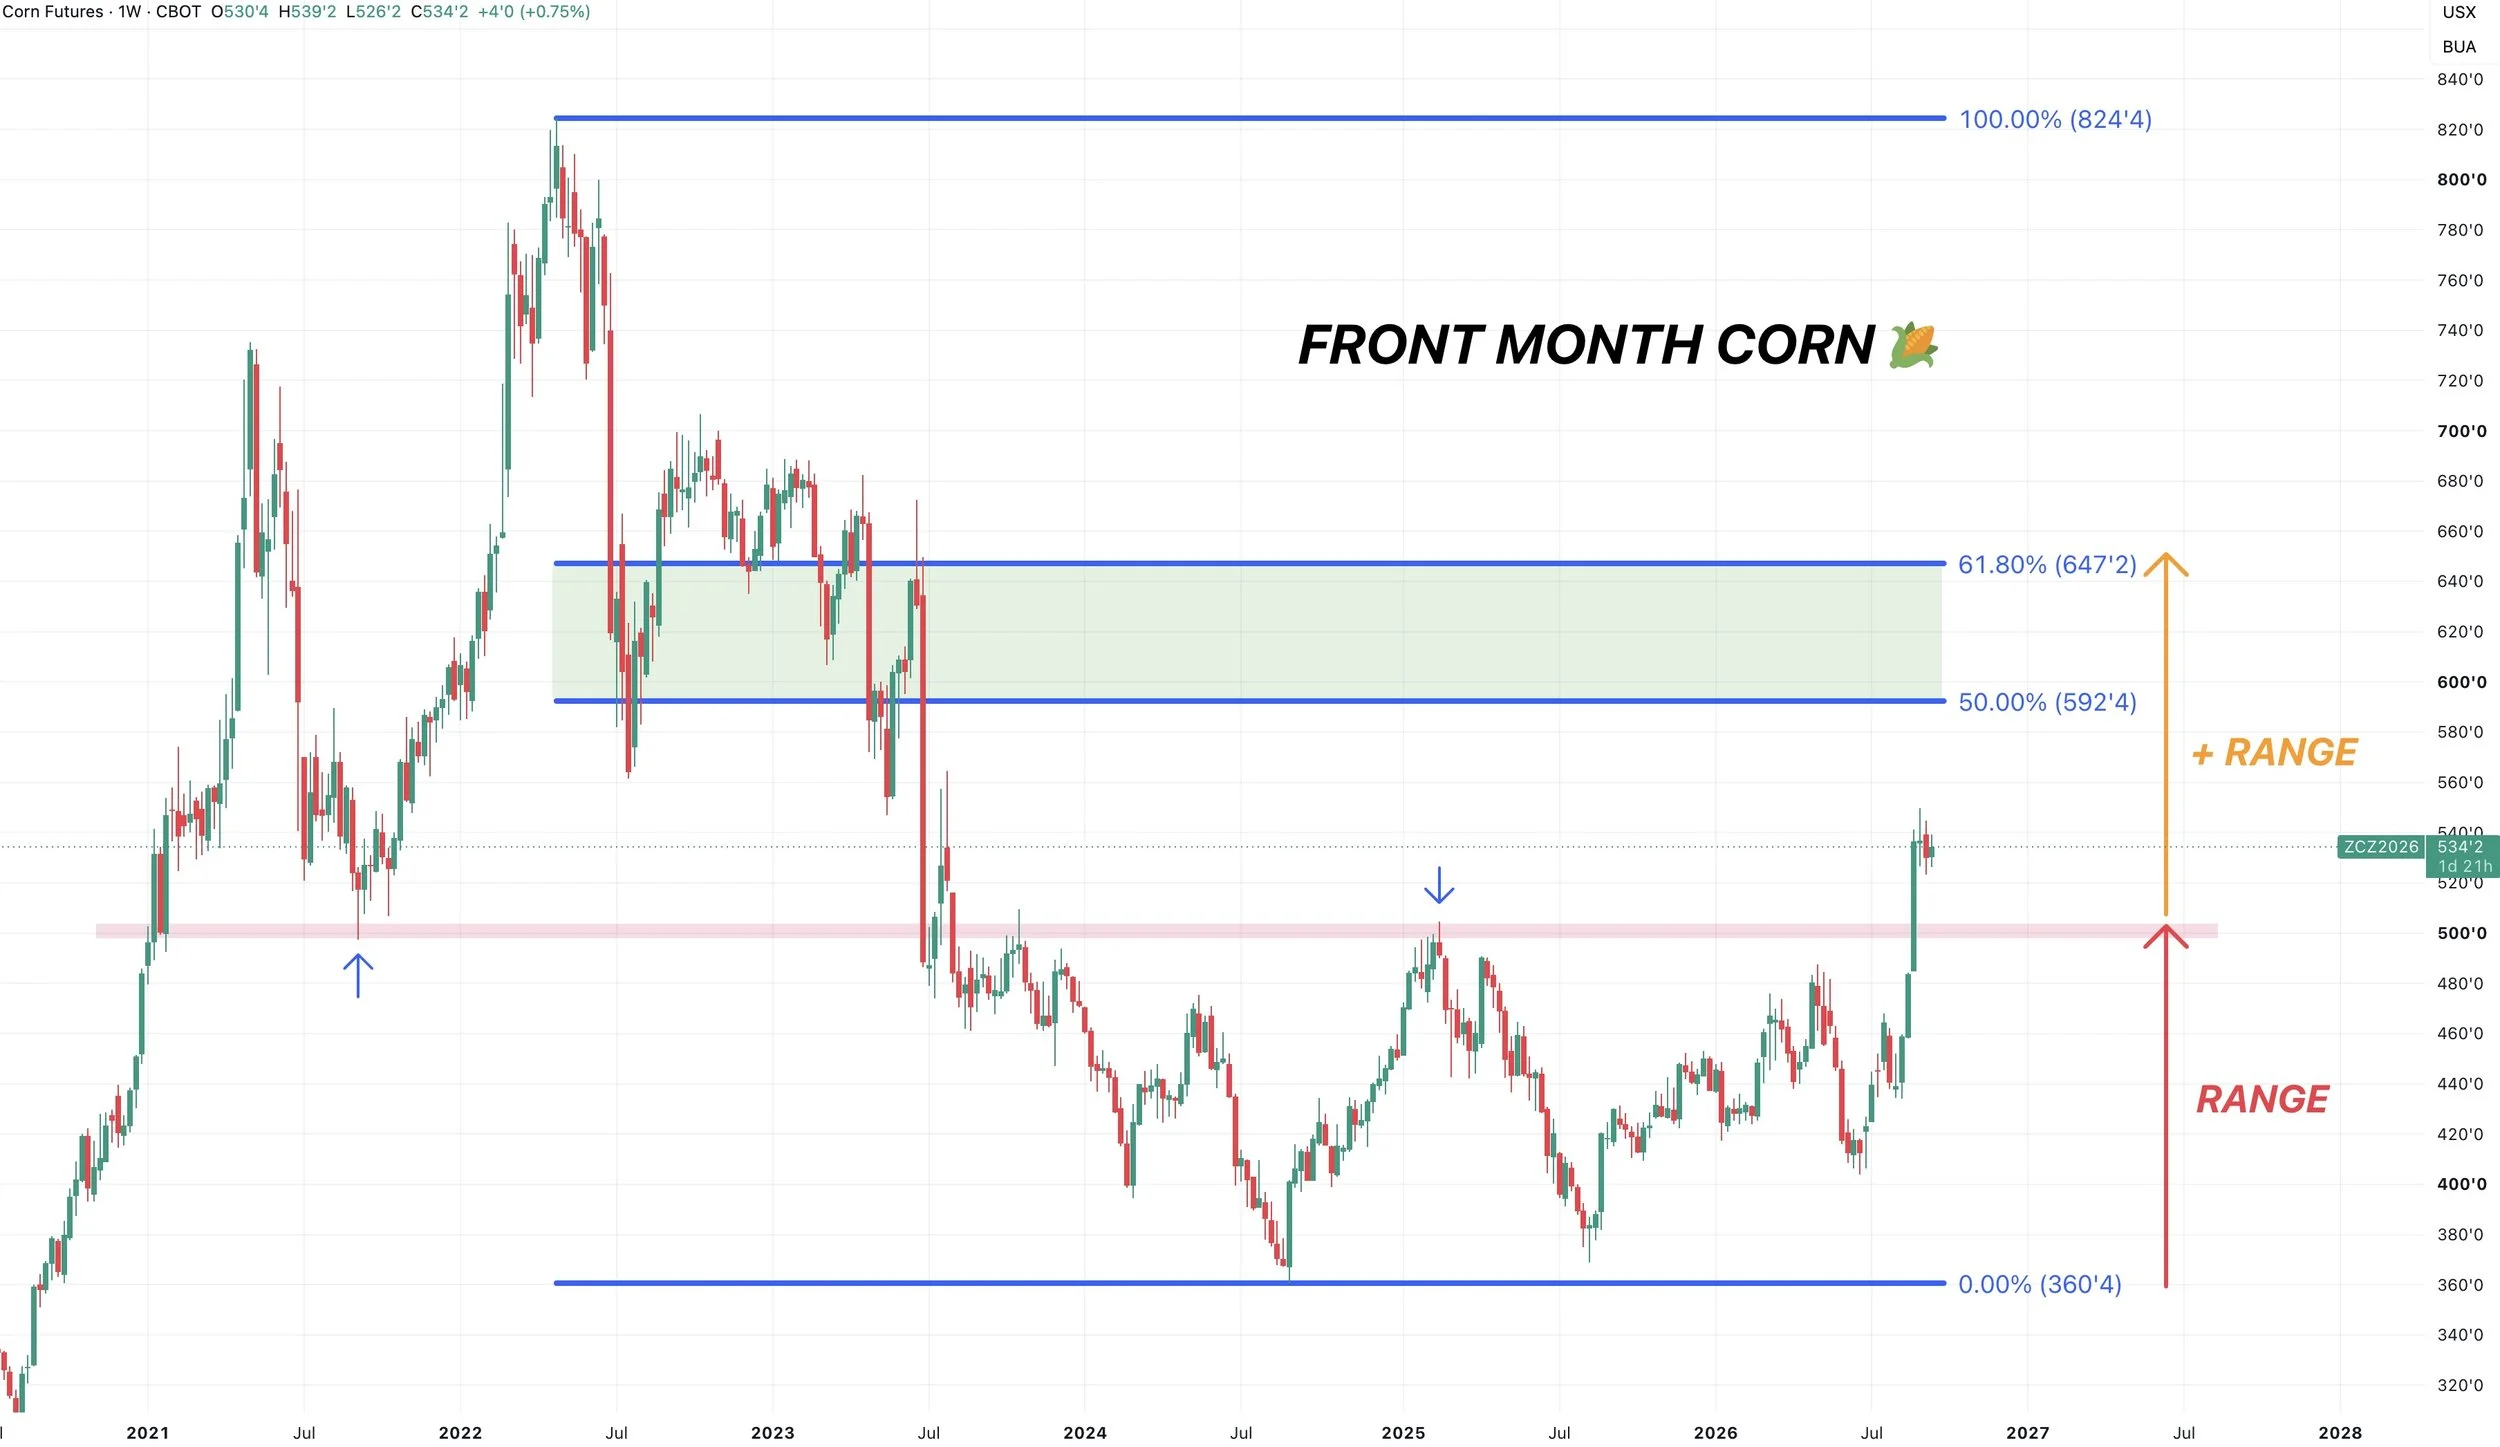
Big picture I still think corn has a shot at $6.50 eventually.
It of course doesn’t have to happen, but from a technical standpoint it would make sense.
The weekly and monthly charts are still very bullish for corn.
If you take the range we were trapped in for 3 years, and add it on top of that range, you get $6.50
$6.50 also claws back 61.8% of the 2022 highs.
Soybeans
Fundamentals:
Trump meets with China next week.
So far China has done exactly what they said they'd do. As they've bought half of that 25 MMT goal.
I've already gone over how the US simply doesn’t have the supply to fulfill China's goal unless we ration demand to non-China destinations. Which I believe could ultimately prove to be bullish for soybeans long term. As I firmly believe China will meet that goal.
China slashed some tariffs a few days ago, which is hopefully a positive sign heading into this meeting.
There was talk that they could possibly drop the reciprocal tariffs in this meeting, which would be friendly if that actually happened.
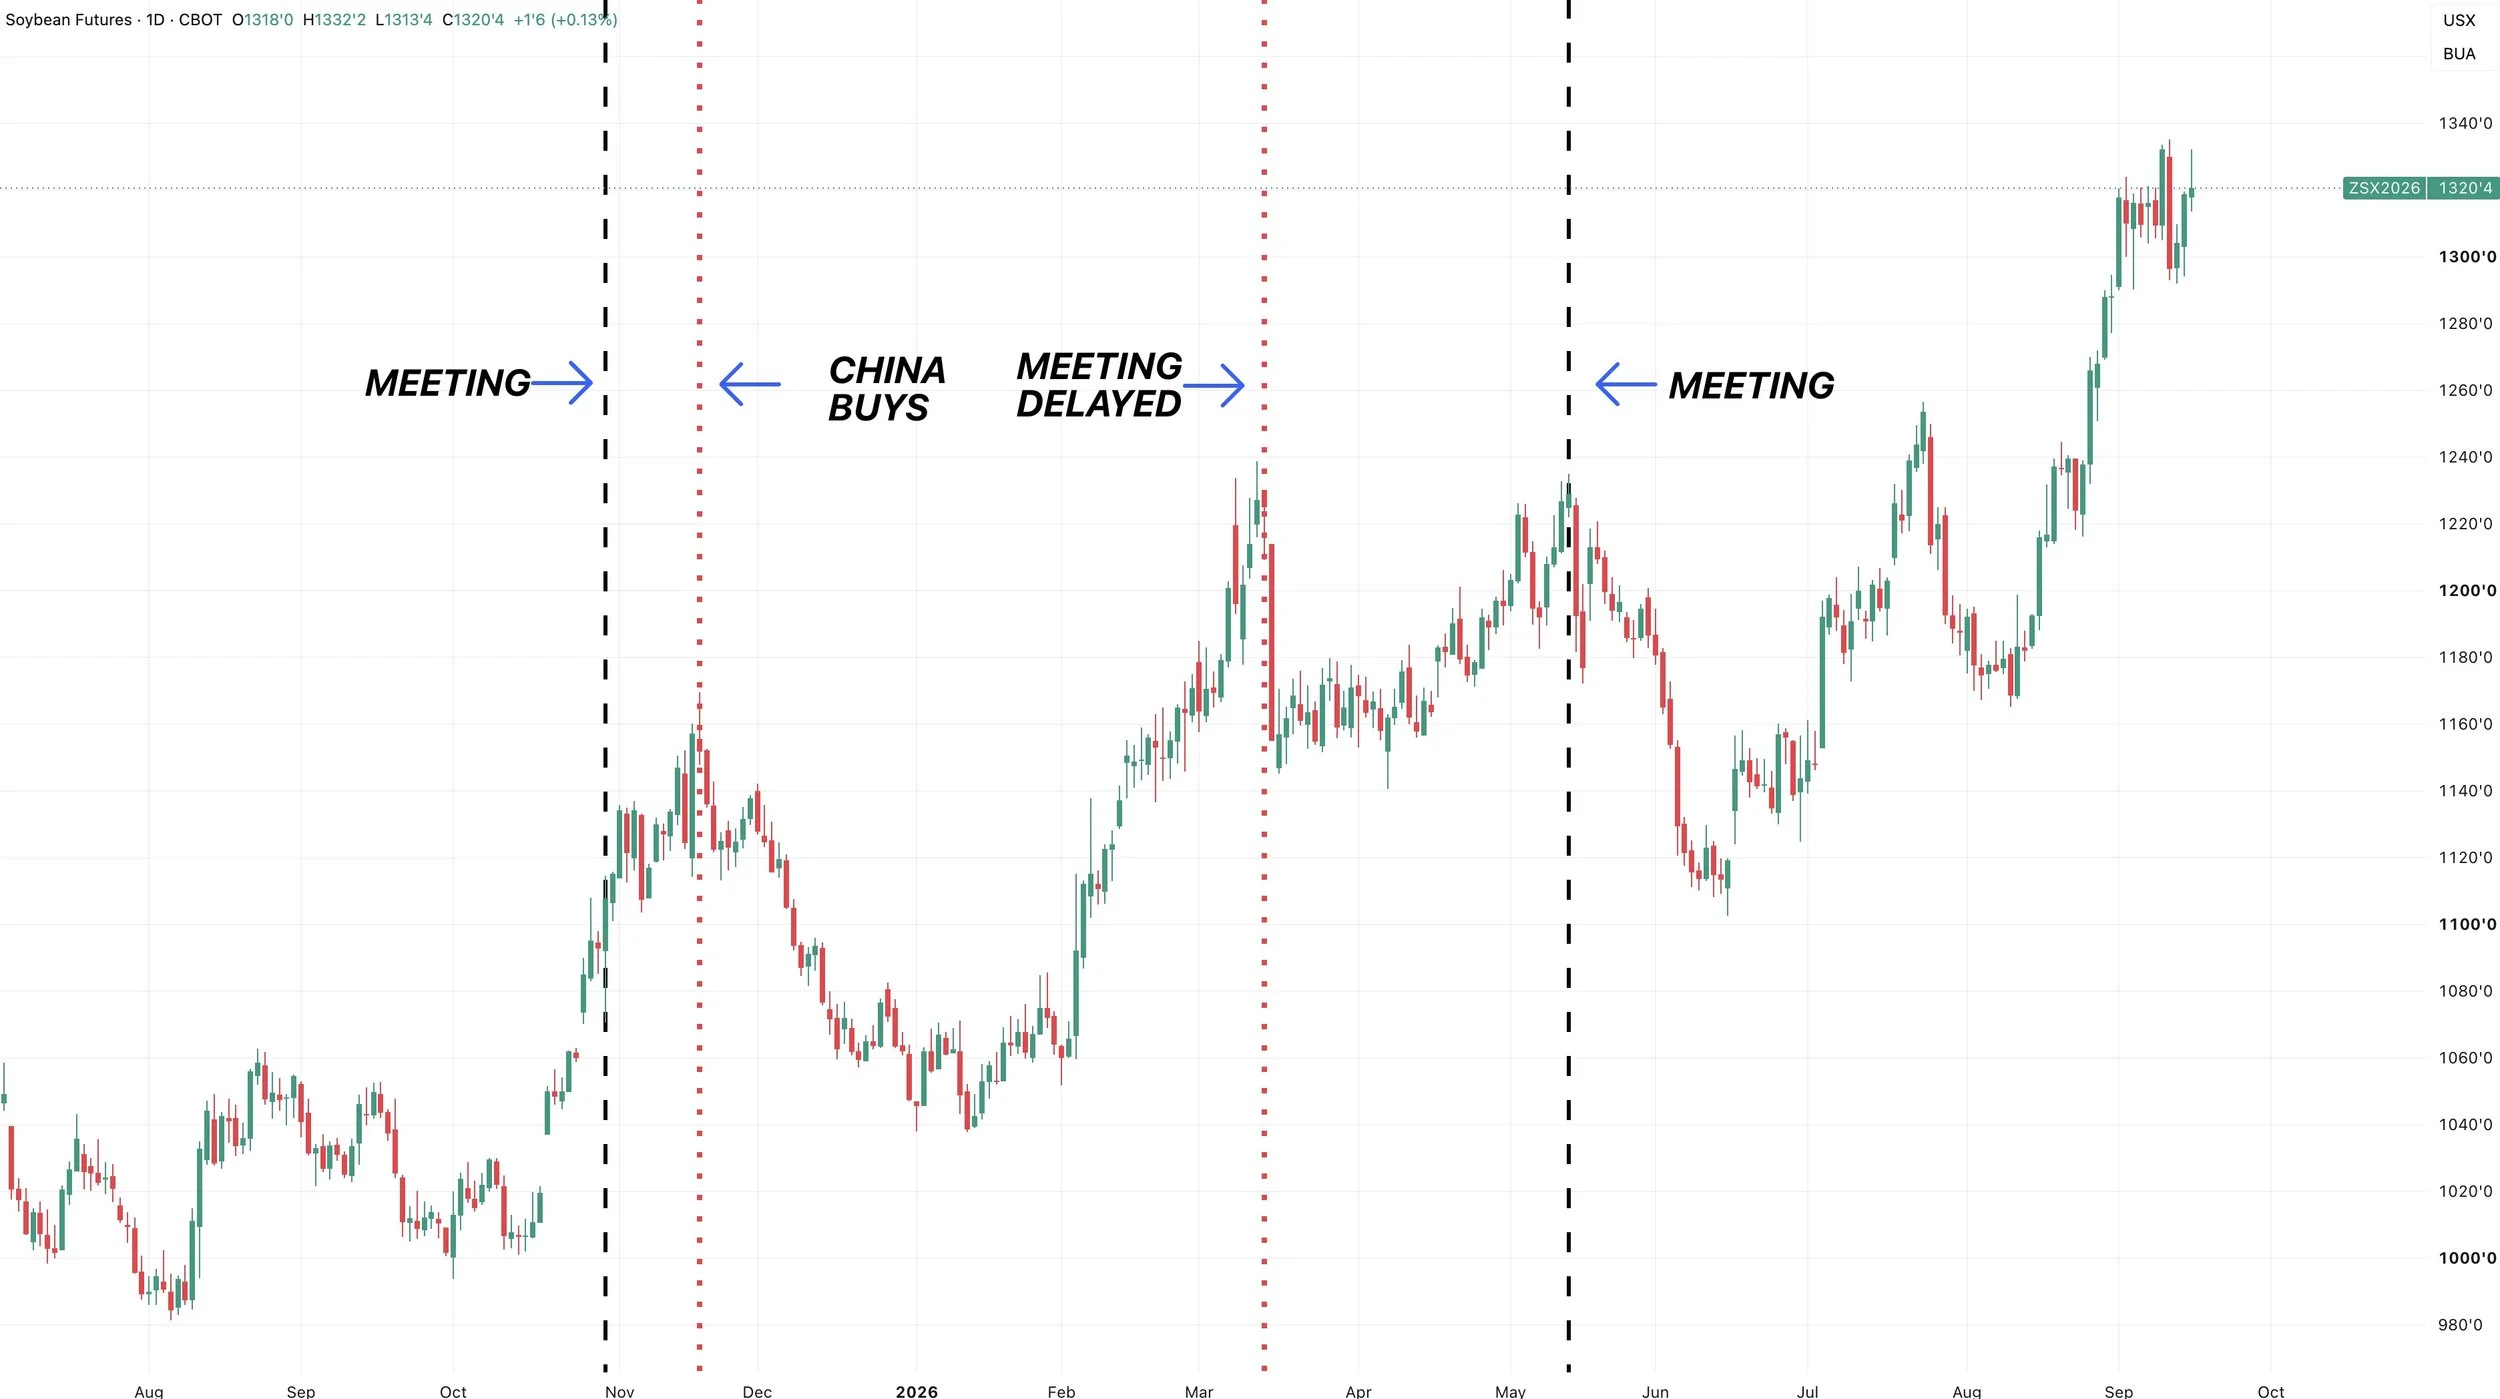
But how has the market reacted to the last few meetings?
Soybeans do have a tendency to run going into these meetings.
The last two meetings were May 14th, 2026 and October 30th, 2025.
The last meeting back in May did actually end up marking the highs in soybeans for a few months.
That May meeting was originally scheduled for March, but got delayed until May. As a result we saw that limit down day in March.
We then ran higher going into the meeting in May.
Then during the May meeting, the meeting simply provided zero additional details. The market was hoping for more commitments, but they really didn’t mention beans at all. Soybeans then topped.
Then on the October meeting, we got specific numbers. This is where they confirmed how many beans China would buying.
As a result, the market ran for another 2-3 weeks, before we then topped on the day that China bought their first sale of beans.
So we will have to see if this meeting provides us with any fresh details or not.
In other news, we had the NOPA crush out yesterday, it was the lowest in 11 months. But was still a record for the month of August.
Unlike in corn where most see the crop getting smaller from here, the soybean crop is a little more of a mixed bag and it's up for debate.
What we do know is that if yield gets smaller from here, the soybean balance sheet really couldn’t afford it without rationing demand.
Any cut to yield drops the carryout below 300 million. Which we haven’t seen since the bull market.
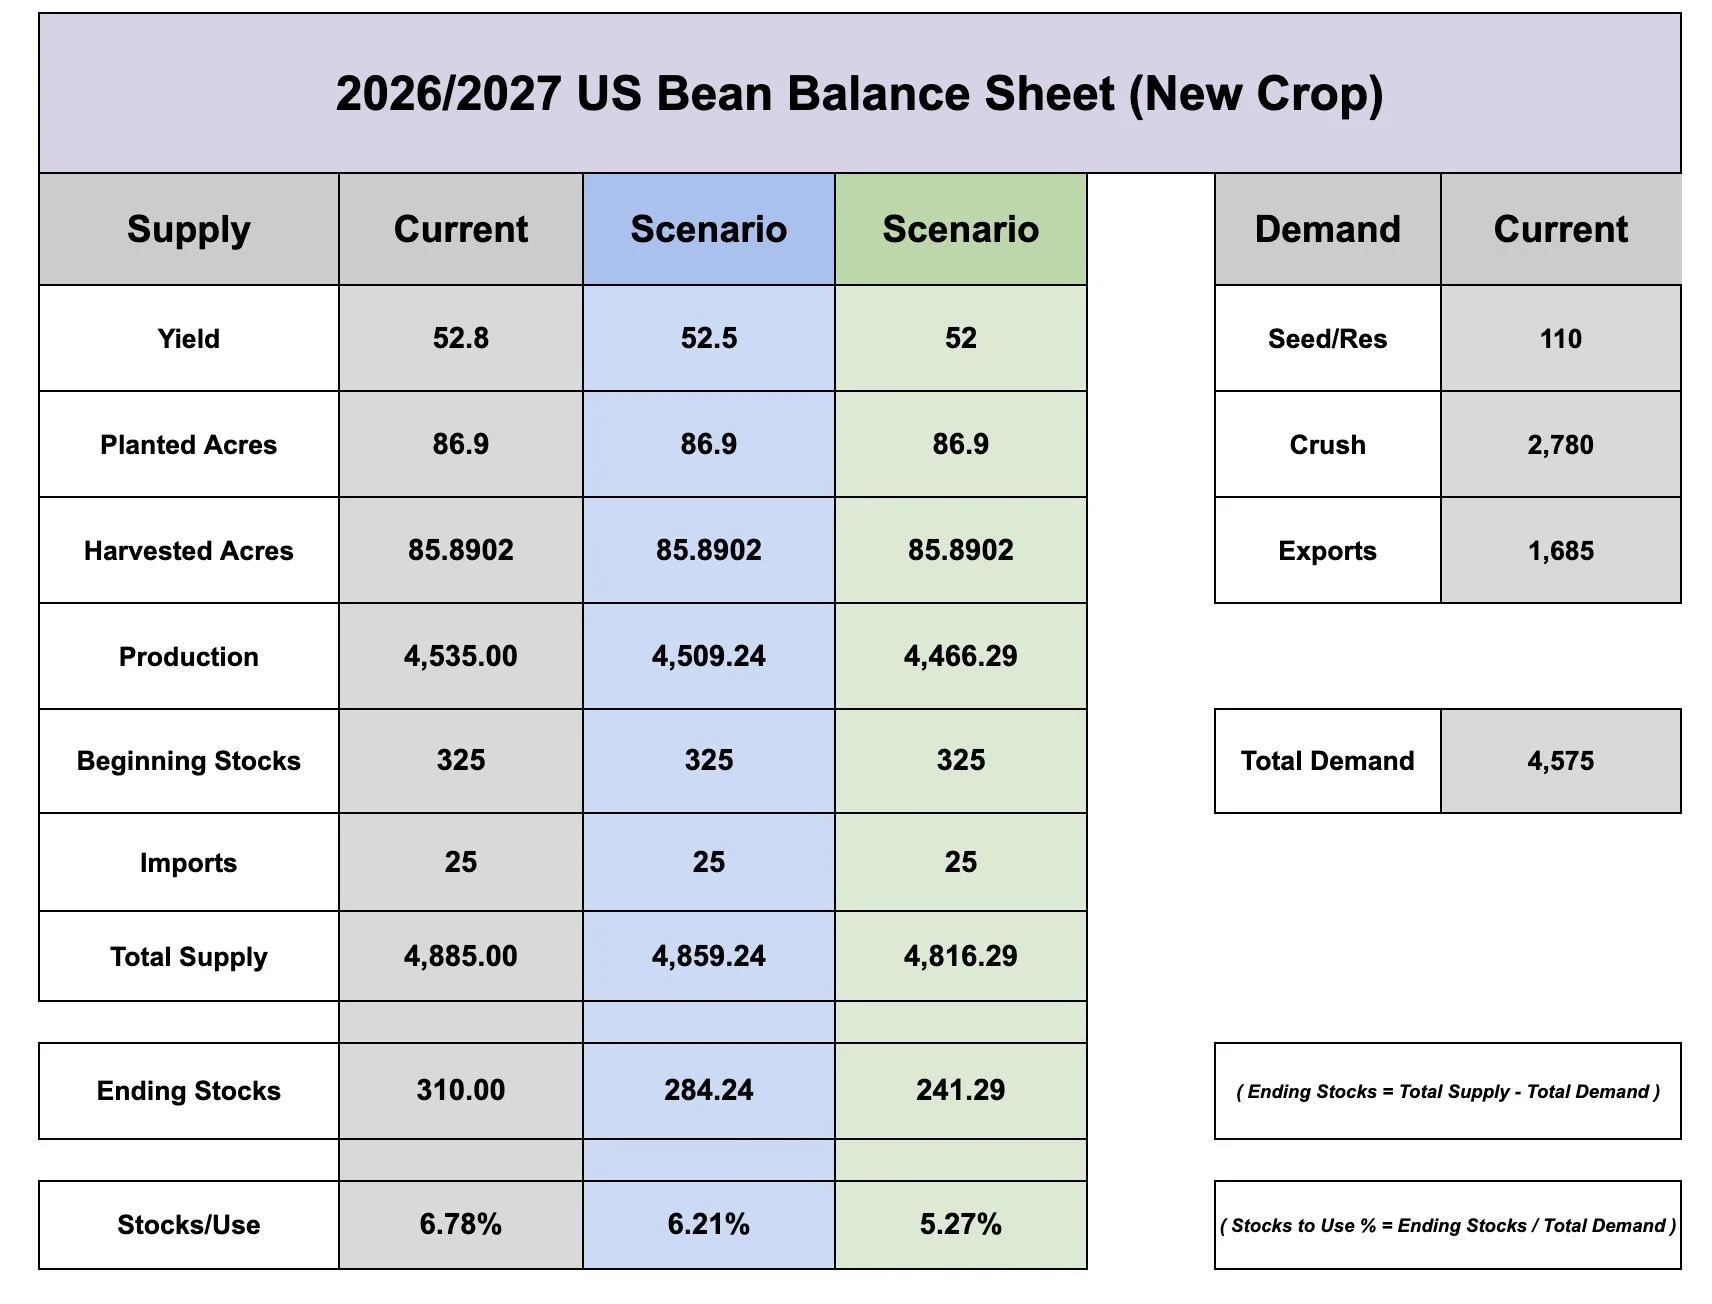
One of the more bullish things about the soybean market is that we planted a lot more acres this year.
Acres are up nearly +6 million vs last year.
Yield is basically the exact same as last year.
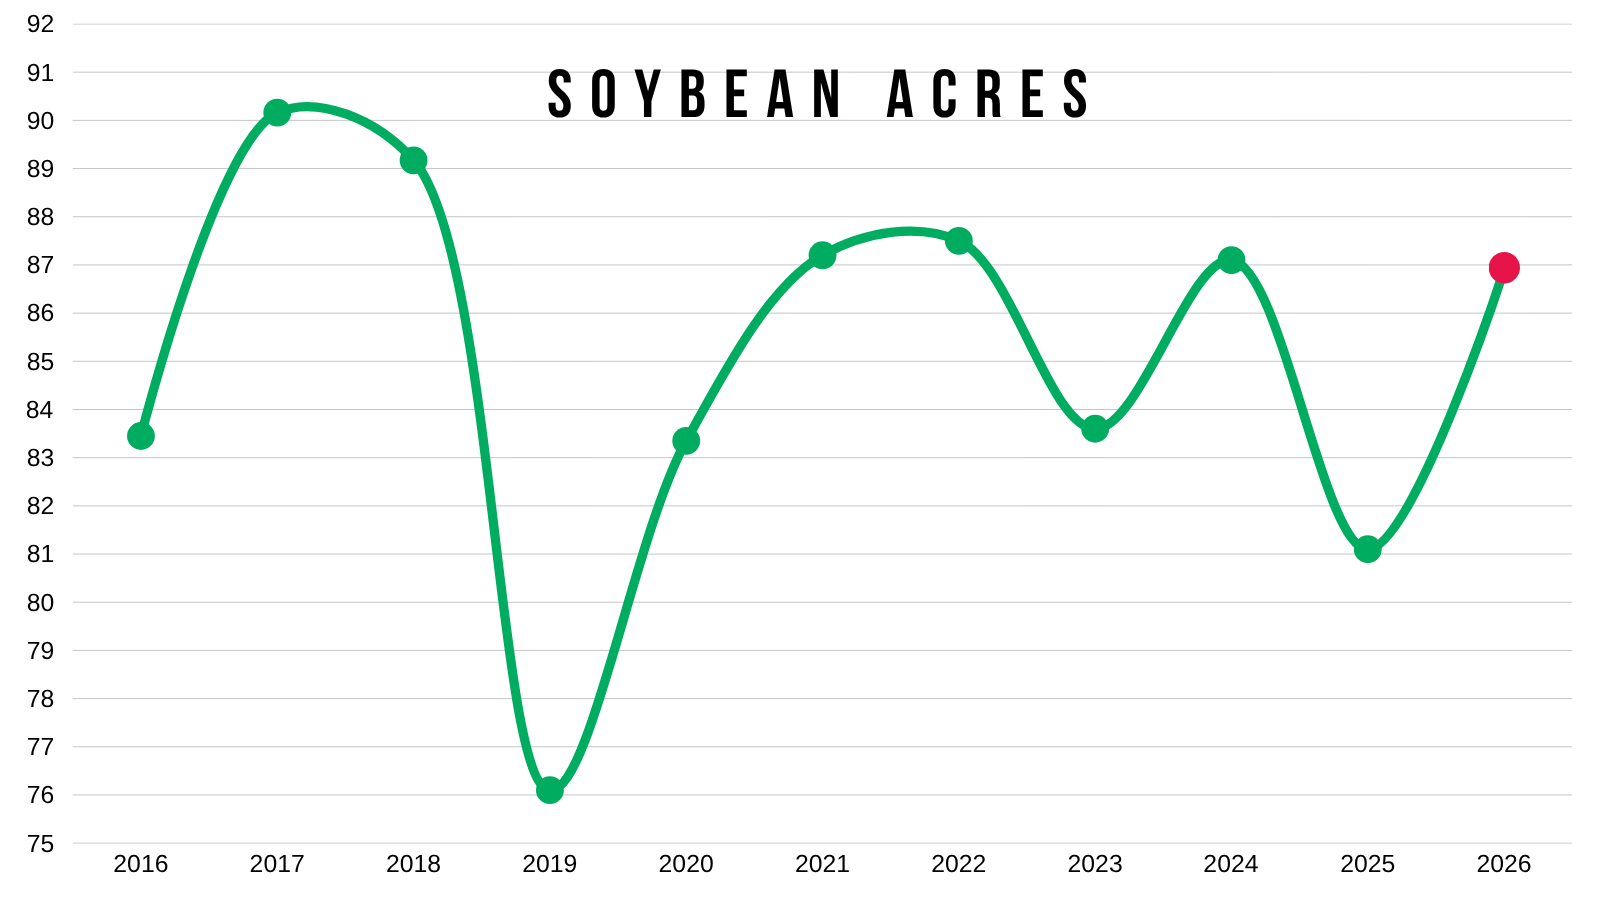
Yet.. the balance sheet is actually tighter than it was last year.
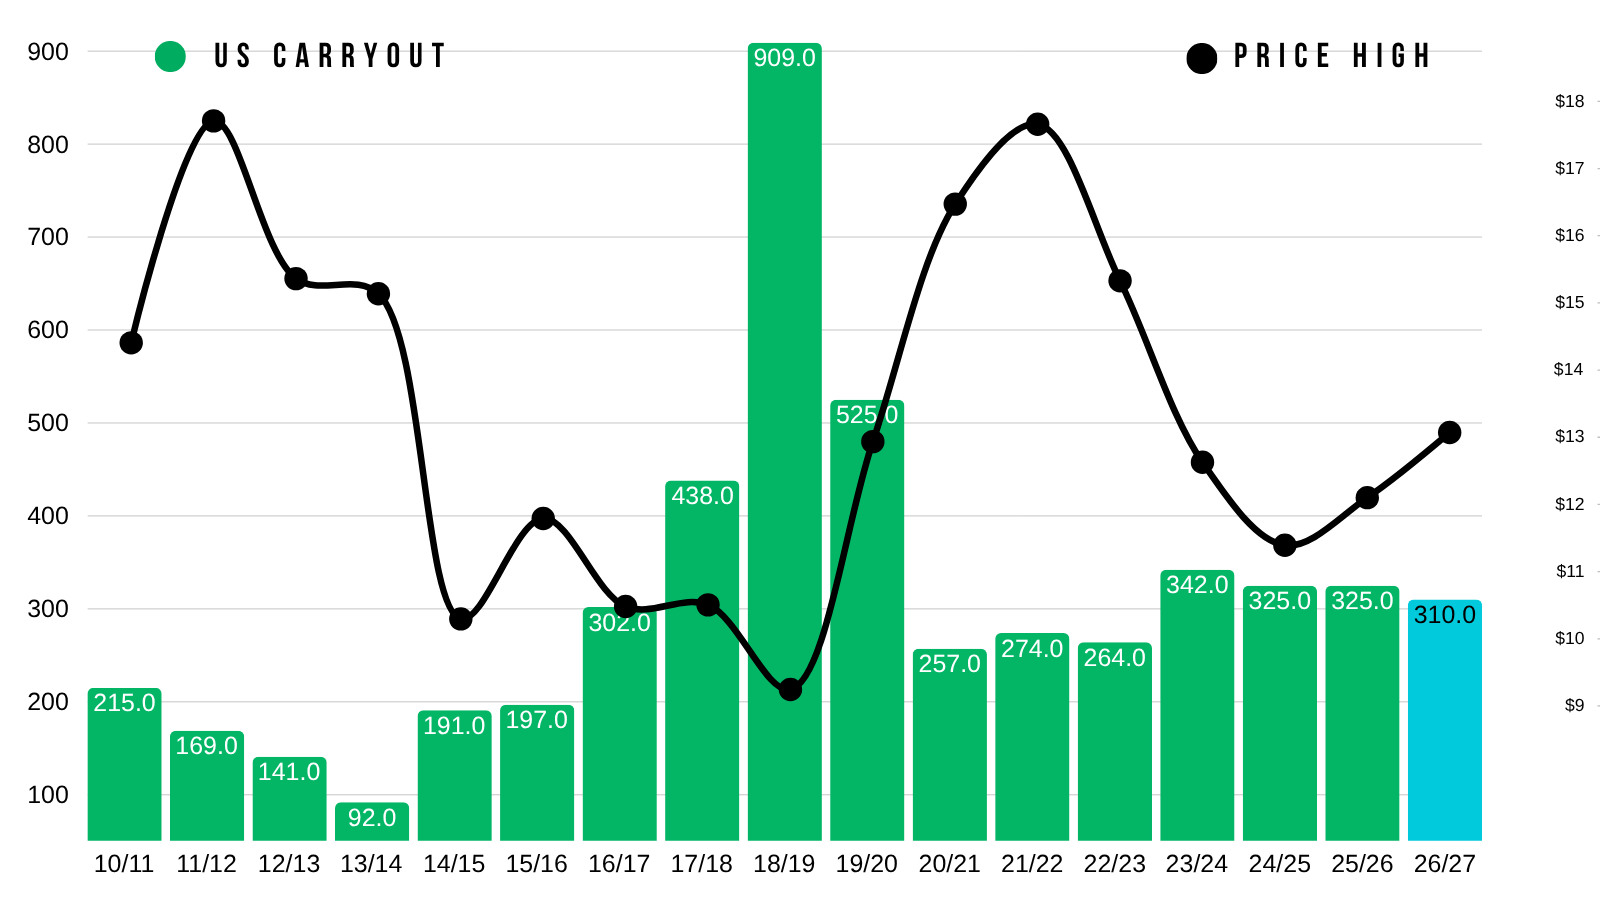
How did this happen?
Demand is just that strong.
The soybean market is a demand led market.
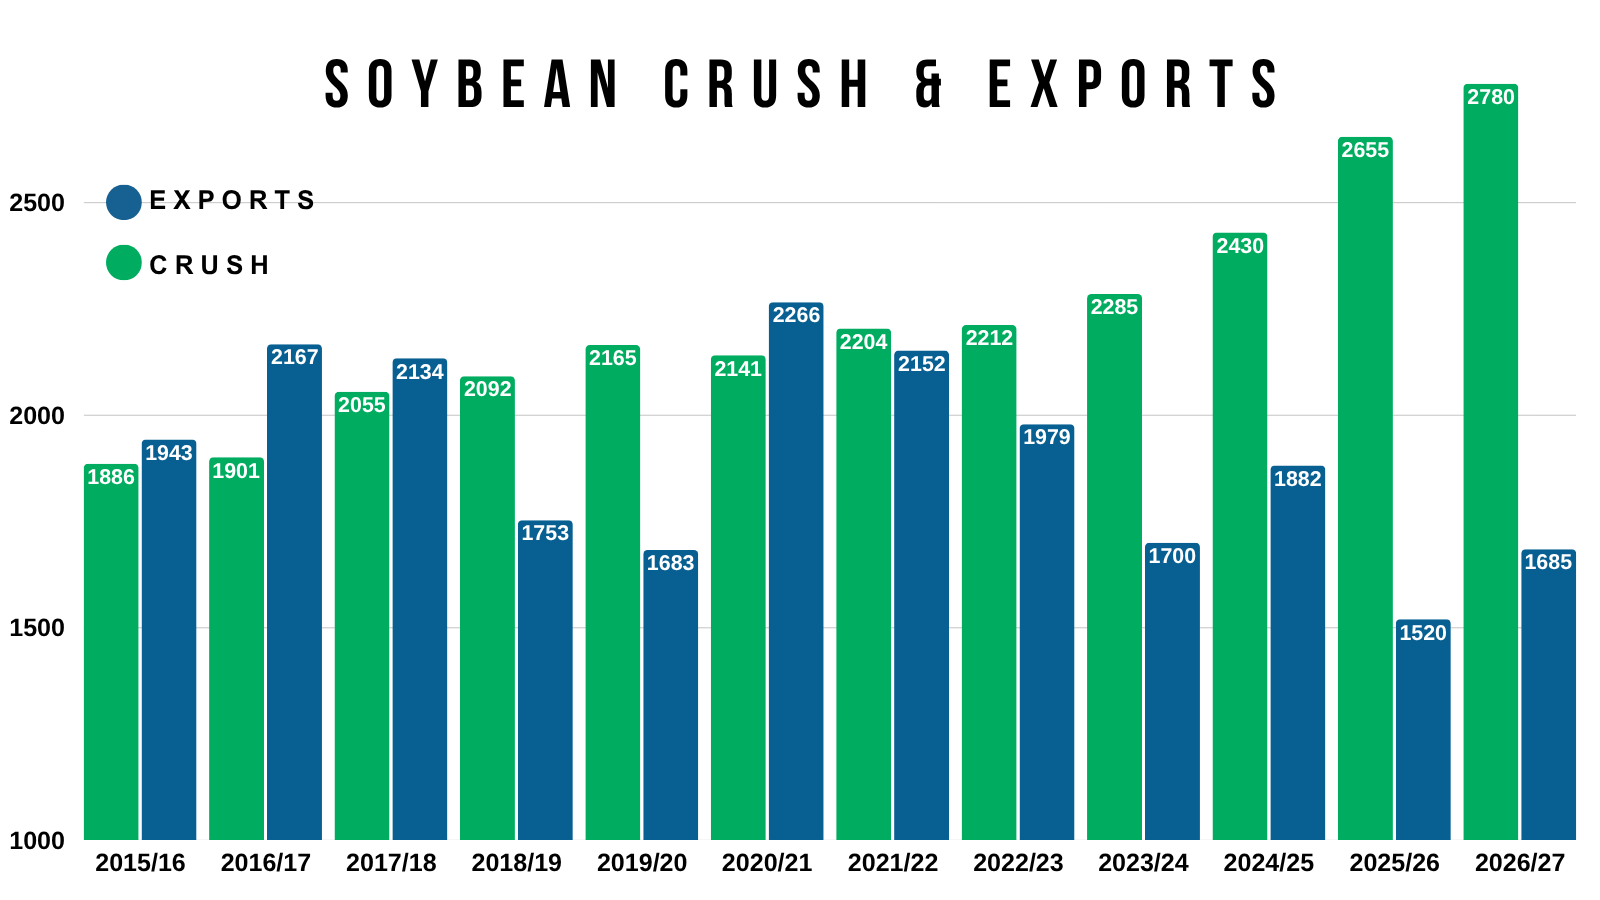
Meal at 2 Year Highs:
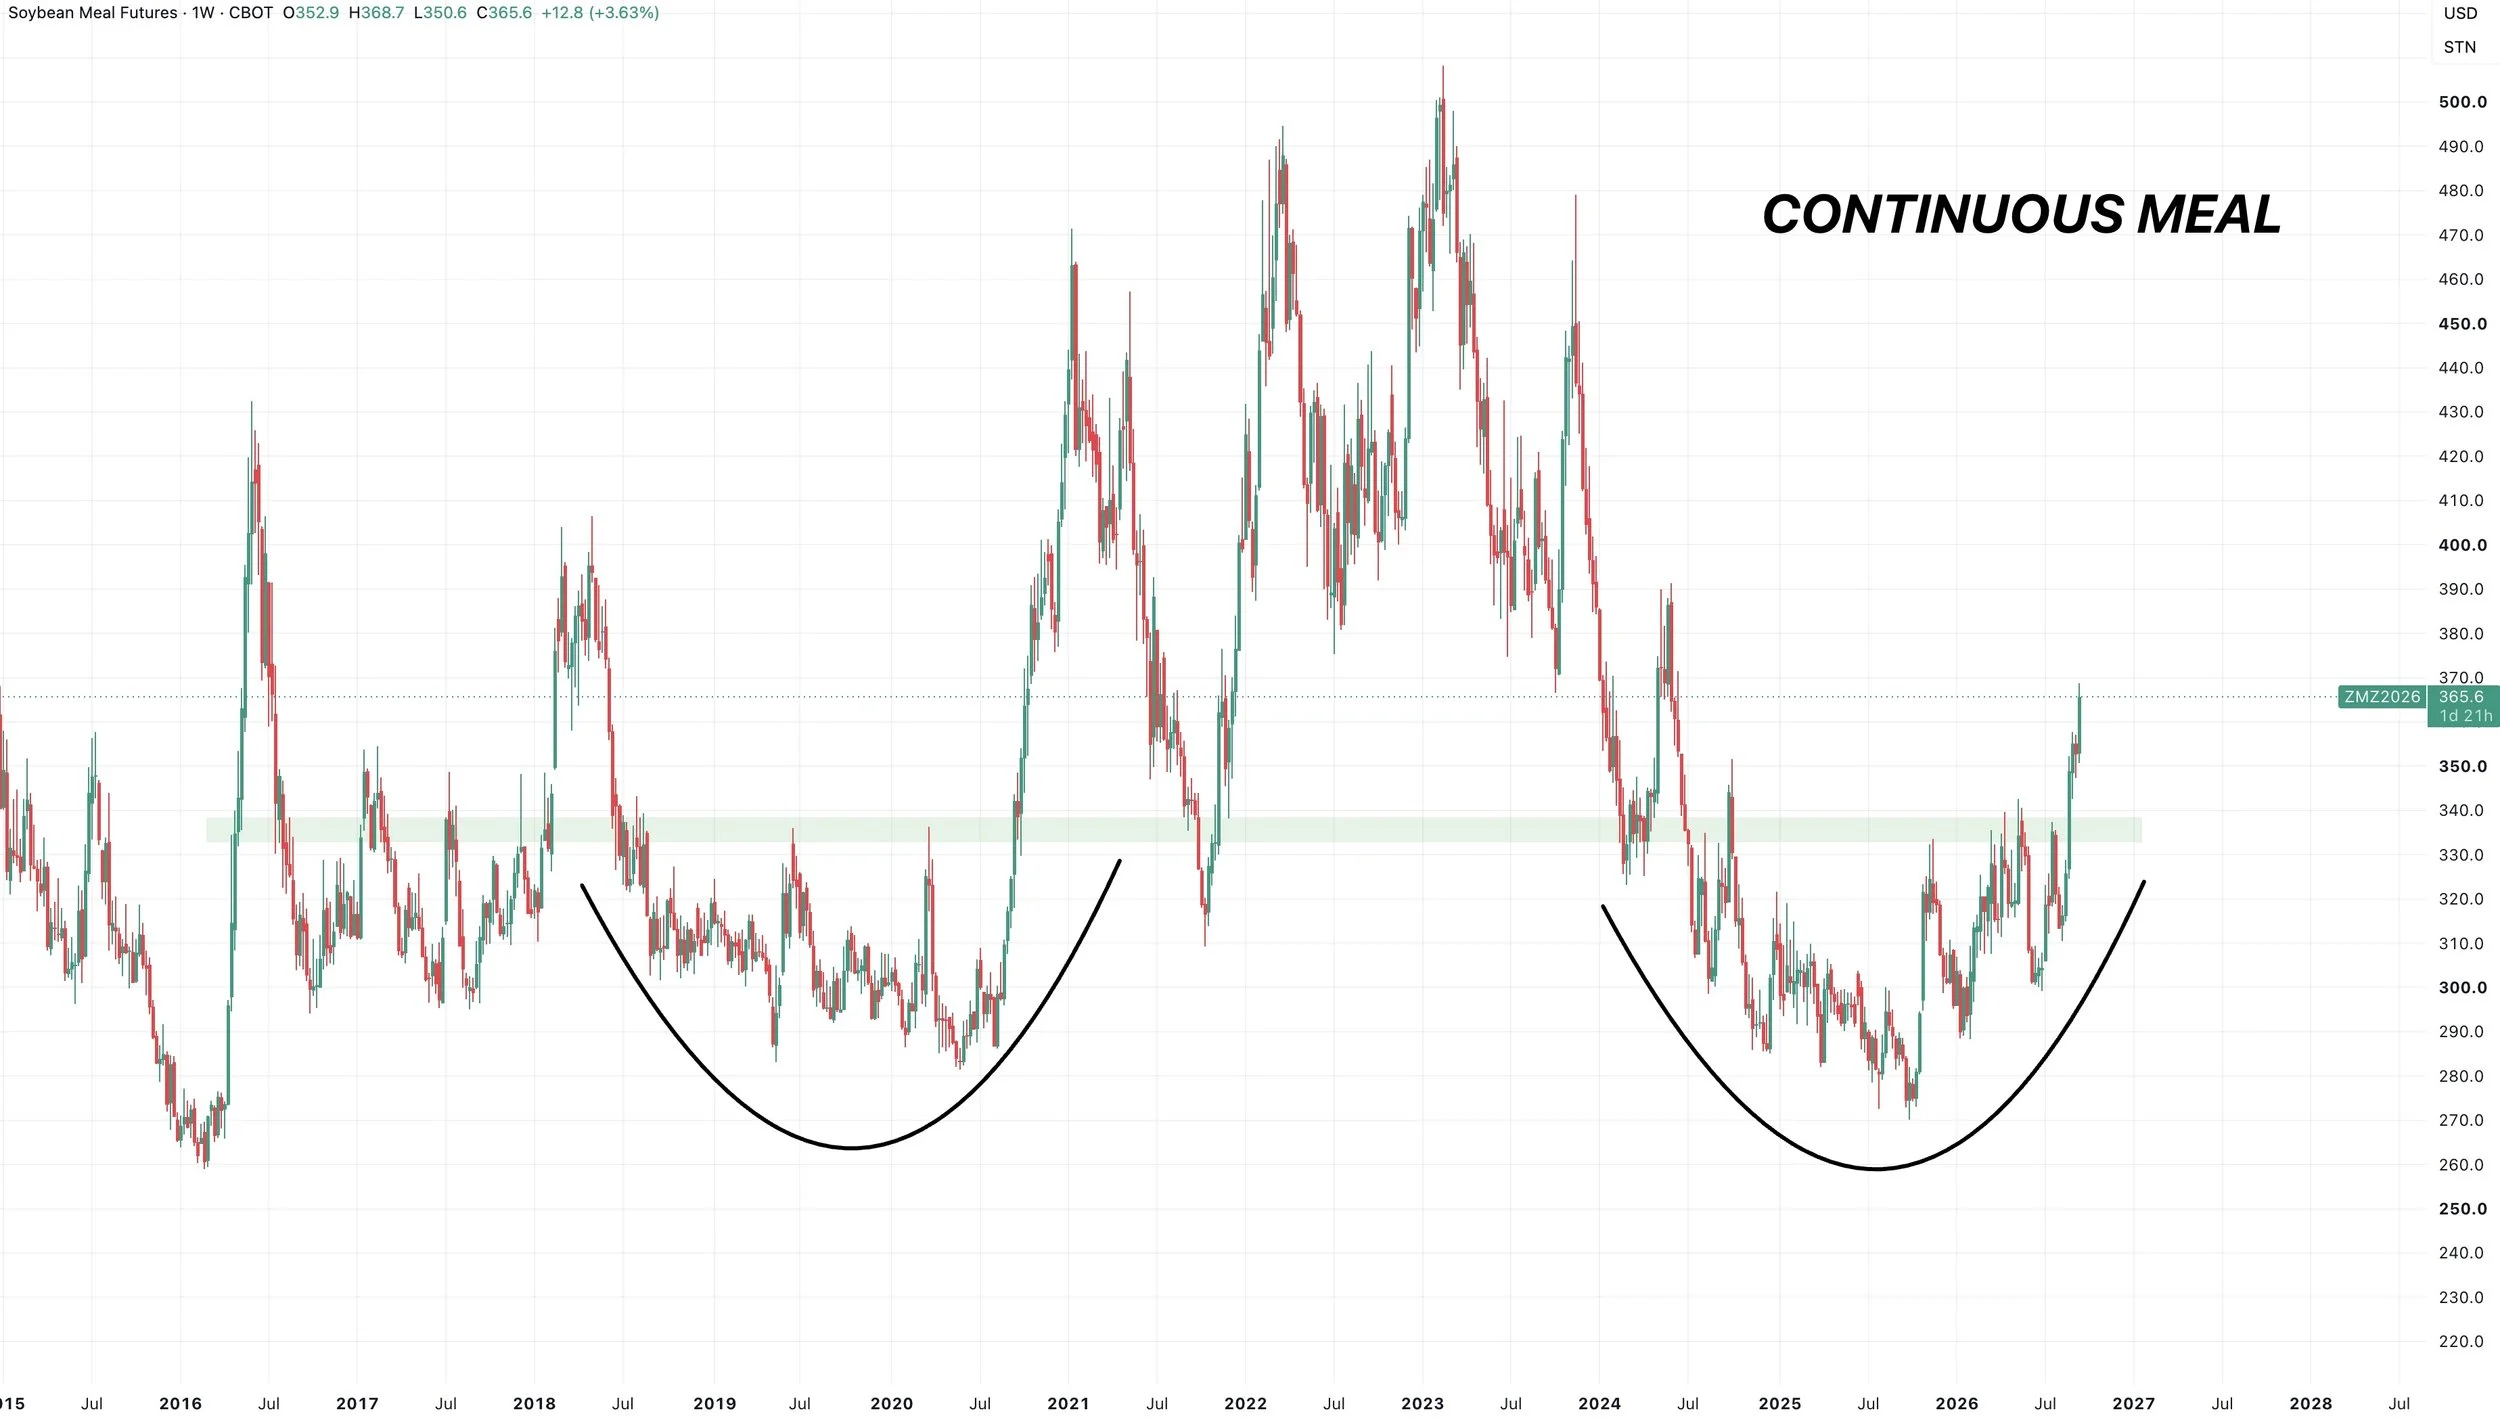
Meal is trading at it's highest levels in 2 years.
This is a pretty bullish looking chart.
We broke some major resistance that had marked several highs the last year.
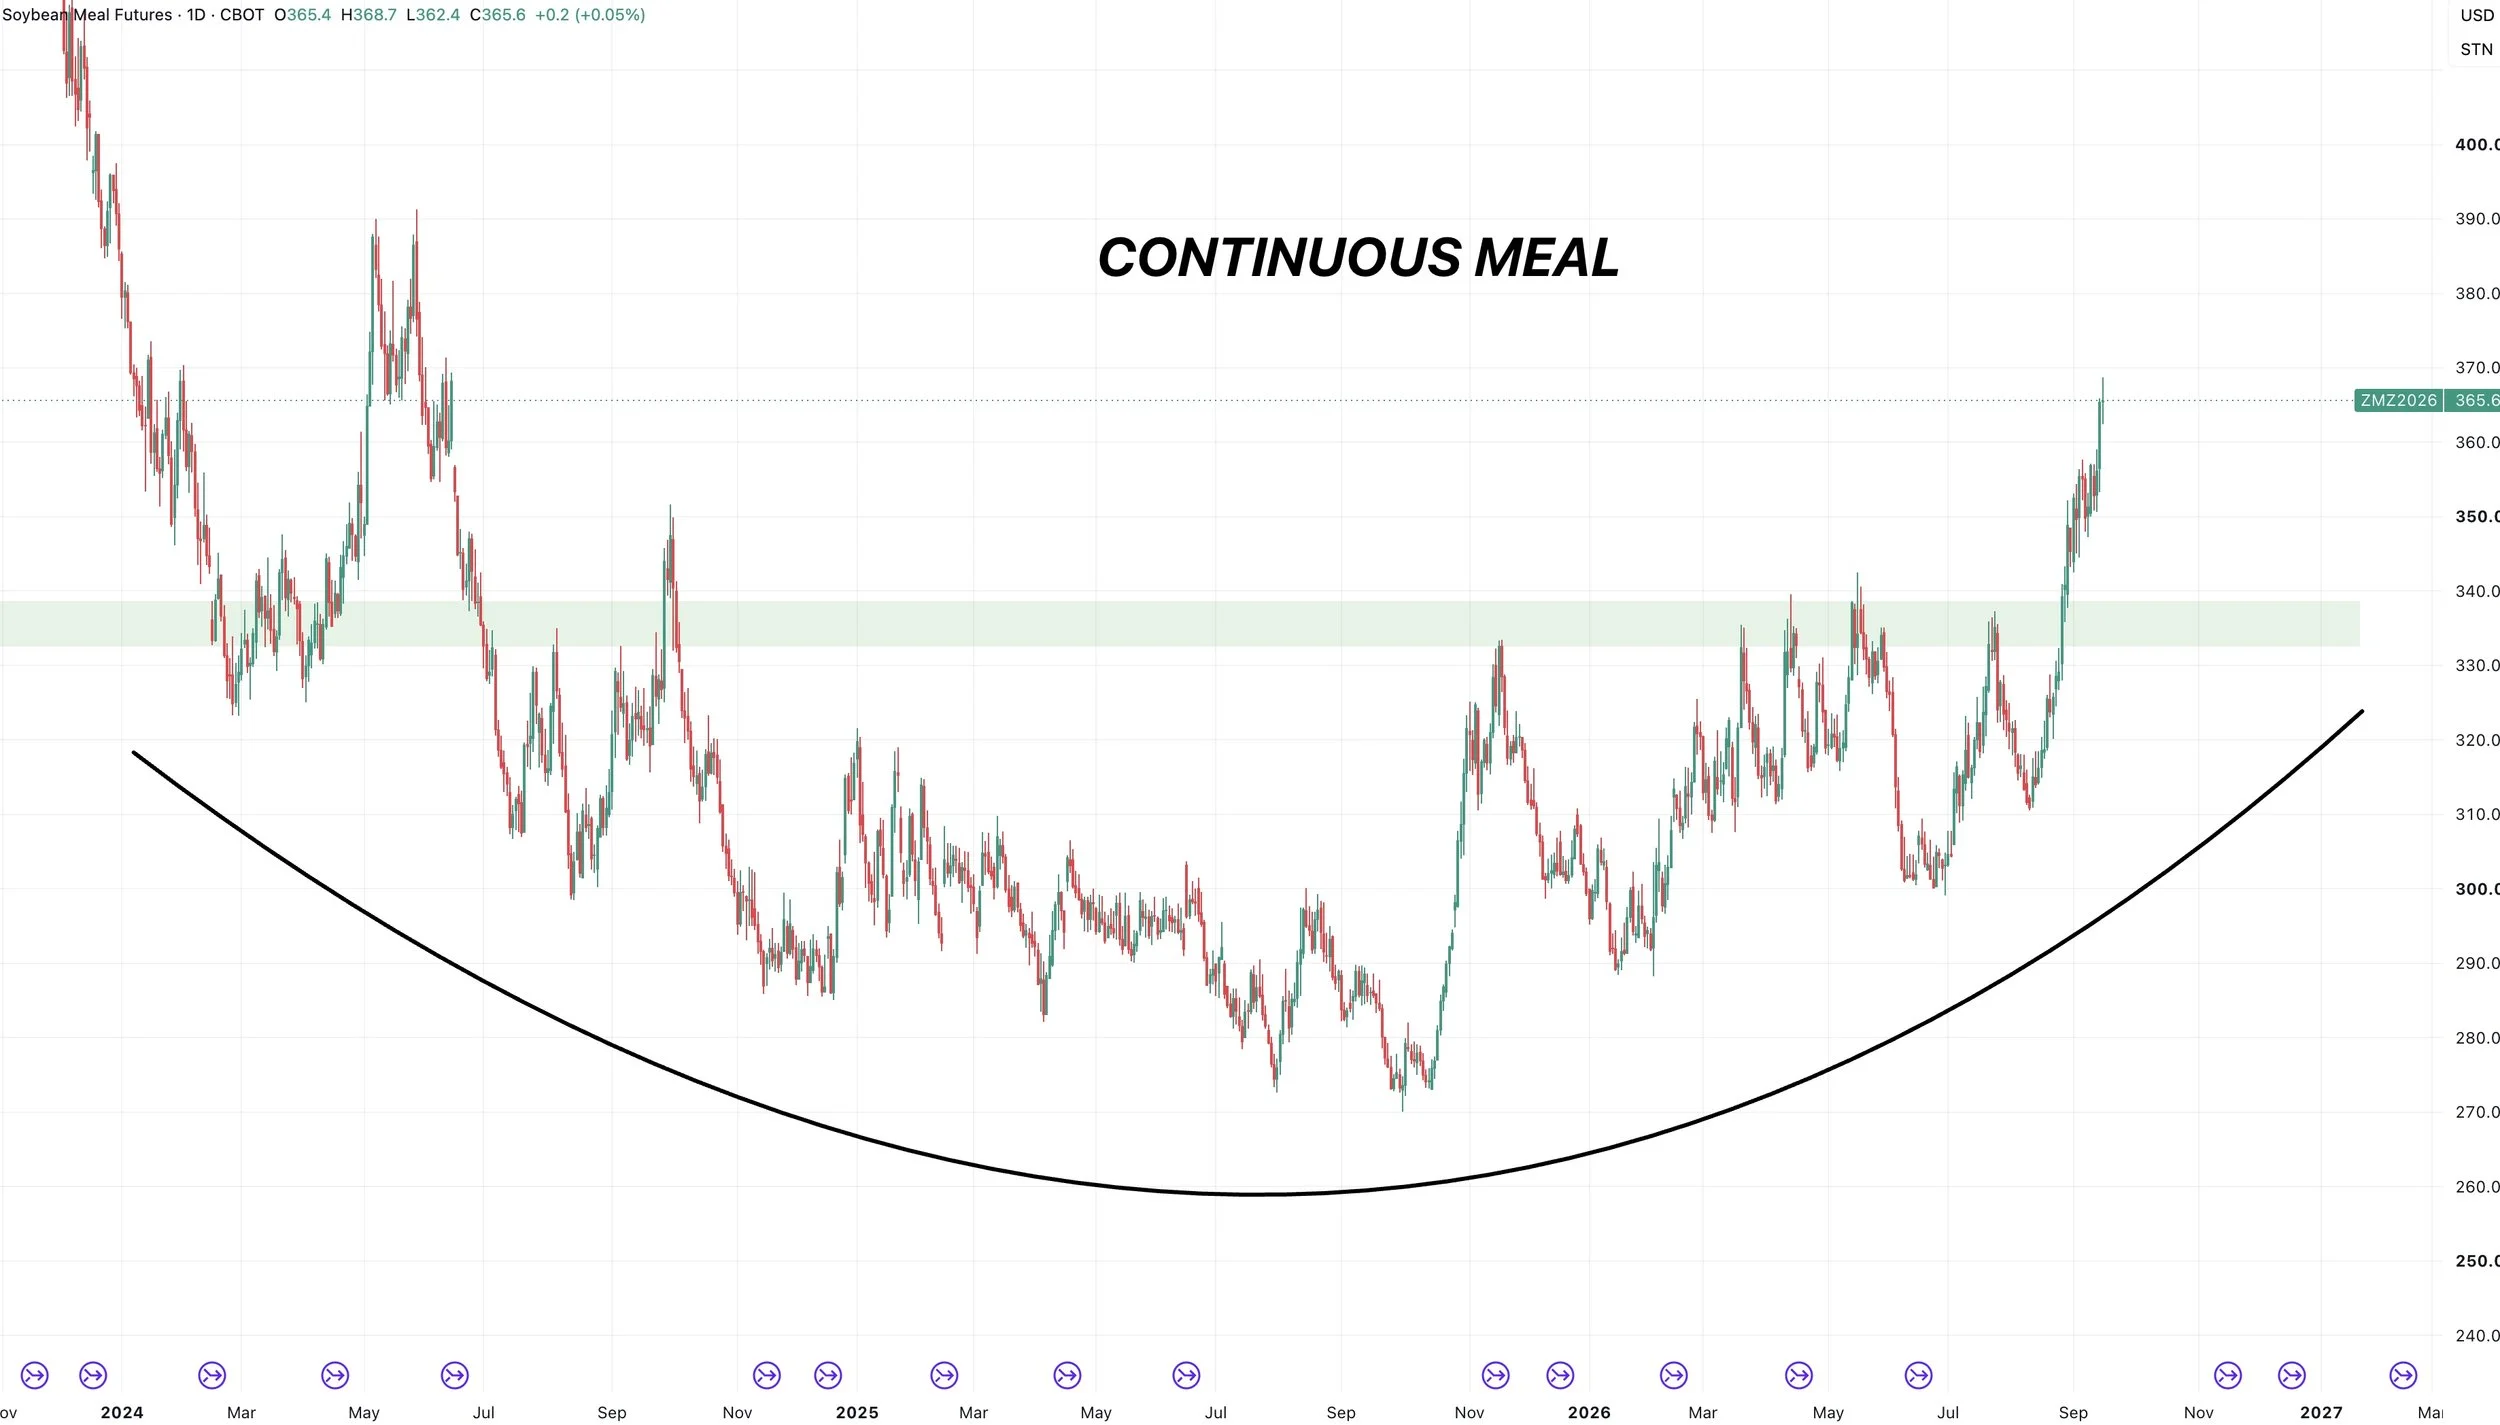
We have a nice rounded bottom, and long term it looks like this market could have room to run.
This is not bearish for soybeans.
There is an old saying that a meal-led rally is a real rally. Bean oil had the crown last year, but it might be time for meal to take the lead.
Bean Oil vs Diesel:
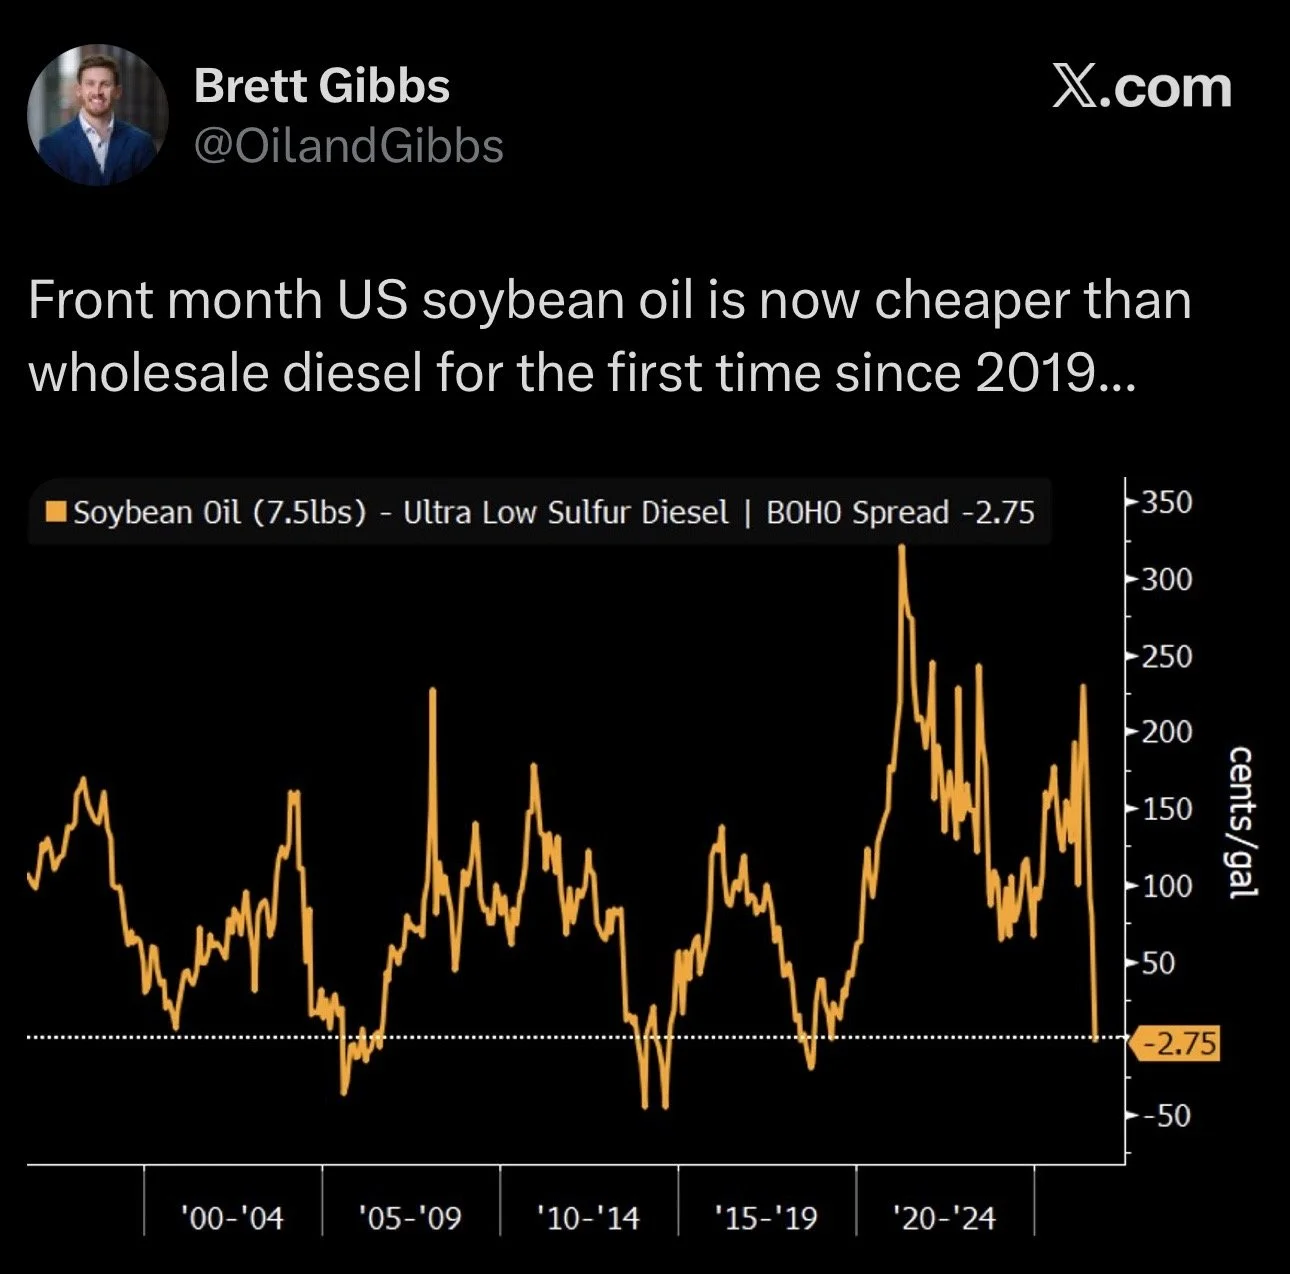
Soybean oil is the cheapest it has been relative to diesel in 6 years.
Bean oil is used to make fuel. When bean oil is cheap compared to fuel, people make more money turning it into fuel.
Which encourages them to buy more bean oil.
So this would be viewed as bullish for bean oil demand and the soybean complex.
This is why diesel reaching new all-time highs is bullish for soybeans.
Weak Seasonals?
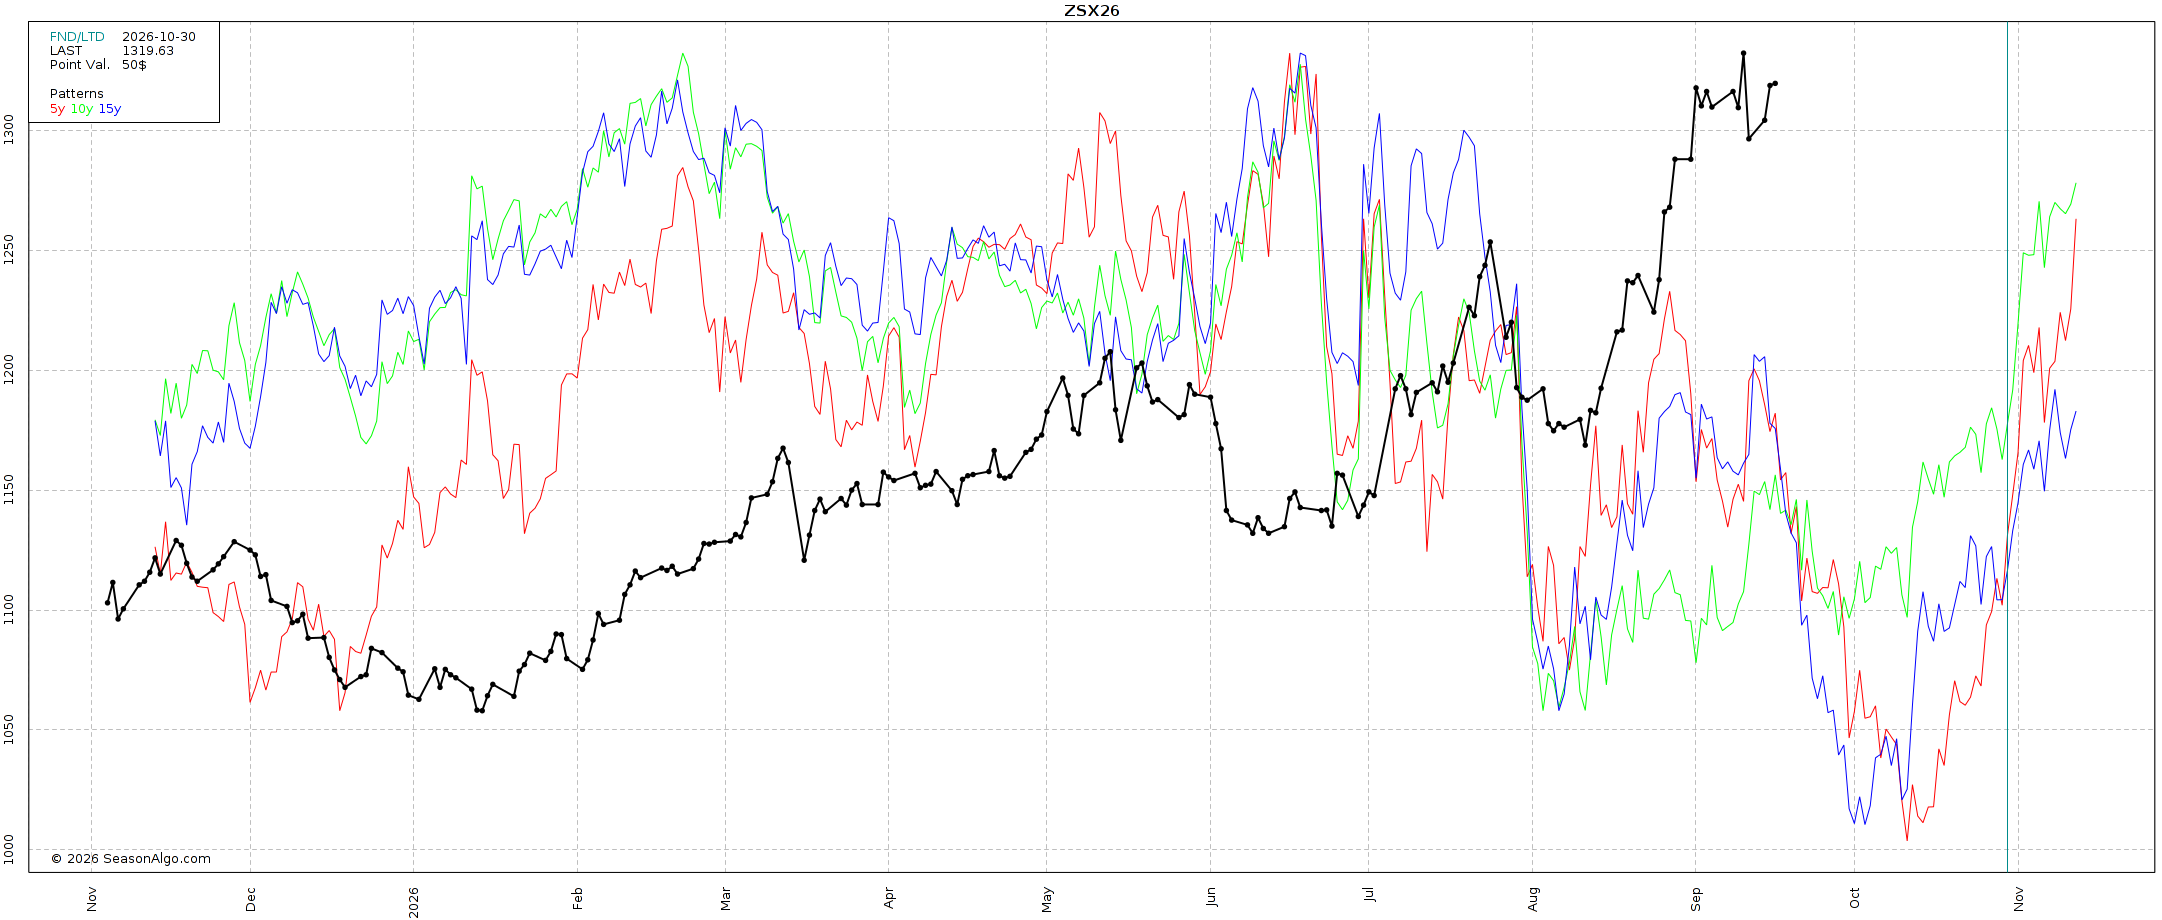
The long term trend in soybeans is clearly higher, but I did want to mention that seasonally we are entering one of the most bearish time frames of the year for soybeans.
No seasonals are not perfect. Take the corn rally heading into August this year as a perfect example of that.
However, harvest could very well add some pressure to soybeans. As many farmers opt to sell plenty of beans off the combine, we are sitting up near contract highs.
Something we just want to be mindful of here short term, especially if you have to move stuff off the combine.
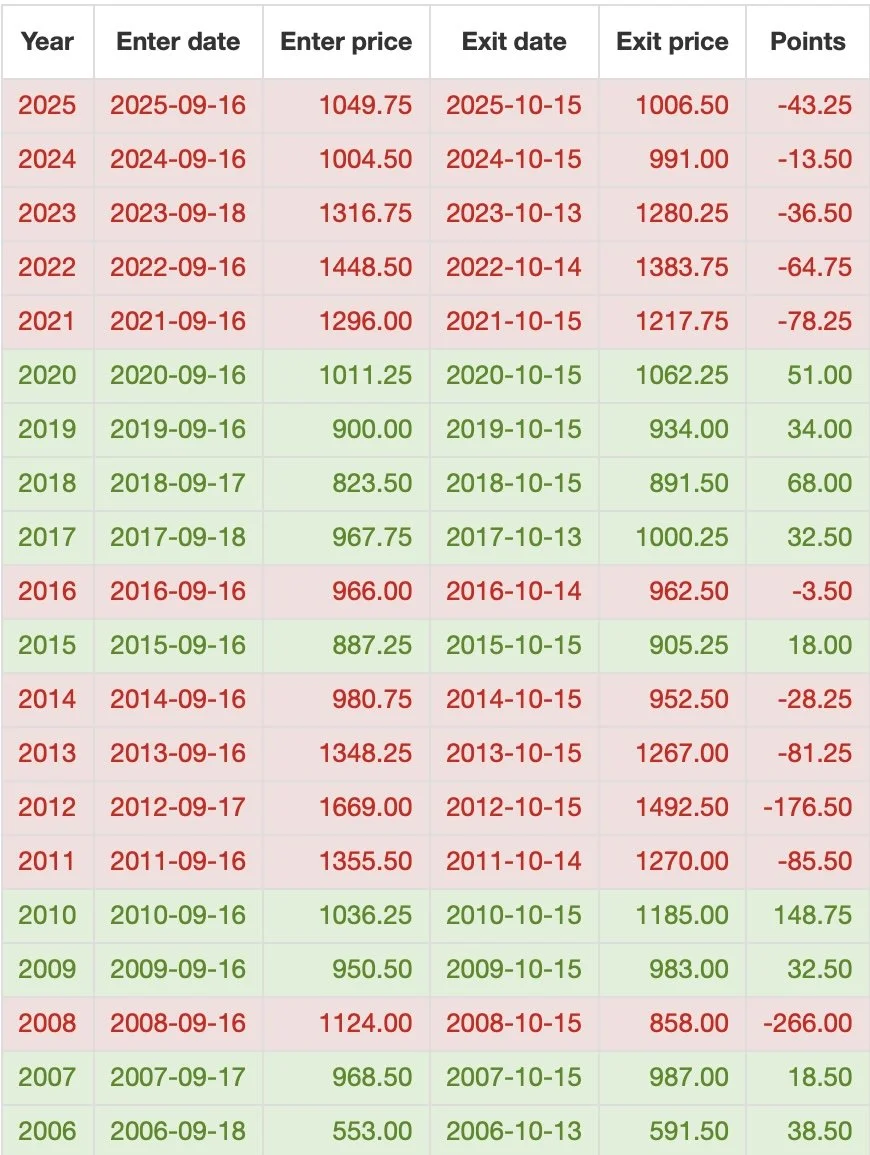
Here is soybeans performance over the last 20 years for the next 30 days.
We have been lower 5 years in a row.
Lower the last 10 of 15 years.
However, we've only been lower the last 11 of 20 years.
Something to note.
Soybean Charts
Nov Beans Chart:
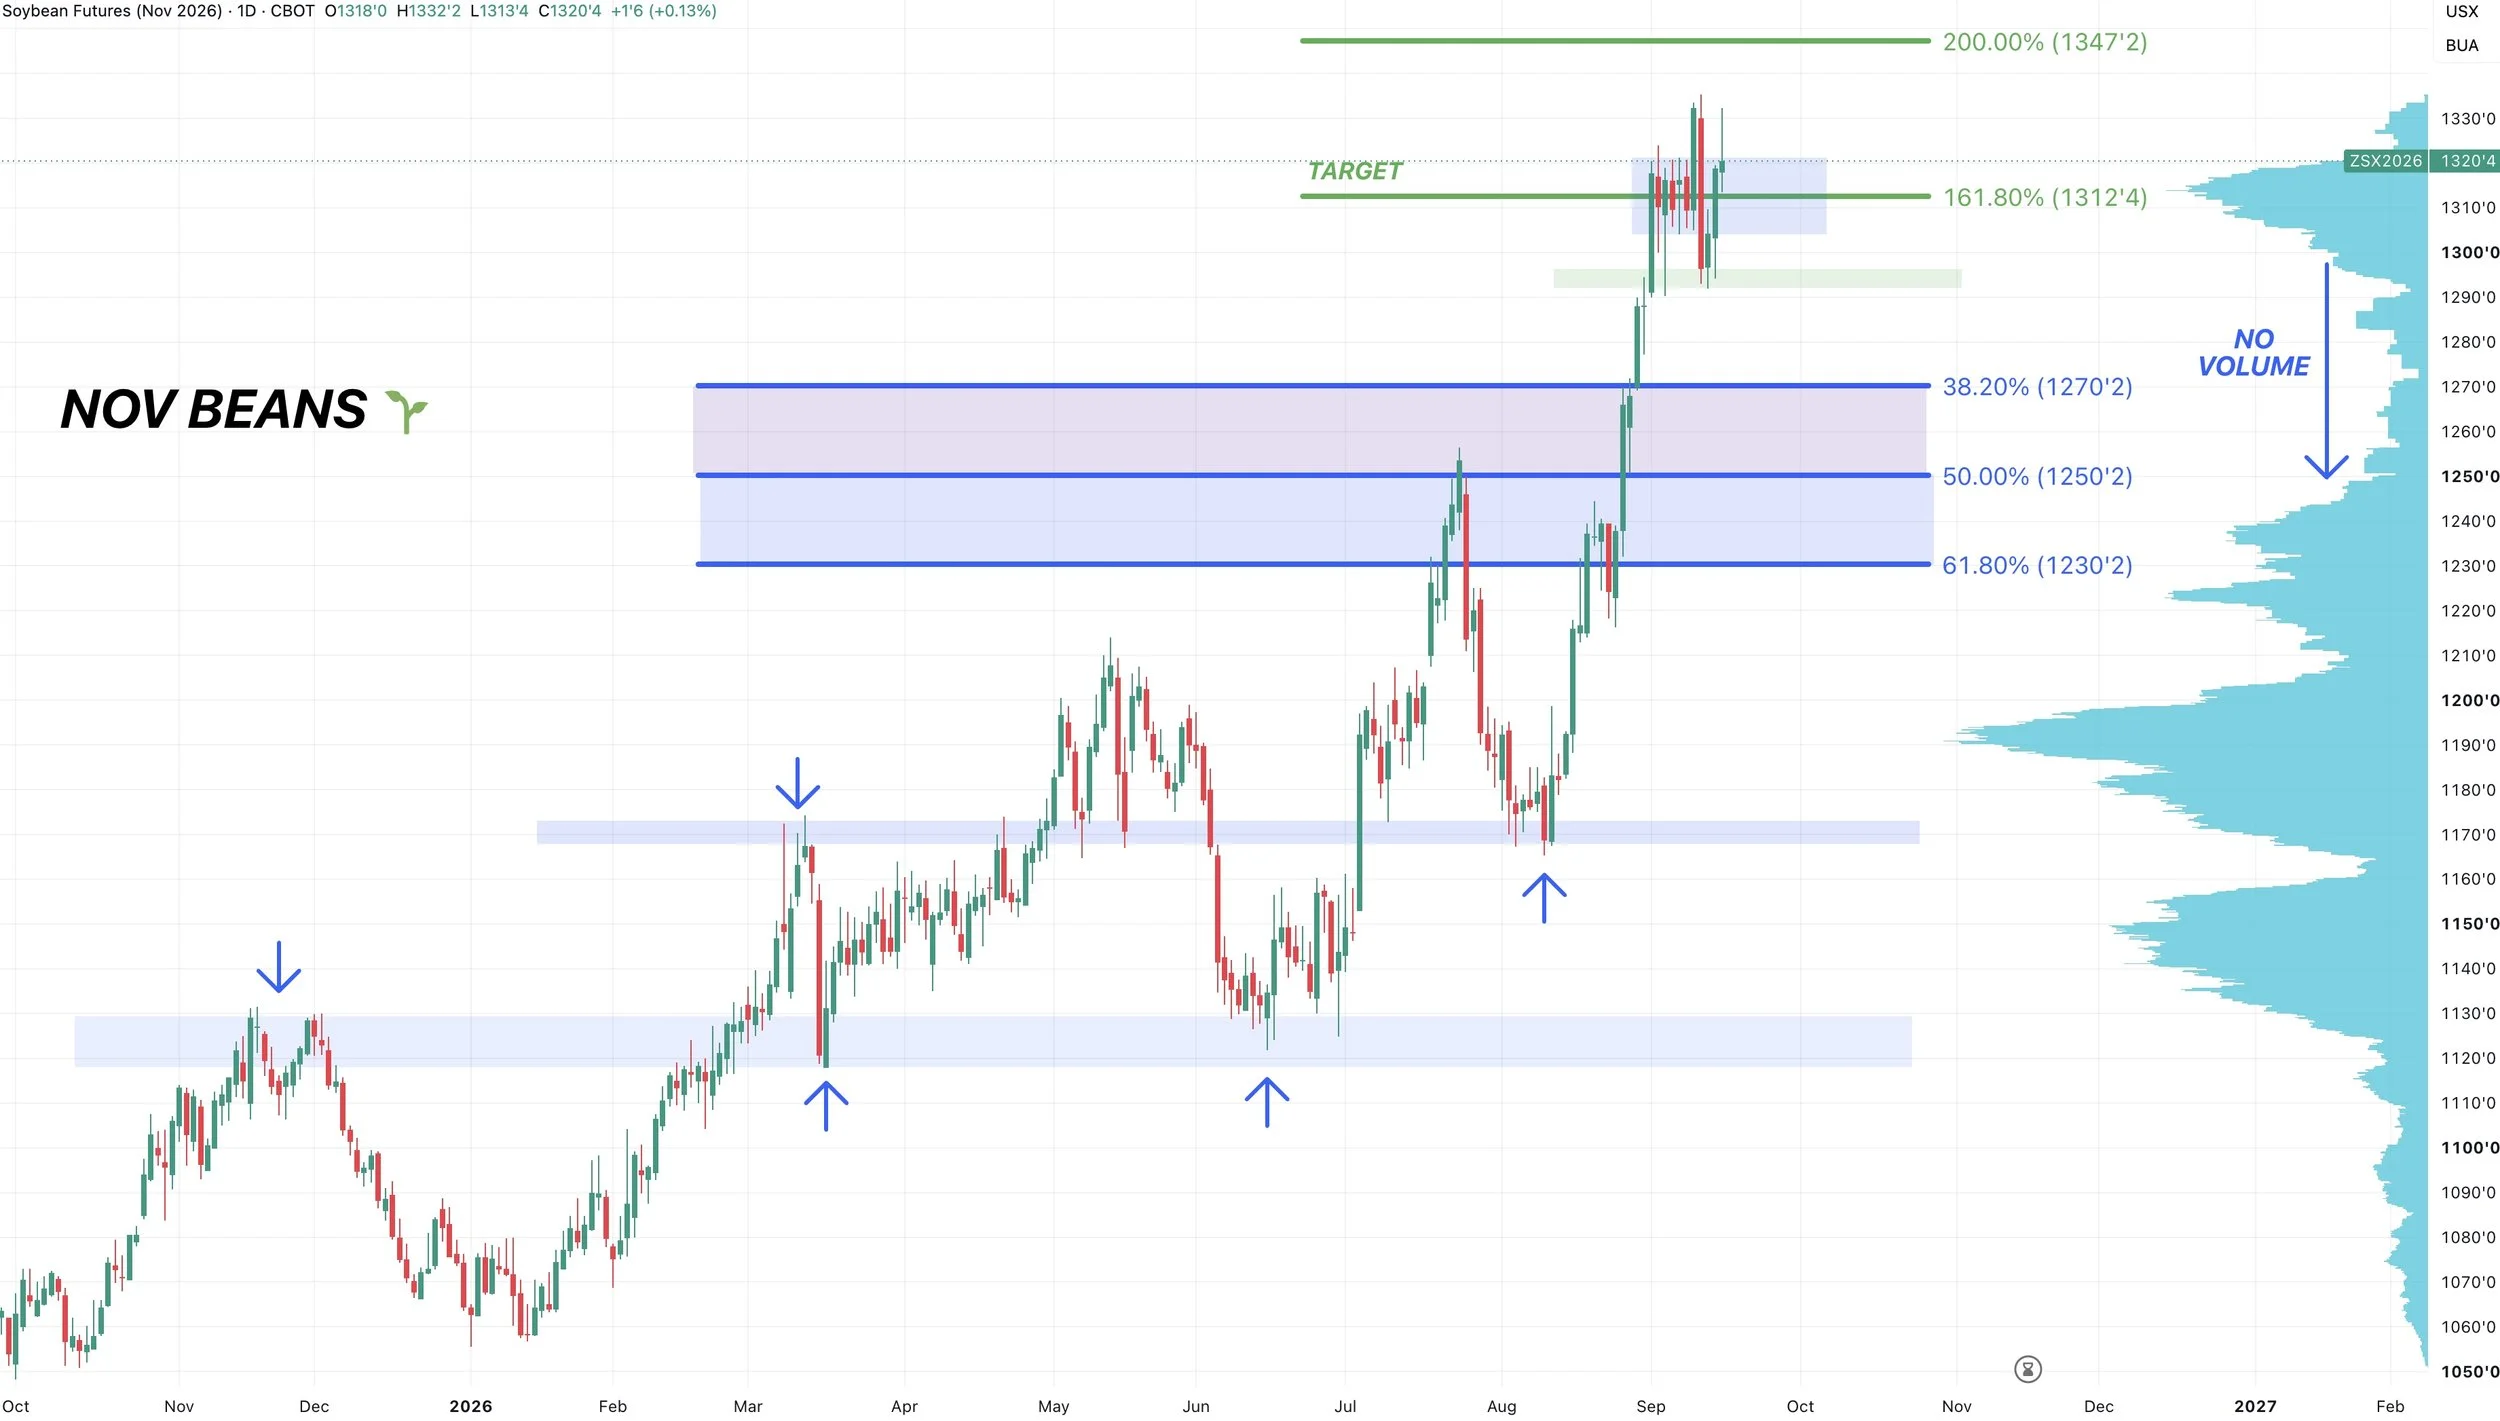
Soybeans have been a complete whipsaw the last few weeks.
We had the fake out to the upside, then the fake out to the downside, trading completely sideways in this range all of September now.
We have yet to take out the highs or the lows from the USDA report day, so essentially in no mans land. Which ever way we break first, likely gives us the next leg.
We had a poor close today, so we will see how we follow it up.
We don’t have to get a pullback, but similar to corn, I am still cautious up here and would not be surprised to see one.
Ultimately, bulls want to hold those recent lows. If we fail to do so, there is zero volume or support beneath here. So it could spark a good leg lower. Potentially towards $12.50 to $12.70.
Which would give back 38.2% to 50% of the rally from August. Which would line up with turning those old highs into our new floor.
That is something the soybean market has a strong tendency to do.
The August lows came in at the March highs.
The June and March lows came in at the November highs.
Monthly Chart:
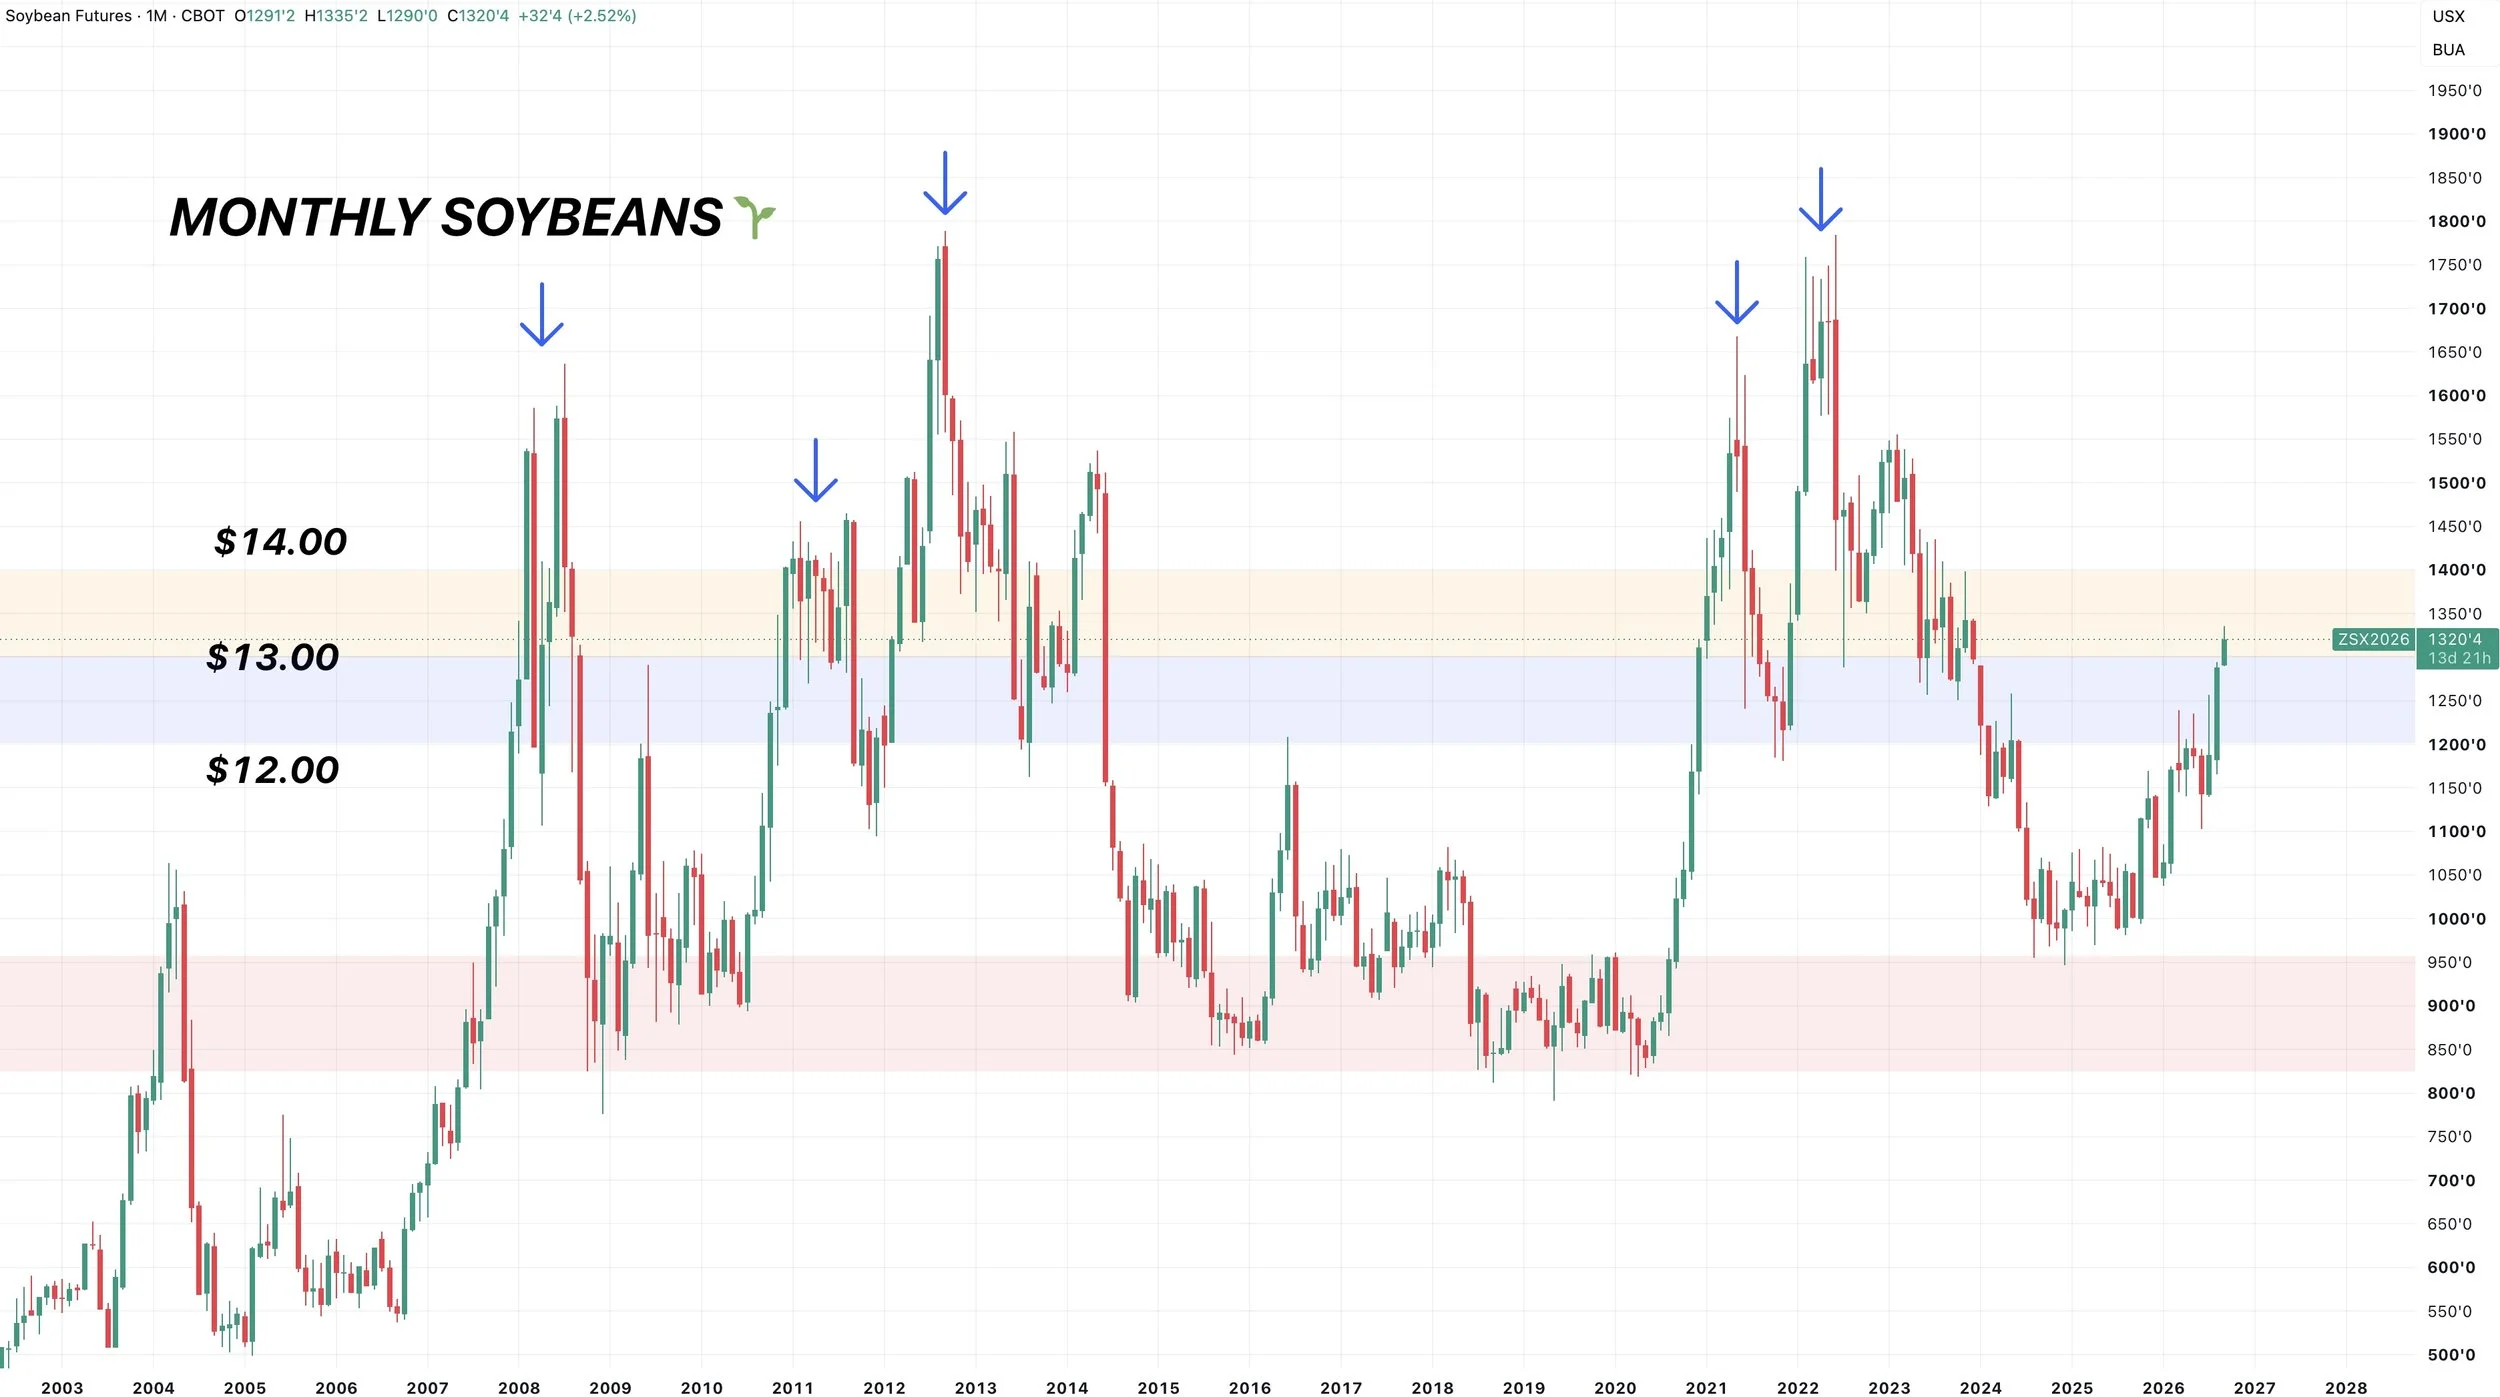
Whether we pull back first or not, I think soybeans ultimately have a very strong shot at seeing $14.00 eventually.
As I've mentioned before, every monthly close above $12.00, let alone a close above $13.00, has eventually led to $14.00 or higher.
Wheat
Dec KC Chart:
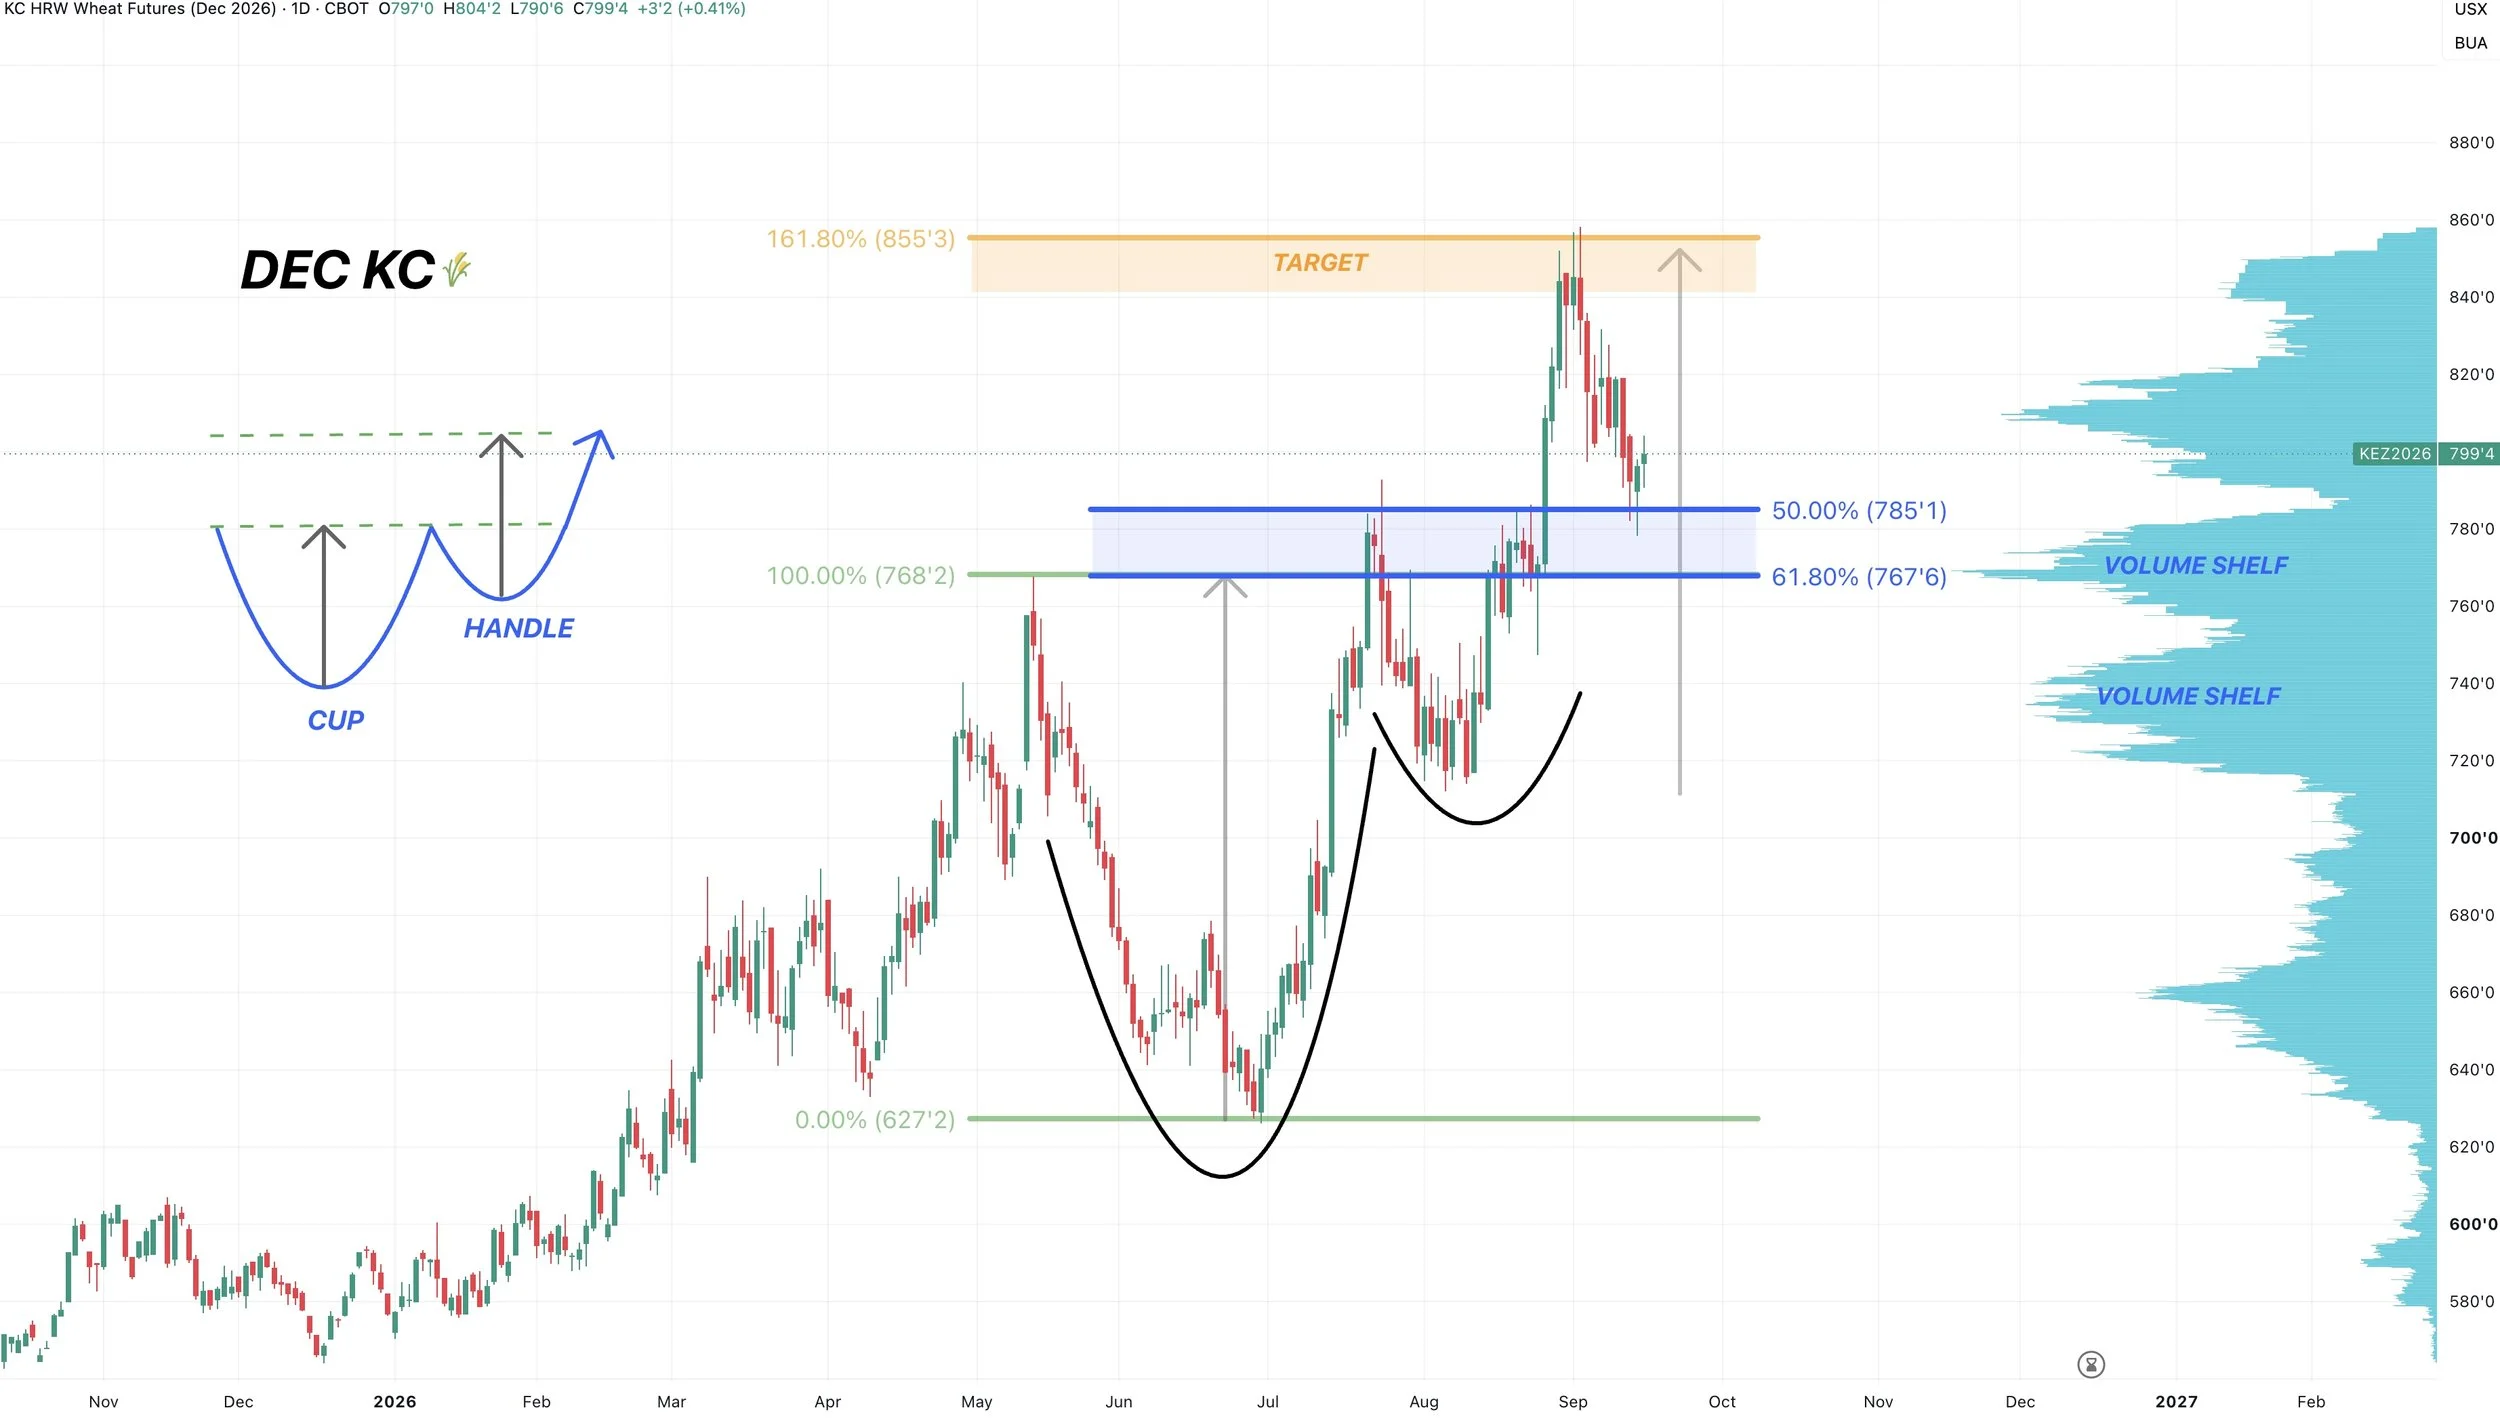
Nothing too crazy to update here.
The market seems to have forgotten about the Black Sea story, but it hasn’t gone away. I do not think we've seen the last of the impacts that could have down the road.
But for now, wheat is getting close to where we would expect us to find a bottom.
We tagged that golden zone. Which gave back 50% to 61.8% of the rally from June.
That same area is those previous highs which can act as new support.
There is also a massive shelf of volume sitting right at this golden zone.
The lows may not be in yet, but this box is where I would expect us to find a bottom.
The outlook favors a continuation of higher prices unless we break below the 61.8% level at $7.68
Possible Target:
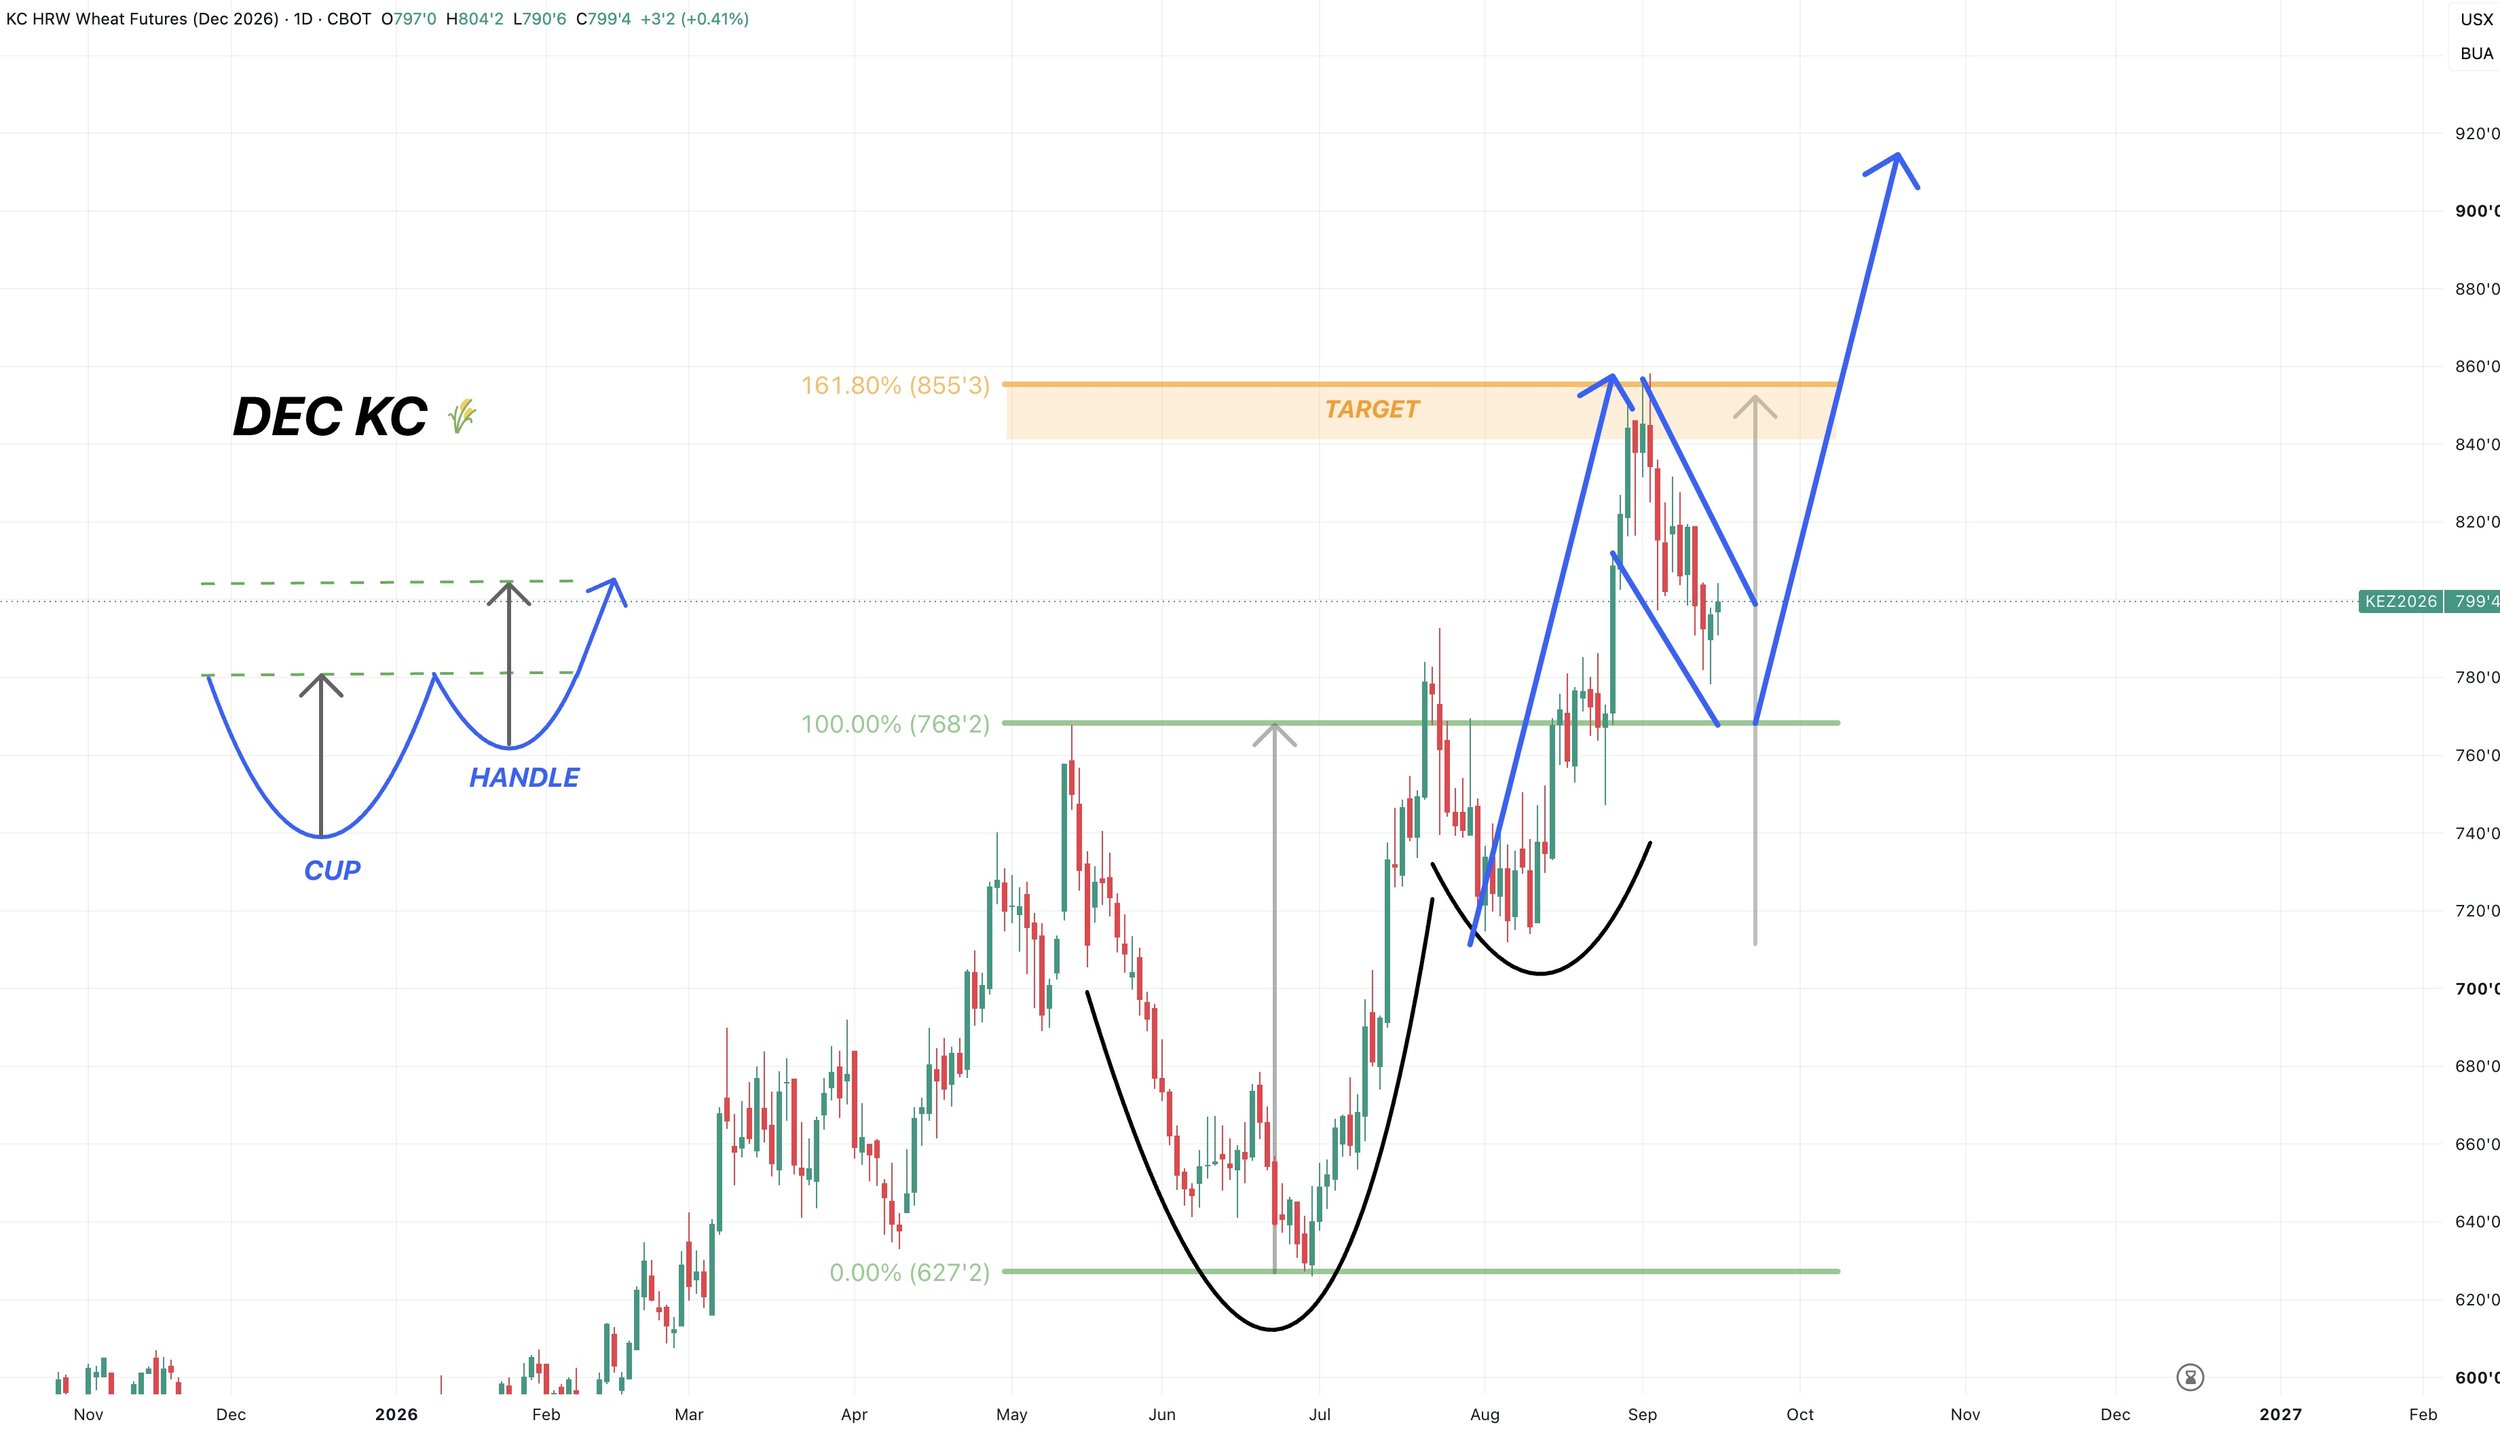
We rejected that first target right where we had that sell signal.
That target was the golden fib and implied move from the cup and handle.
We now have somewhat of a bull flag pattern going on here now.
The implied move for this would take us to $9.00 or slightly higher.
I'll have some next exact targets out once I feel like we've carved out a bottom.
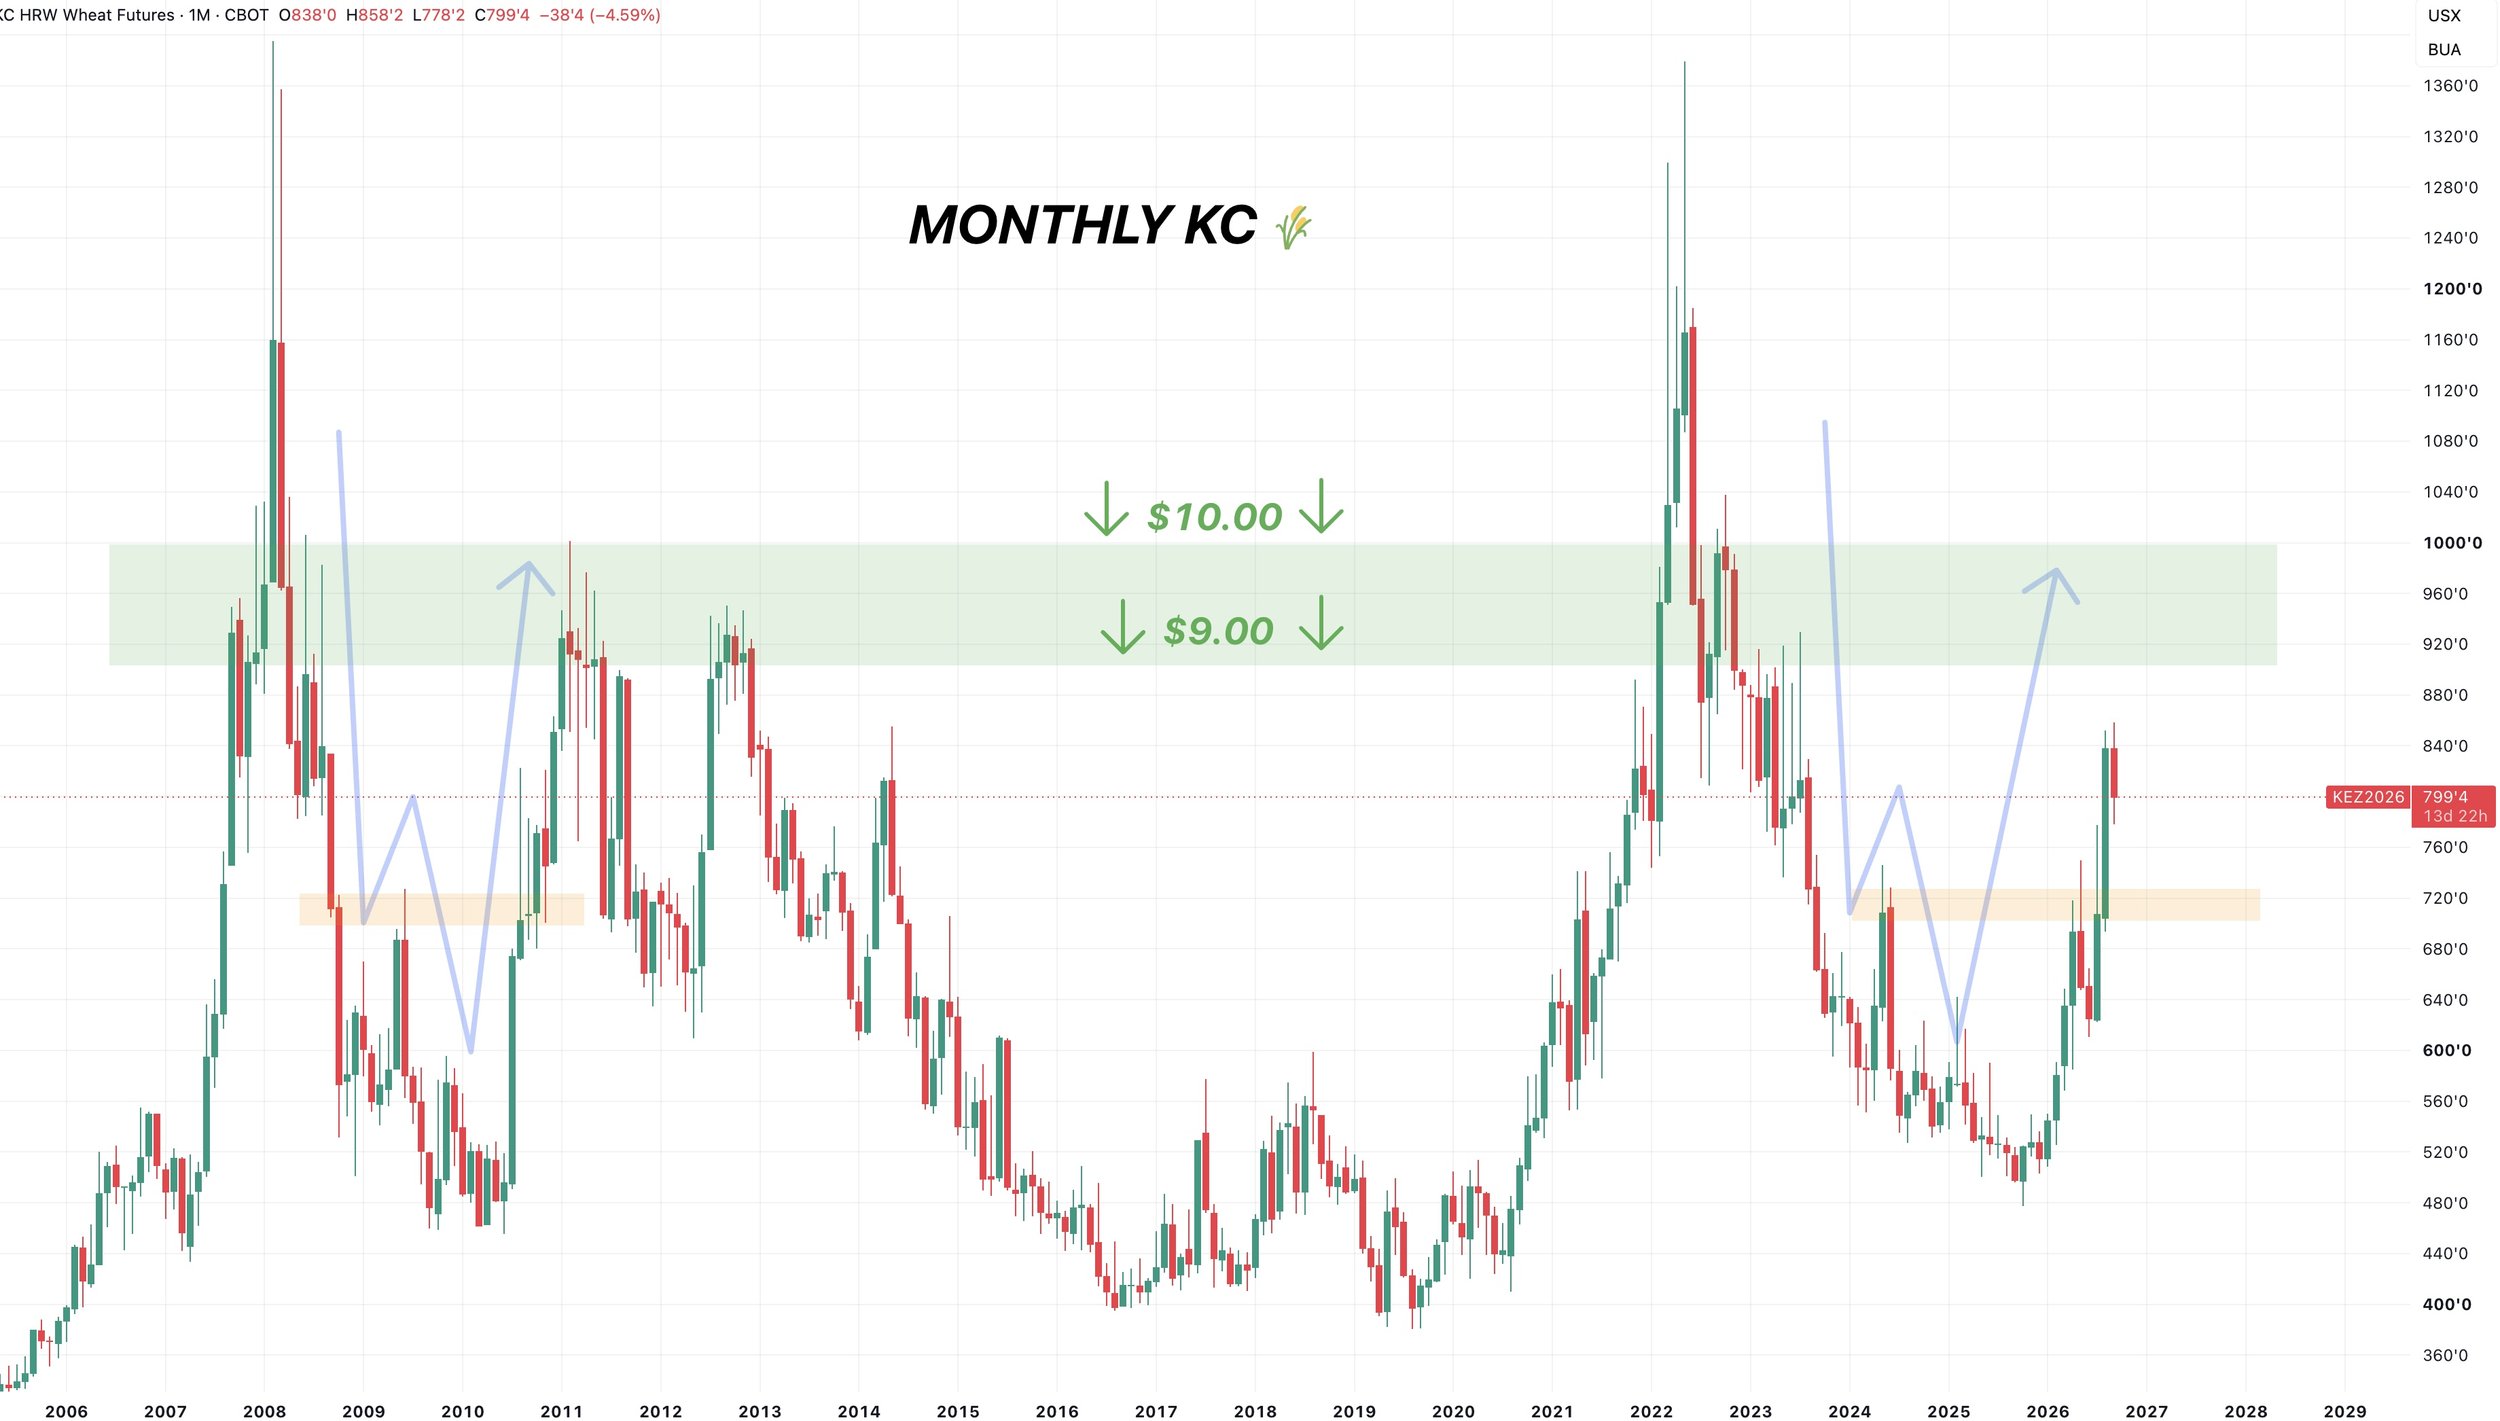
Monthly Chart:
The big picture chart is of course still very bullish despite the pullback.
Like we've talked about a lot recently, every single major rally in wheat has seen at least $9.00 wheat.
Another reason to think this market still has potential.
But between $9.00 to $10.00 is probably where you want to get super aggressive.
2008 and 2022 are the only two years we've traded higher than that. Both lasted for a grand total of 4 months above that box.
Dec Chicago Wheat:
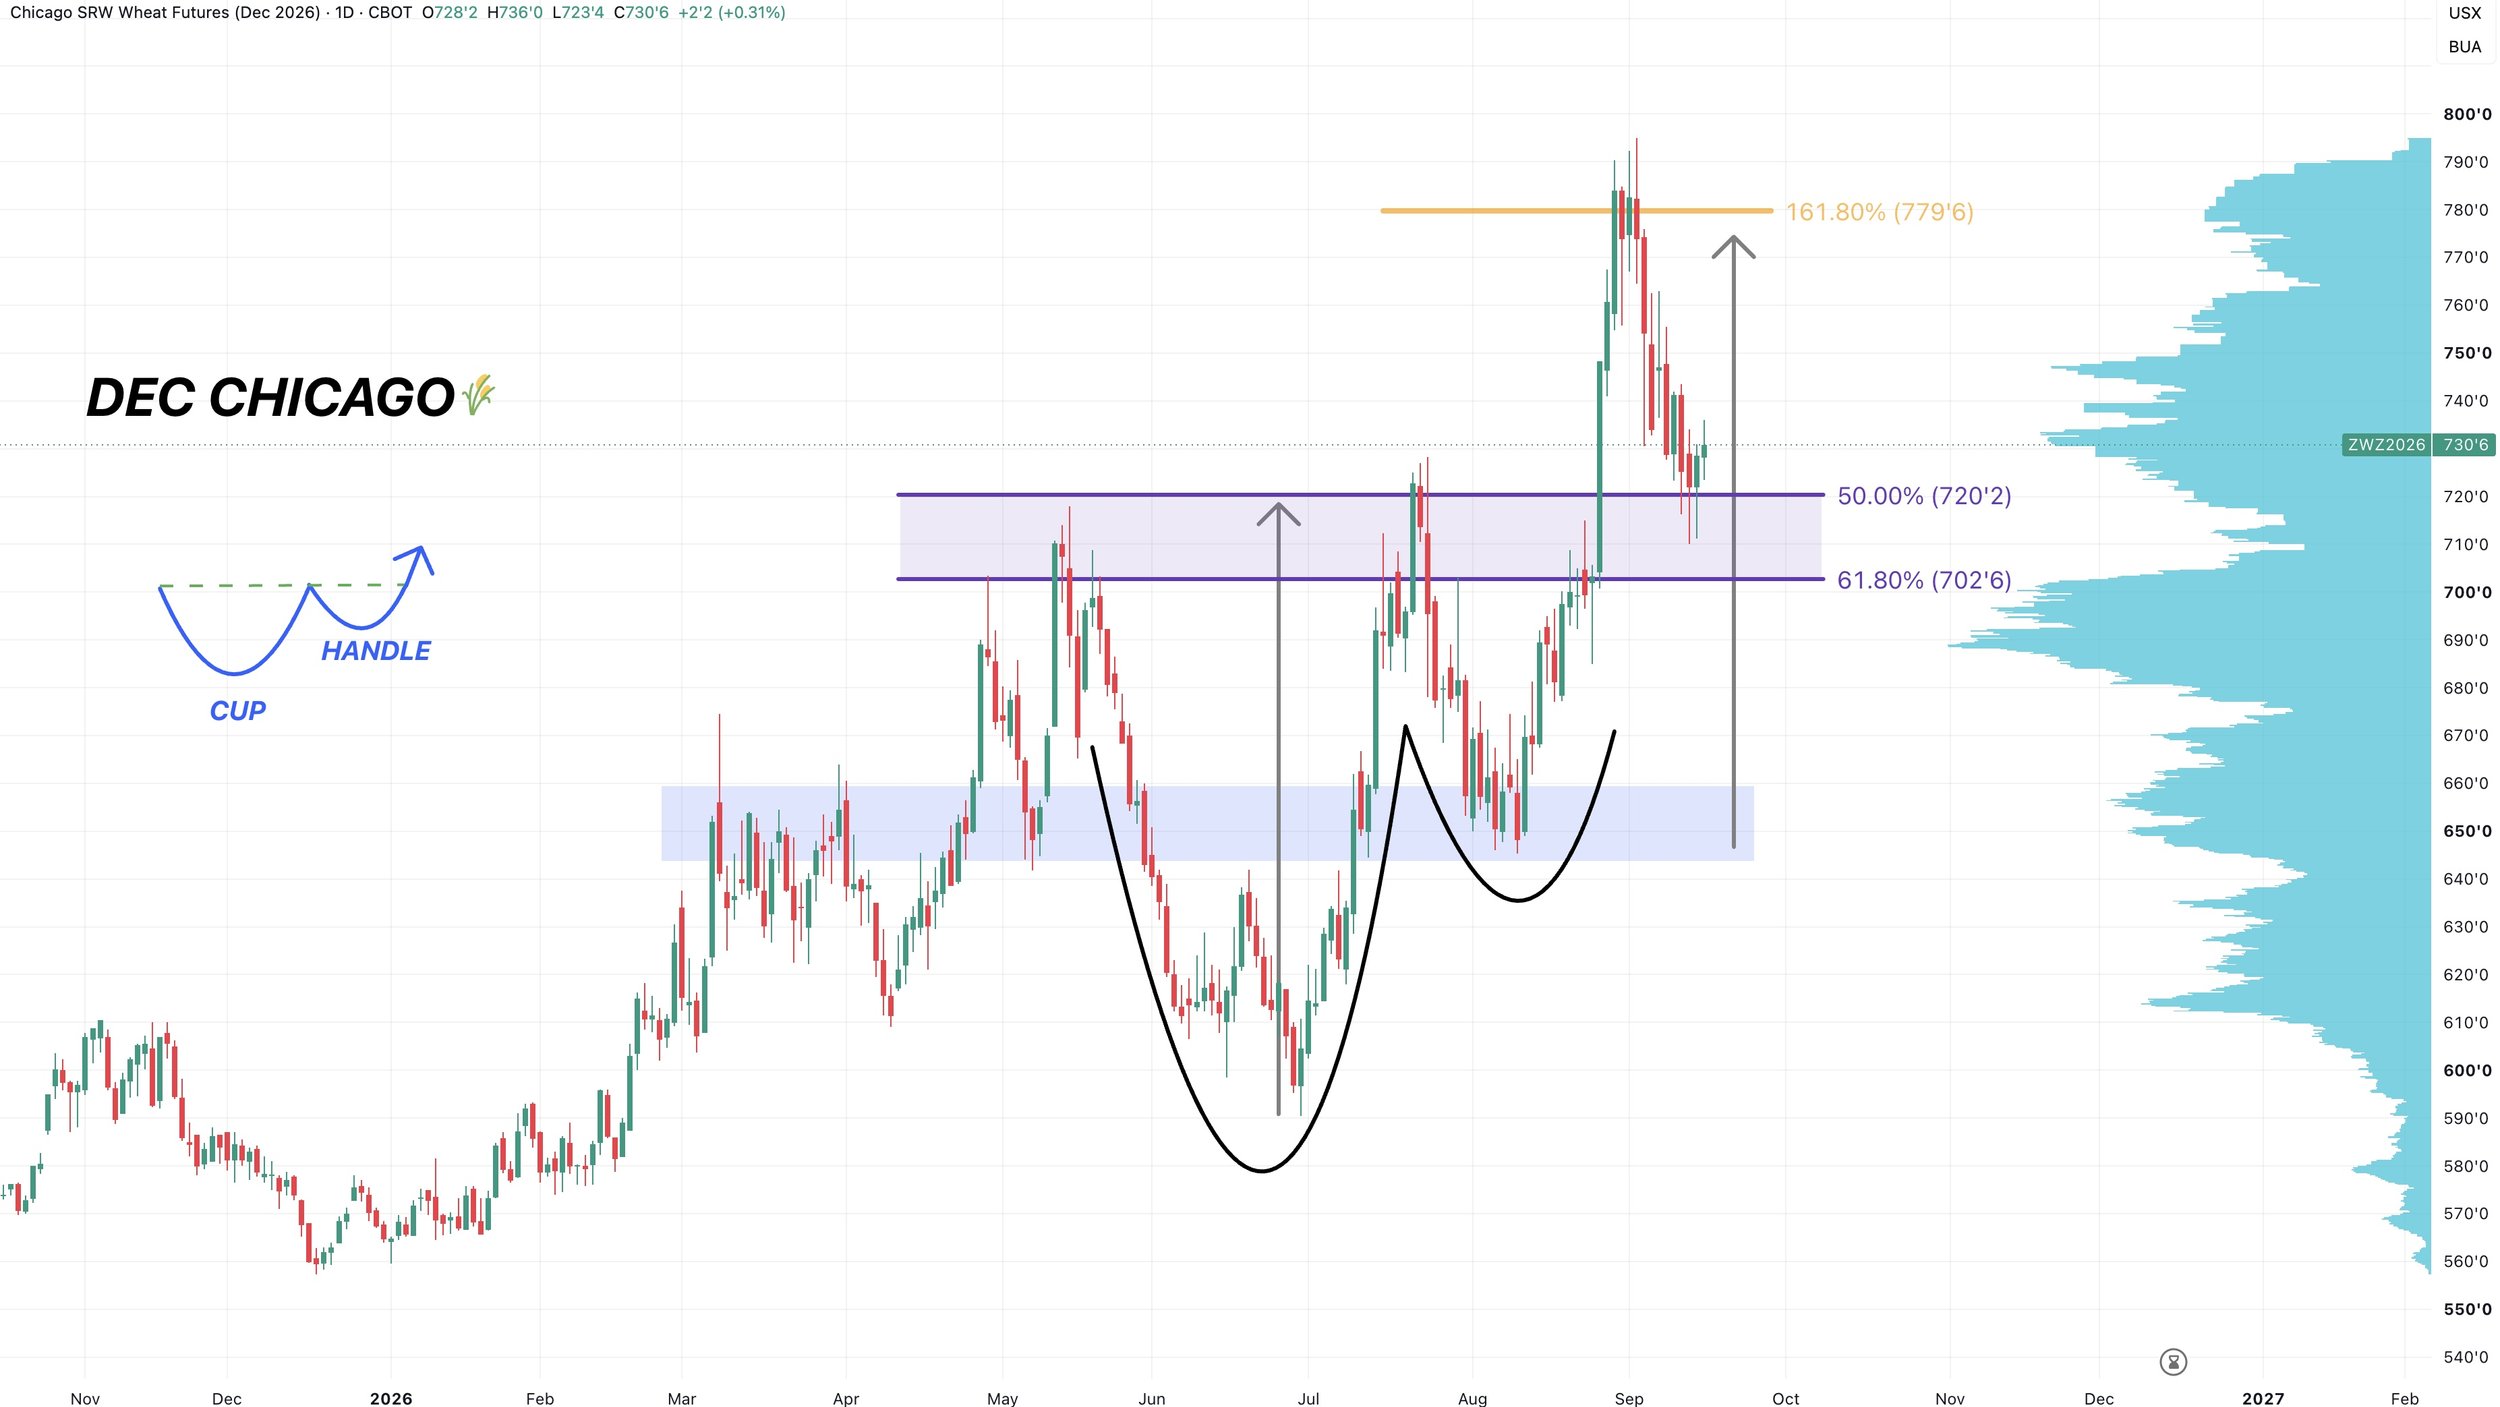
Nothing to update here either.
We have officially came down into this golden zone which is the area we've been looking for wheat to come down to before finding a bottom.
This same level is the prior highs, so this box is where we'd expect to find a bottom.
Cattle
Oct Live Chart:
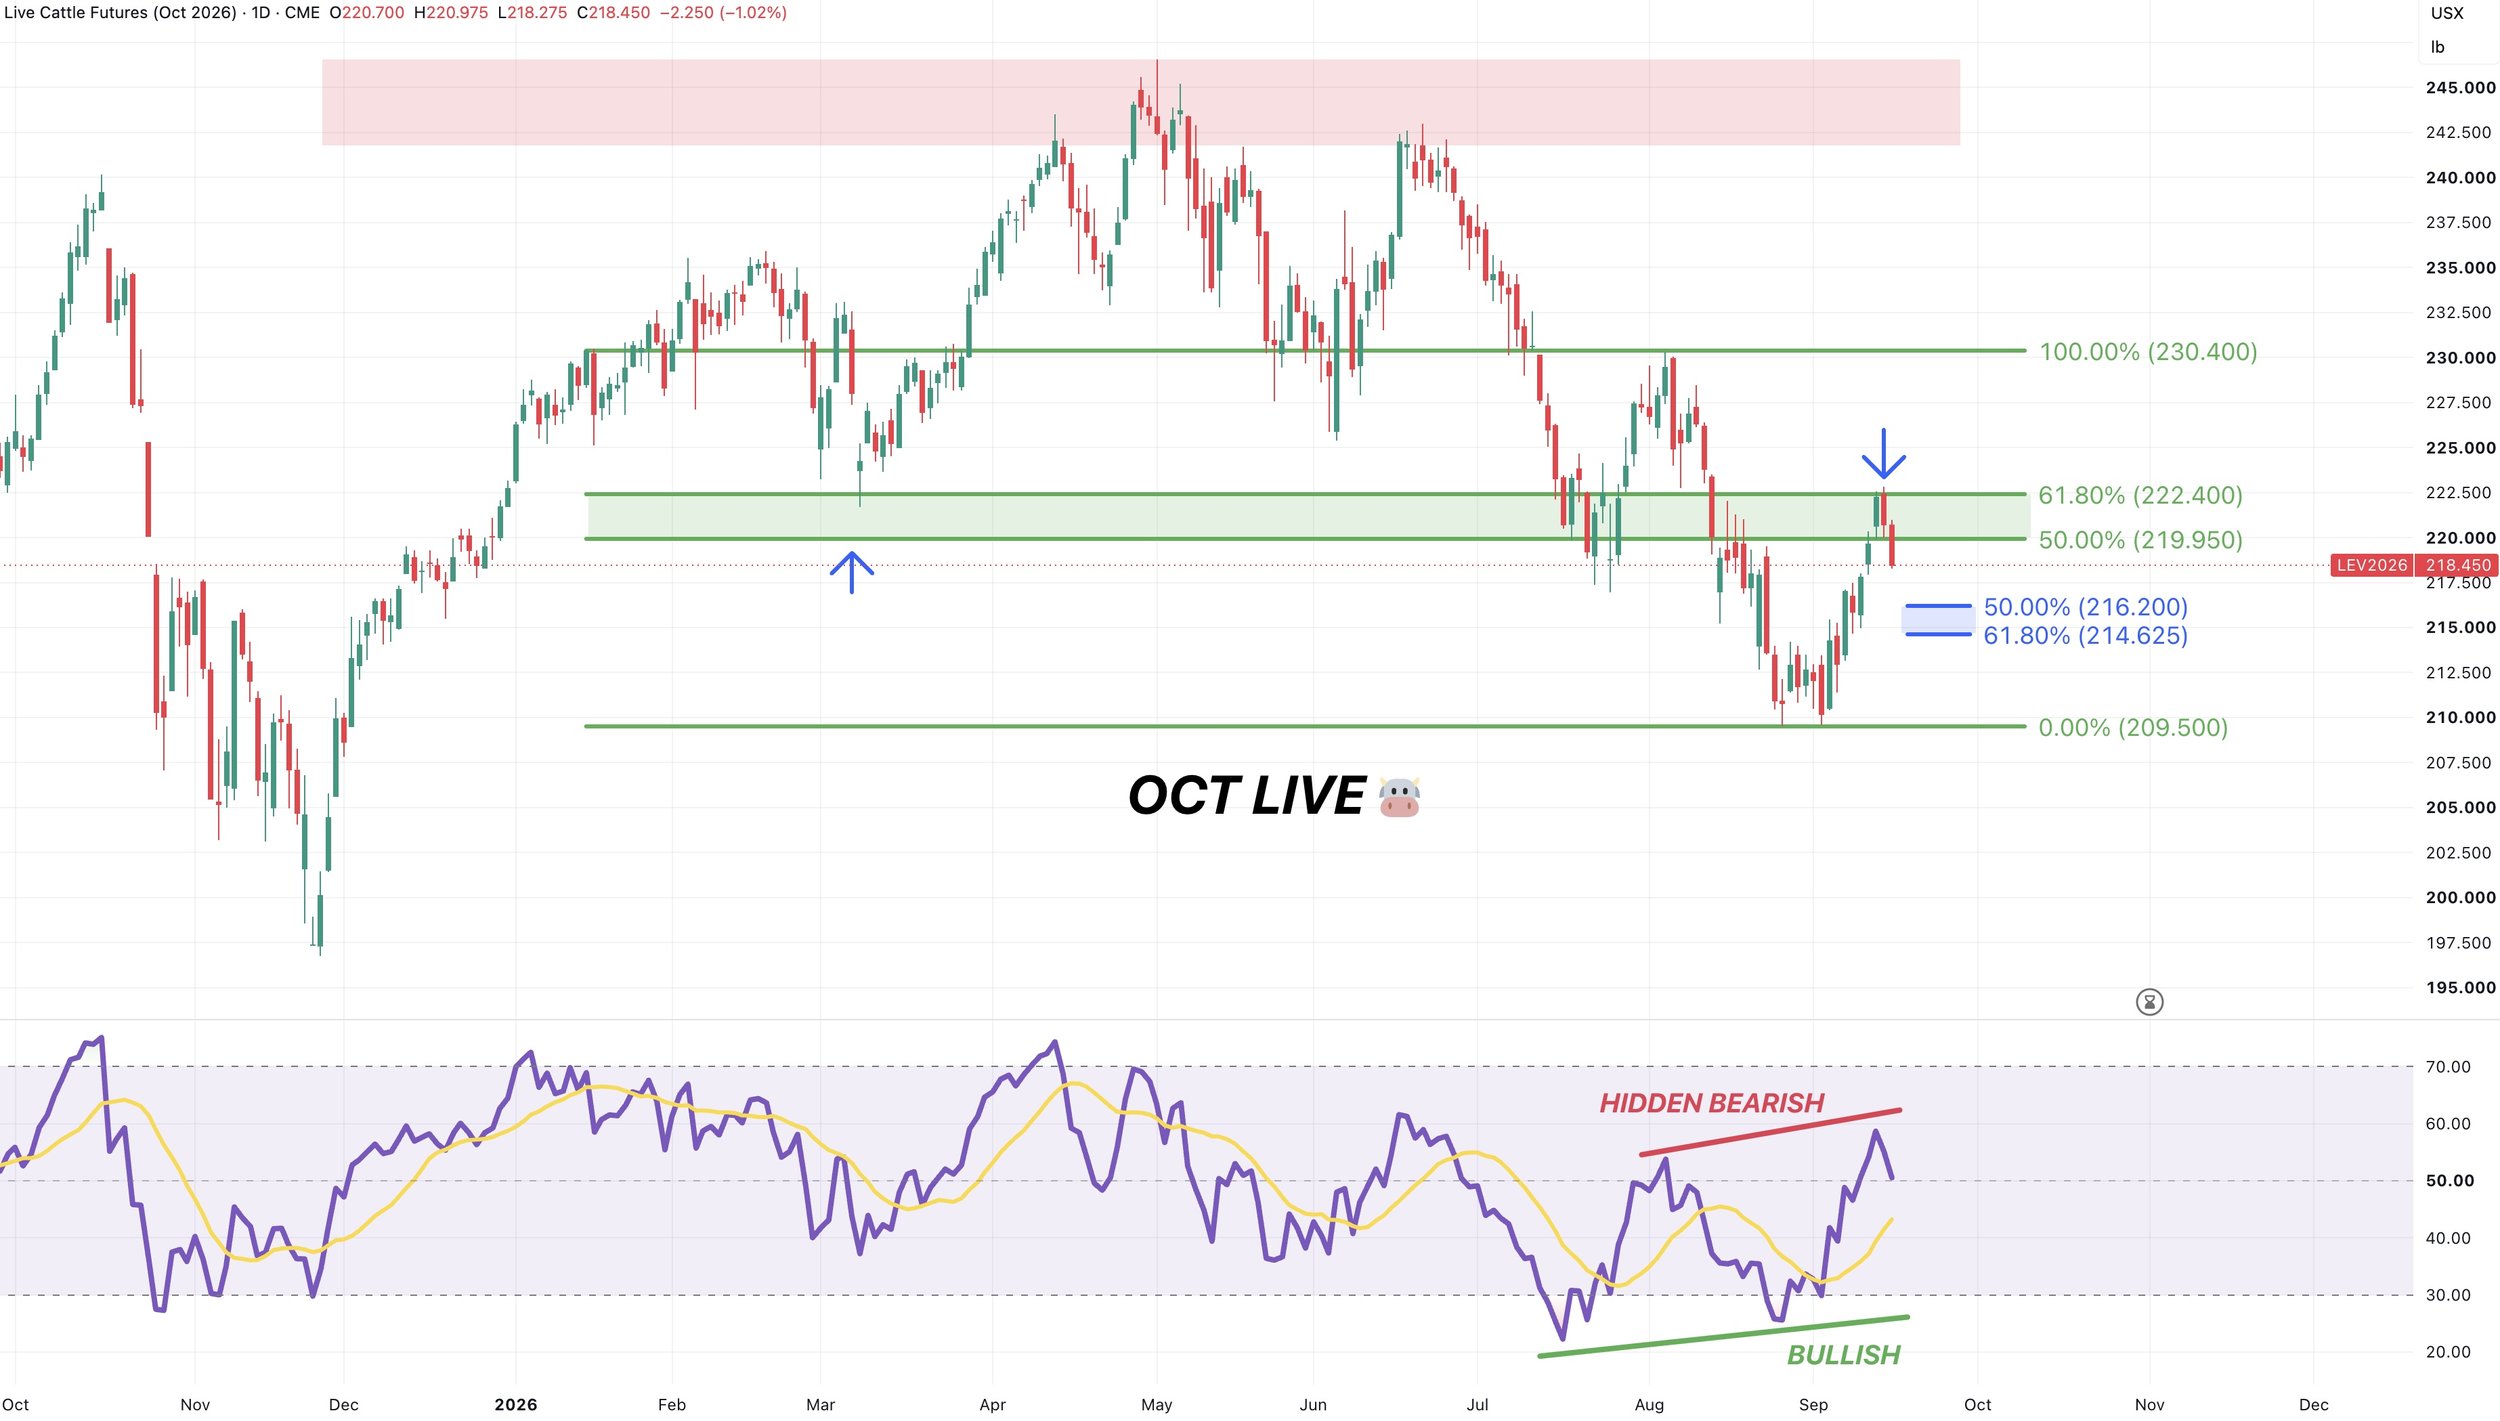
Finding resistance at this golden zone we talked about last week.
This was the area we talked about looking at managing some risk.
As we clawed back 61.8% of the August highs.
At the same time we were showing some hidden bearish divergence. The RSI made new highs yet prices did not. Similar to how bullish divergence marked the lows.
Now bulls want to hold the golden zone to the downside. If we fail to hold that blue box it opens the door to re-test the lows.
If we break above the golden zone to the upside, it opens the door higher. But for now, we are struggling at that level as expected.
Oct Feeders Chart:
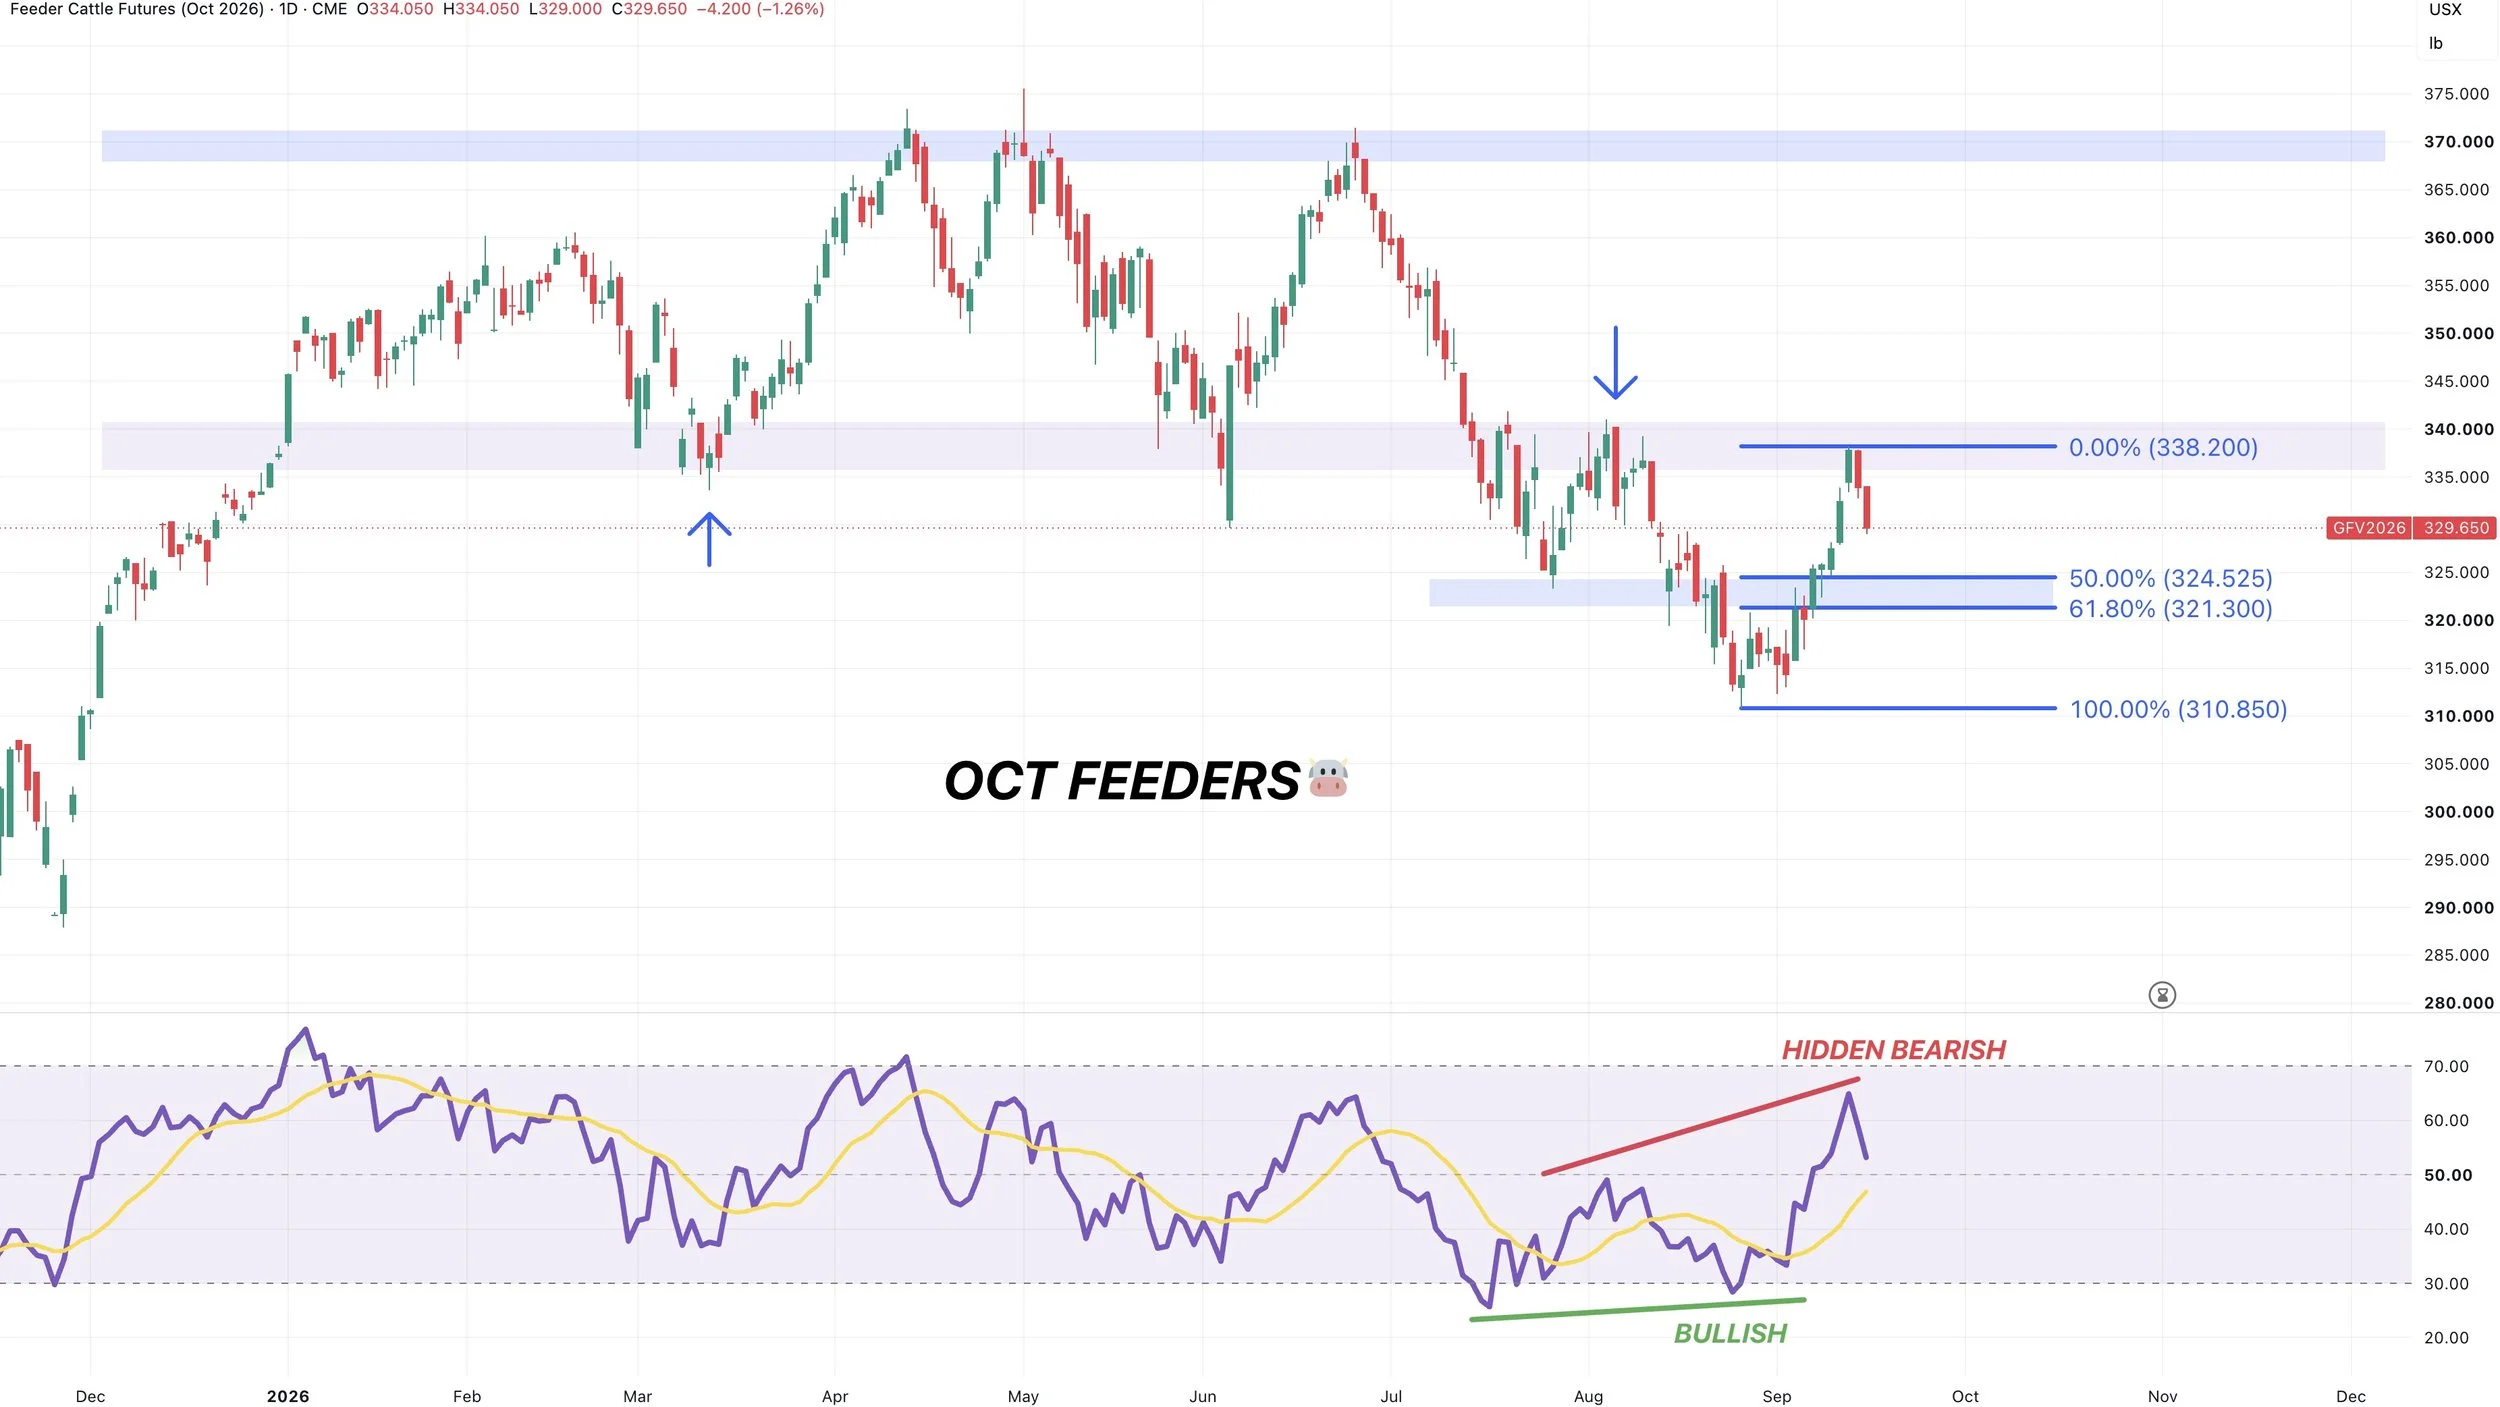
We talked about that hidden bearish divergence week being a possible warning sign, as we entered some areas of resistance.
Now seeing a pullback following the recent run.
Bulls now want to hold the golden zone at 321 to 324. If you are able to hold that level, this pullback may just be a correction before higher.
If you fail, we likely revisit the lows.
As we talked about last week, we want to treat rallies in the cattle market as just simply relief rallies unless we are proven otherwise.
Breaking above those August highs would be the first step in saying this market isn’t in sell the rally mode.
But for now, we rejected that key level of support and resistance.
Want to Talk?
Our phones are open 24/7 for you guys if you ever need anything or want to discuss your operation.
Jeremey & Office: (806)484-1214
Sebastian: (605)280-1186
Email: sfrost@dailymarketminute.com
Hedge Account
Interested in a hedge account? Use the link below to set up an account or give us a call.