
GRAINS SURGE BACK. CHINA DETAILS MONDAY
MARKET UPDATE
You can scroll to read the usual update as well. As the written version is the exact same as the video.
Timestamps for video:
Overview & News: 0:00min
Seasonal Data: 5:40min
Corn: 7:50min
Beans: 11:35min
Wheat: 15:25min
Cattle: 17:25min
Want to talk?
Office: (806)484-1214
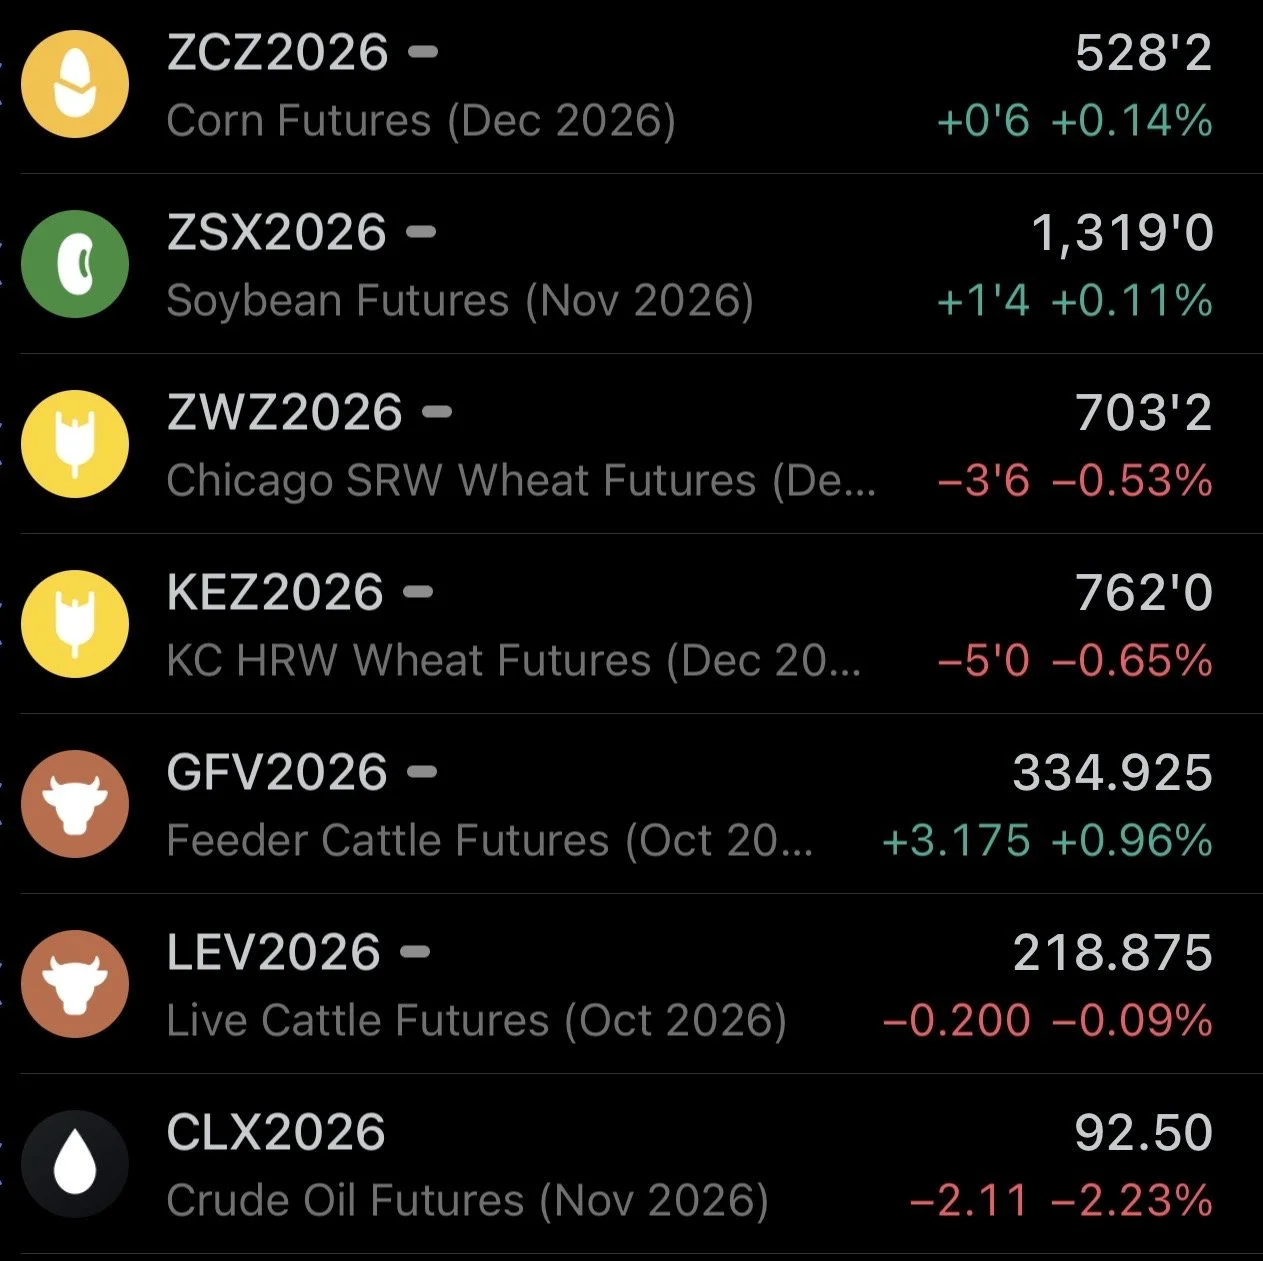
Futures Prices Close
Overview
Grains mixed but rallied well off the lows.
We started the overnight session deep in the red, but clawed back pretty impressively.
Corn was down -13 cents overnight but closed the day in the green up about a penny.
Soybeans were down -20 cents but closed a penny higher as well.
Wheat was down -25 cents but closed down just -5 cents.
So the overnight dips got bought heavily.
China Meeting
China and Trump met yesterday, and we have yet to see any details from the meeting.
Which was the reason for the overnight sell off. The market was disappointed at the lack of news going into a hyped up meeting.
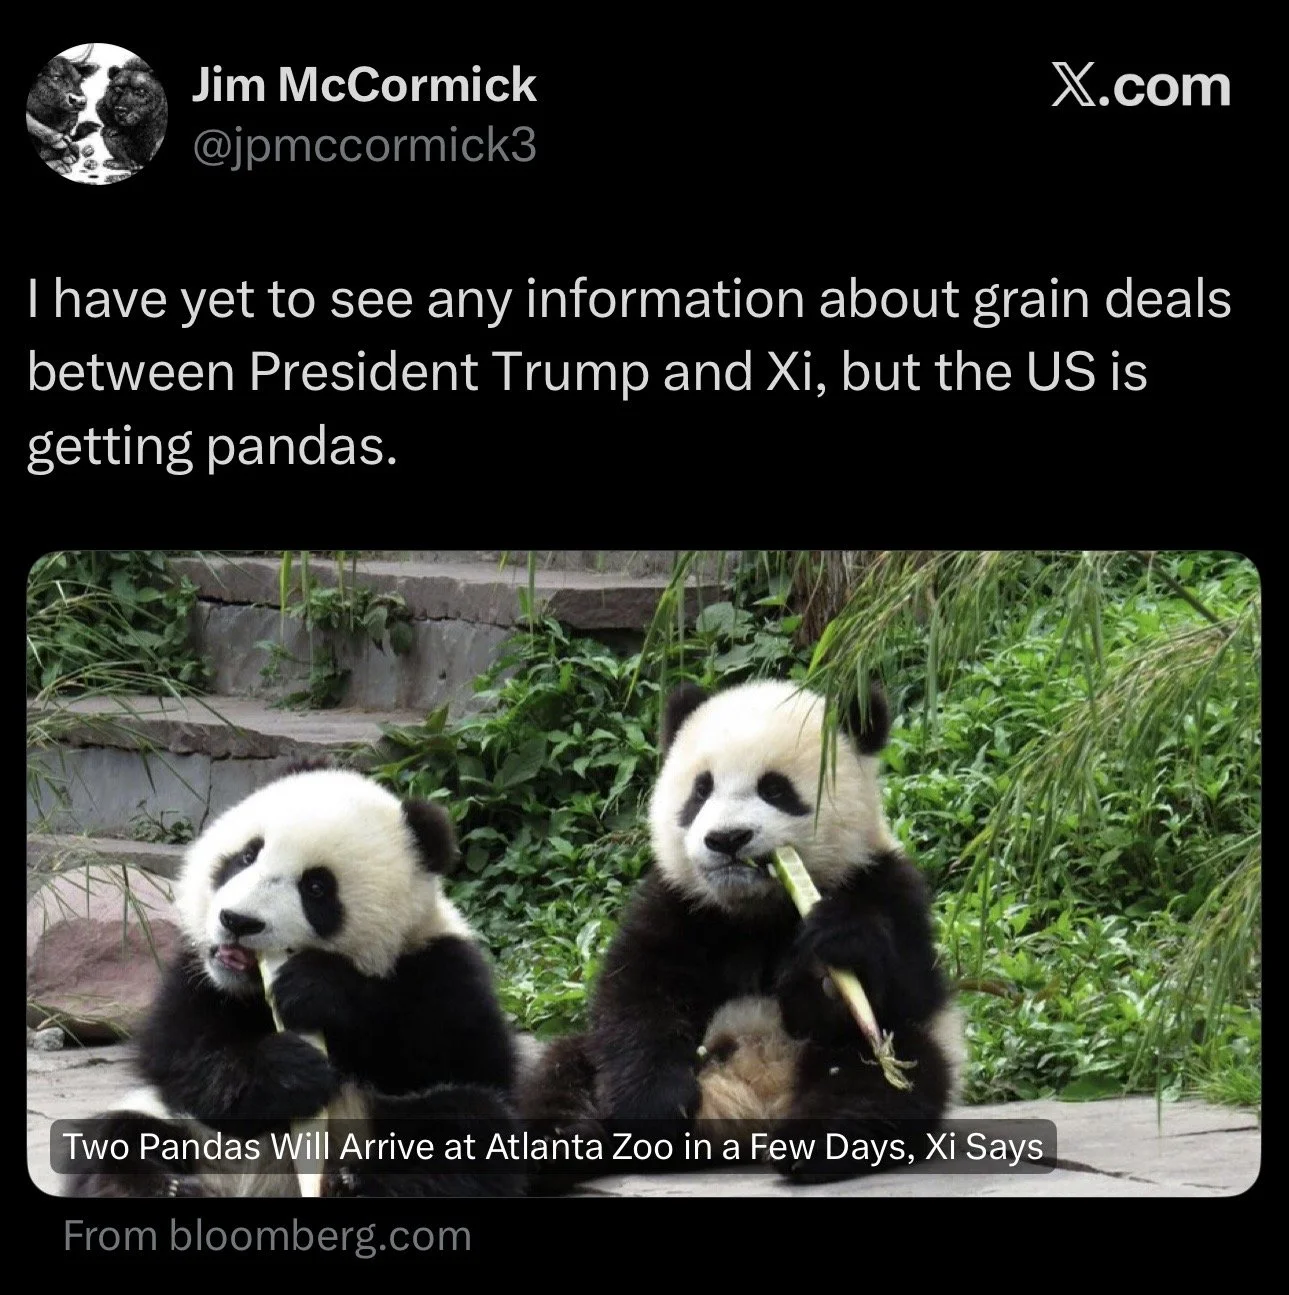
The only real news we saw was that China gifted the US some pandas.
However, in his opening remarks, Trump did specifically mention farmers.
He said:
"Our teams have been working to encourage a more balanced trading relationship, including the new market access for farmers and ranchers".
Then today around 10am CT or so, when asked about the meeting, Trump said:
"I think our farmers will be very happy".
So that's a great sign that he's acknowledging farmers. And means we should be getting some new details about ags.
And the market seemed to like the news, as that overnight weakness got bought fast.

If you remember during the last meeting, the grains sold off on Friday because we didn’t see any fresh details about ags from the meeting.
They then announced the details about the new ag purchases over the weekend and the market gapped open higher on Monday.
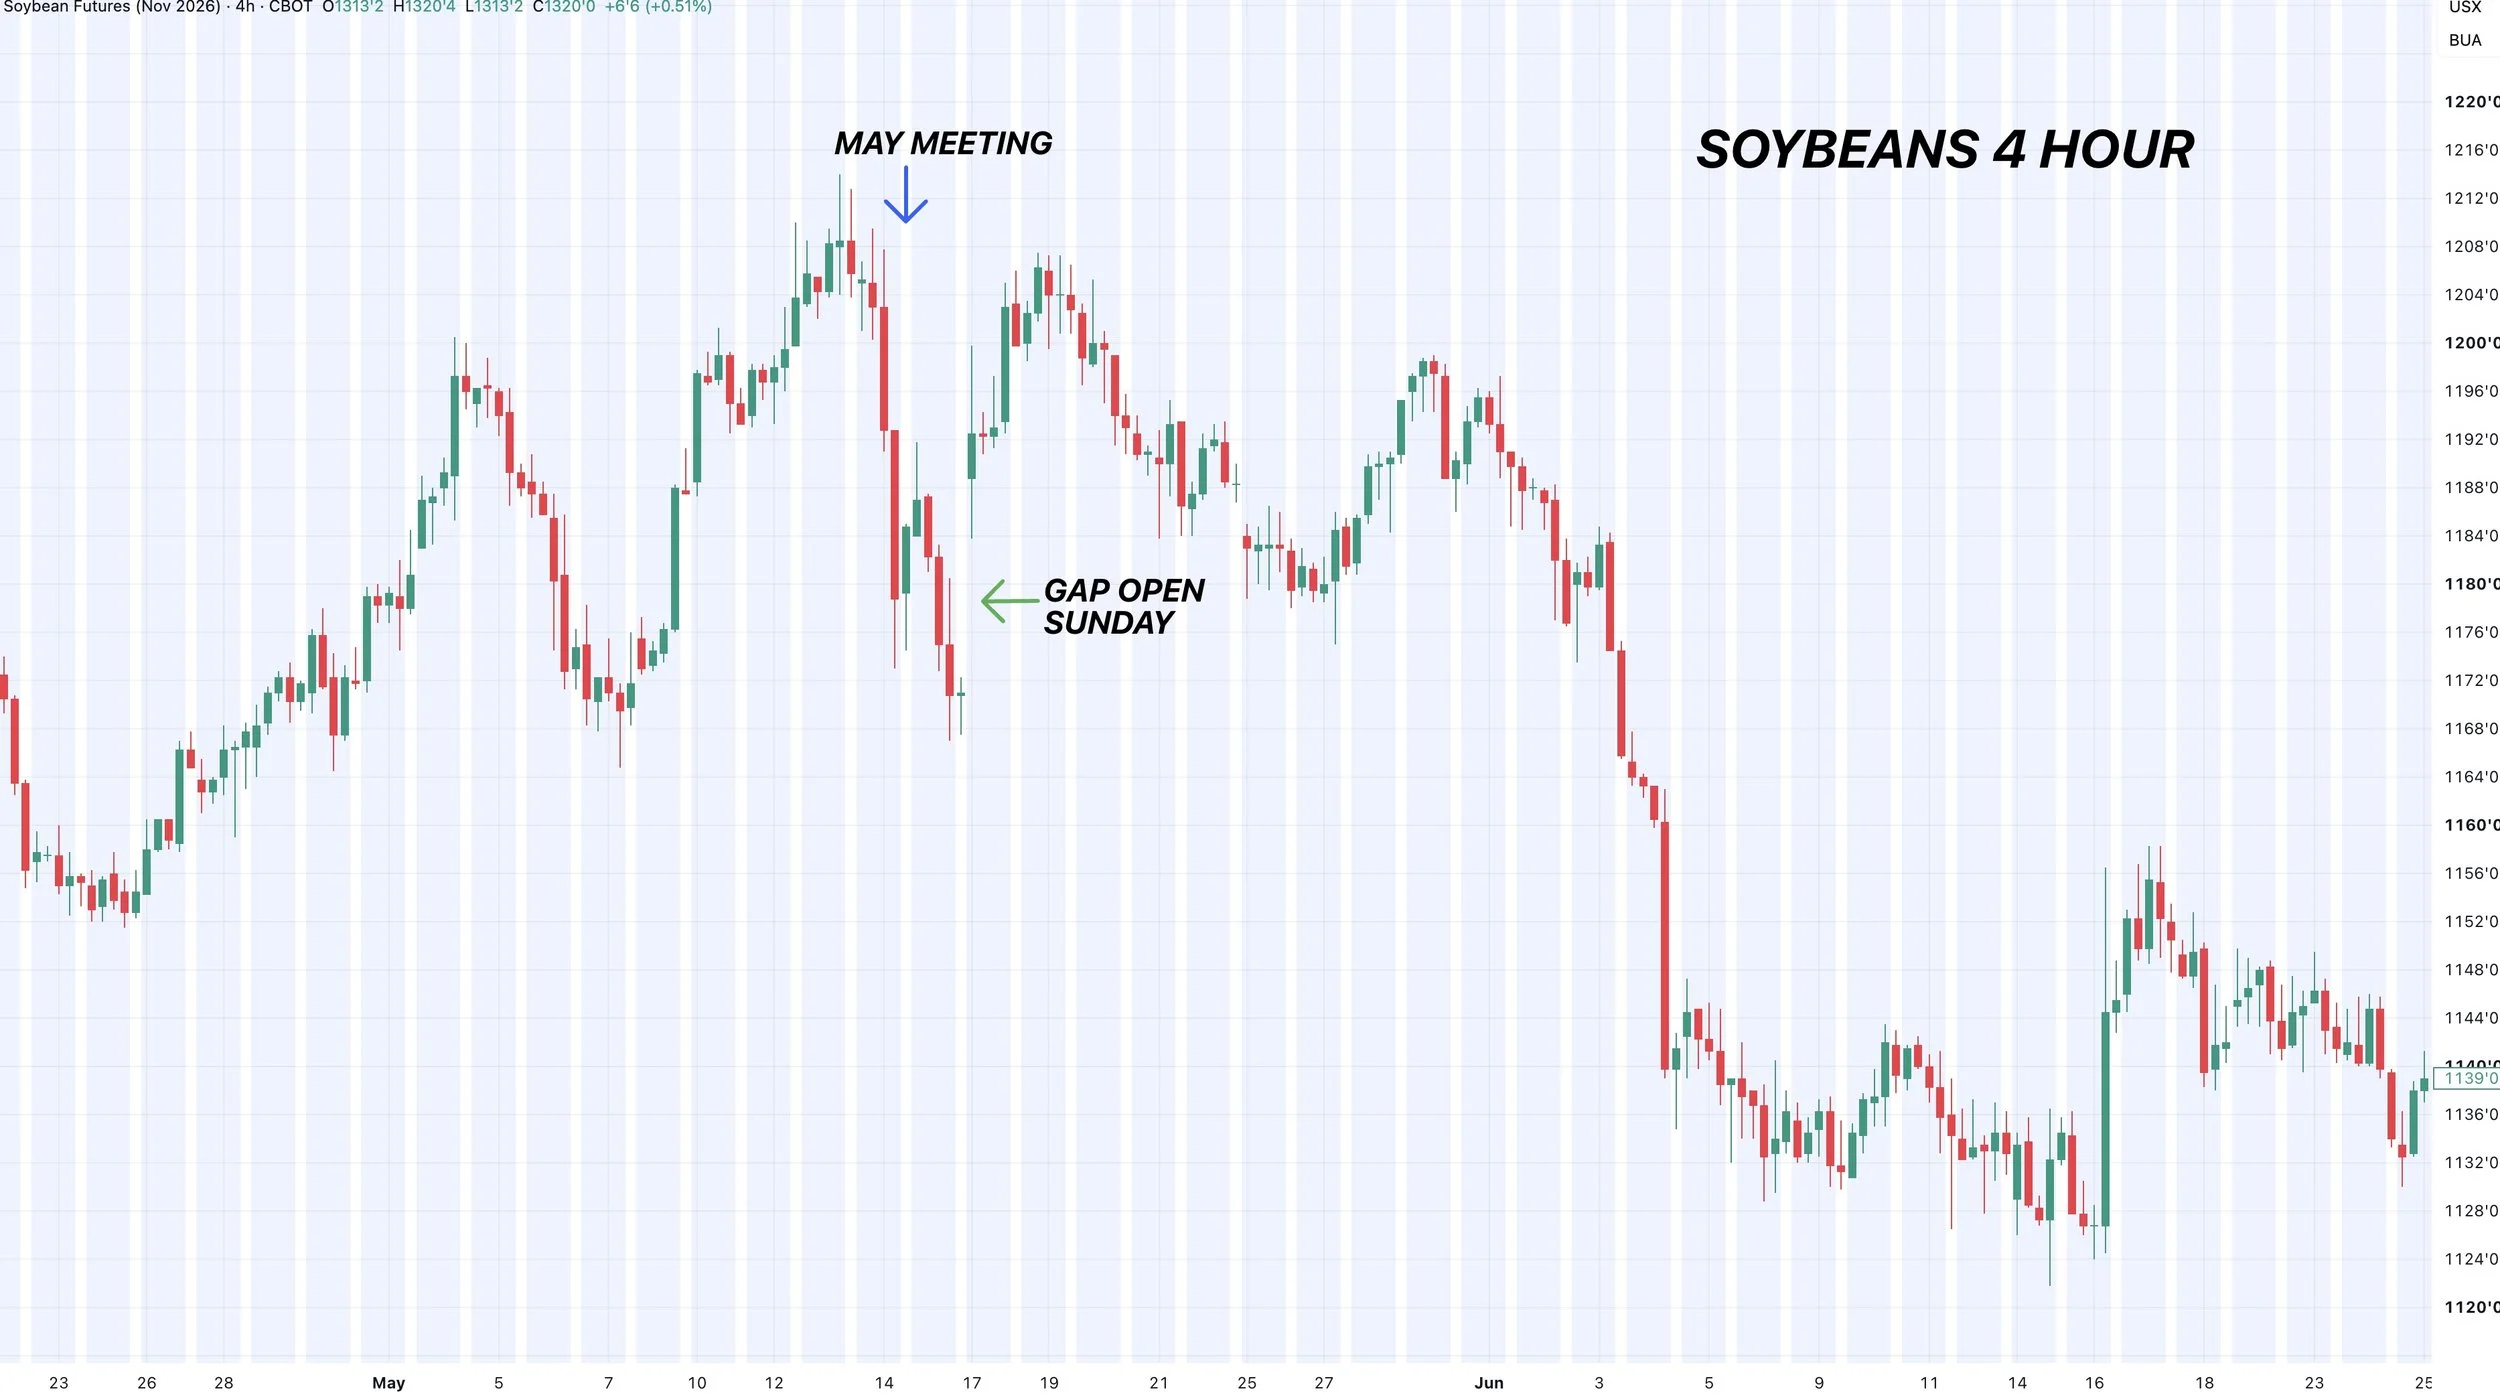
Greer said that the details on the China trade talks will come on Monday this time.

Who knows what the details will include.
The biggest question is going to be, is it more than the market has priced in?
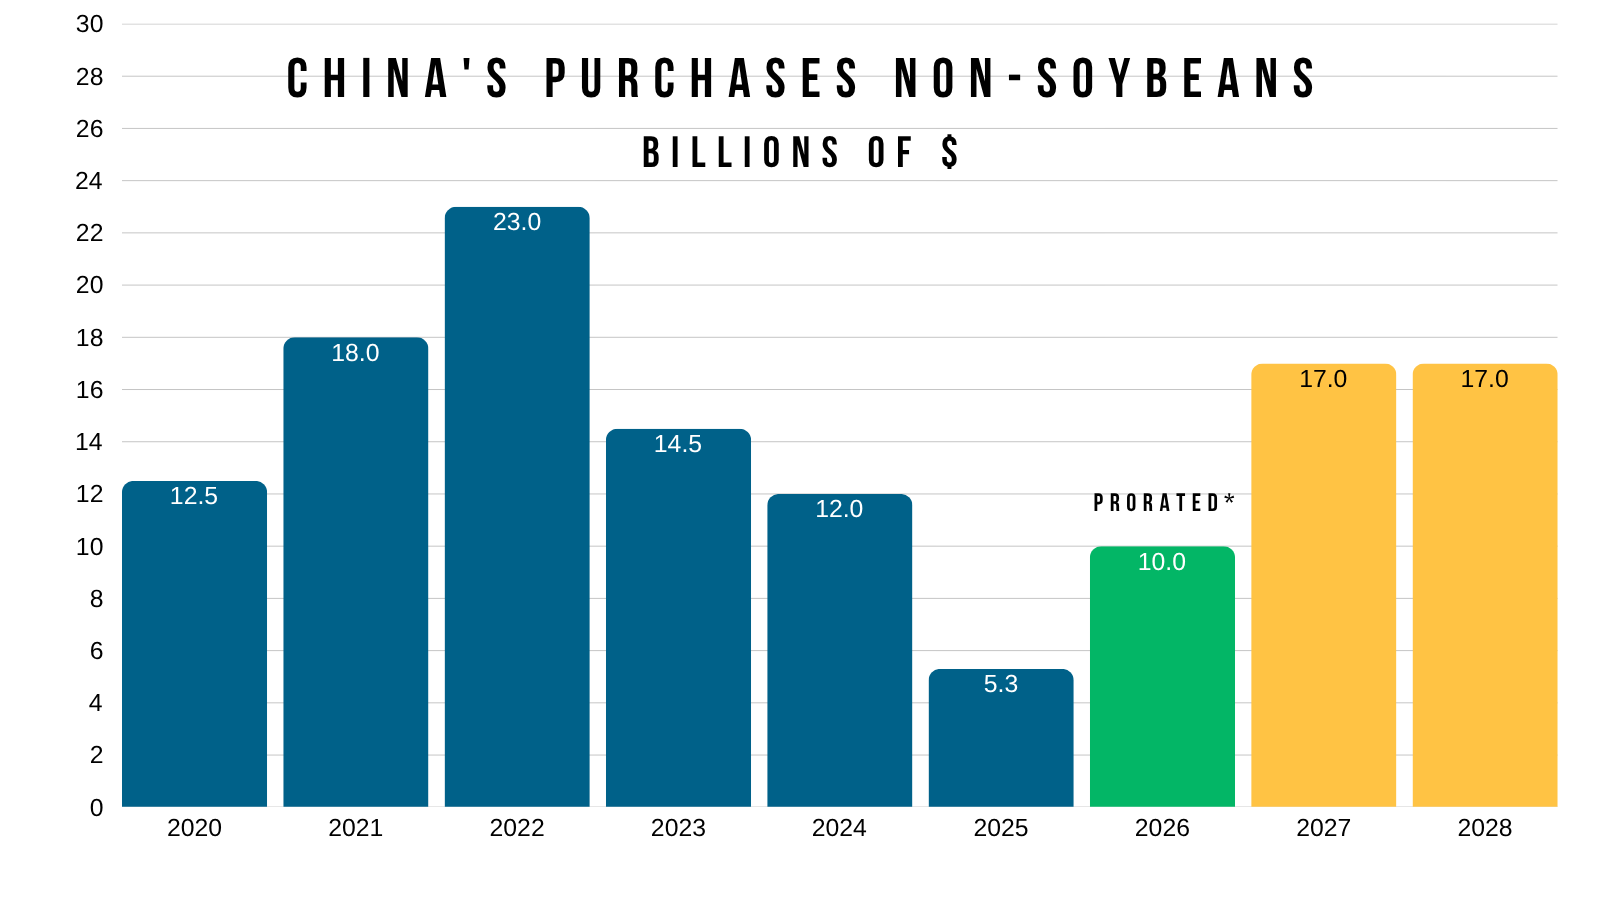
And will they give us specific details on that $17 billion of non-soybeans? Will it include corn? Will it include wheat?
Economically, you could argue that it makes more sense for them to buy wheat than it does to buy corn. Given that China can buy it's own corn a lot cheaper than they can buy ours and ship it over.
I would love to see China buy corn. It's anyone's guess, but I think wheat is actually a dark horse for some business as well.
Something that wheat has that corn does not is a logistics story with the Black Sea situation.
We have all the export issues over there, yet US wheat exports have been awful. We have not picked up any of that business from the Black Sea.
US wheat exports are actually the 2nd worst in the last decade, and are -30% worse than they were last year for this time.
China isn’t short on corn or wheat. They don’t "need" either of them. But if they want to make Trump happy and want to meet that non-soybean purchase goal, wheat would be one that would make sense. Given just how far behind of pace they are.
China's only bought $4 billion of non-soybeans this year. So if they are going to meet the goal, which would be $10 billion if you prorate the $17 billion, they are going to need to pick up that pace very fast and buy some grains asap. As they are severely behind.
So far China has lived up to everything they said they'd do. So although they are really behind, I don’t see a reason for them not to meet any of the purchase goals even if they are a little late in doing so.
Quarterly Stocks Report
We've got that USDA quarterly stocks report out next week.
There has been plenty of speculation that last years crop may have been overstated by the USDA. And if it was, this would be a report where they could possibly make an adjustment to production.
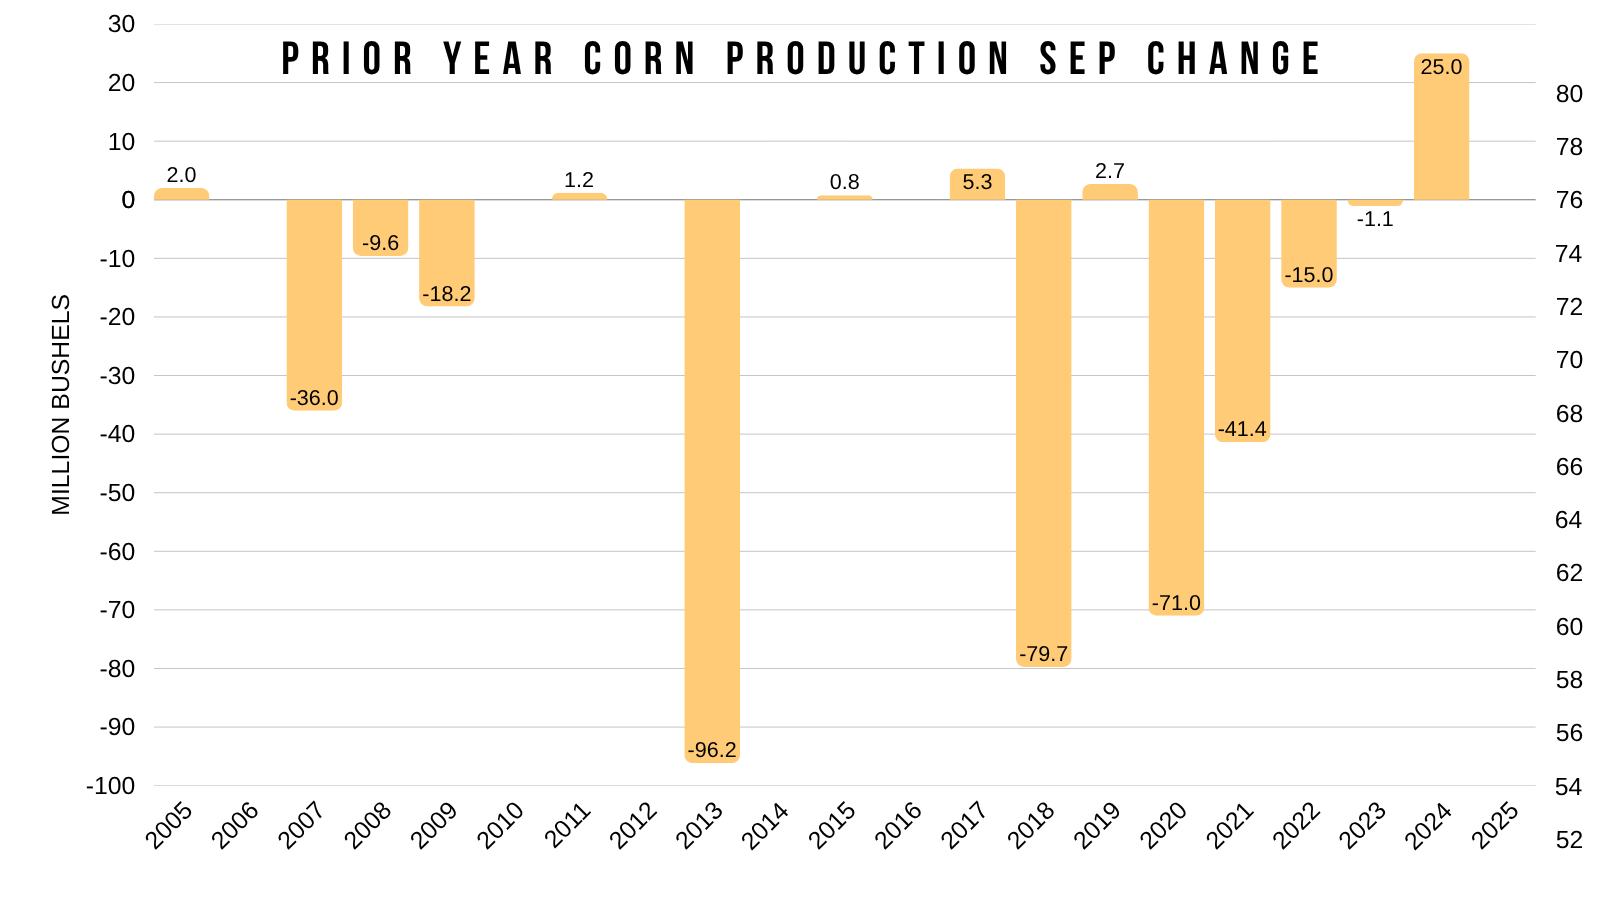
Here is a chart of the annual crop revisions since 2005. This used to happen in the January report but got switched to September in 2020.
How often do they change? Pretty often, but most of the time it's rather small.
Last year was the biggest upward adjustment they've made in a long time.
We haven’t seen the USDA cut production by more than 100 million bushels in at least the last 20 years.
However, there are a handful of years we've seen them make a decent adjustment lower. And the production has been adjusted lower in the last 5 of 7 years.
One thing to note is that if the USDA cuts the crop from last year, they could very easily offset some of it with a cut to feed demand. As many also believe our feed demand has been overstated. Many have speculated feed was too high, and the USDA did this because they knew the crop size was overstated.
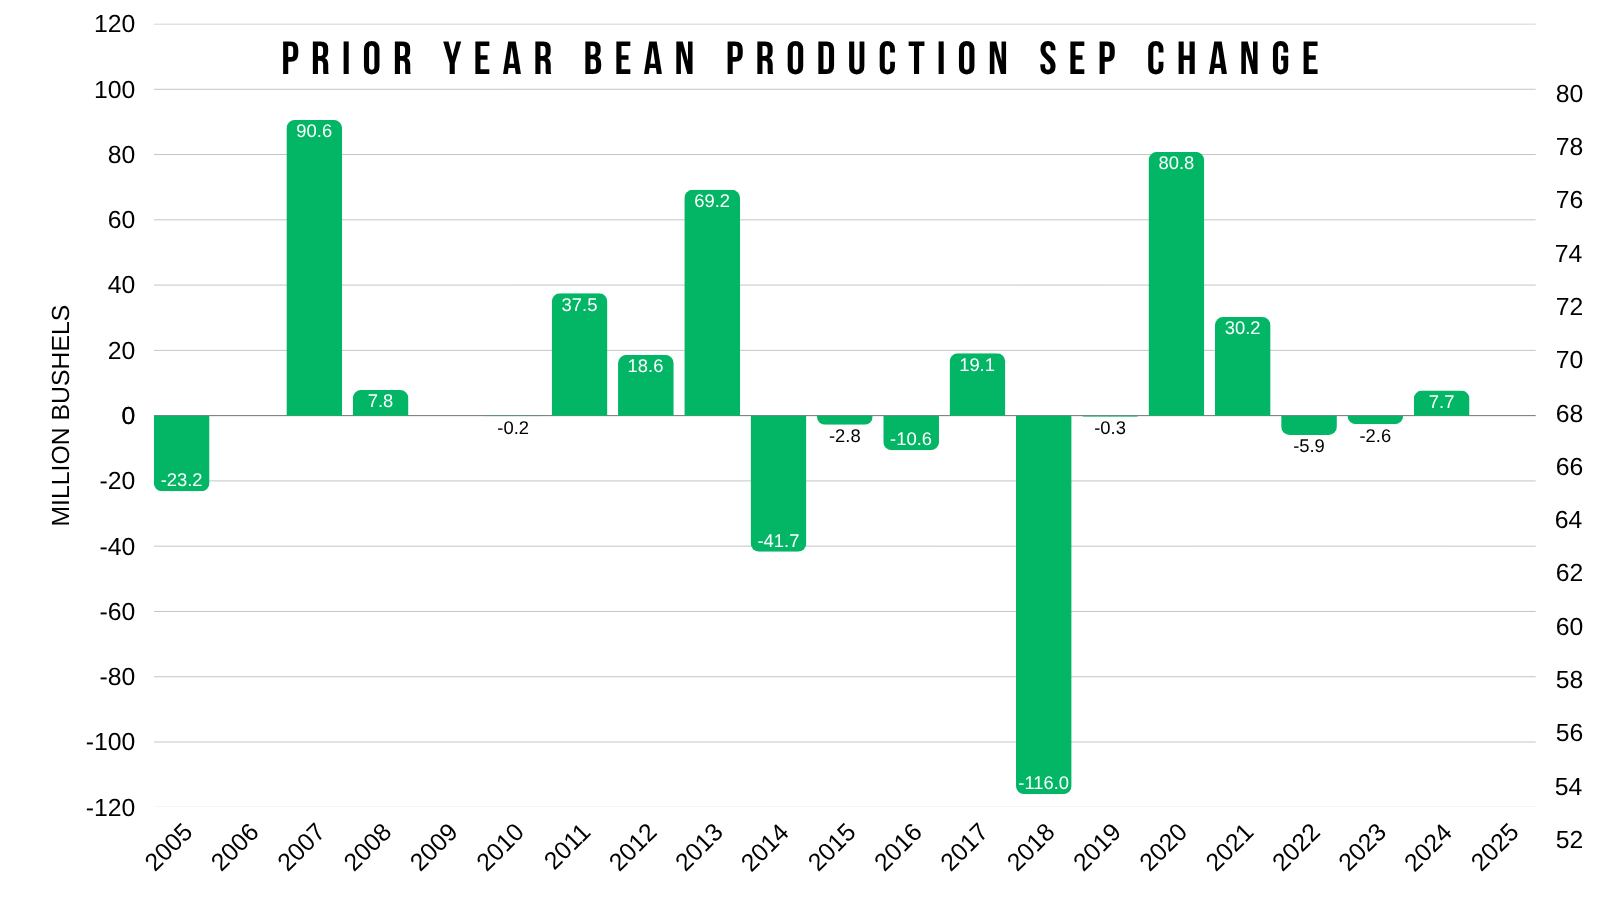
Here is the changes for the soybean crop from the prior year.
There has been some decent changes through out the years, but we haven’t seen a big one since the 2021 crop.
We have seen the number tend to be raised rather than cut.
This report is going to tell us how much old crop we have left and how much supply we're going to be carrying over into the next marketing year.
What matters is how this number compares to the markets expectations.
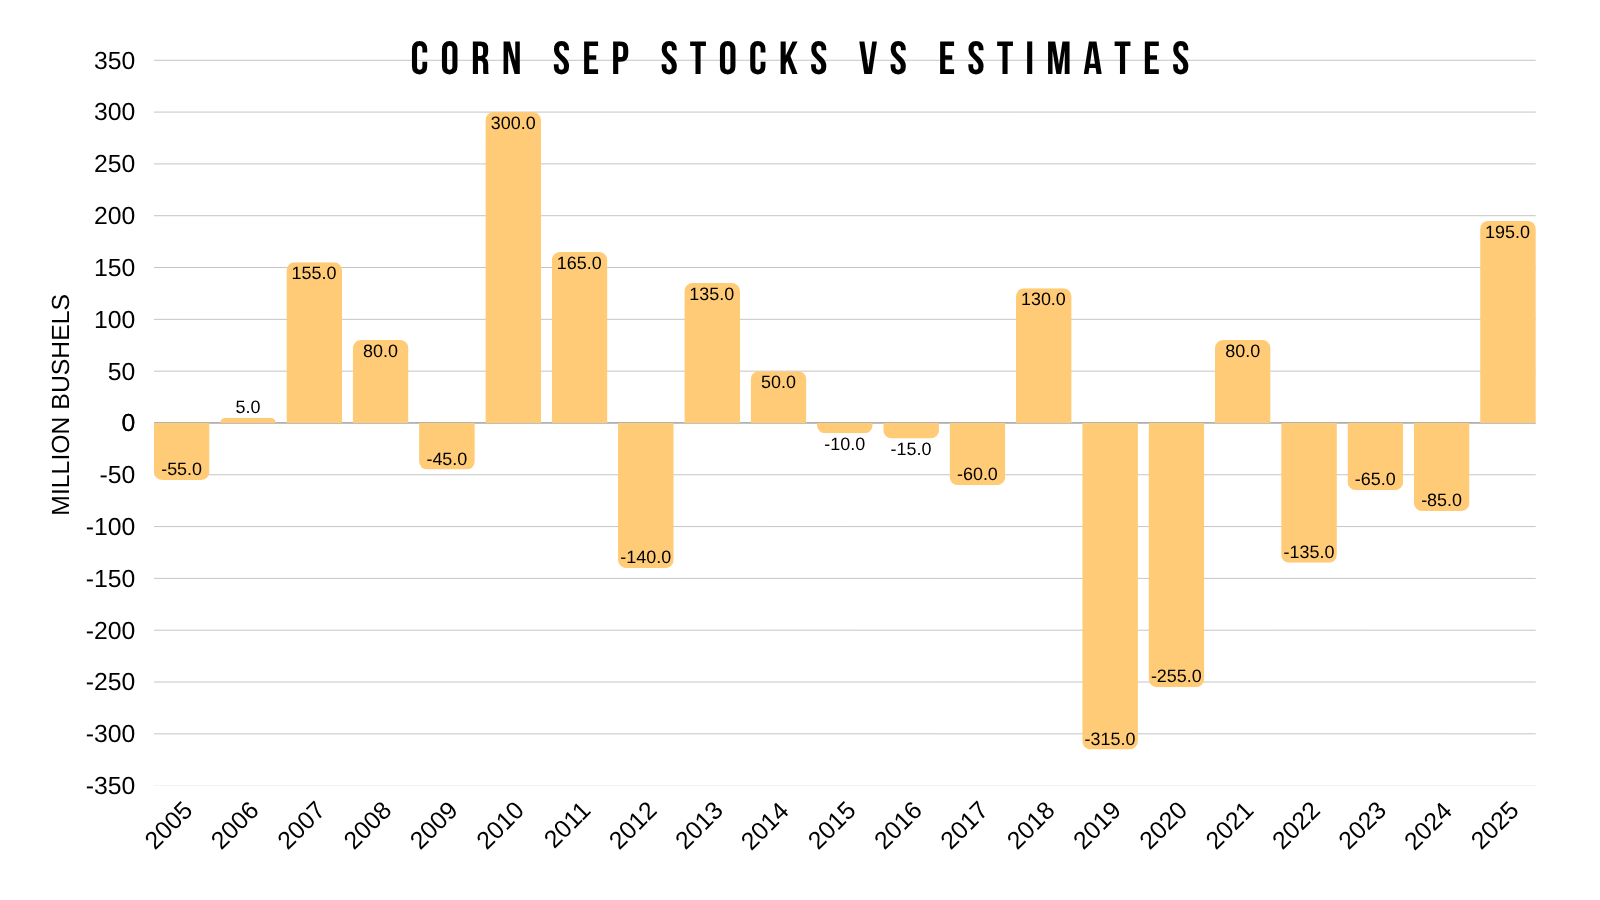
Below is a chart that compares the numbers vs the trade estimates.
Corn stocks have come in below the trade estimate in the last 8 of 11 years.
However, last year the number came in nearly +200 million higher than the trade was expecting which was one of the larger upside misses. Largely due to feed demand dropping I believe.
History shows that this report can offer surprises in either direction, as there are several years the estimate has been off by anywhere from 100 to 300 million.
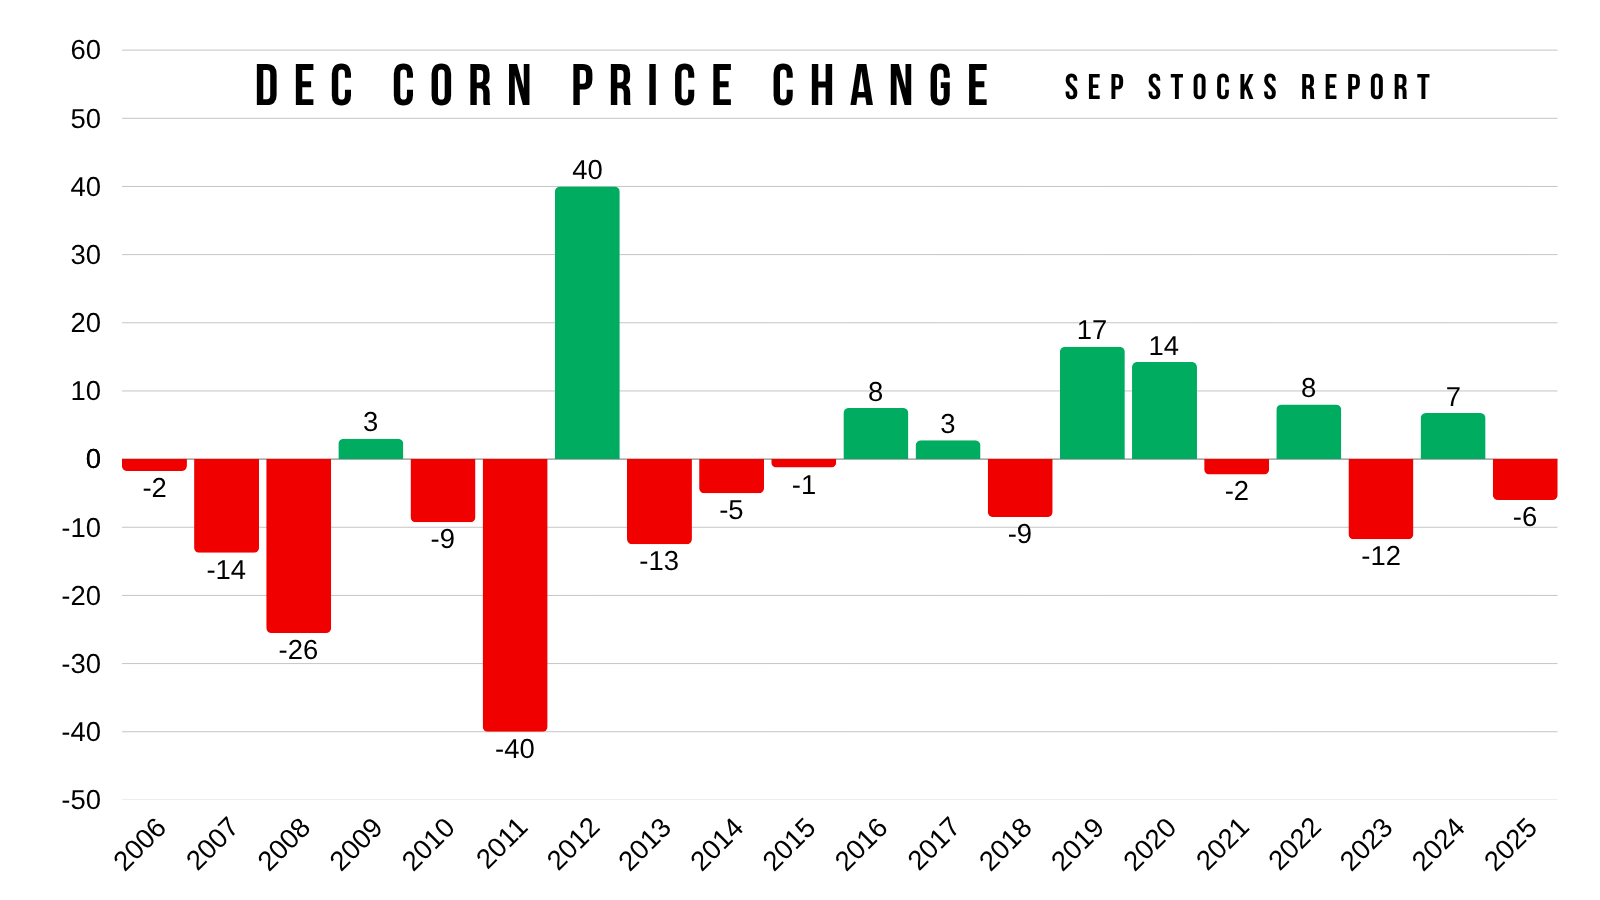
How big of a market mover is this report?
First for corn.
Like any report, this can of course move the market.
However, this report isn’t considered the biggest one of the year, and we have not seen a 20 cent or larger move since all the way back in 2012. Where we saw a limit down day in 2011 and a limit up day in 2012.
Since then it's been more tame. In the last 10 years we've only seen a move larger than 10 cents just 3 times.
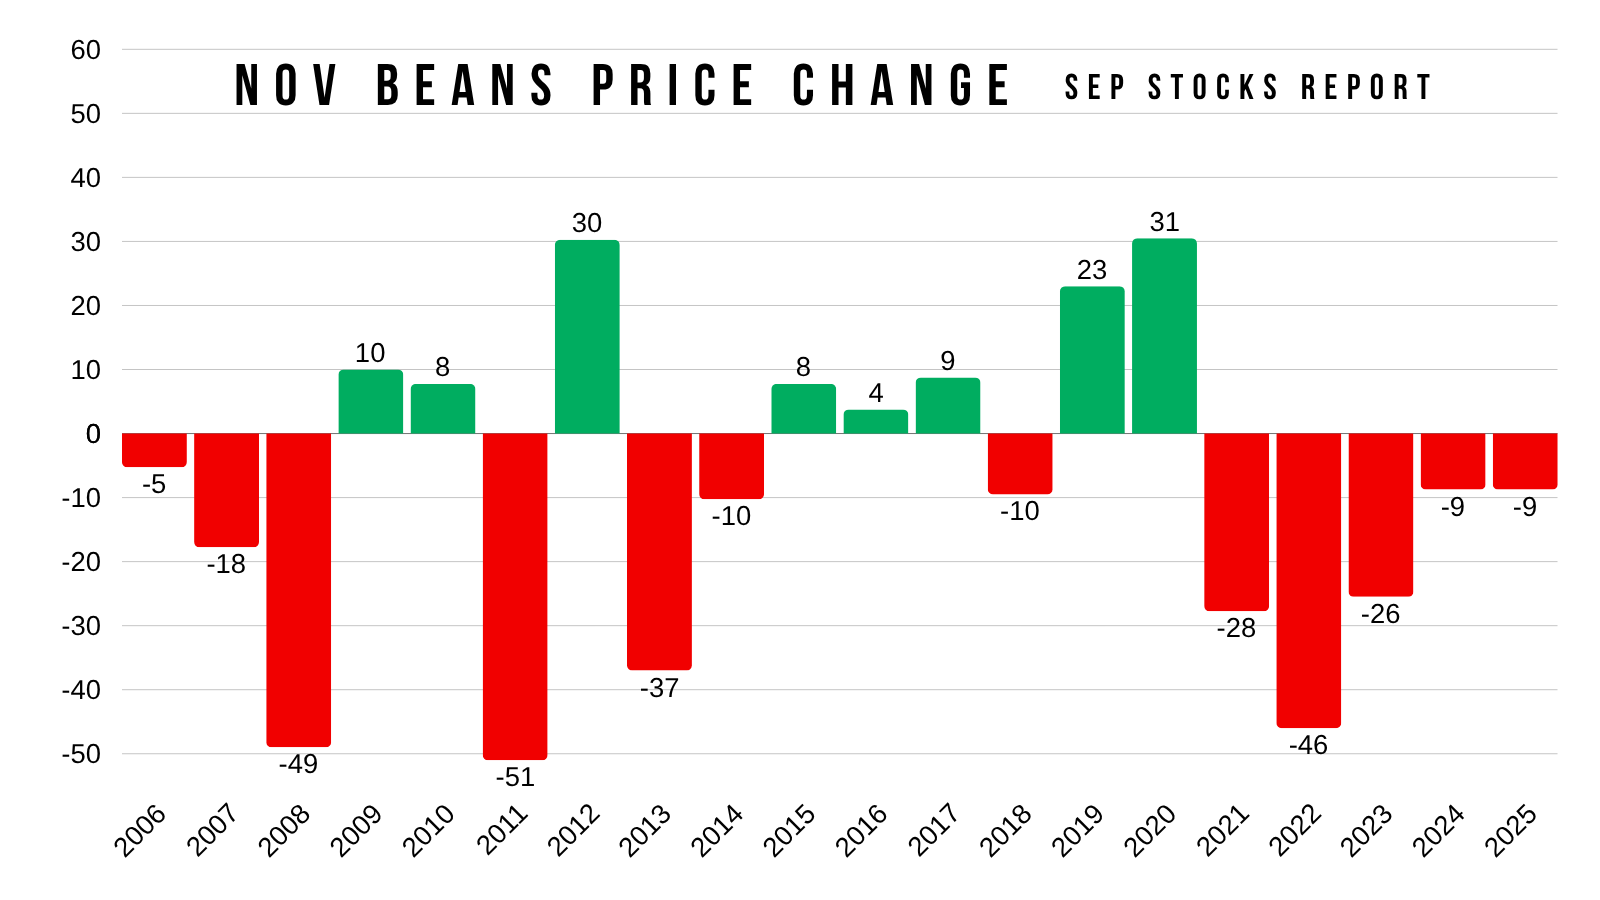
As for soybeans, this report does tend to move the market more drastically.
In the last 20 years, we have seen a move of 25 cents or more 8 times. Nearly half the time.
Something else to note is that soybeans have traded lower on the day of this report for 5 years in a row now.
Seasonals Update
Corn:
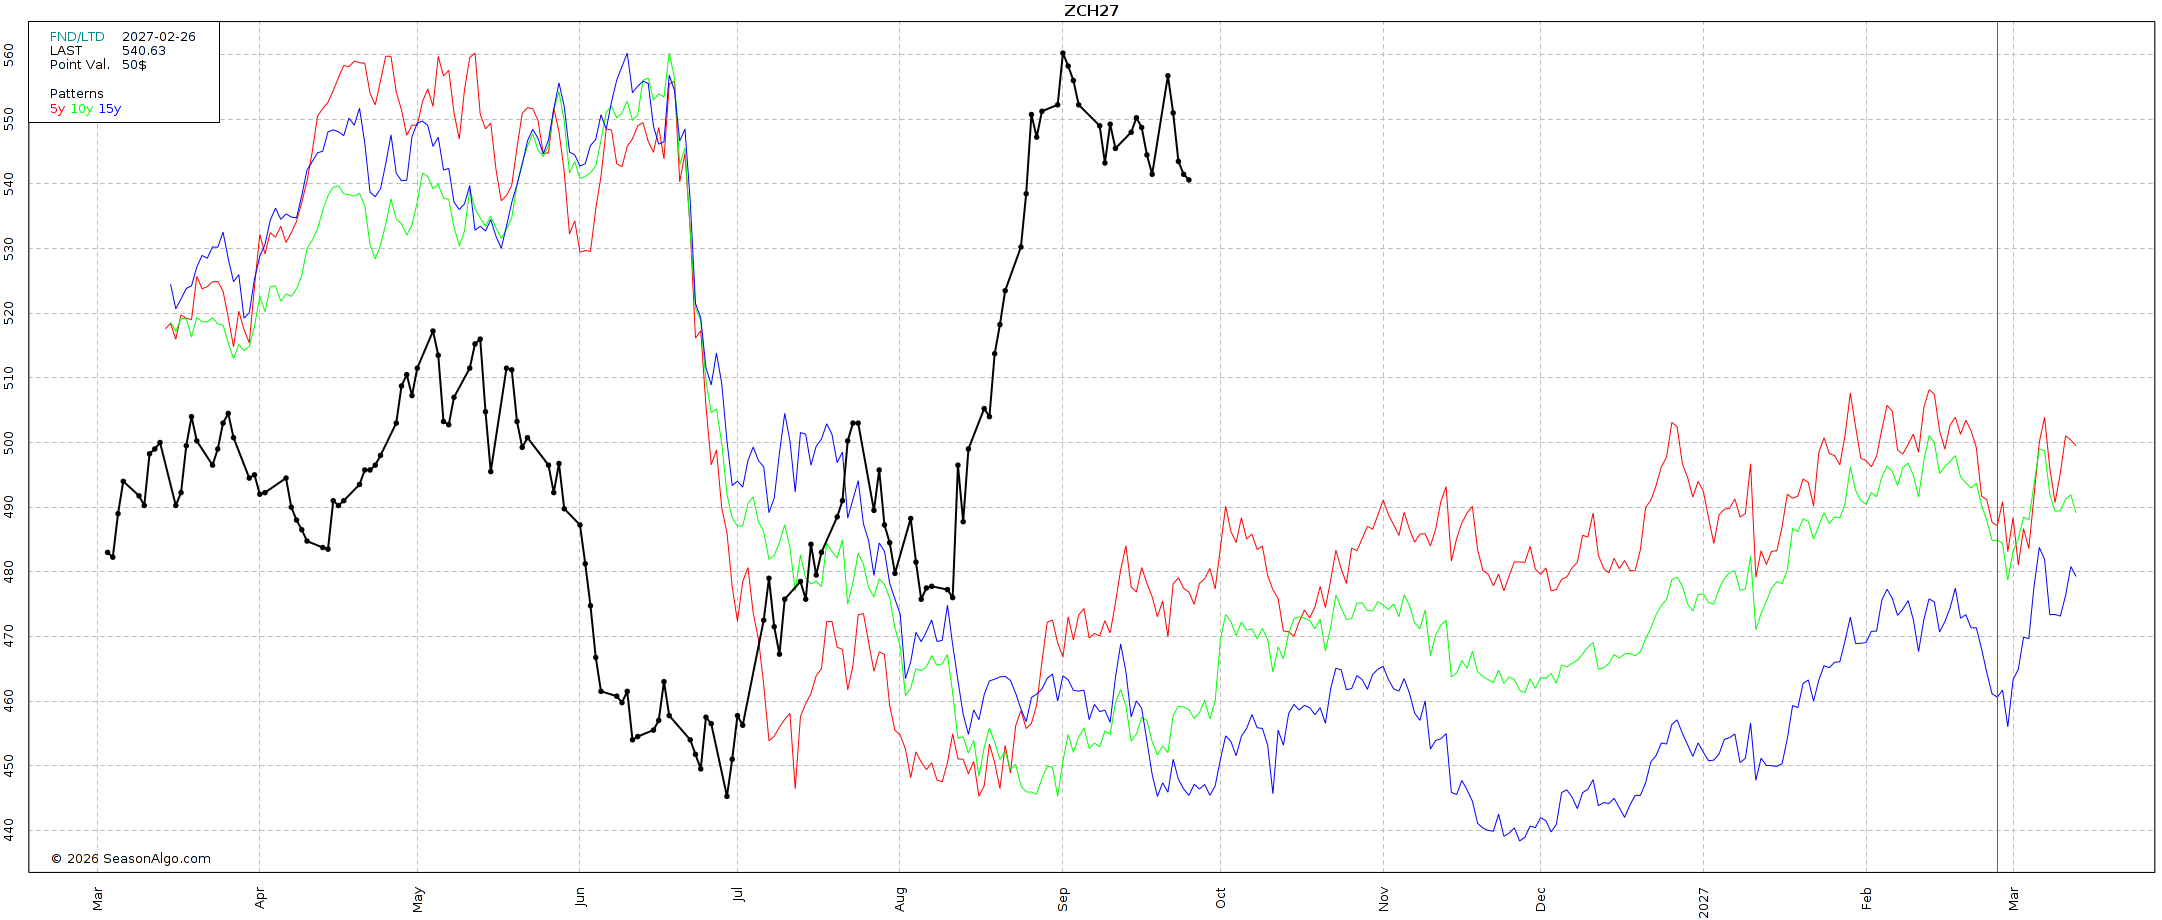
Obviously this has been a pretty counter seasonal year.
Normally, we're in the process of coming off the harvest lows in August and September.
Here is a visual of where we are in the typical seasonal pattern for March corn.
Normally, we head higher until November before getting some weakness to close out the year.
We then head higher into the start of the new year.
Some seasonal data:
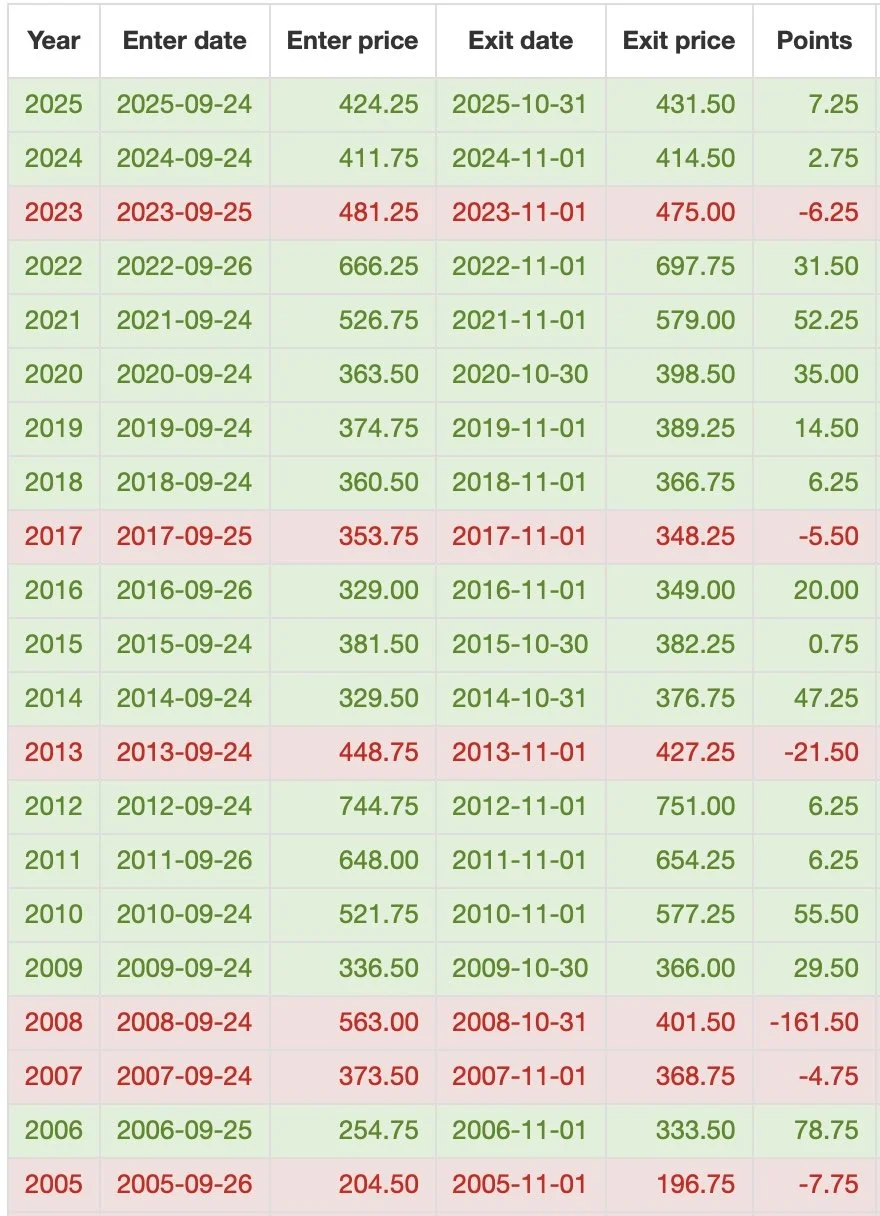
Here is the data for corn from today through November 1st.
There has been a very high tendency for corn to push higher heading into November.
We've been higher the last 8 of 10 years.
We've been higher the last 14 of 17 years.
Soybeans:
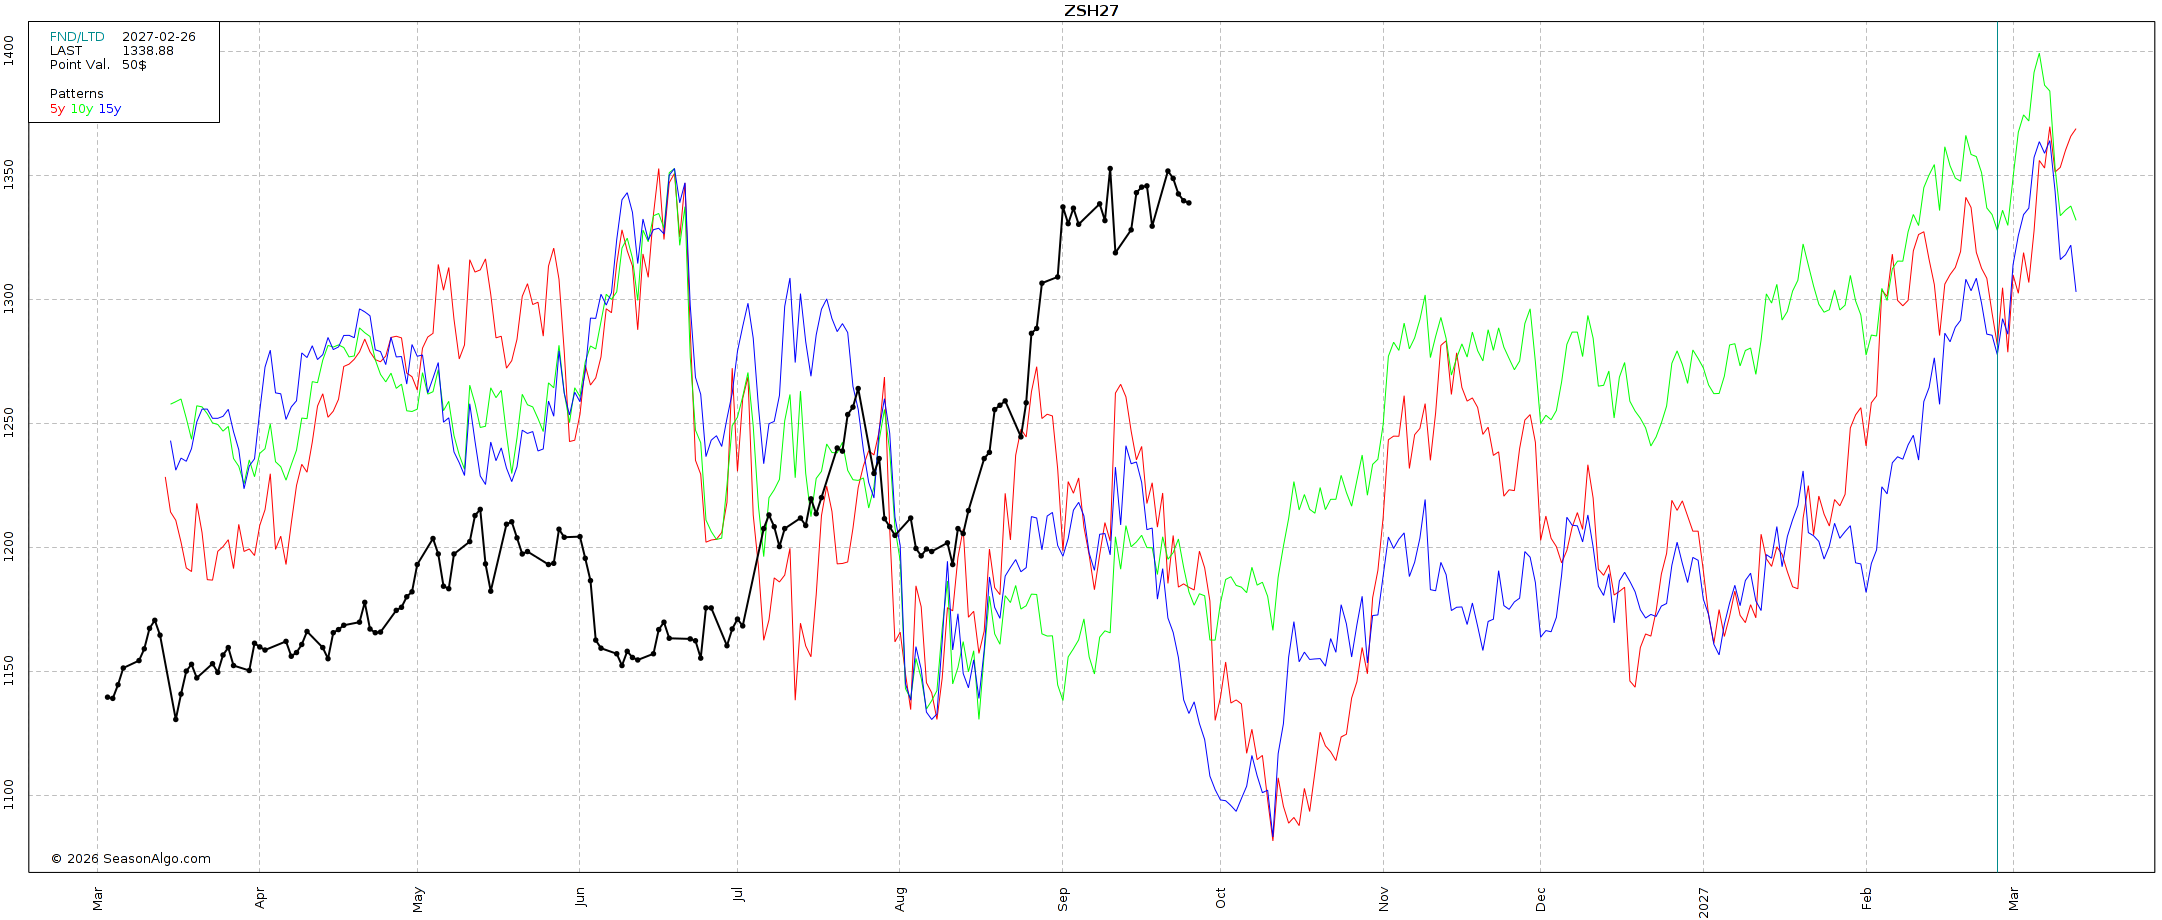
Short term, the end of September and early October are seasonally one of the weakest times of the year for soybeans.
After that seasonal weakness we then tend to move higher into November. Followed by weakness towards the end of the year and then further upside into the start of the new year.
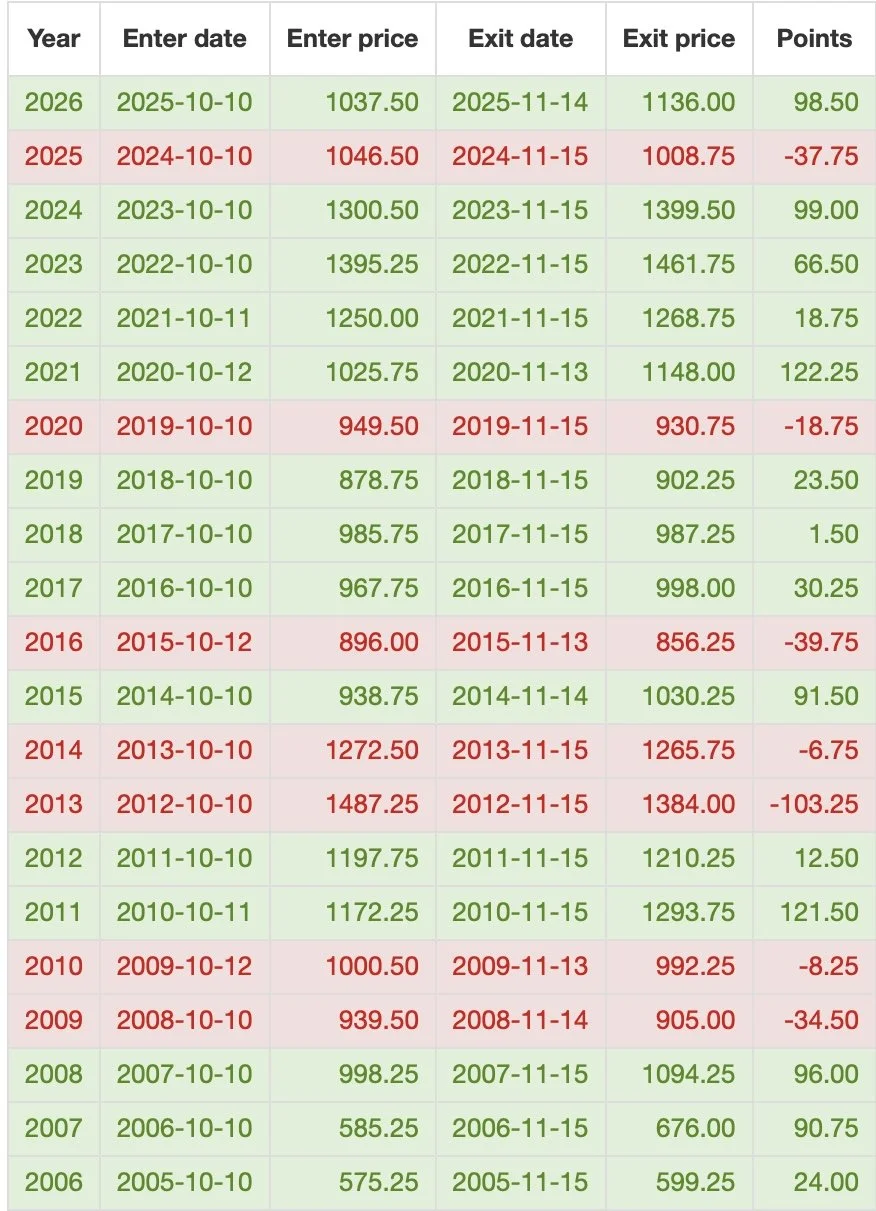
Here is some short time frame seasonal data.
From today's date by October 10th, so the next 2-3 weeks, Nov soybeans have traded lower in the last 11 of 15 years.
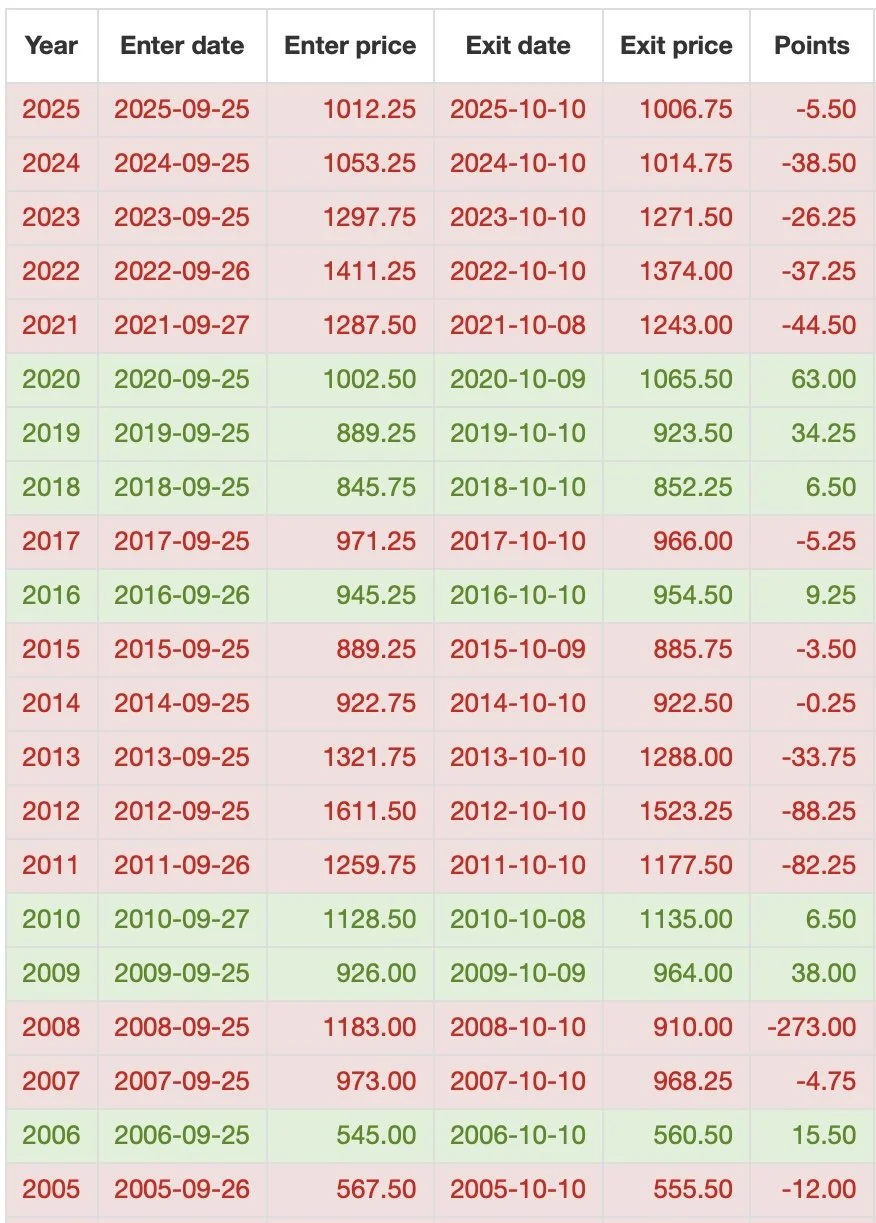
However, then from October 10th to November 15th, soybeans have traded higher in the last 8 of 10 years.
Higher the last 10 of 15 years.
So soybeans seasonally tend to see some weakness leading into early October, followed by strength heading into November.
Seasonals aren’t perfect. This year has been a perfect example of that. But just some things to keep in mind.
Diesel vs Ags
I've shown this chart plenty of times.
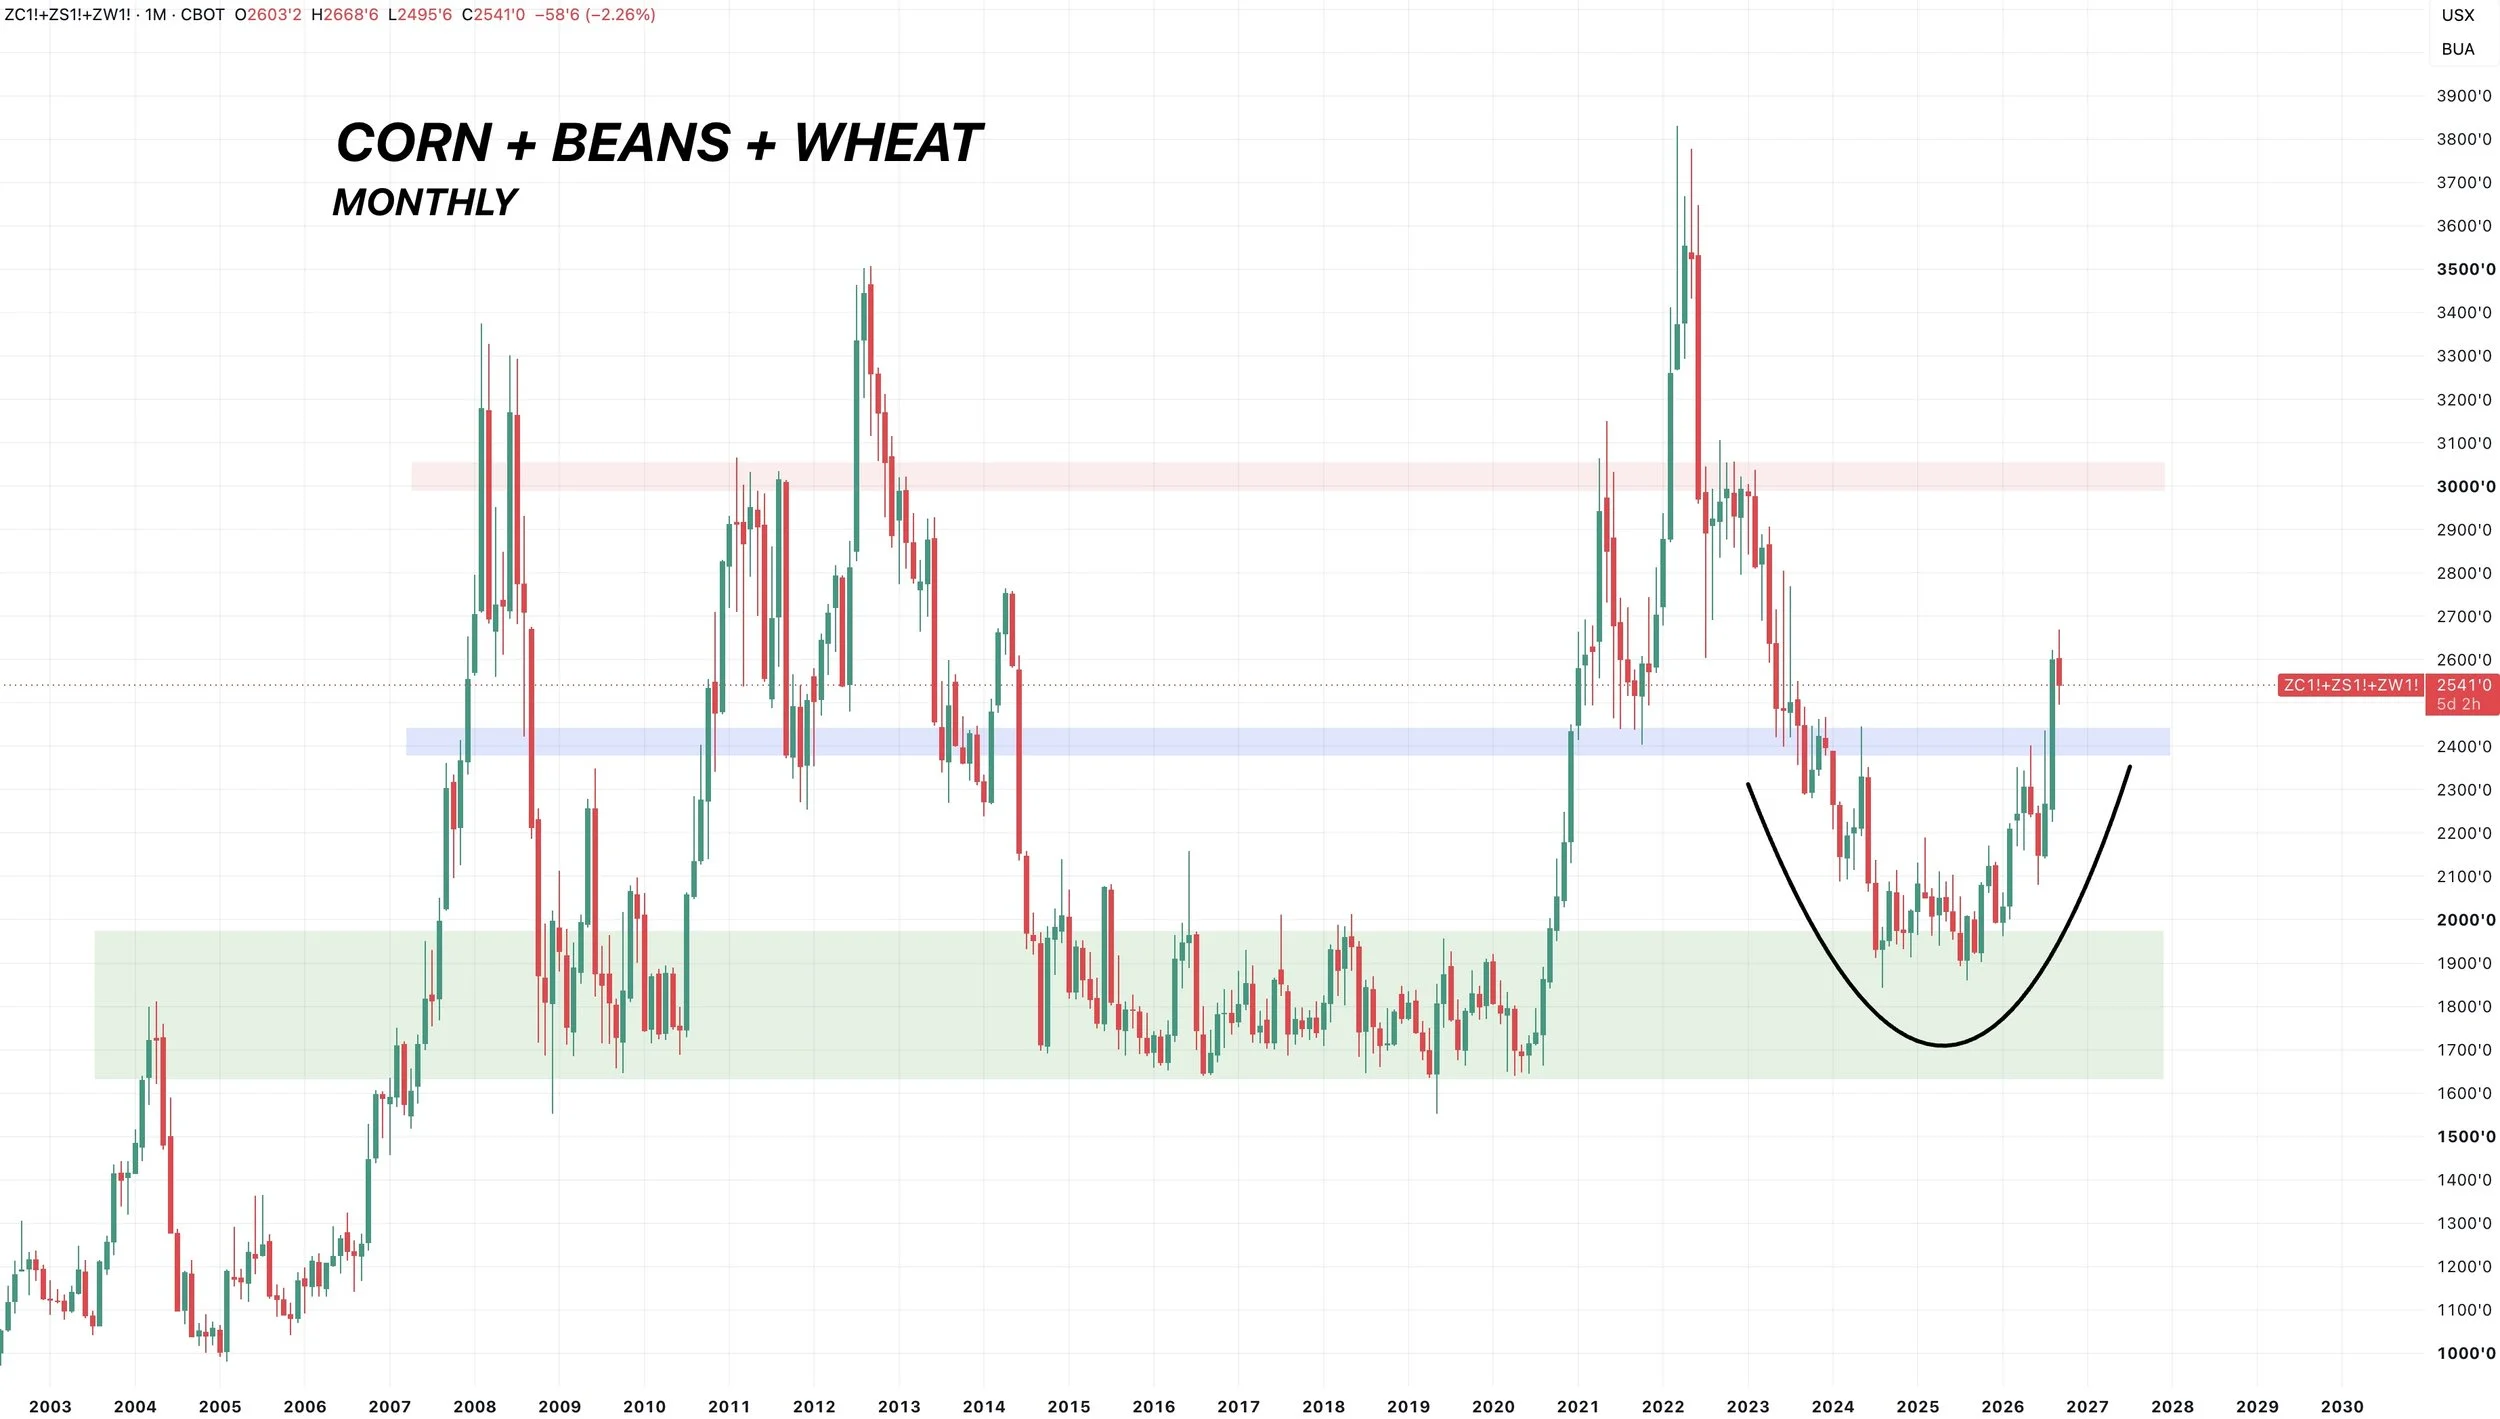
The corn + beans + wheat chart is one of the biggest reasons why I think that grains have a ton of long term potential.
This chart is not bearish and I see plenty of upside.
This is the monthly chart. We just had a very clear breakout.
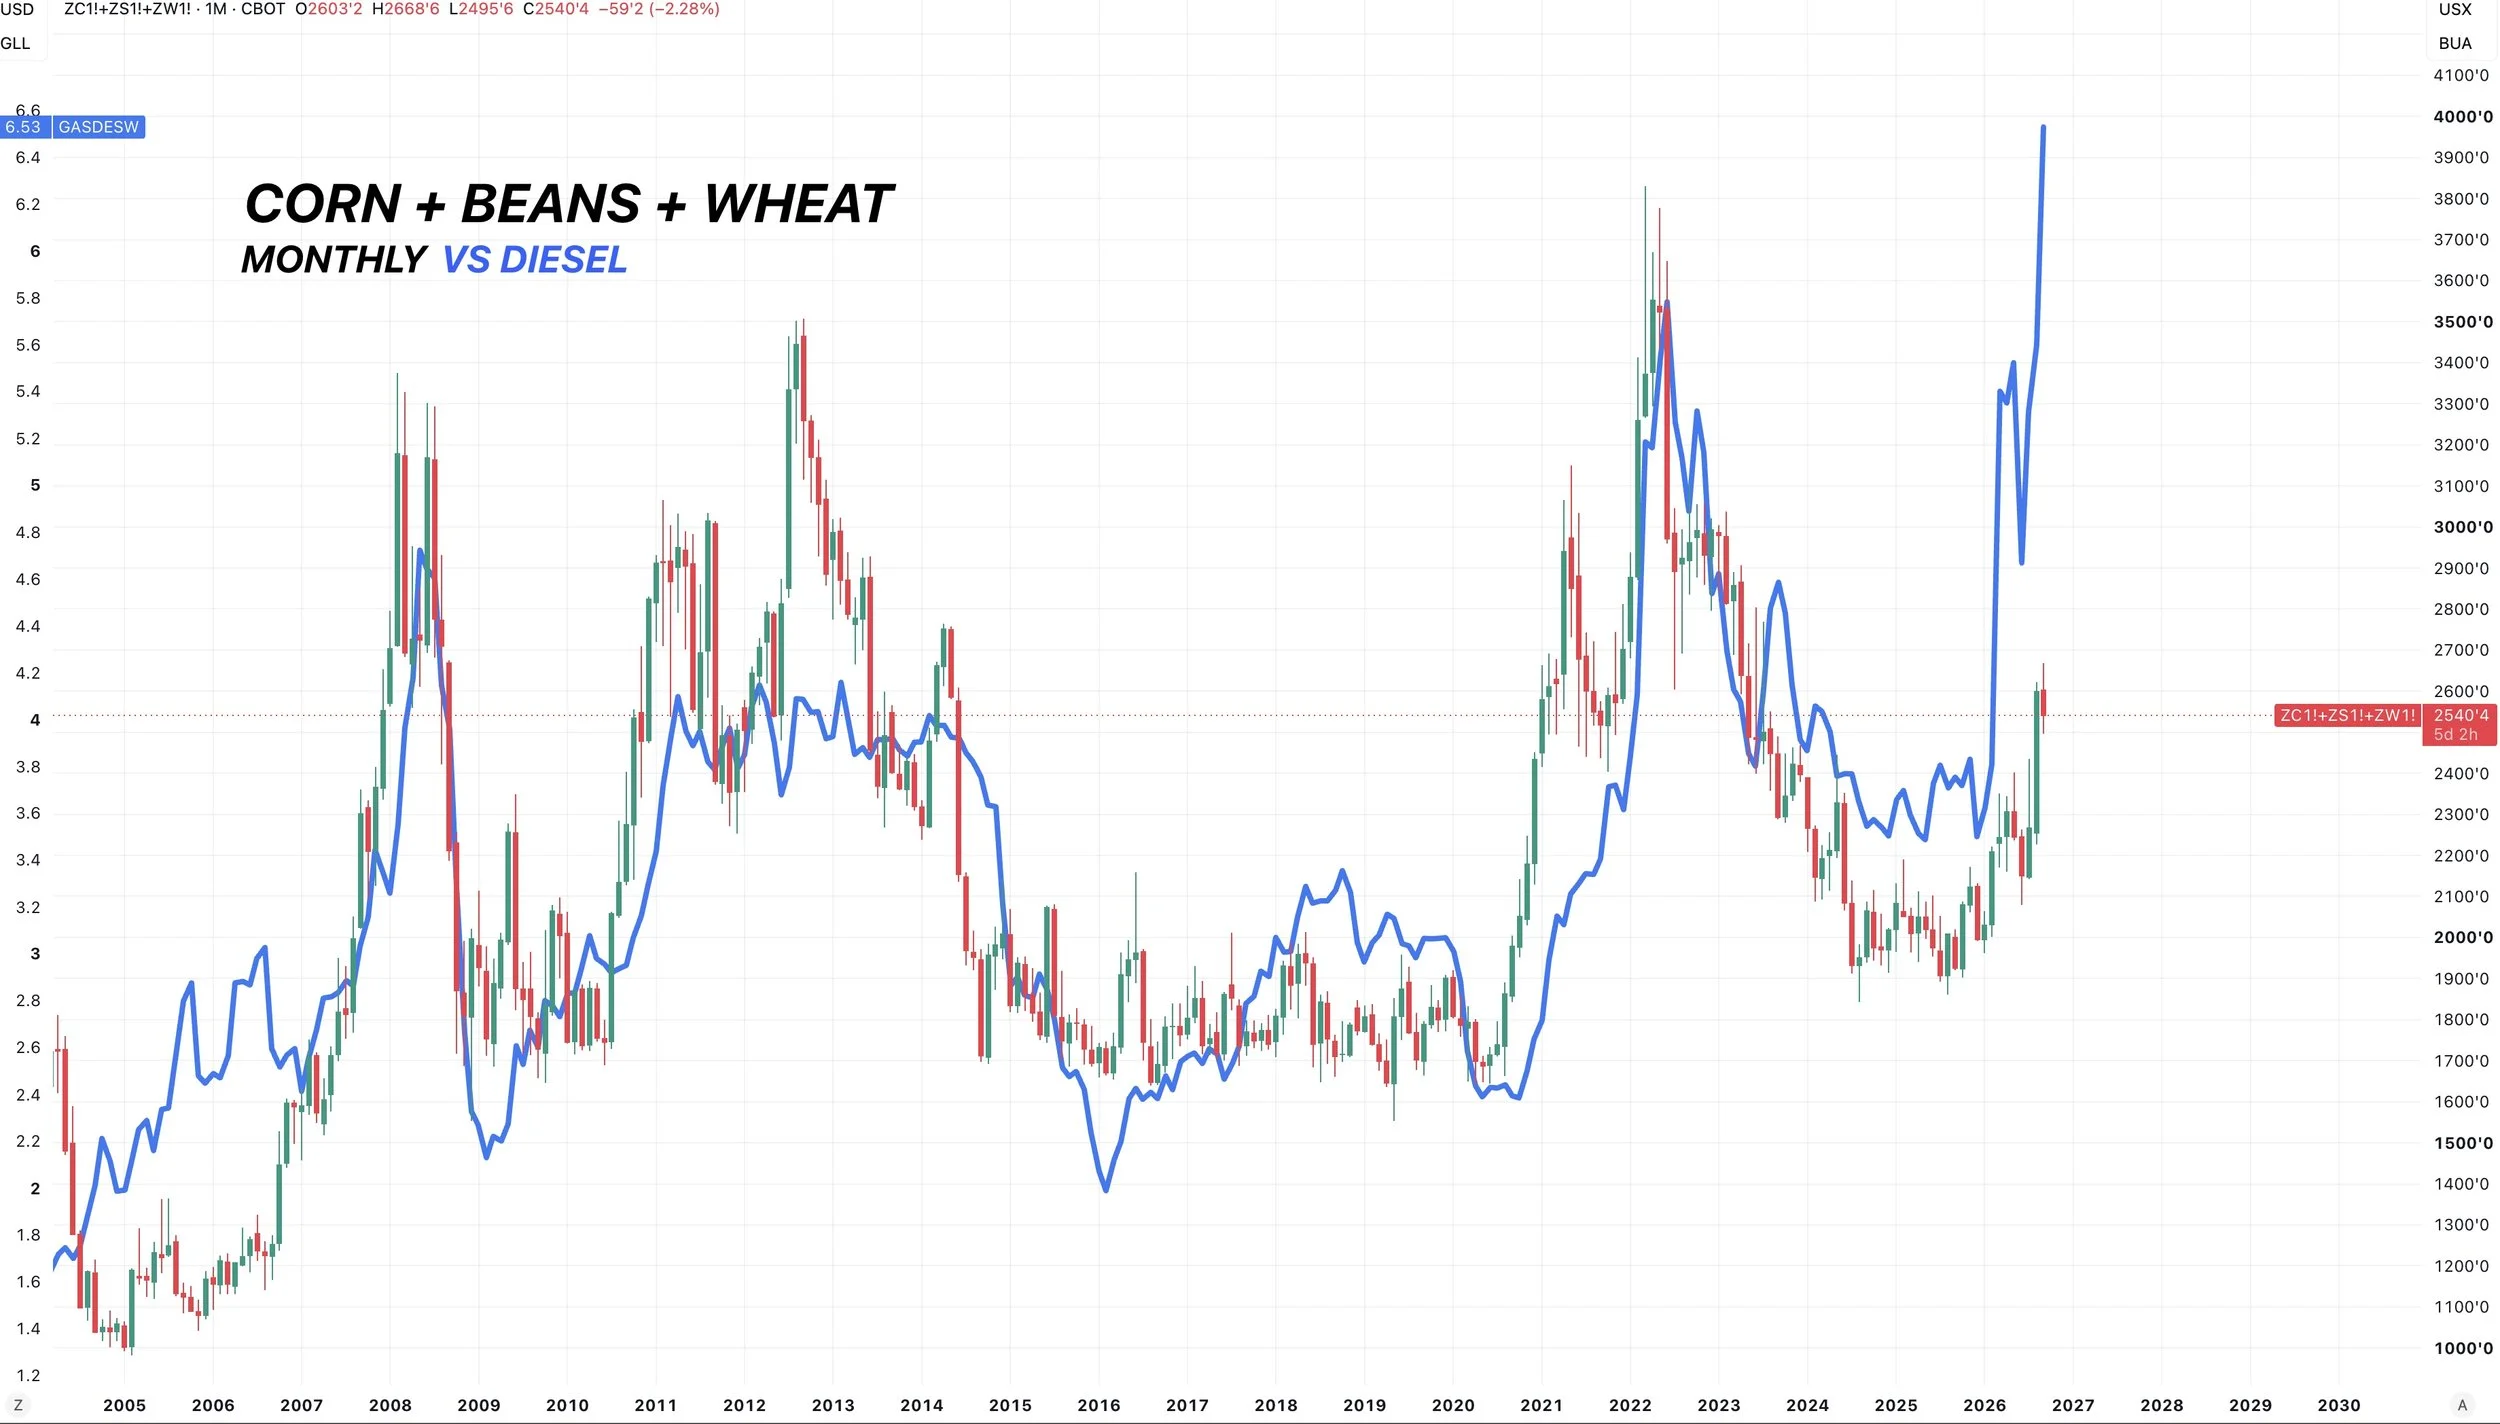
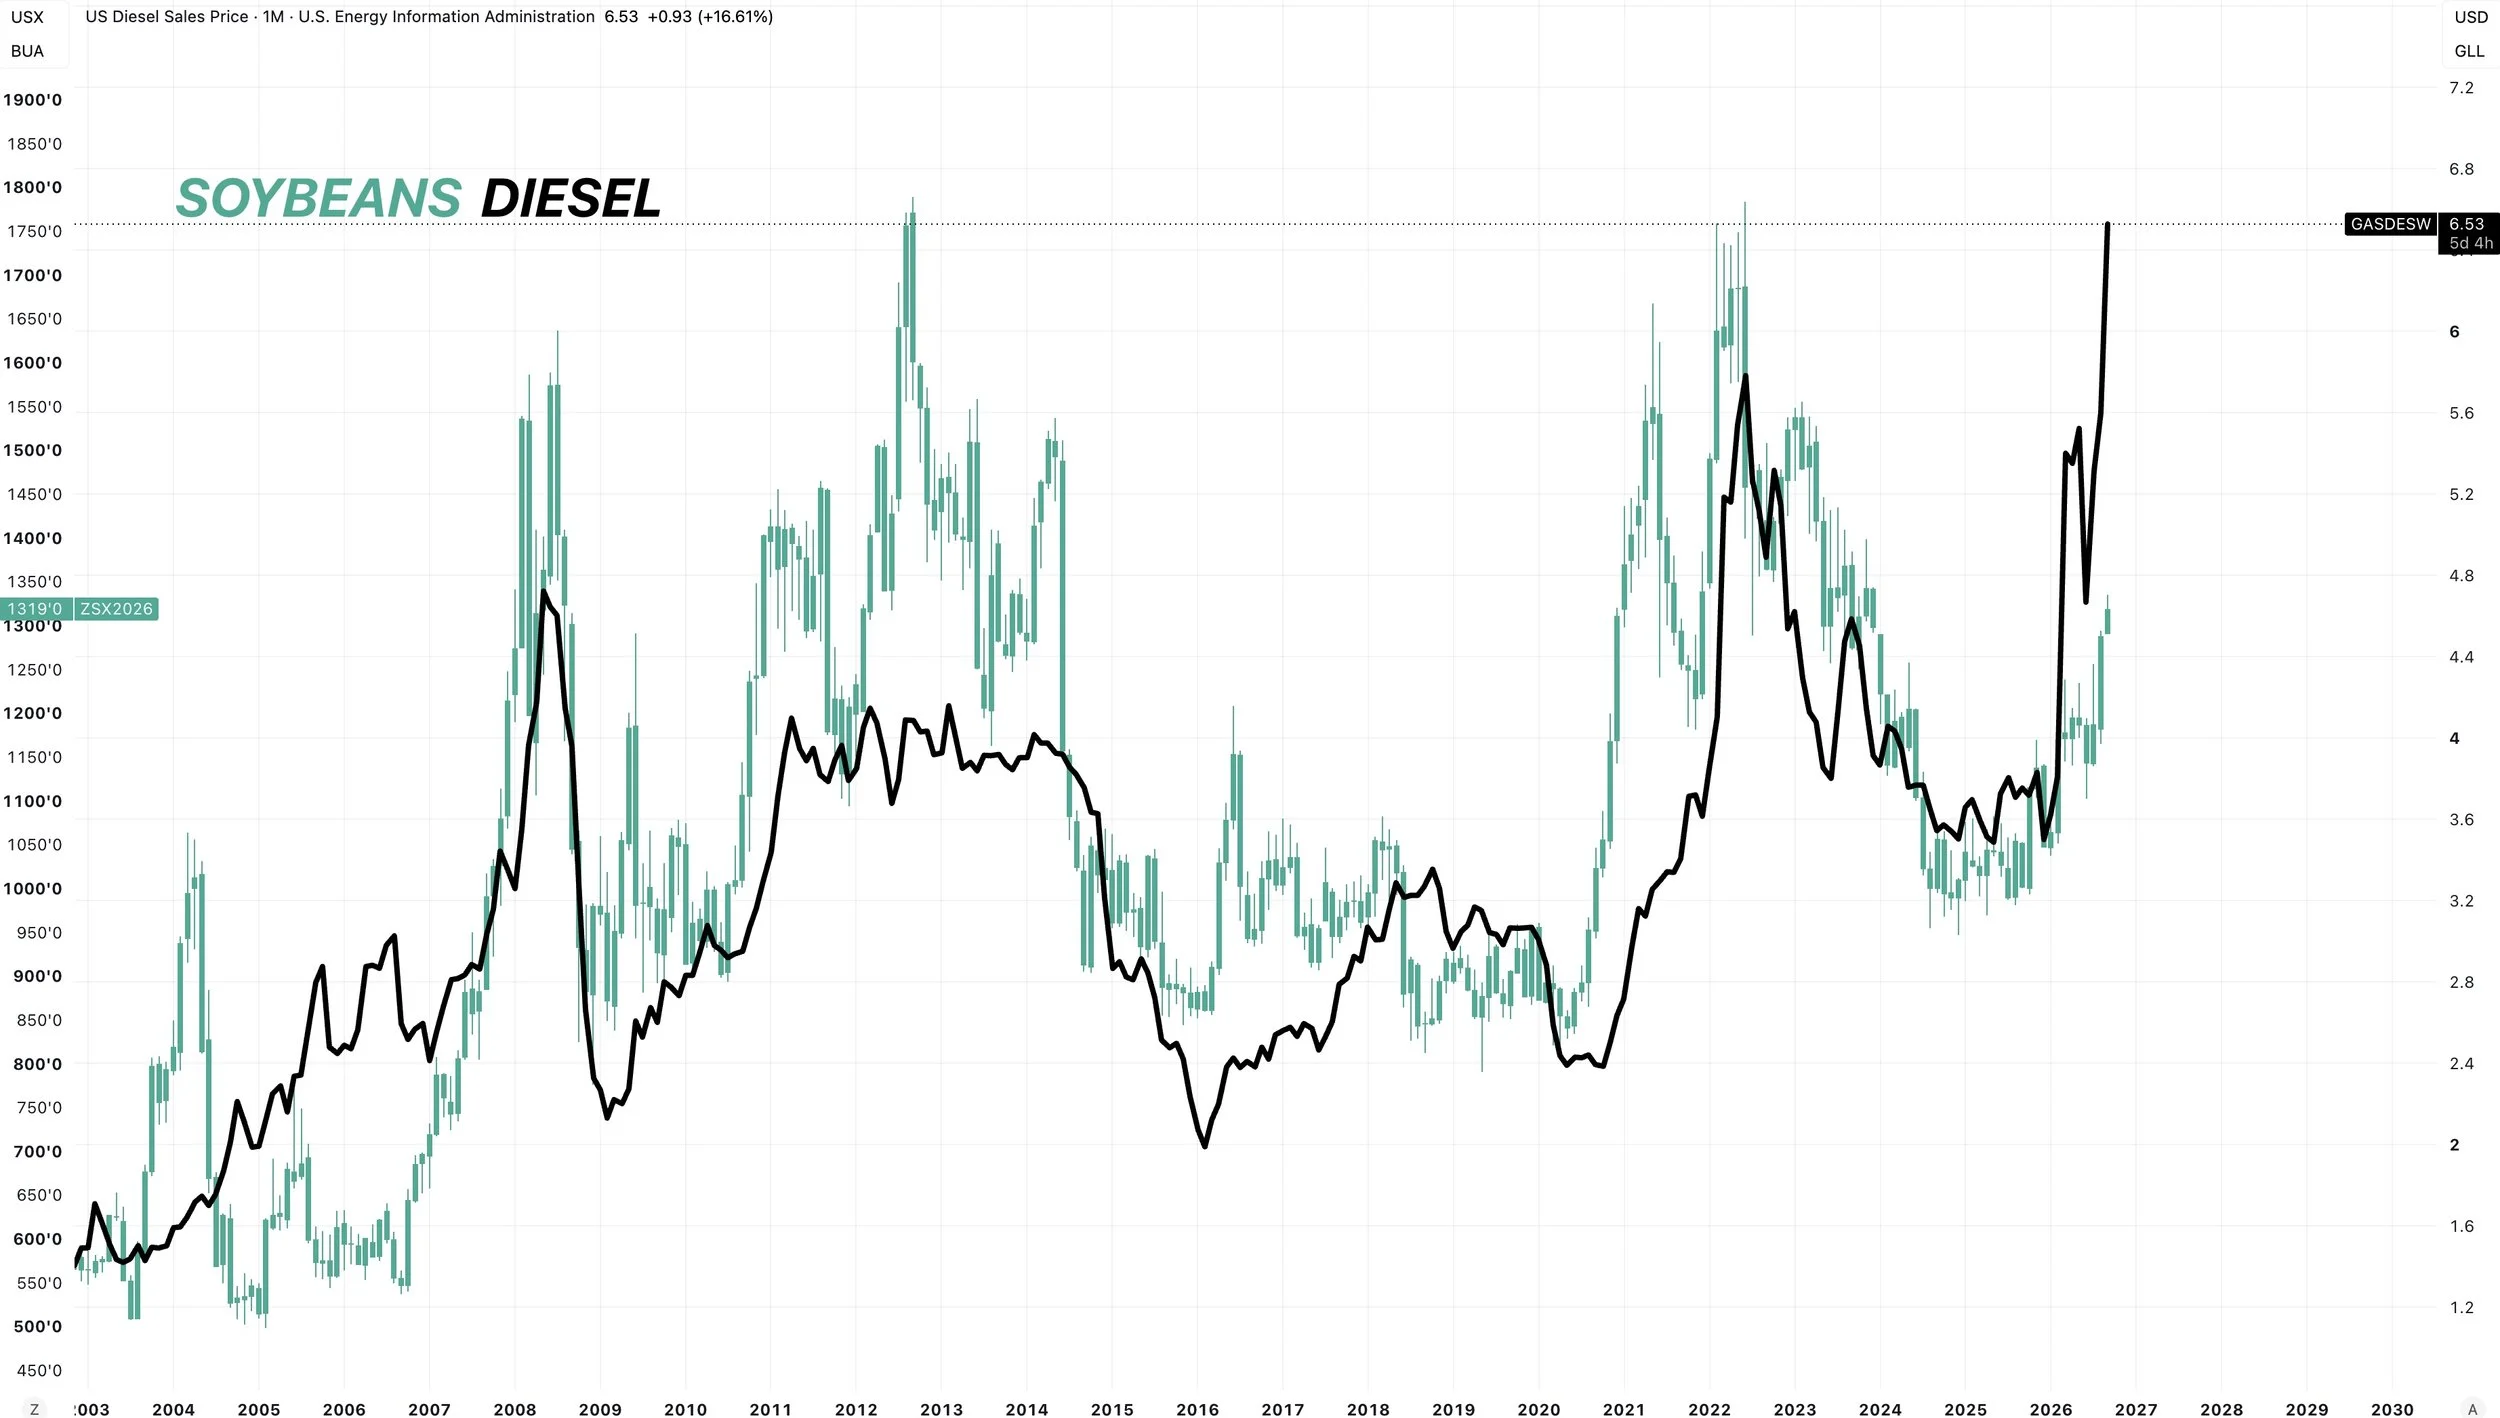
Here is the same chart overlayed with diesel.
High diesel prices and inflation are a very common theme across every bull market in grains.
And I would argue, it looks like grains might need to do some catching up.
Today's Main Takeaways
Corn
Fundamentals:
Nothing much to update fundamentally, as there really isn’t anything we haven’t already covered in the past.
Short term I have been very cautious the last few weeks following that sell alert near $5.50.
Long term corn still has a ton of upside potential.
Here is a brief explanation on the corn story and why it's friendly:
We have the tightest world situation in over a decade, and now we have a tight US situation to add to that bullish possibility.
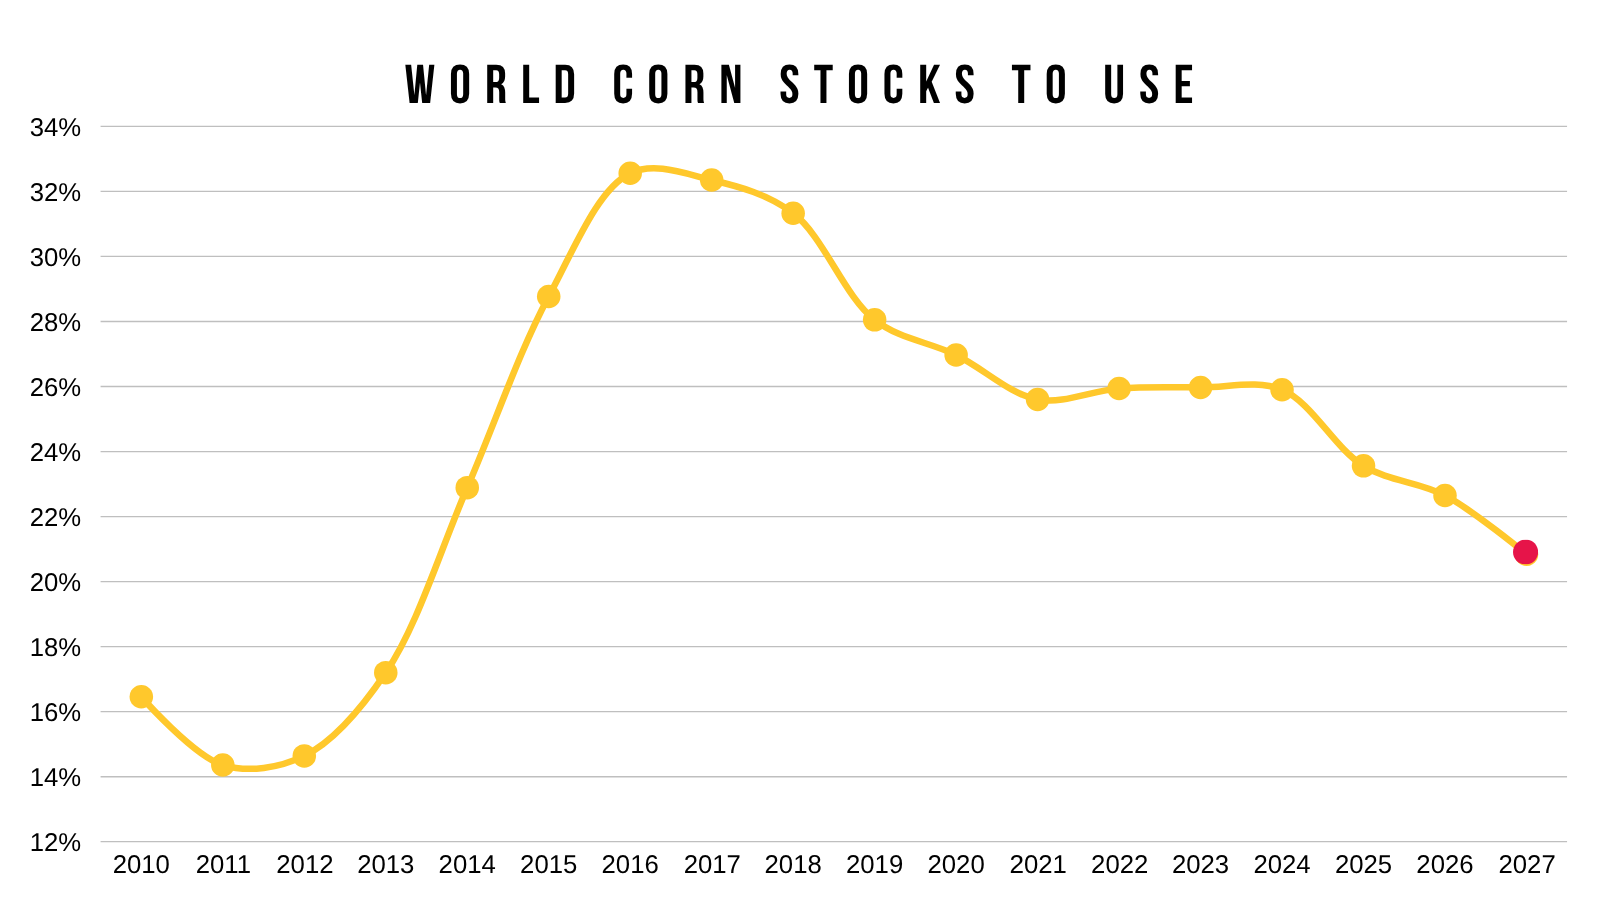
As the stocks to use ratio dropped below 10% for the first time since 2022.
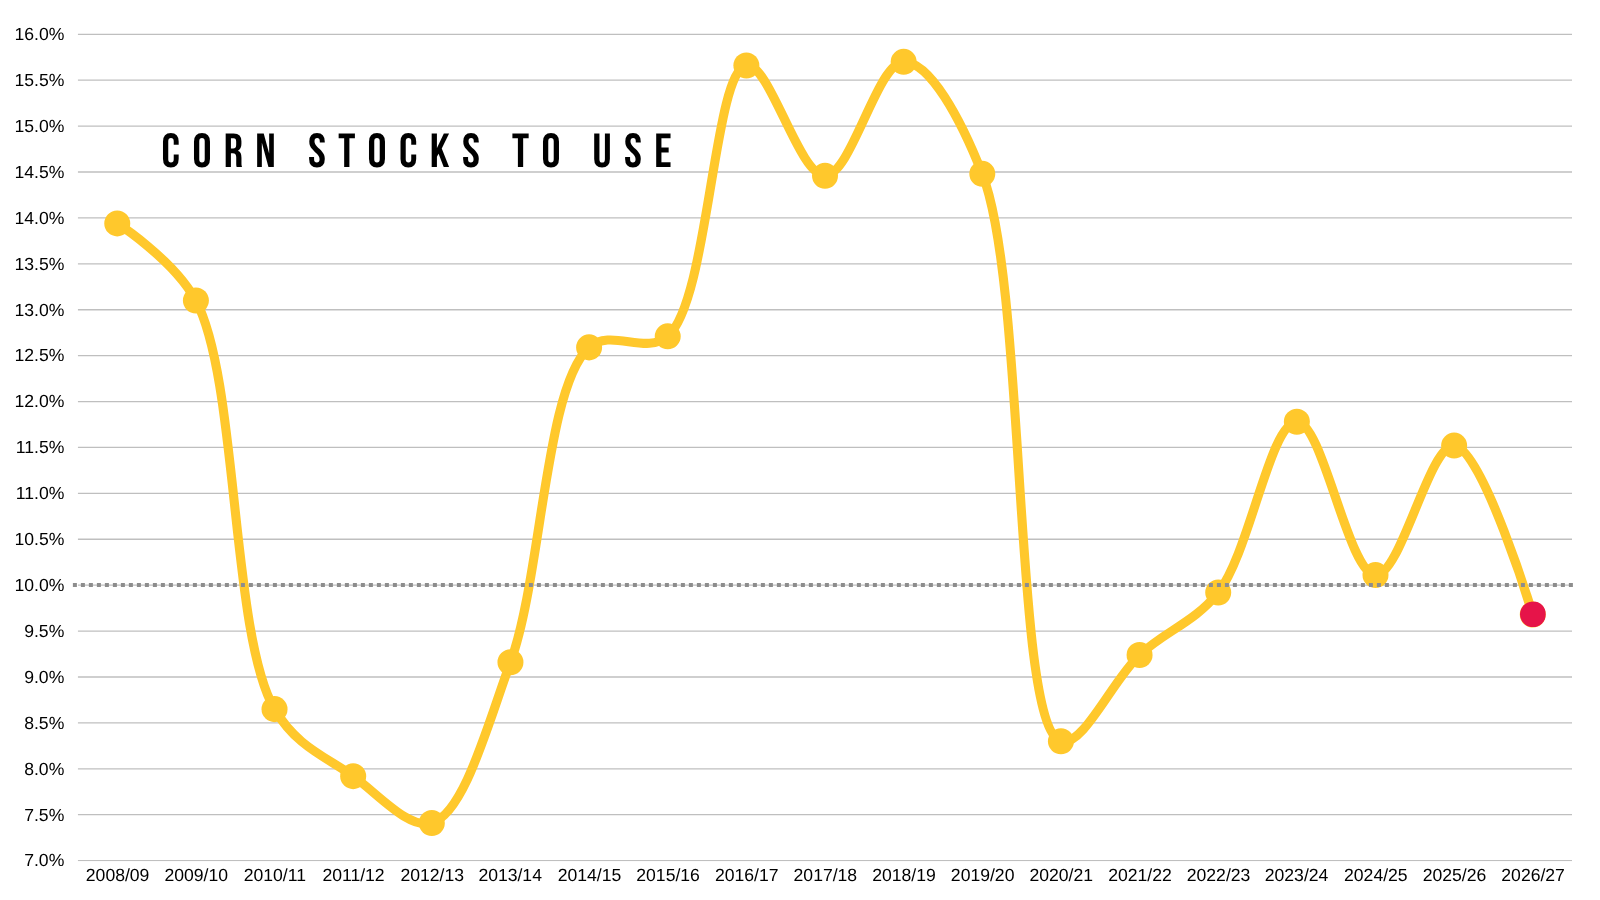
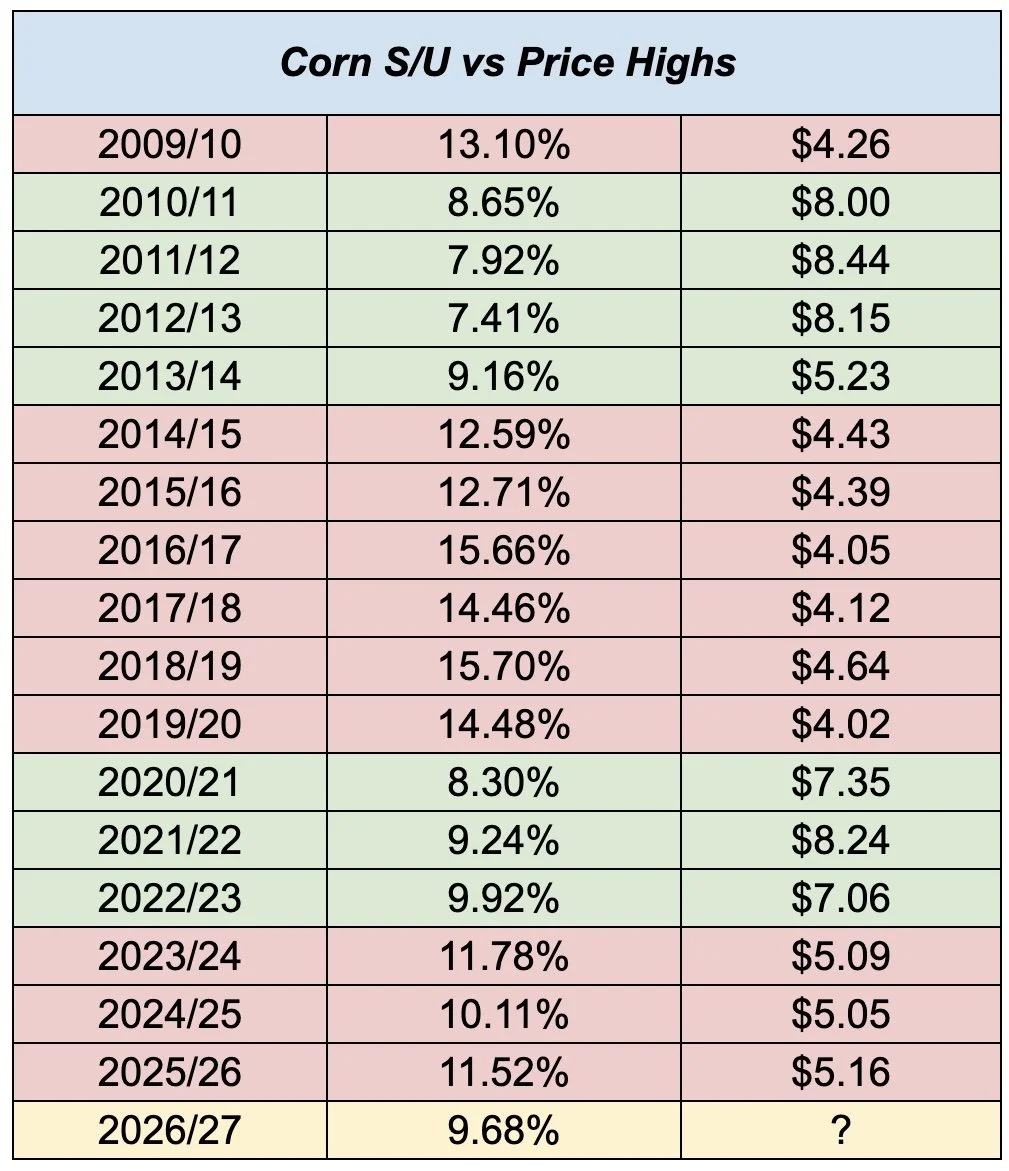
A 9.7% stocks to use brings us into "bull market" territory.
But if that starts creeping towards 8-9% then you're probably in a full blown bull market like we saw in the last two bull markets.
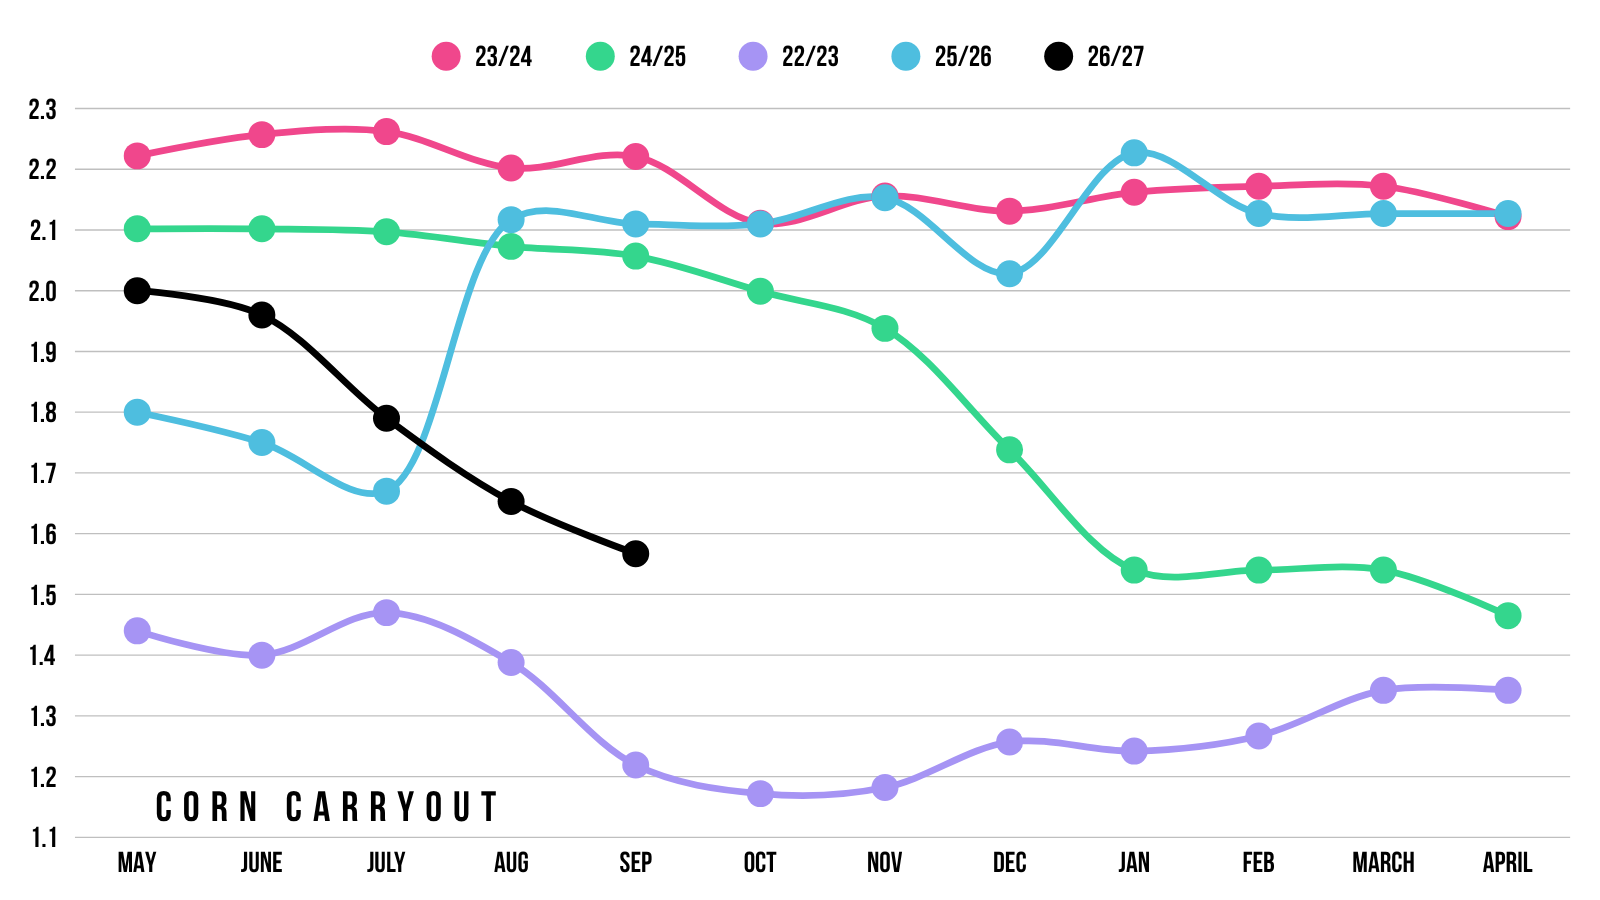
There's still several ways for the balance sheet to get tighter from here whether that's demand and or further reductions in supply.
I don’t think we see yield go higher from here, as small crops have a tendency to get smaller.
The trend for this crop and new crop balance sheet has consistently been tighter and tighter every month.
So I expect that to continue.
The USDA says we're going to have worse demand than last year, but I don’t think we've seen prices go high enough to discourage demand.
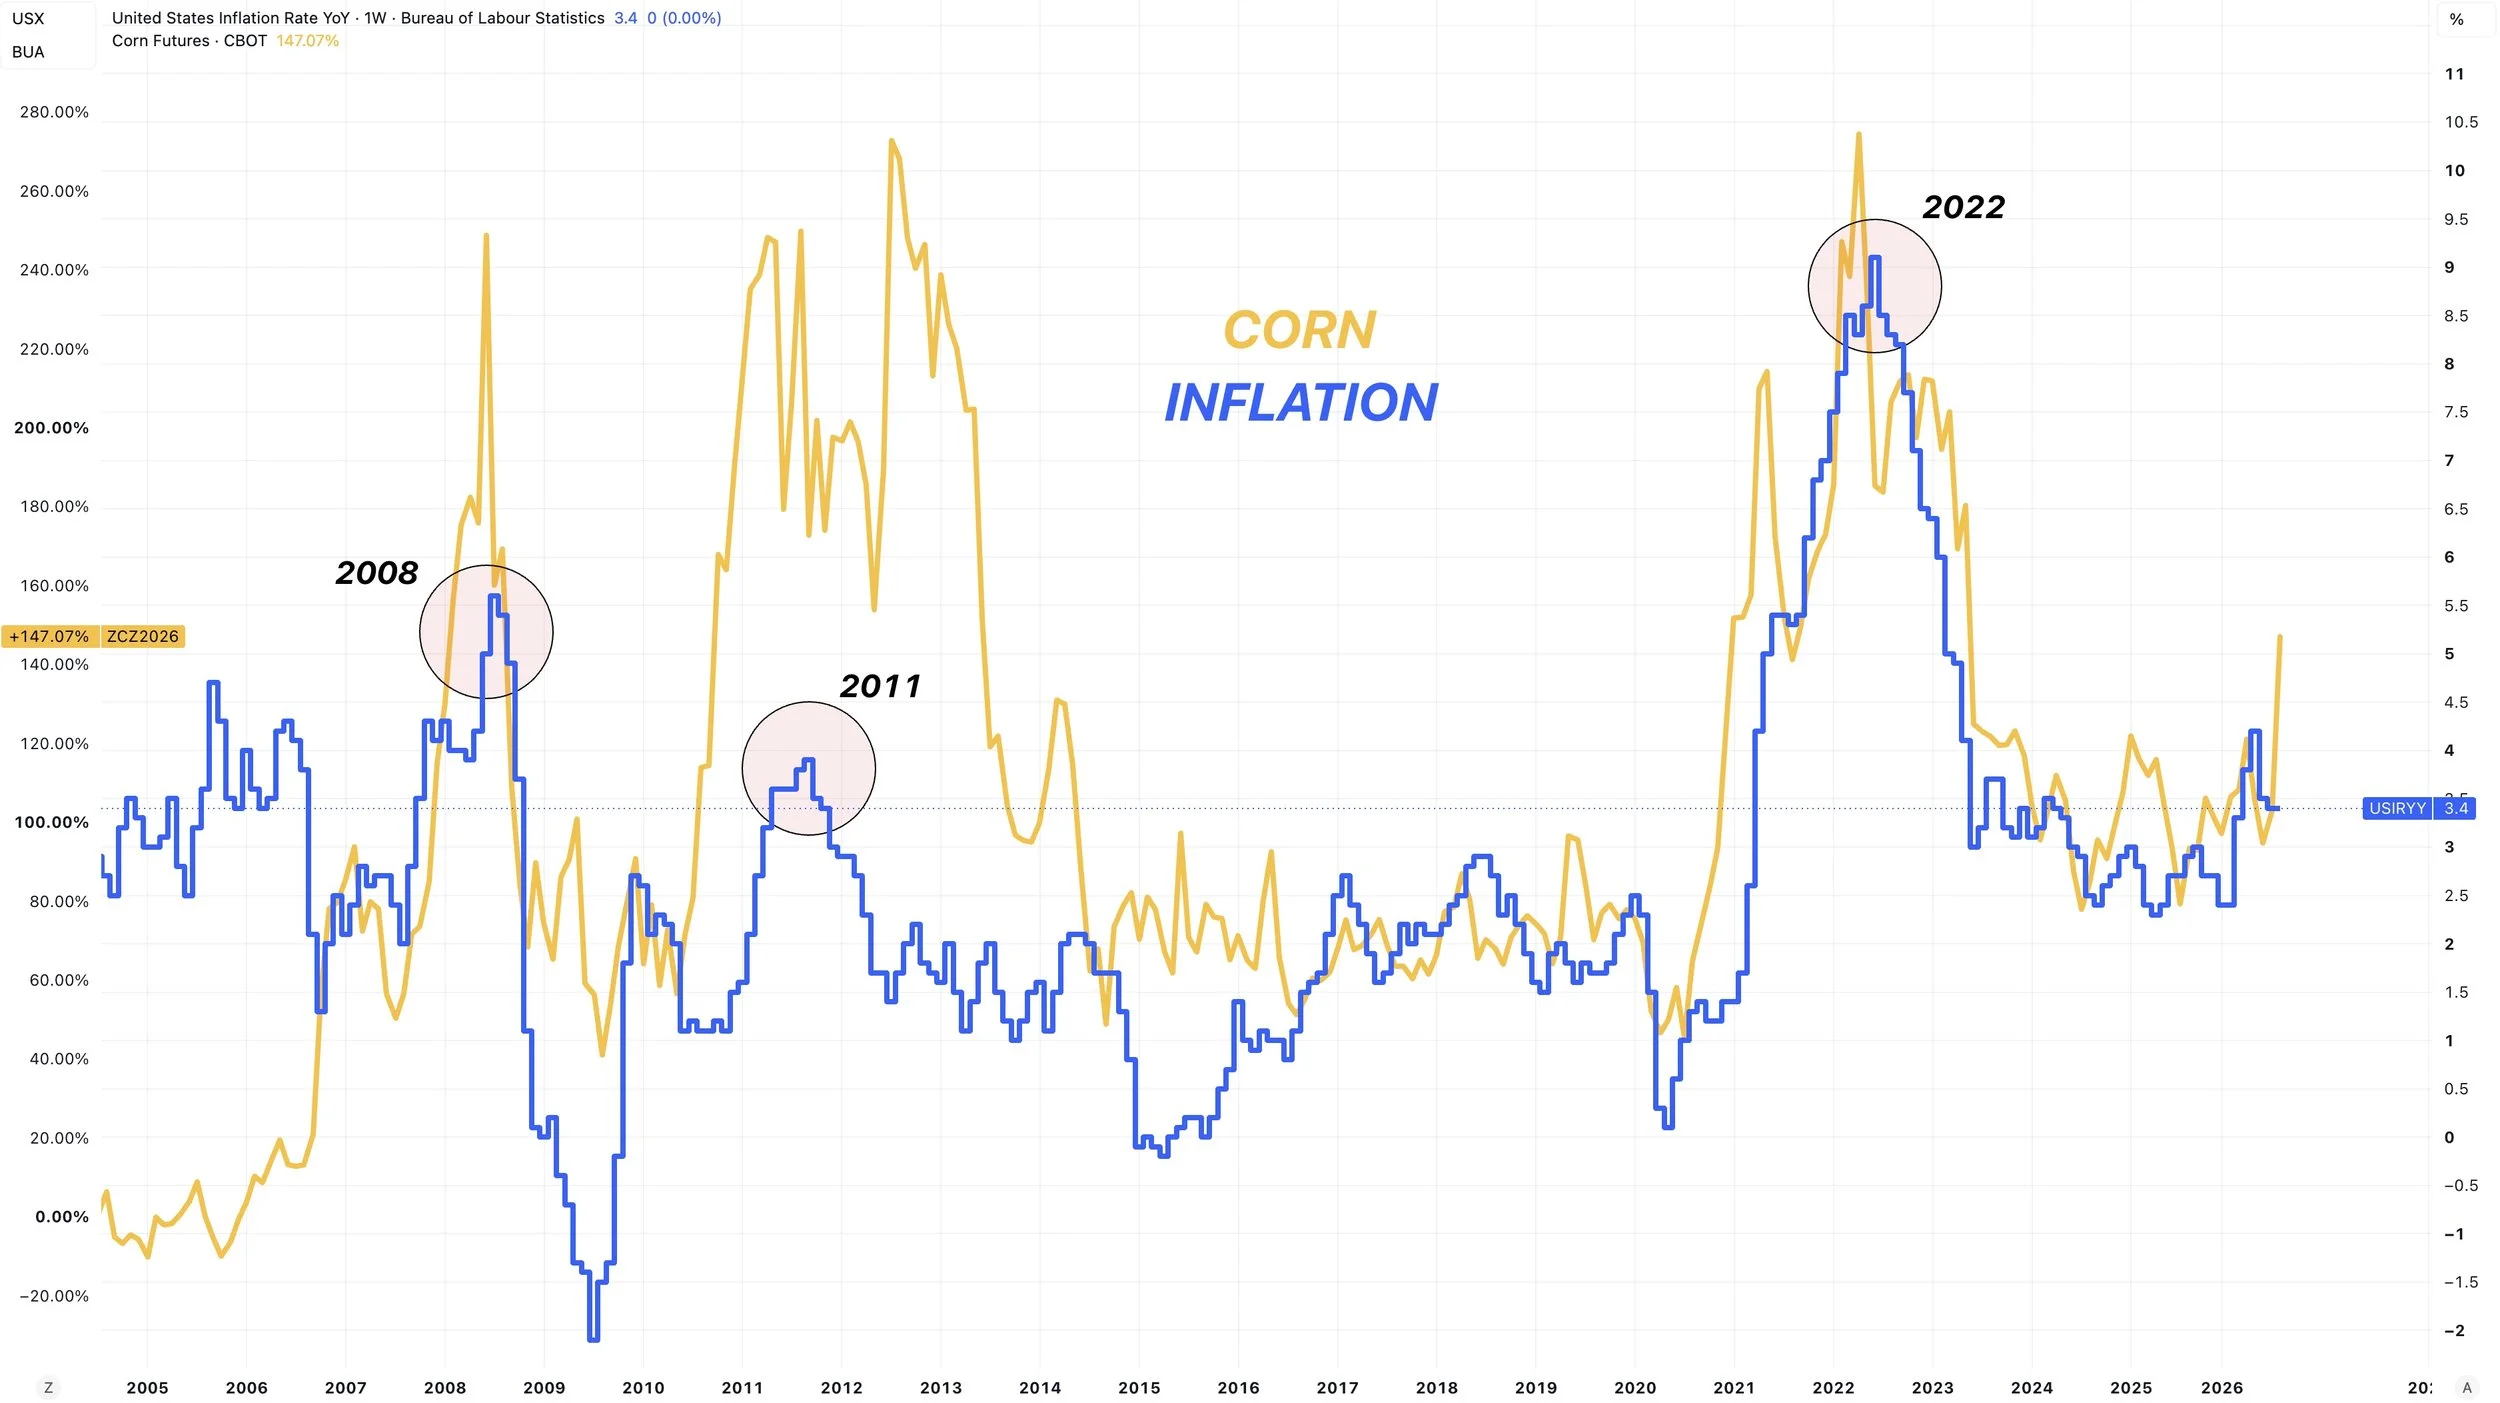
Inflation has been rising. Diesel prices are at all time highs. I don’t think the inflation story is over.
Every bull market has had some sort of inflation story.
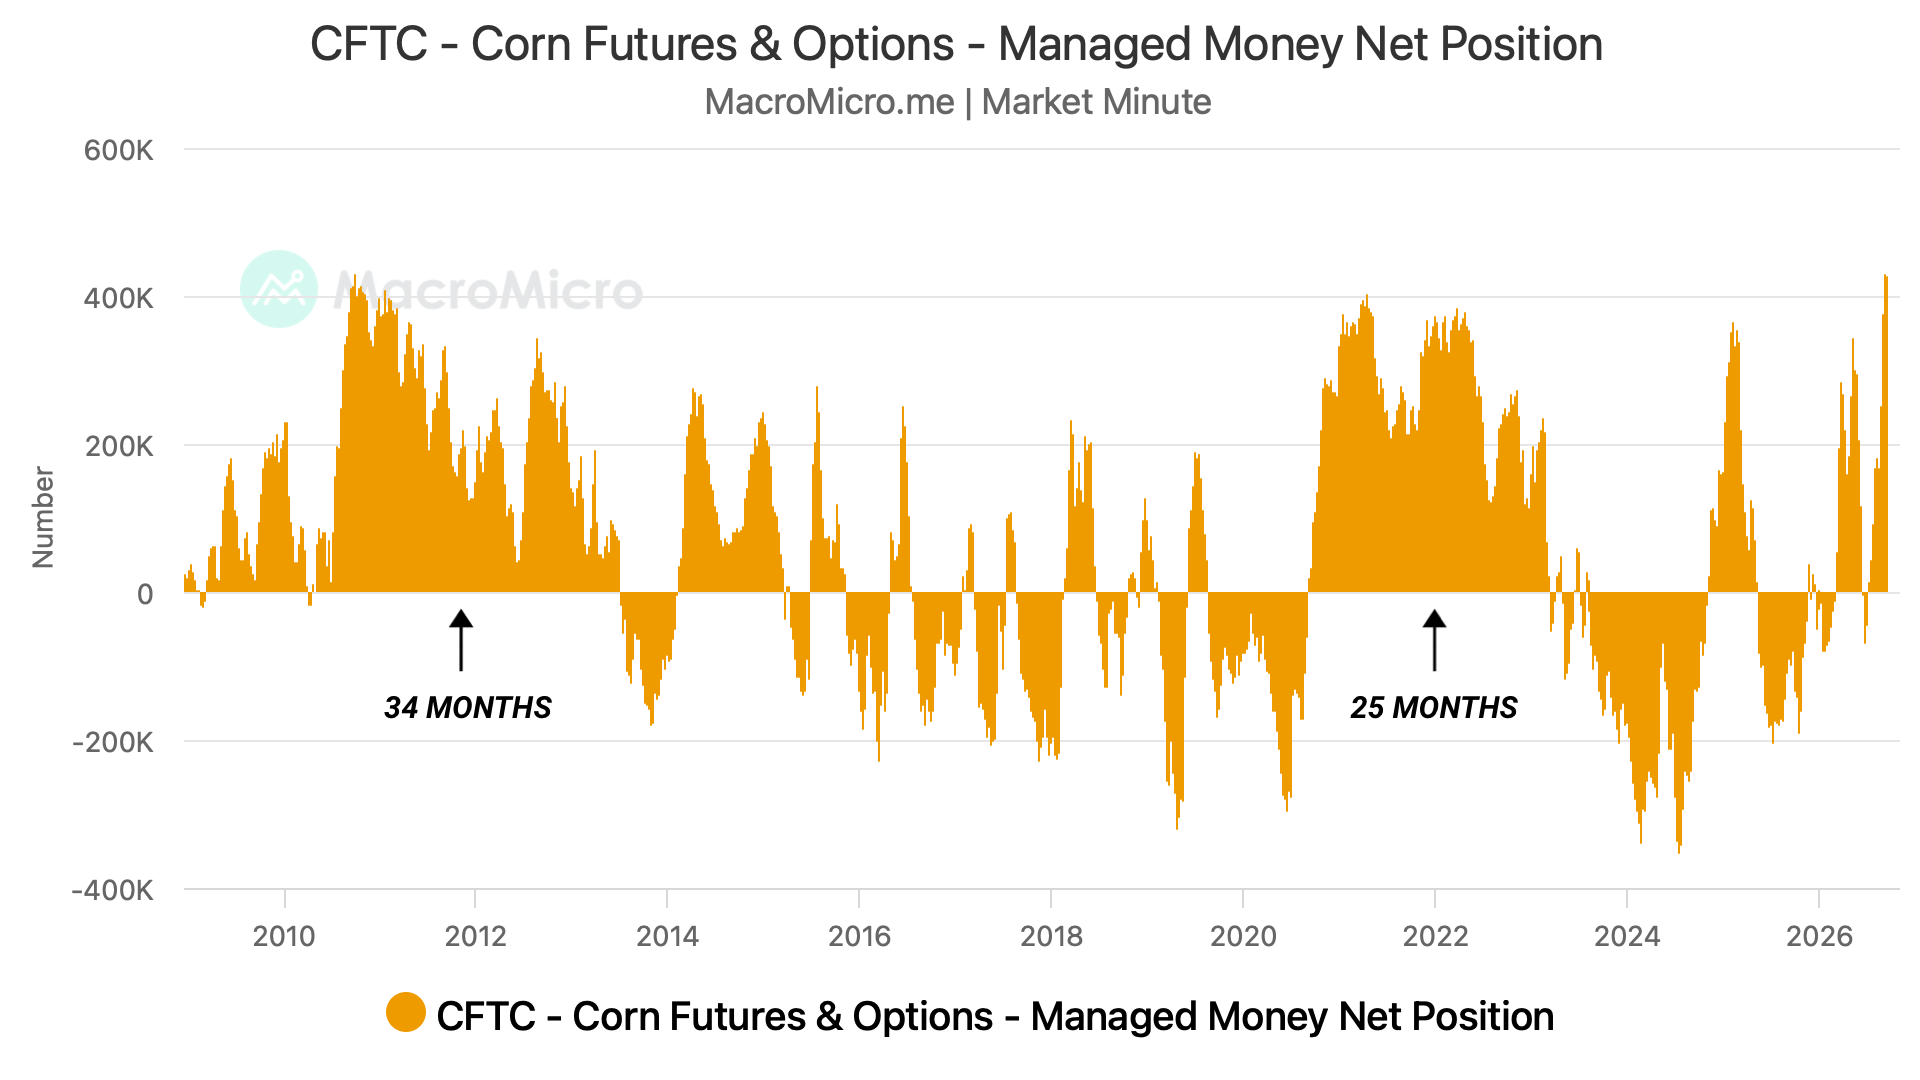
The funds are record long.
You could argue there is a risk they liquidate. Which is always a possible concern.
But the last two times they were this long, they didn’t give up that position without a fight.
As they held that long position for 2-3 years.
I'm sure we will see plenty of times where they take profits, but I don’t see them getting short soon.
You don’t buy a record amount of something because you think it's going down.
Lastly, you have the Super El Niño and the impacts that could potentially have on the rest of the world. Which I'll touch on a little more later.
I have no idea if China's going to buy corn or not. Even if they don’t, corn still has a story on it's own.
There are plenty of reasons to believe the corn story is just getting started long term.
Corn Charts
Dec Corn Daily Chart:
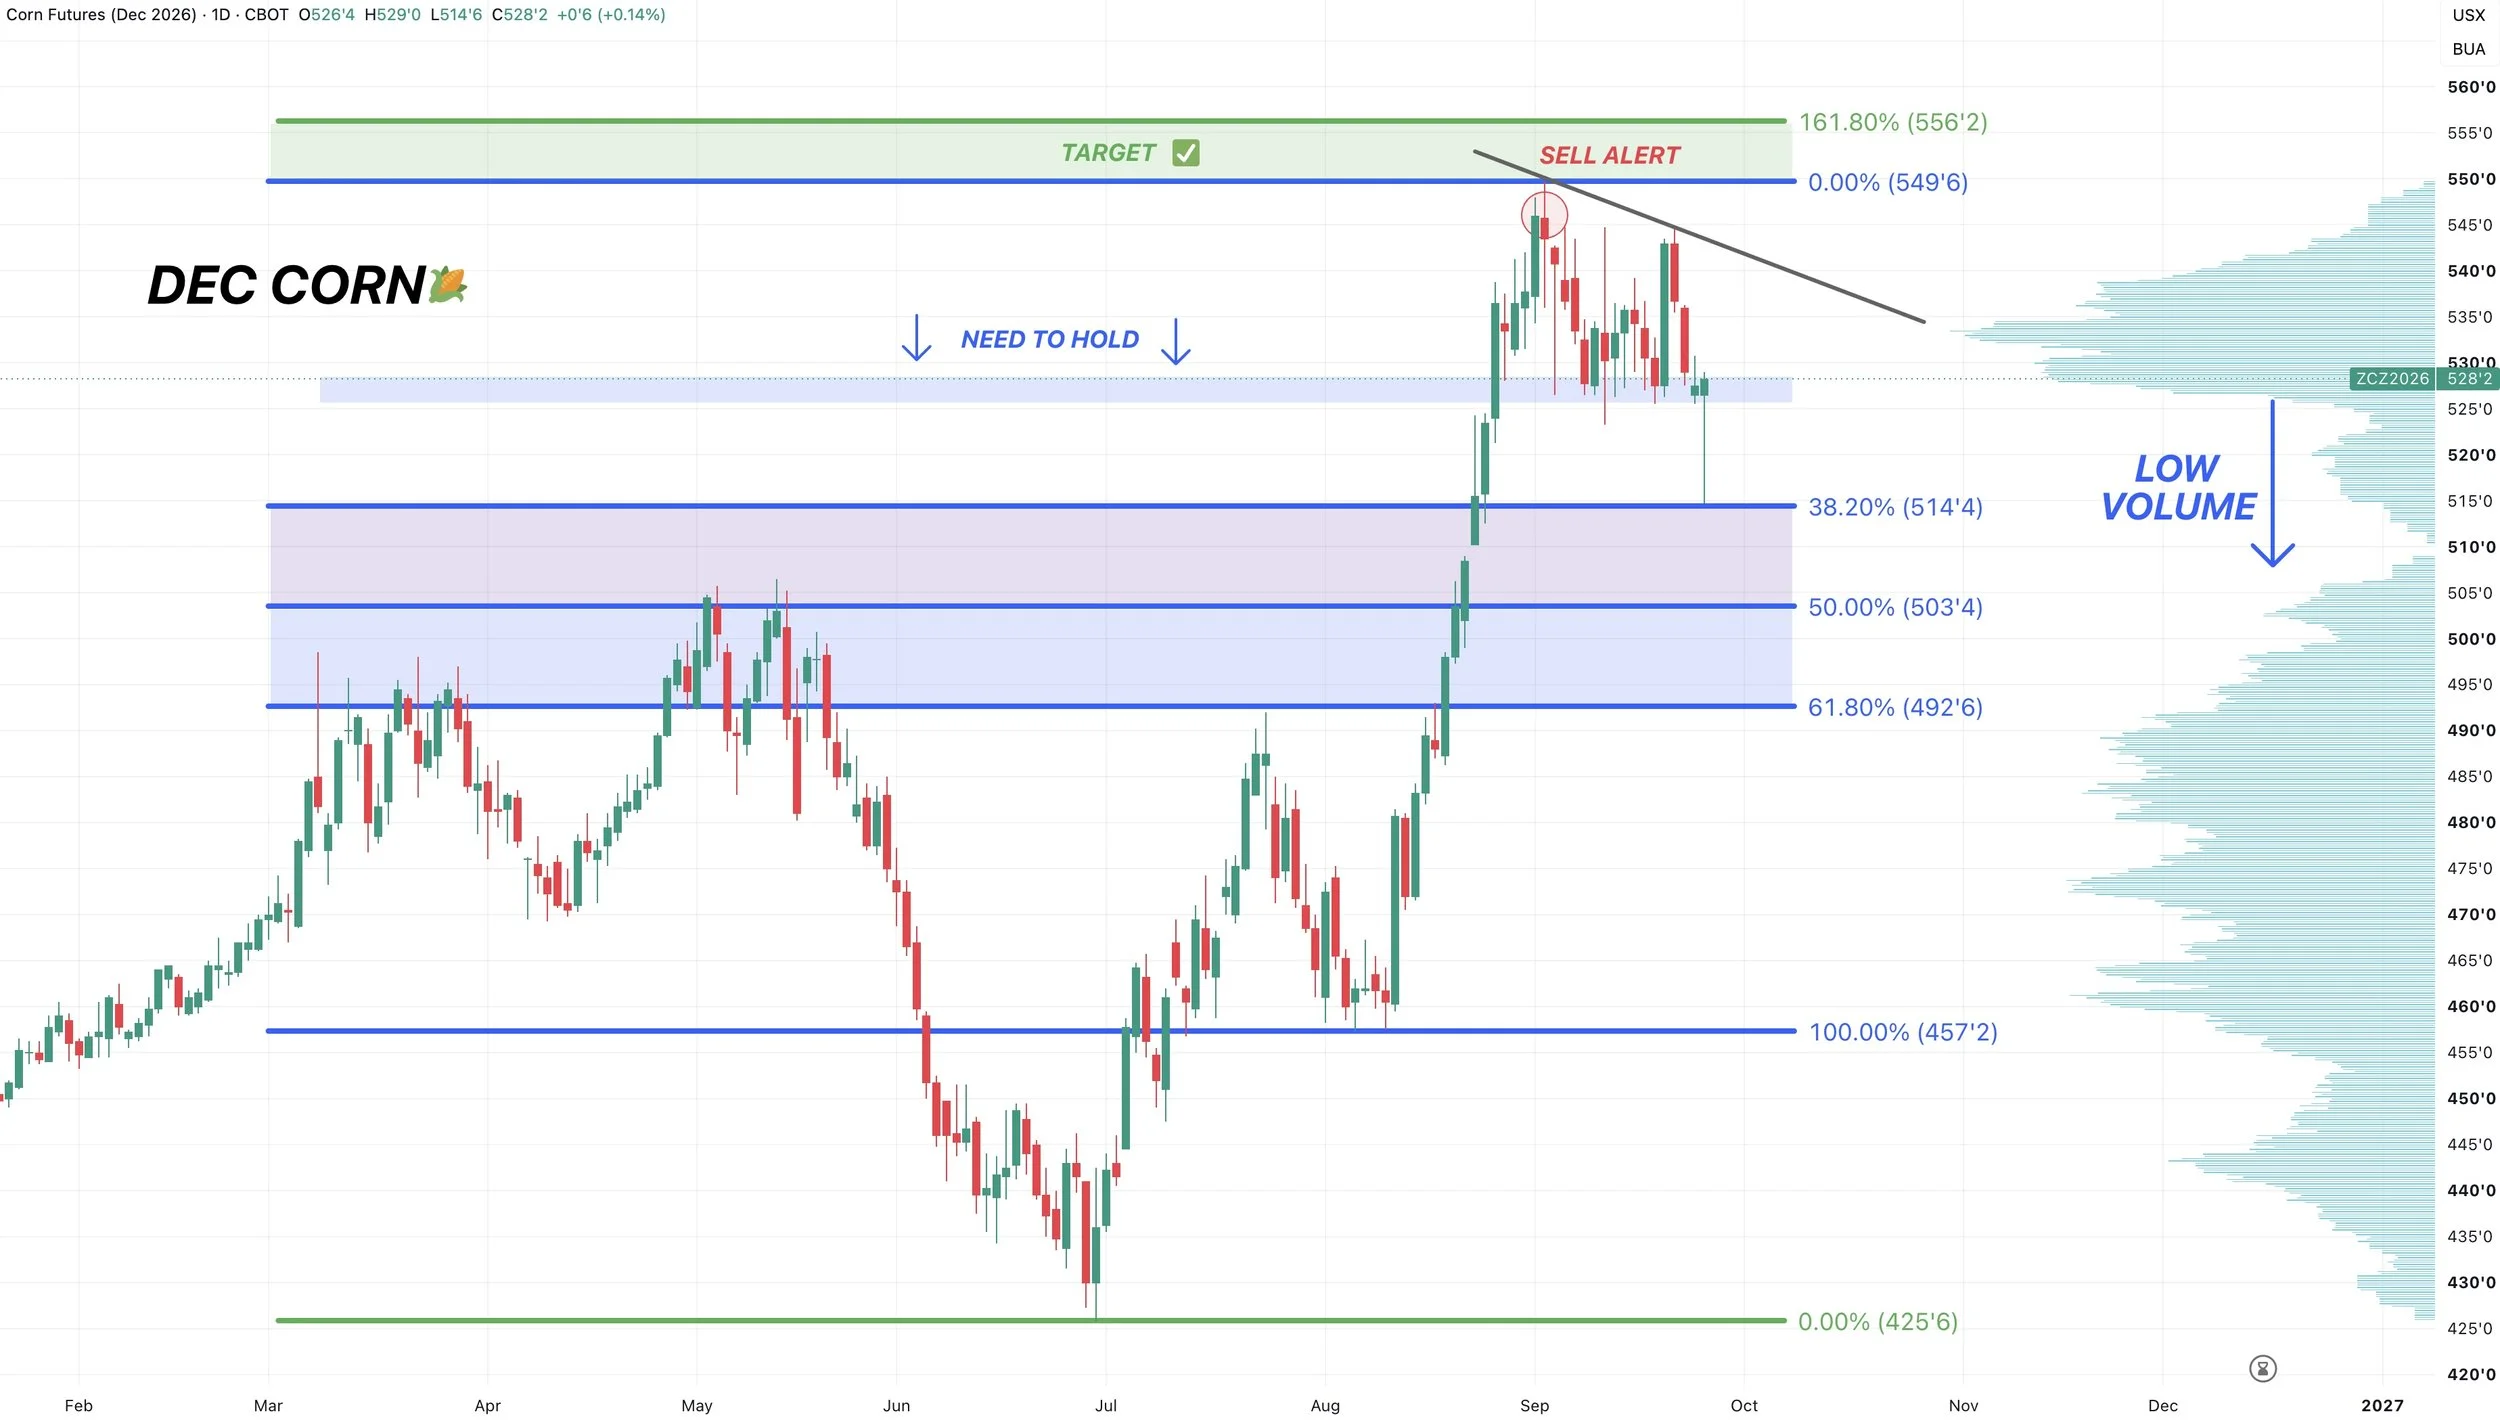
Very impressive day on the charts.
We broke that key support. It opened the flood gates lower as there was zero volume under that support.
As we had been saying, since there was no volume, breaking that support would lead to us dropping quick.
We then dropped all the way down to $5.14 at the 38.2% retracement level before reversing and ending the day somehow higher by a penny.
That would be considered a possible bear trap if we are able to follow this up with more strength, which was something Jeremey talked about in his audio yesterday.
We broke major support, but then rallied and reclaimed it. That is not a bad sign.
As for what happens next, a big part is of course just going to be what comes out of the China meeting details.
That 38.2% to 50% level has been my downside target for the correction to end. So it was technically deep enough for it to be a bottom. However, I would like to see some upside follow through before getting overly confident.
The key thing to watch is still this major support that we somehow reclaimed and held today.
If we start to get some closes under this level, there is still very little support below.
But you cannot hate the price action today, as that dip was bought aggressively.
Monday's price action will likely be pretty telling and give us a better grip on if this was simply a bear trap today or not.
Weekly Chart:
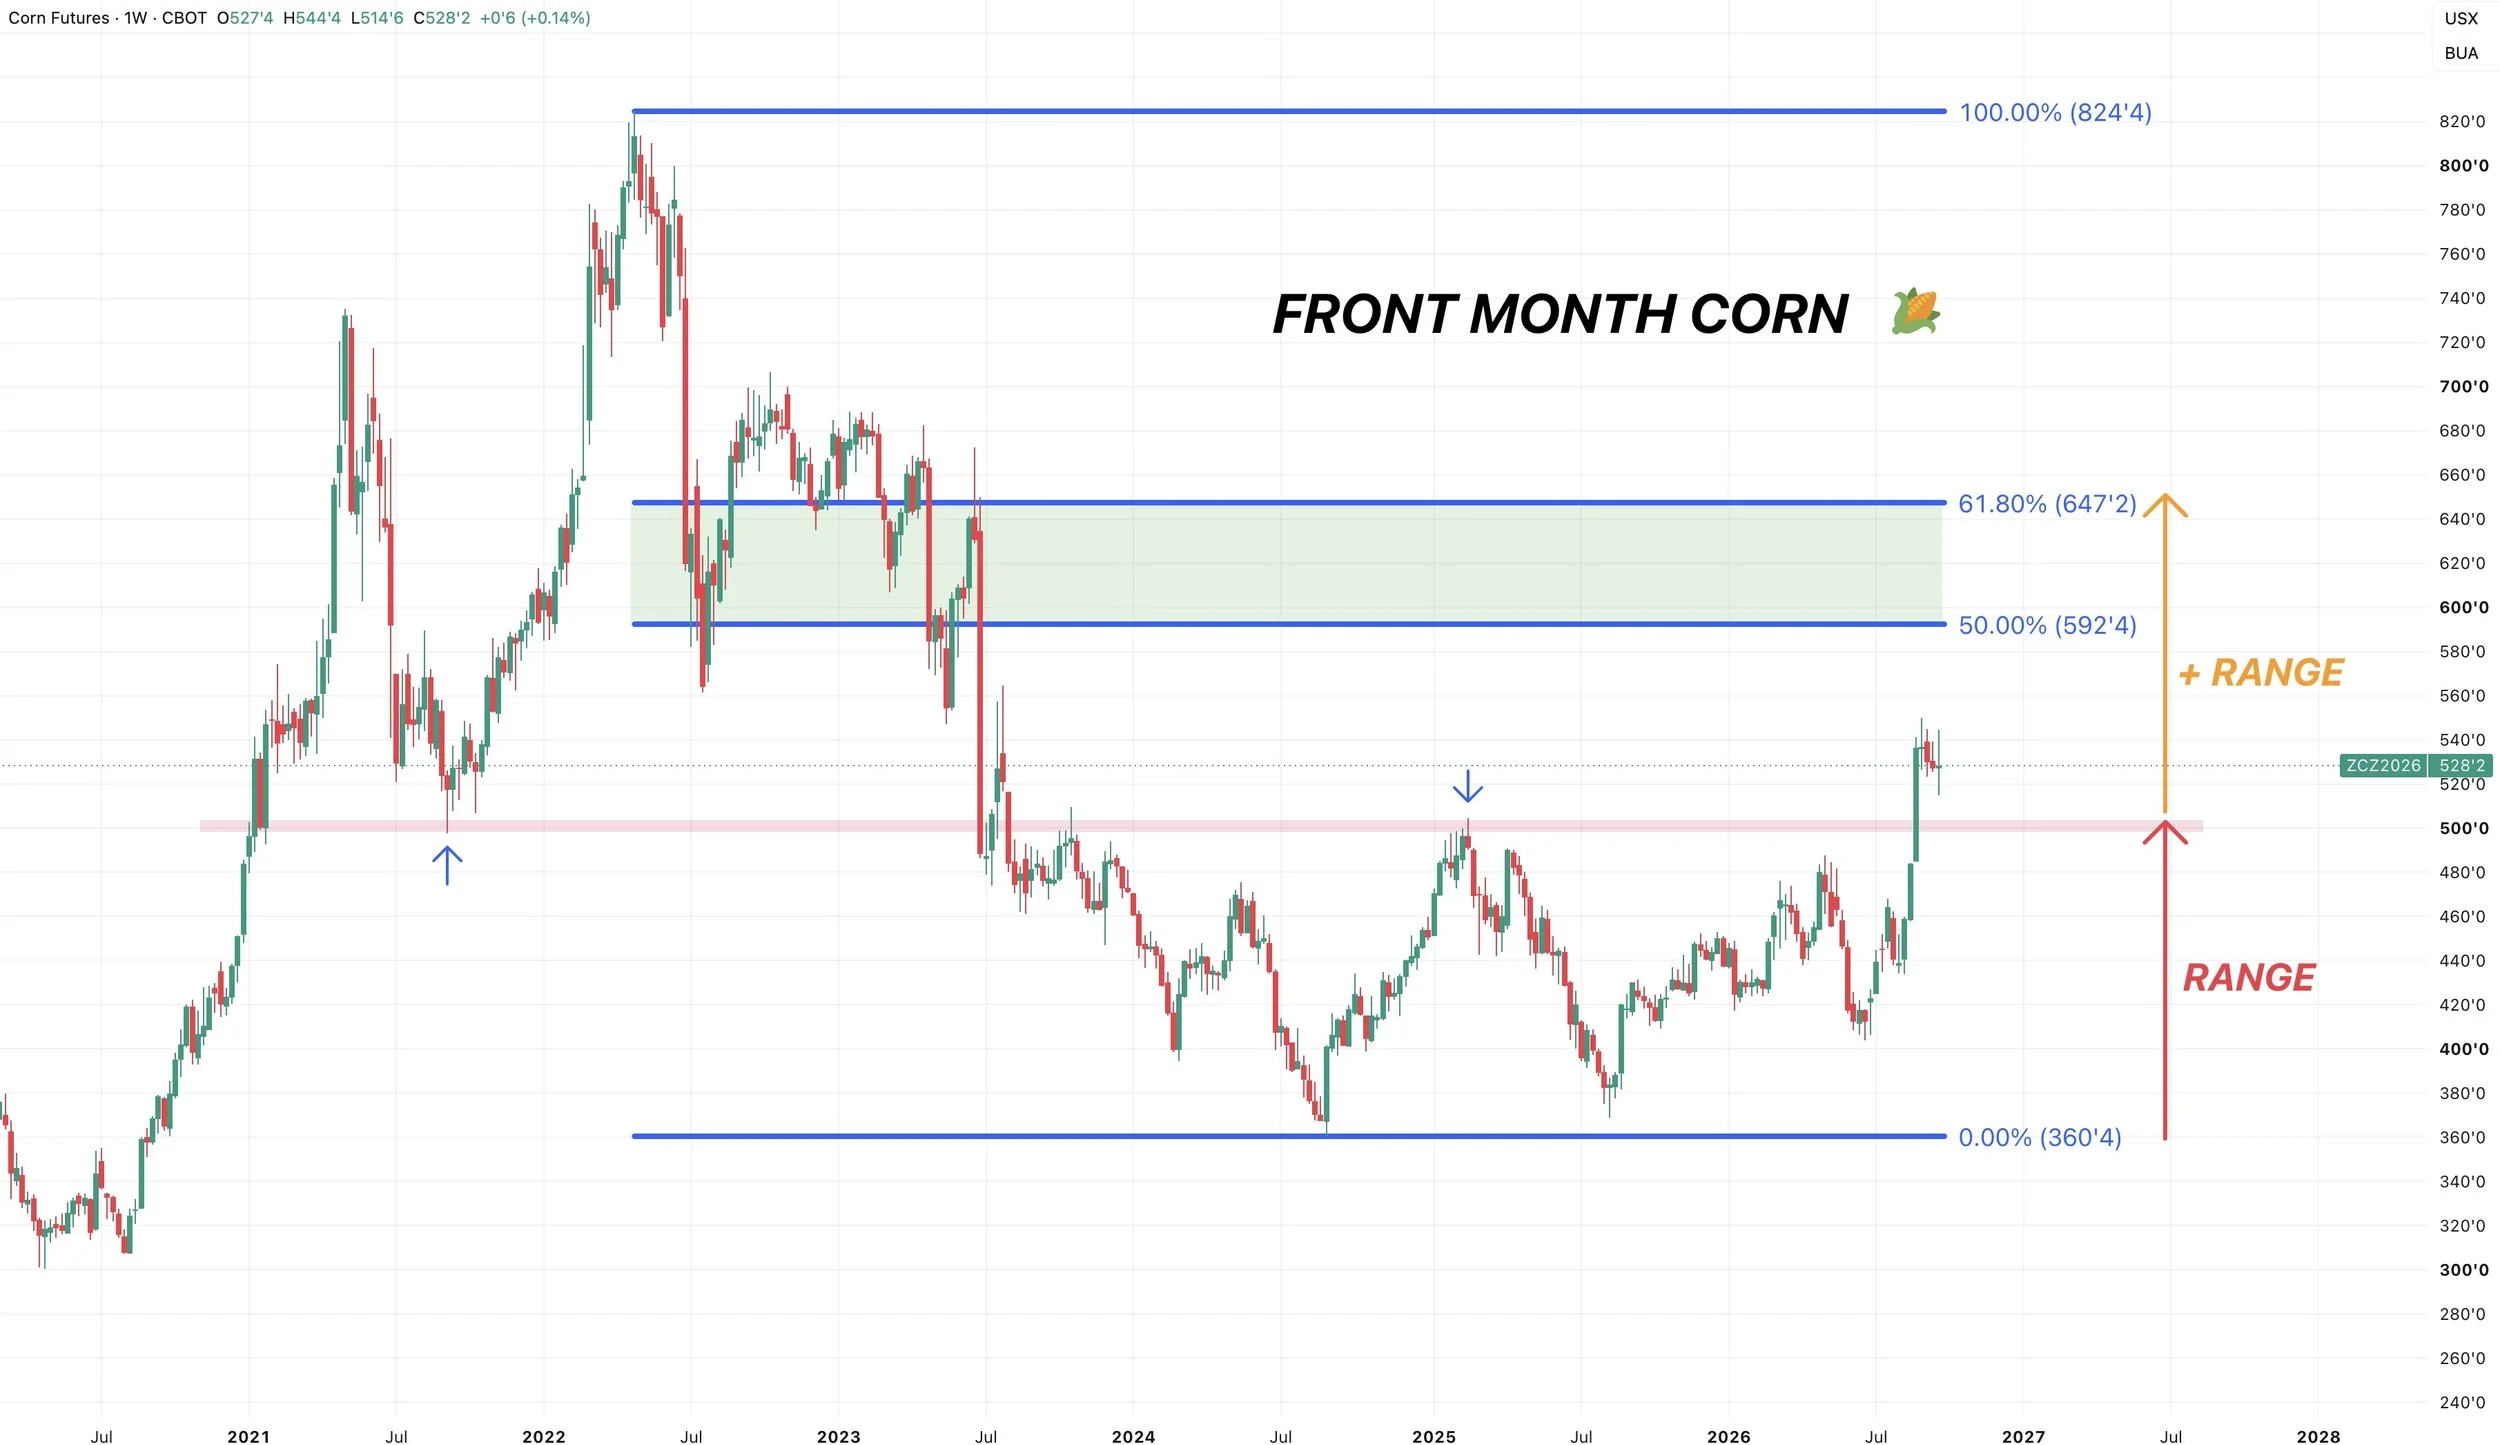
Big picture, breaking out of a 3 year sideways range is anything but bearish.
You could drop all the way down to $5.00 and it would still be viewed as a healthy pullback and simple re-test of prior resistance.
Soybeans
Fundamentals:
Same thing for soybeans, I don’t want to spend a ton of time on the fundamentals as there's nothing new we haven’t already talked about.
So we're just going to rapid fire go through a few of the items and why I see potential.
I don’t know what the China details will say. I'd have to imagine they probably don’t buy more beans than they already agreed to. Maybe they just reassure us they are going to hit that goal, as I've always said they probably would.
Either way, I think we might have to ration demand to non-China destinations via higher prices, as we just don’t have all of these extra beans for sale for China to hit that goal without us losing demand elsewhere.
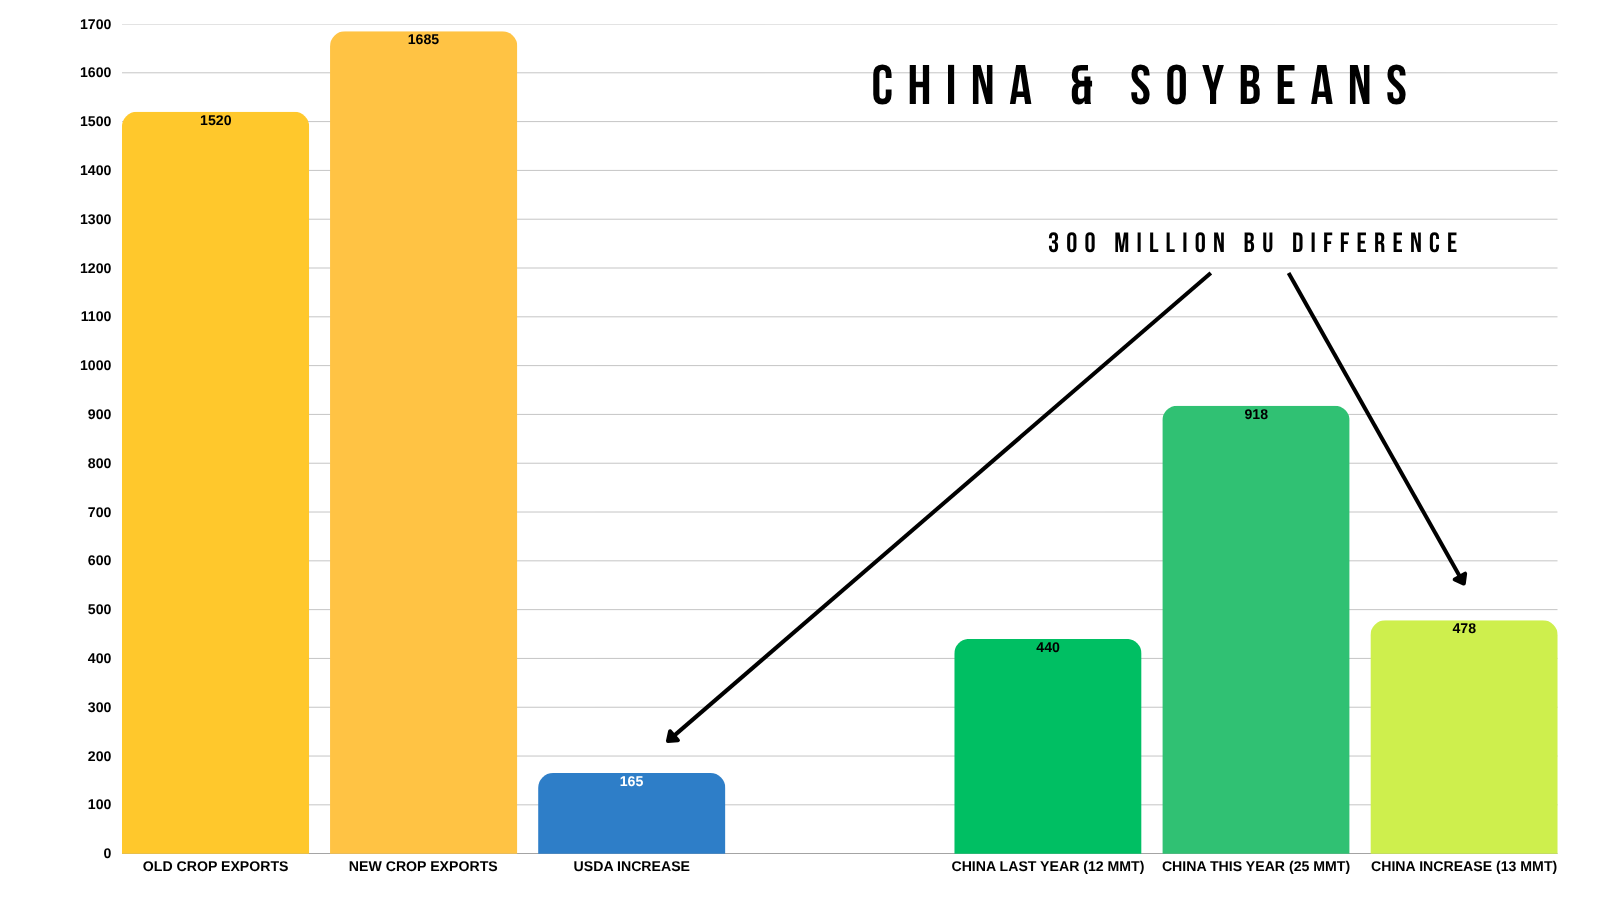
So not only is China buying at their best clip in years.
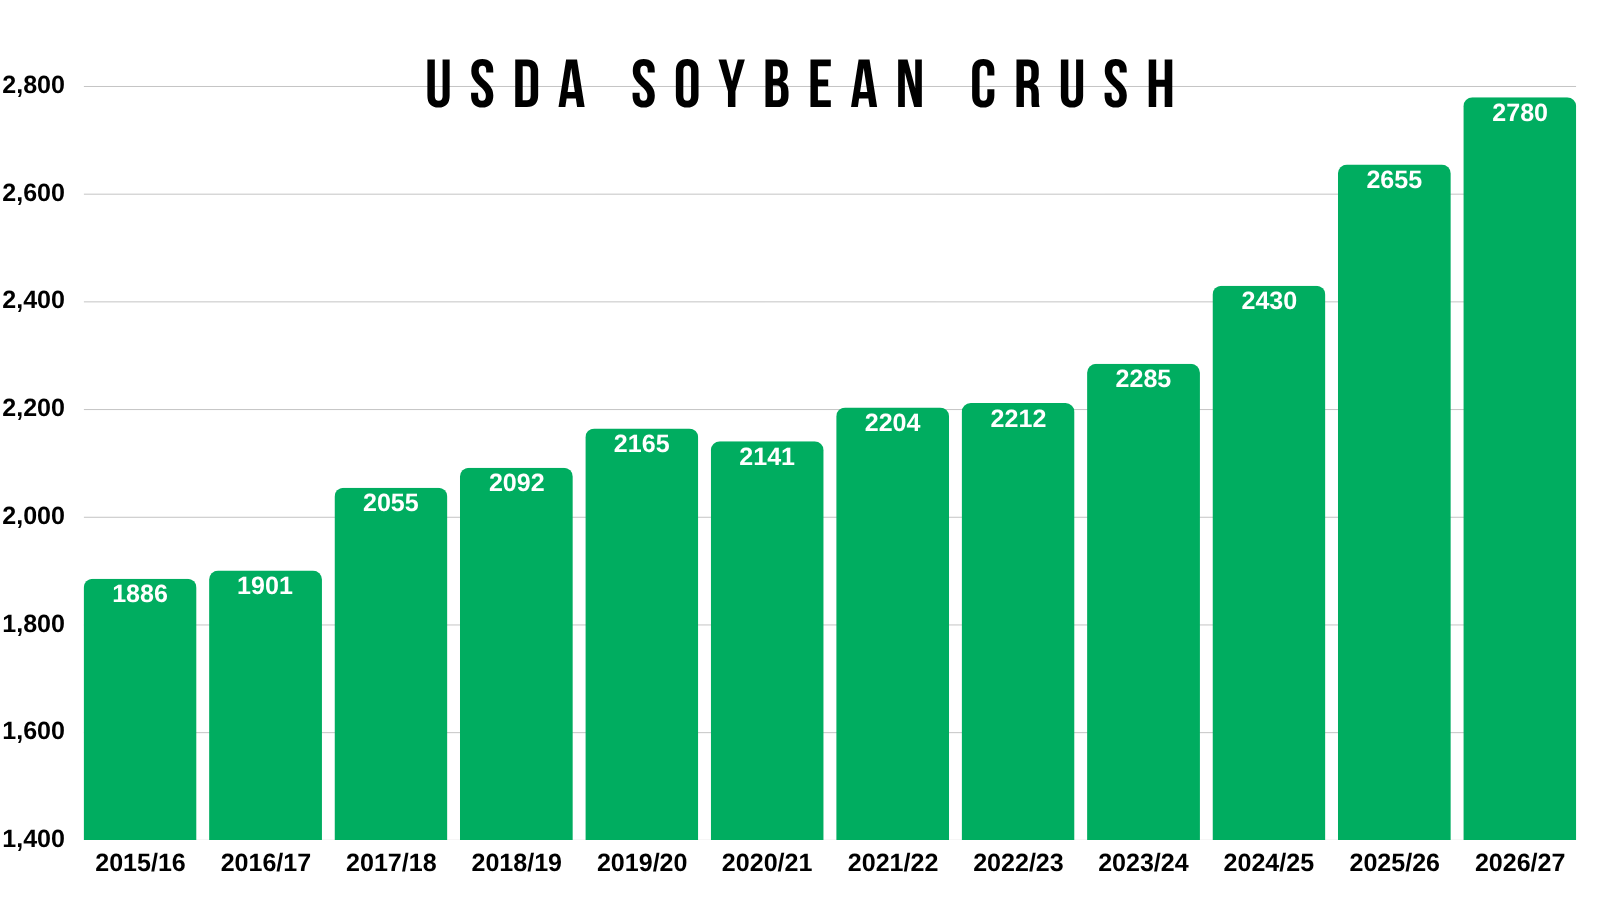
Crush demand continues to impress. The best it's ever been.
Just look at the steady year over year increases.
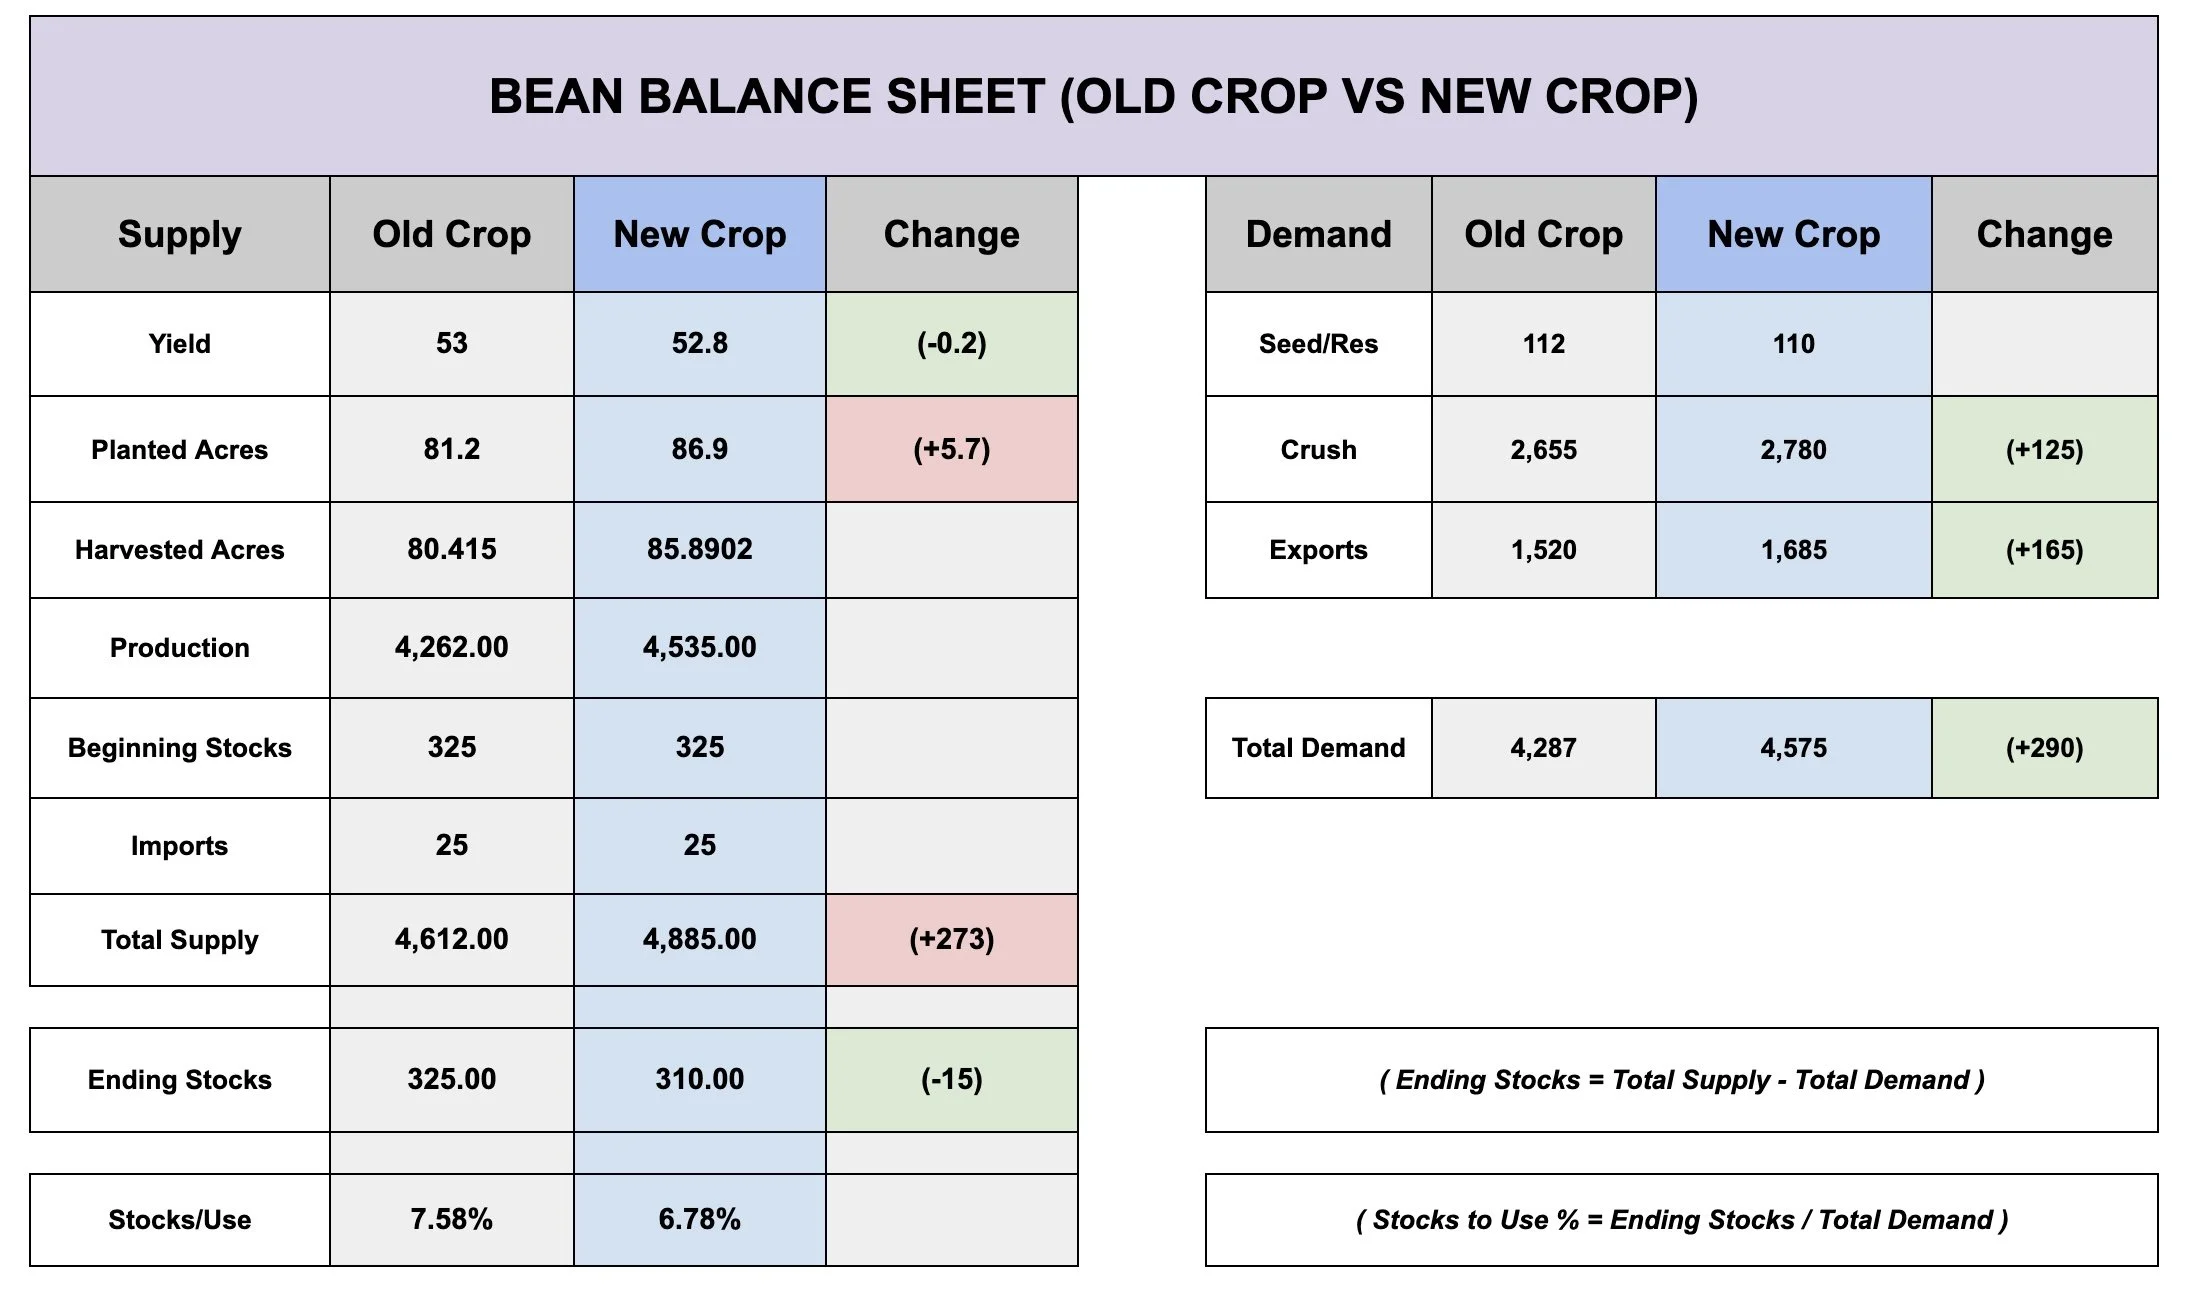
We have a US balance sheet with a lot more acres vs last year, yet a tighter situation. Hinting at just how strong demand has been.
Because the extra acres added around +270 million bushels more to the balance sheet, which is almost the size of the entire carryout.
But the increase in both crush and export demand has more than offset it.
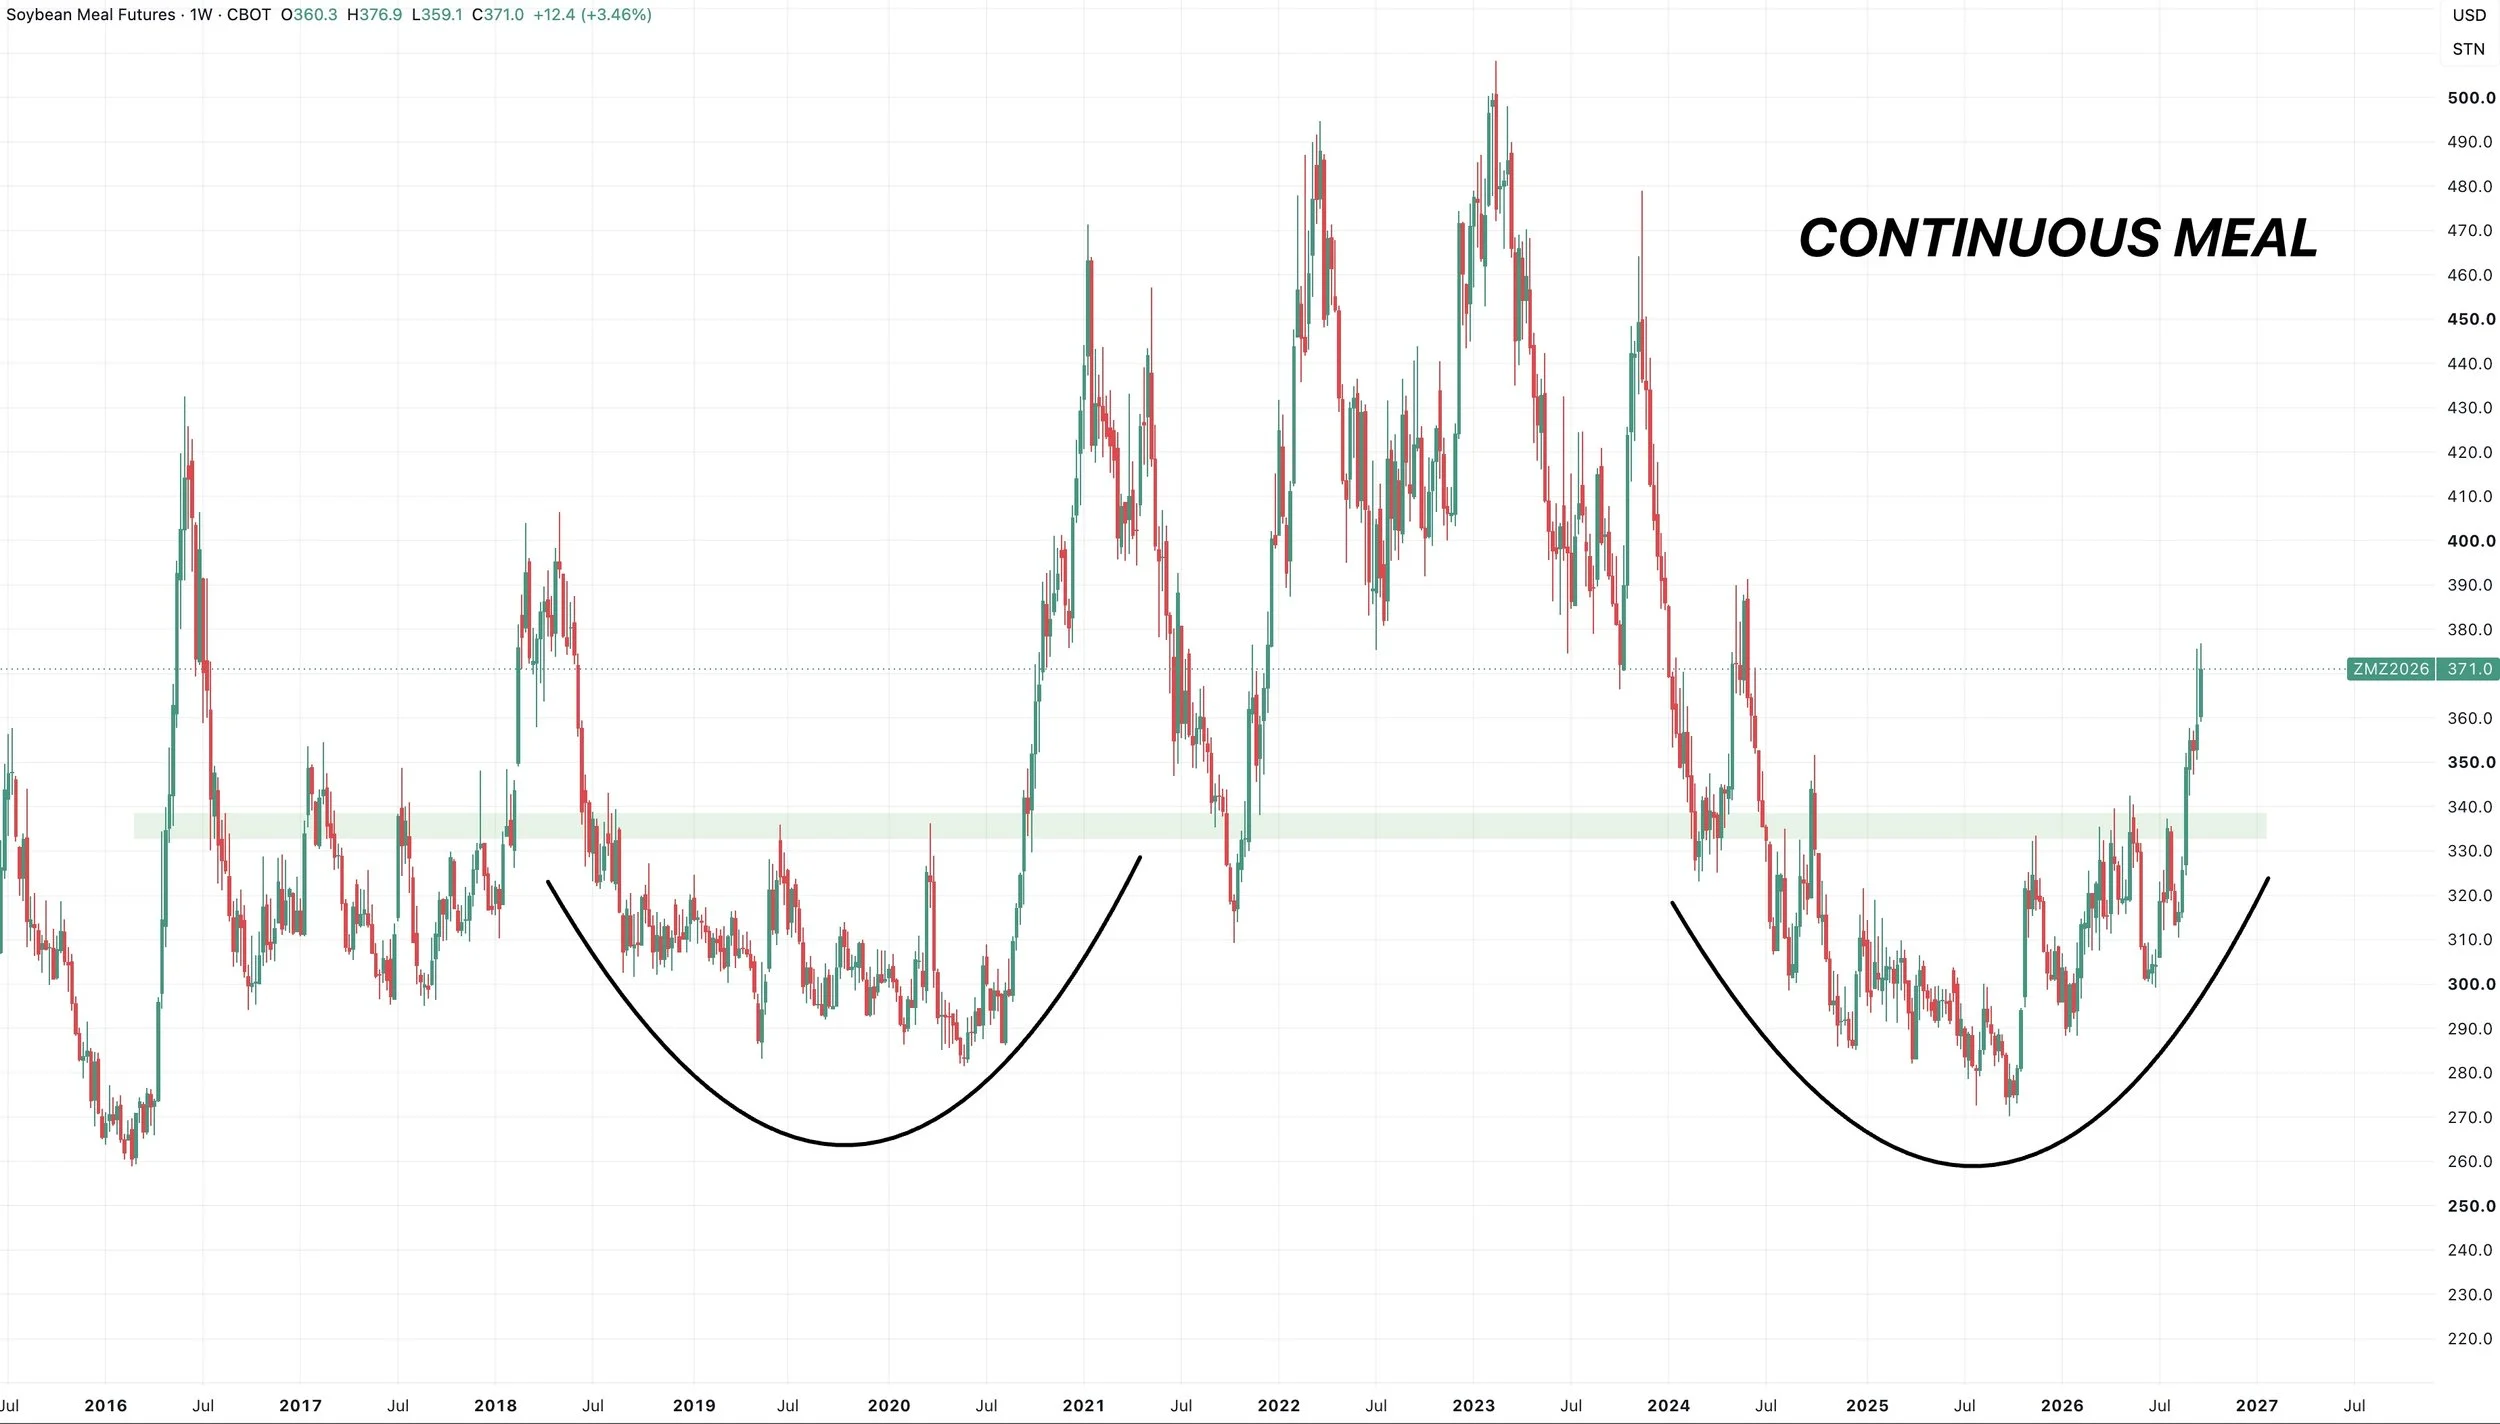
You have meal breaking out to multi-year highs.
Leading the soy complex for the first time in a long time.
Diesel is at it's highest price ever.
The two tend to run in tandem.
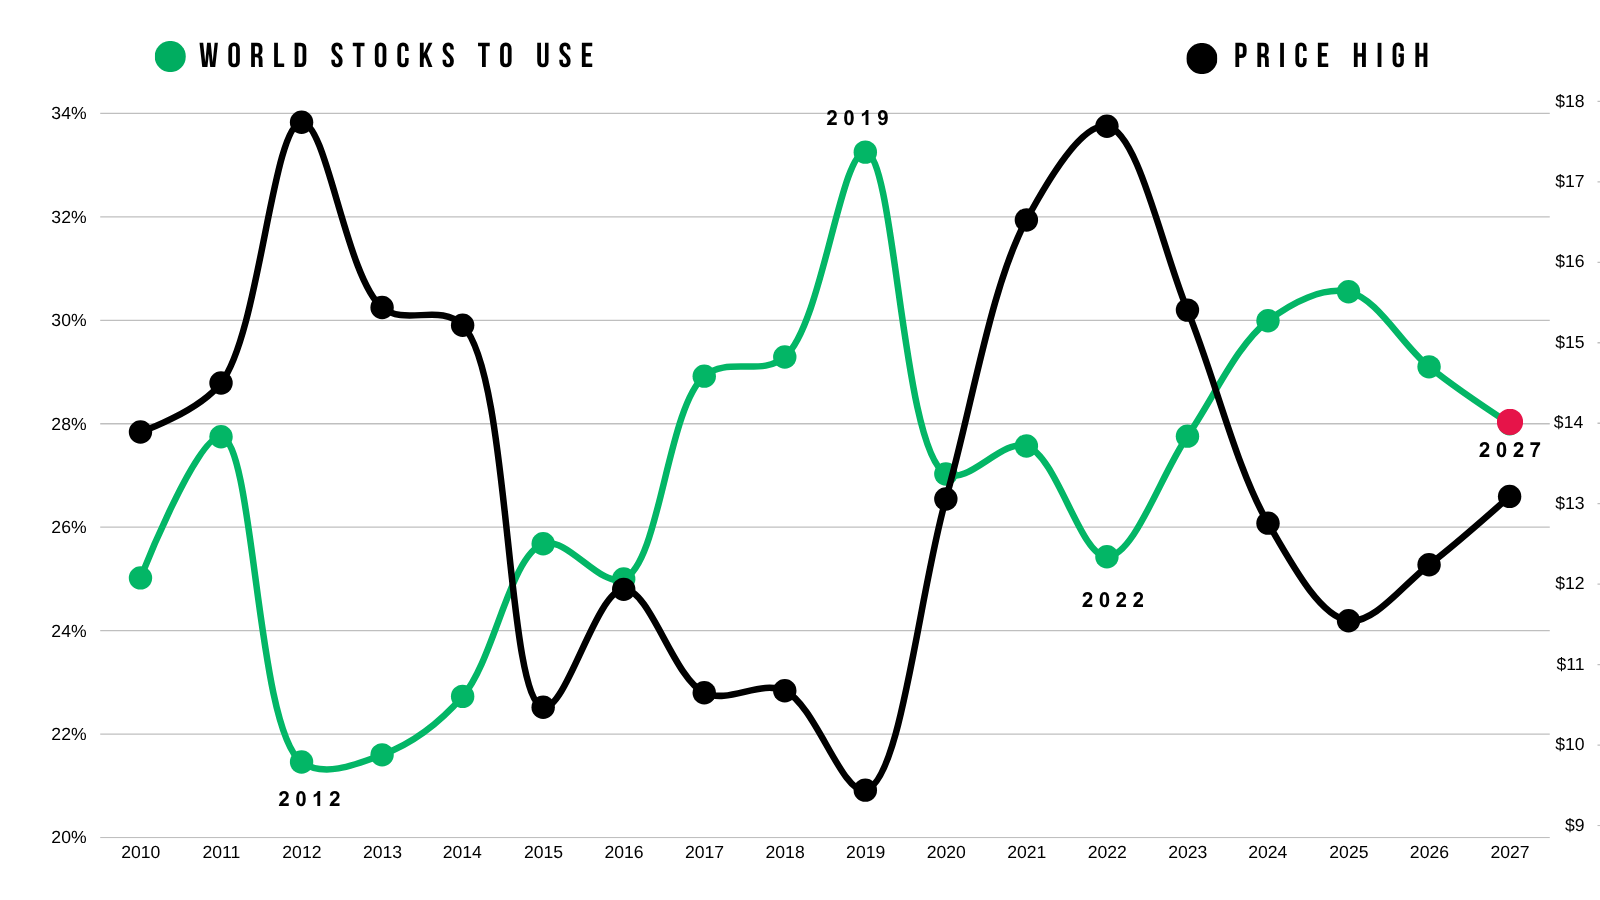
Then of course the world situation. It's the tightest in several years despite both Brazil and the US having a record crops.
Then you have the Super El Niño.
This is impacting countries everywhere.
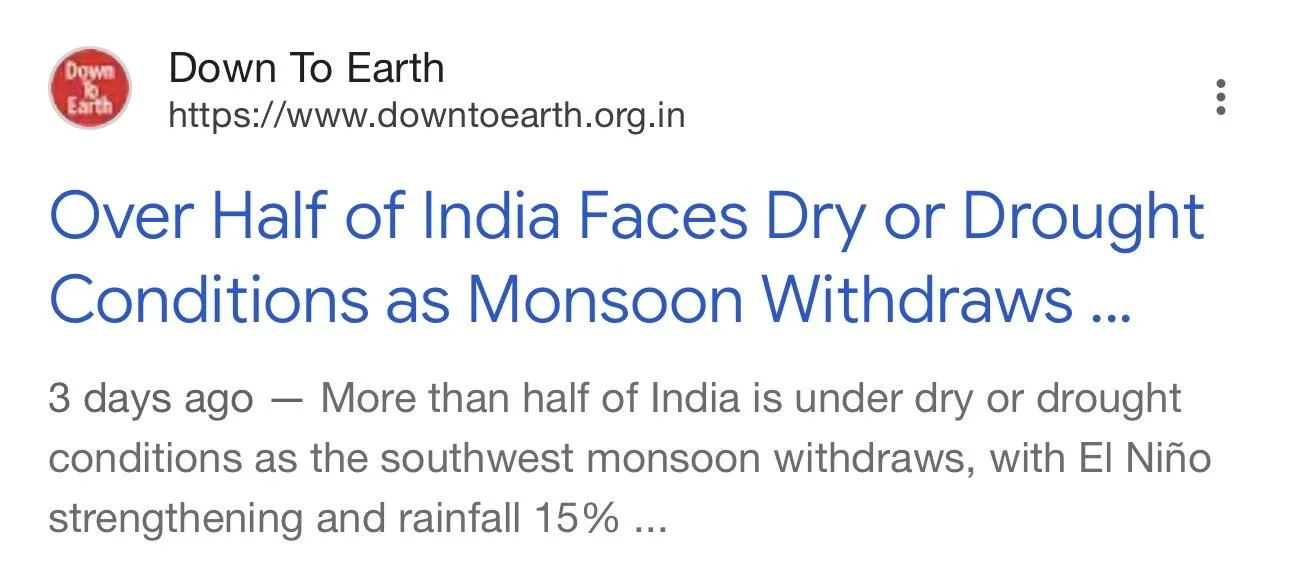
India for example, has half of their country in a drought, so producers are cutting back on inputs, seed, fertilizer, and pretty much everything.
This could of course impact wheat directly.
But the point I'm making is that this is clearly causing issues.
This isn’t going to be helping global production for any of the grains.
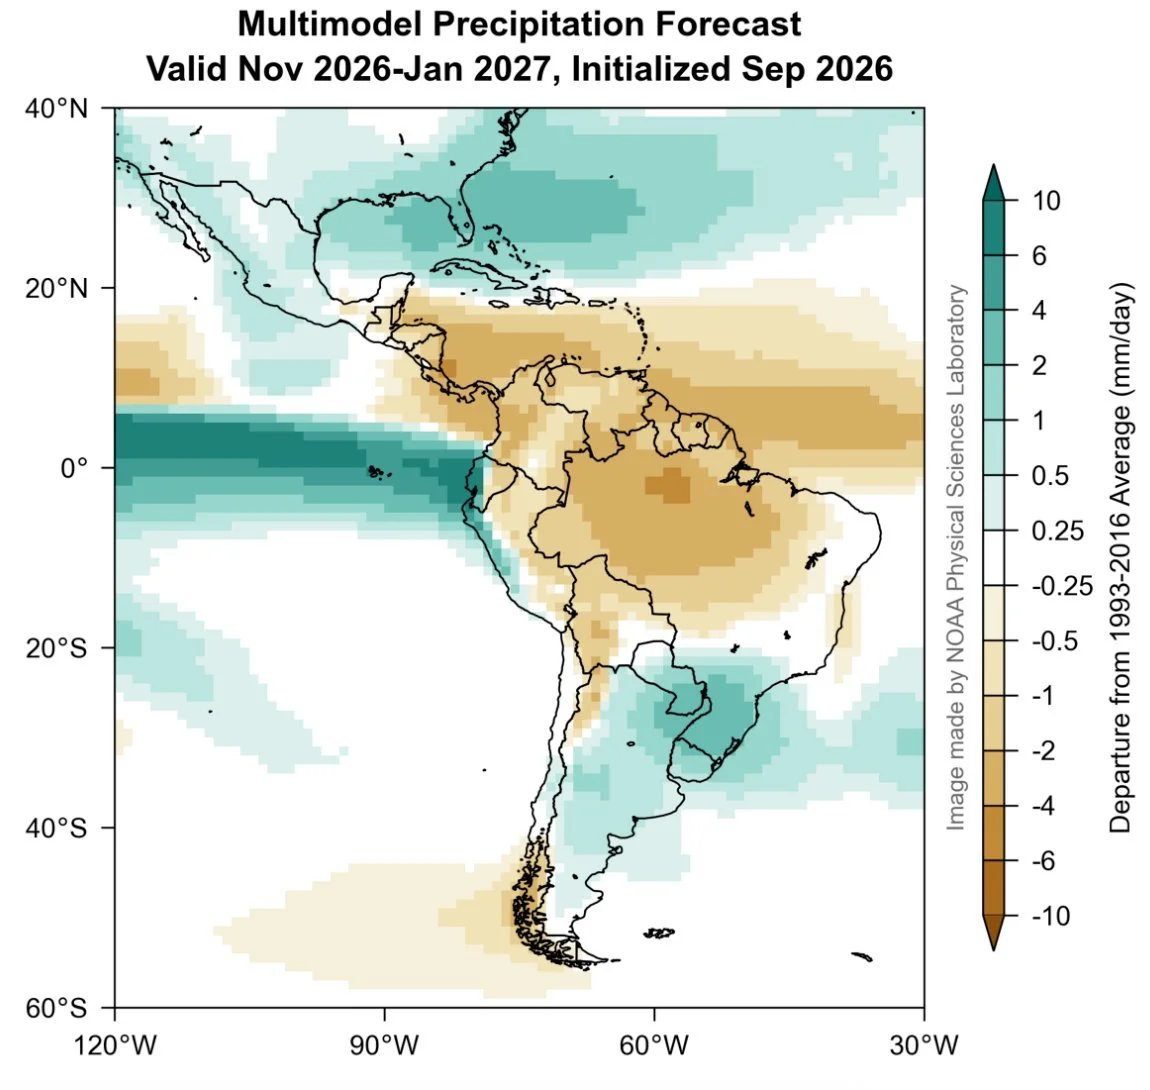
Brazil is obviously going to be the big one. There's already talk about them being dry, and historically a Super El Niño has led to dry conditions in key areas in northern South America.
So I think soybeans have a ton of long term potential upside.
The one thing that could potentially try to keep a lid on things short term would be the bearish seasonality and potential harvest pressure if this meeting doesn’t give bulls anything new to chew on.
So I would say there is still some short term risk if you have to move stuff off the combine.
If you don’t have to move anything, we still like staying plenty of patient waiting to see how much of this bullish potential unfolds.
There is also some areas that seem to have shortages as they wait for new crop to come rolling into town. If you happen to have old crop in the bins or are able to harvest quicker than other guys, make sure you check it out to see if it makes sense for you. As some places are paying 50 cents to $1.00 plus more for stuff in the next week or so.
Soybean Charts
Nov Beans Chart:
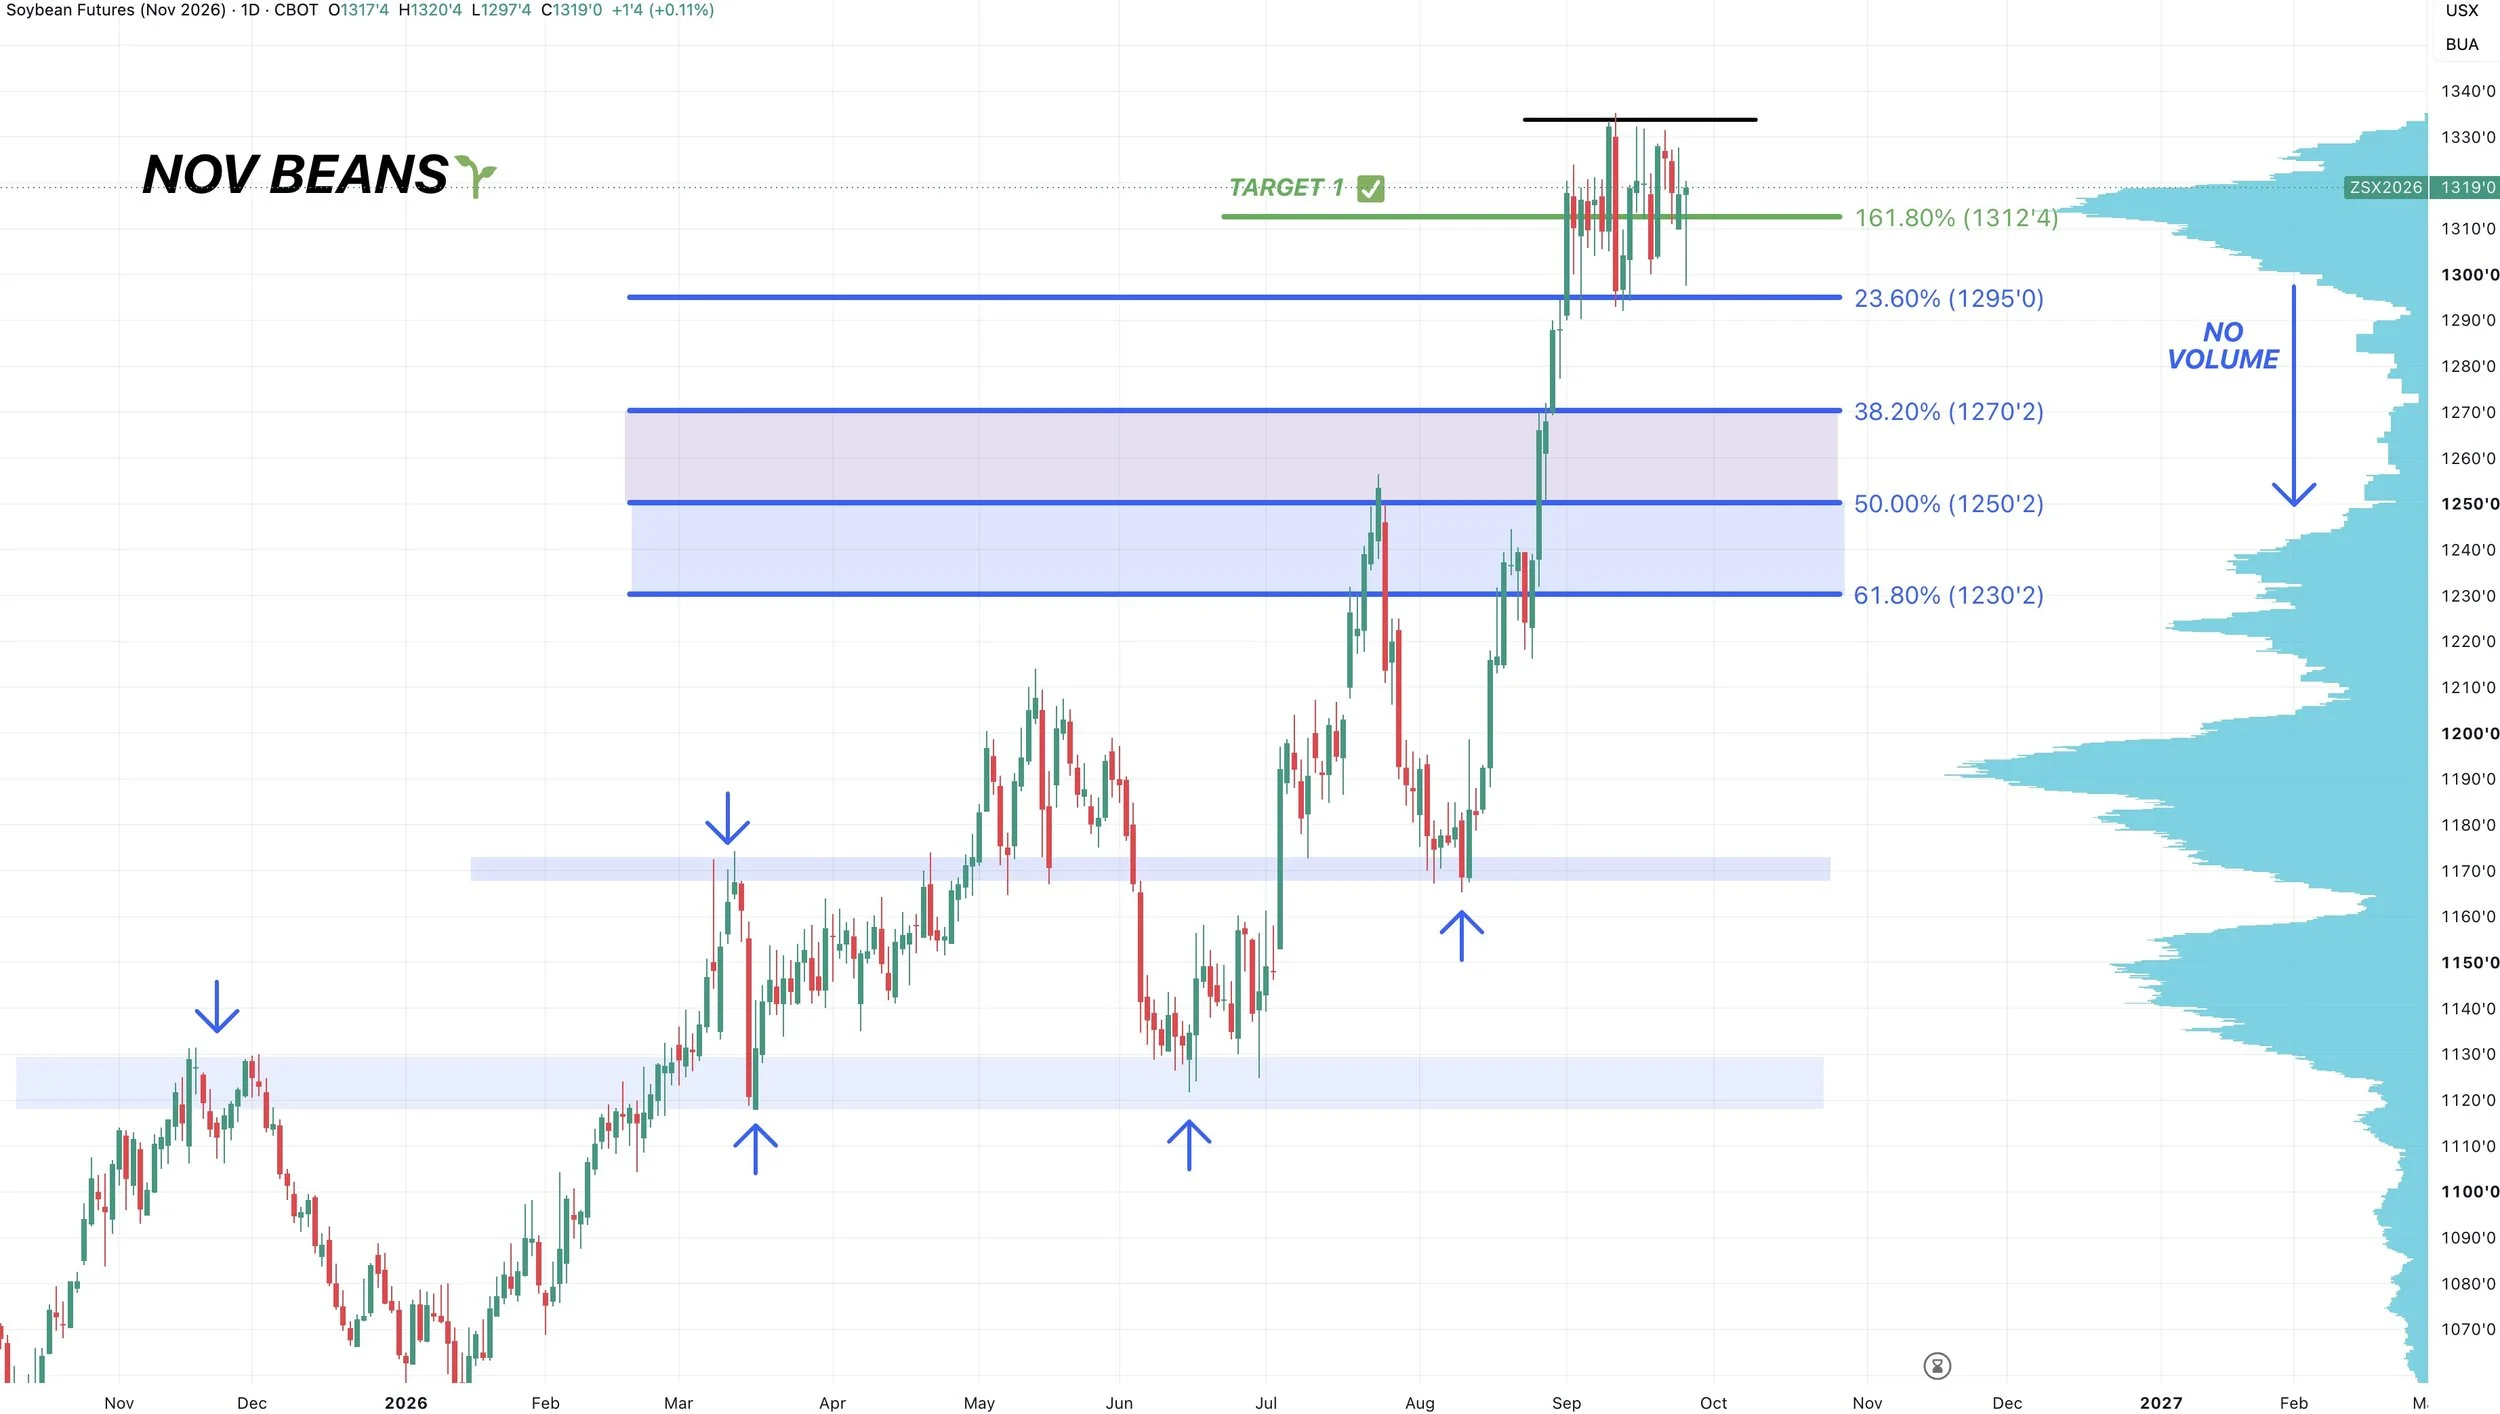
Very nice day for soybeans as well. Closing +20 cents off the lows.
However at the end of the day, soybeans are still stuck in no man's land.
We have gone absolutely sideways the entire month of September. We have still yet to break the highs or lows from the day of the USDA report day.
We of course need to continue holding the bottom of the range, as there is plenty of downside air below here and zero support.
We really are just range bound waiting to see what direction we break out of.
Since we've been coiling up in this range, if we are able to bust through the highs, it should result in the next leg higher.
I'll have some exact next upside targets if we break out.
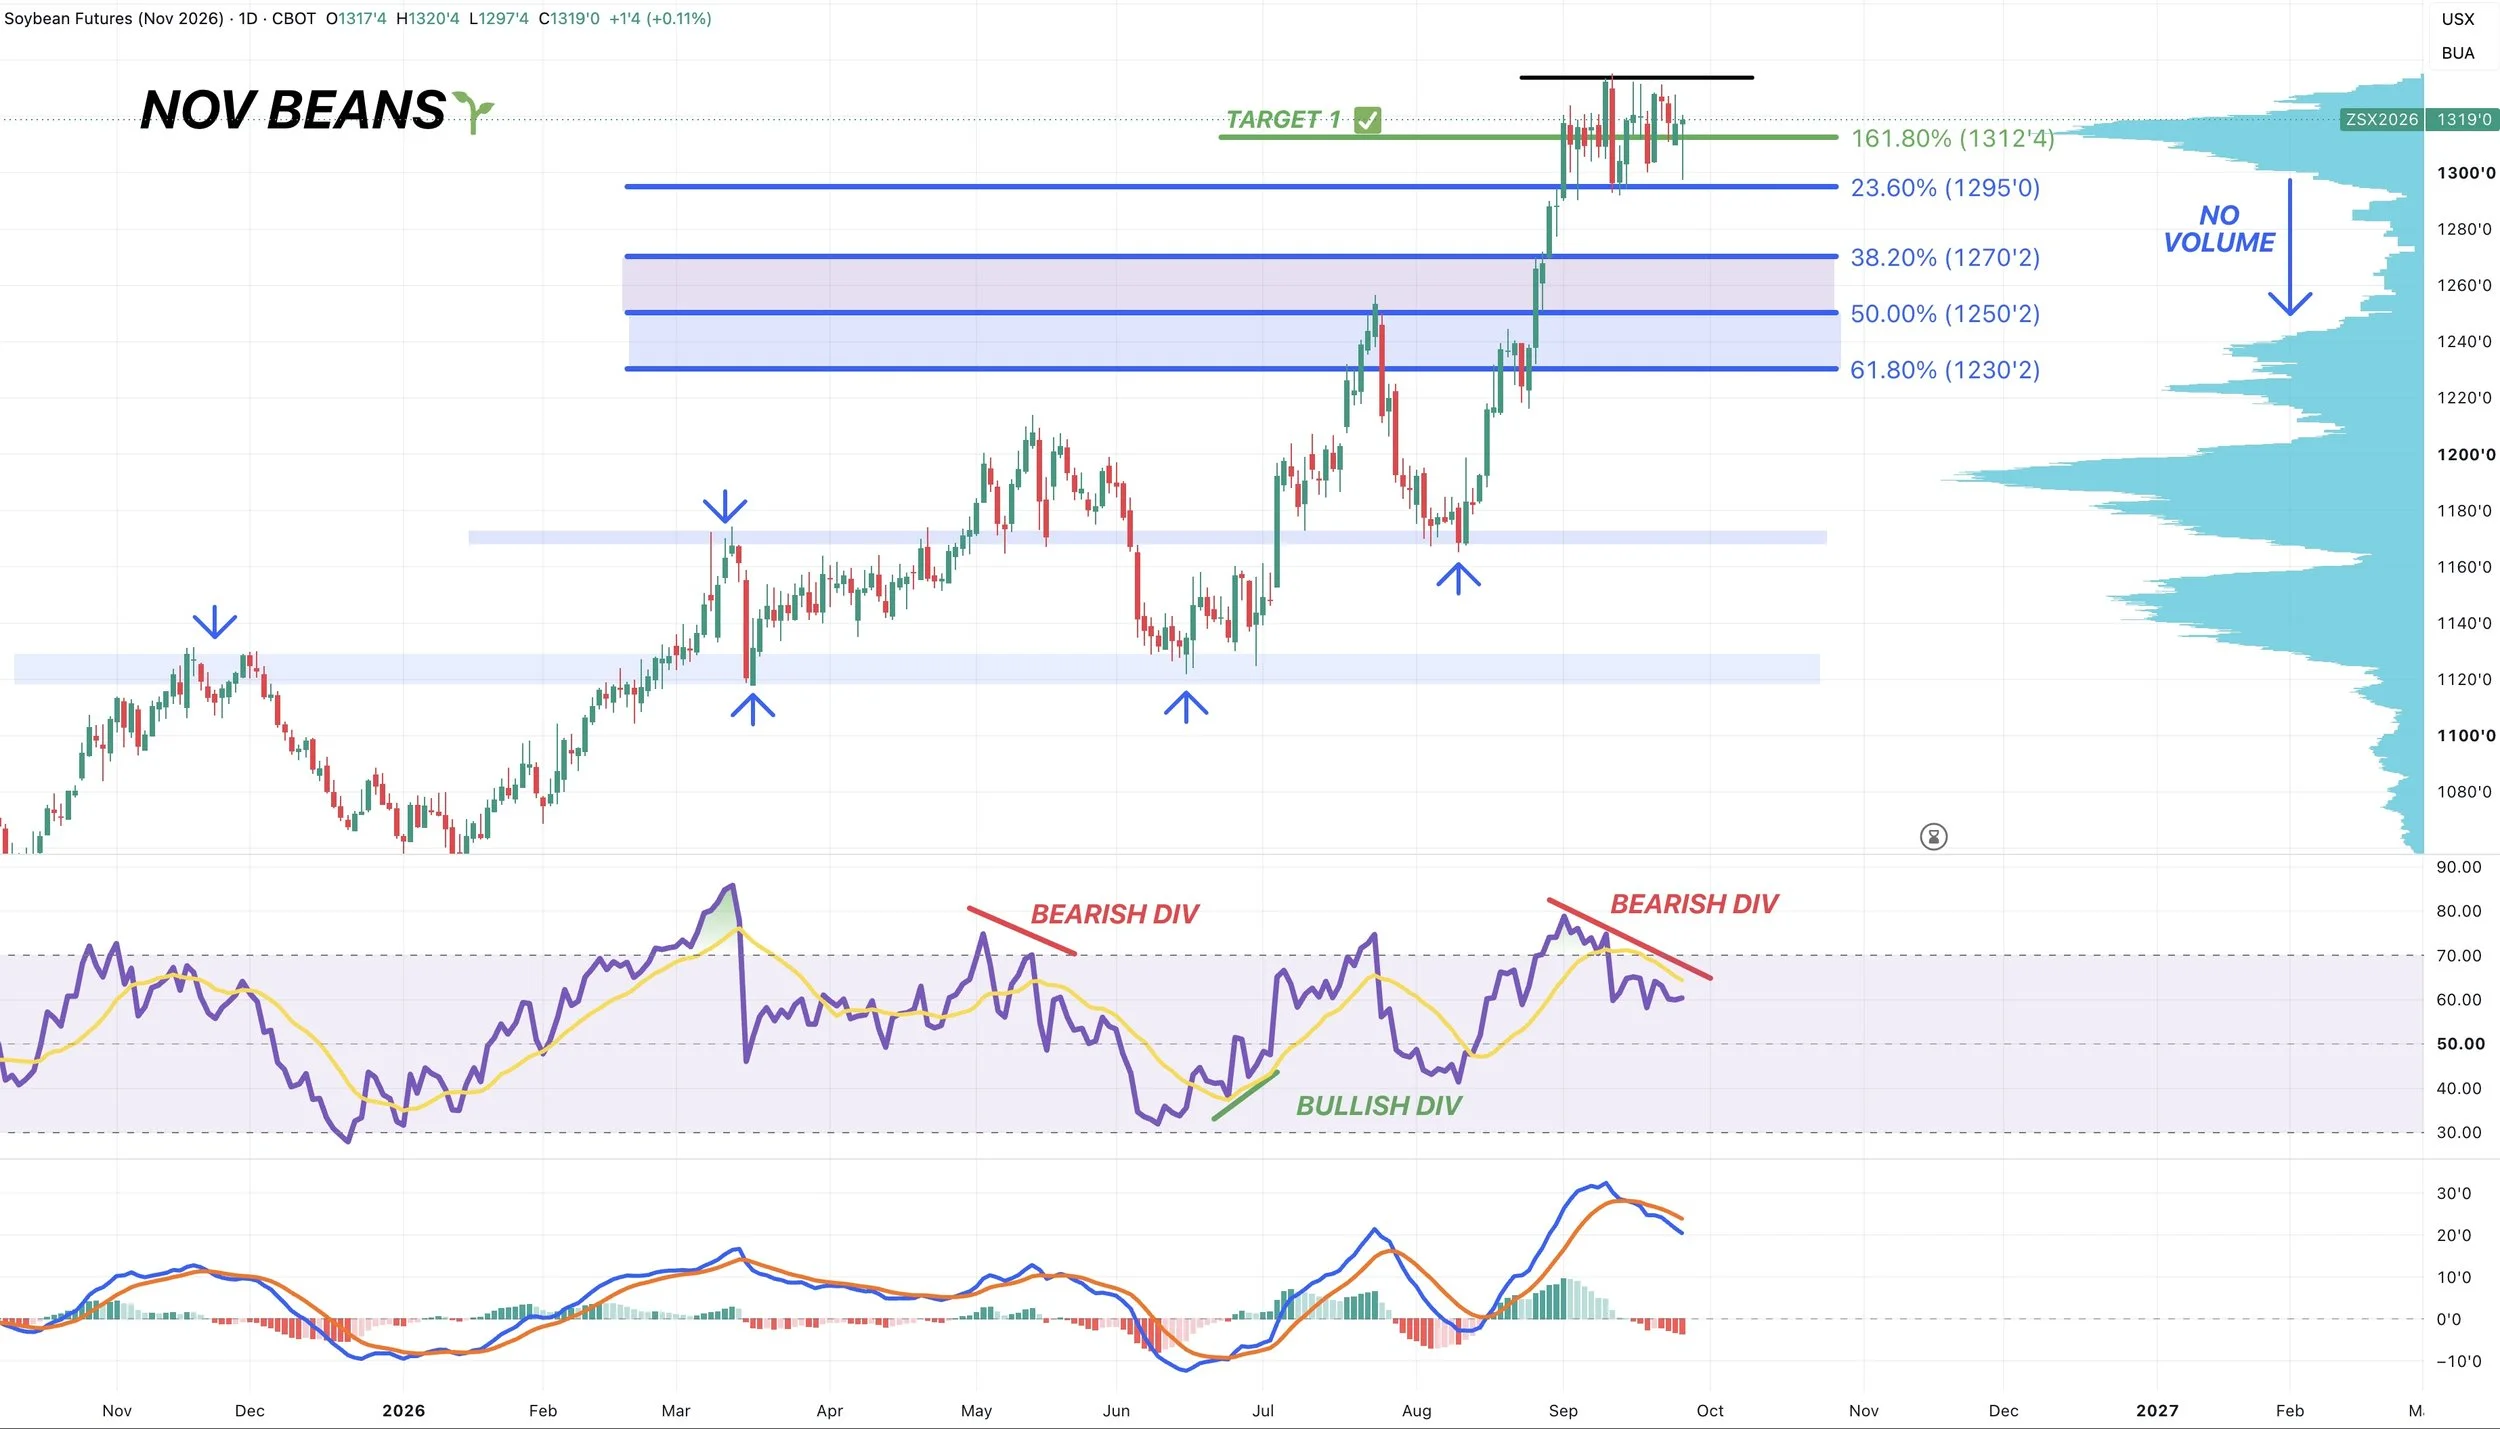
On reason I am a little hesitant and cautious up here short term is that we do still have some bearish divergence on the RSI.
The RSI is struggling to make new highs with prices.
We also had that MACD cross bearish last week.
But really, any price action inside of this range is simply noise. We need some direction rather than 25 days of sideways chop.
Monthly Chart:
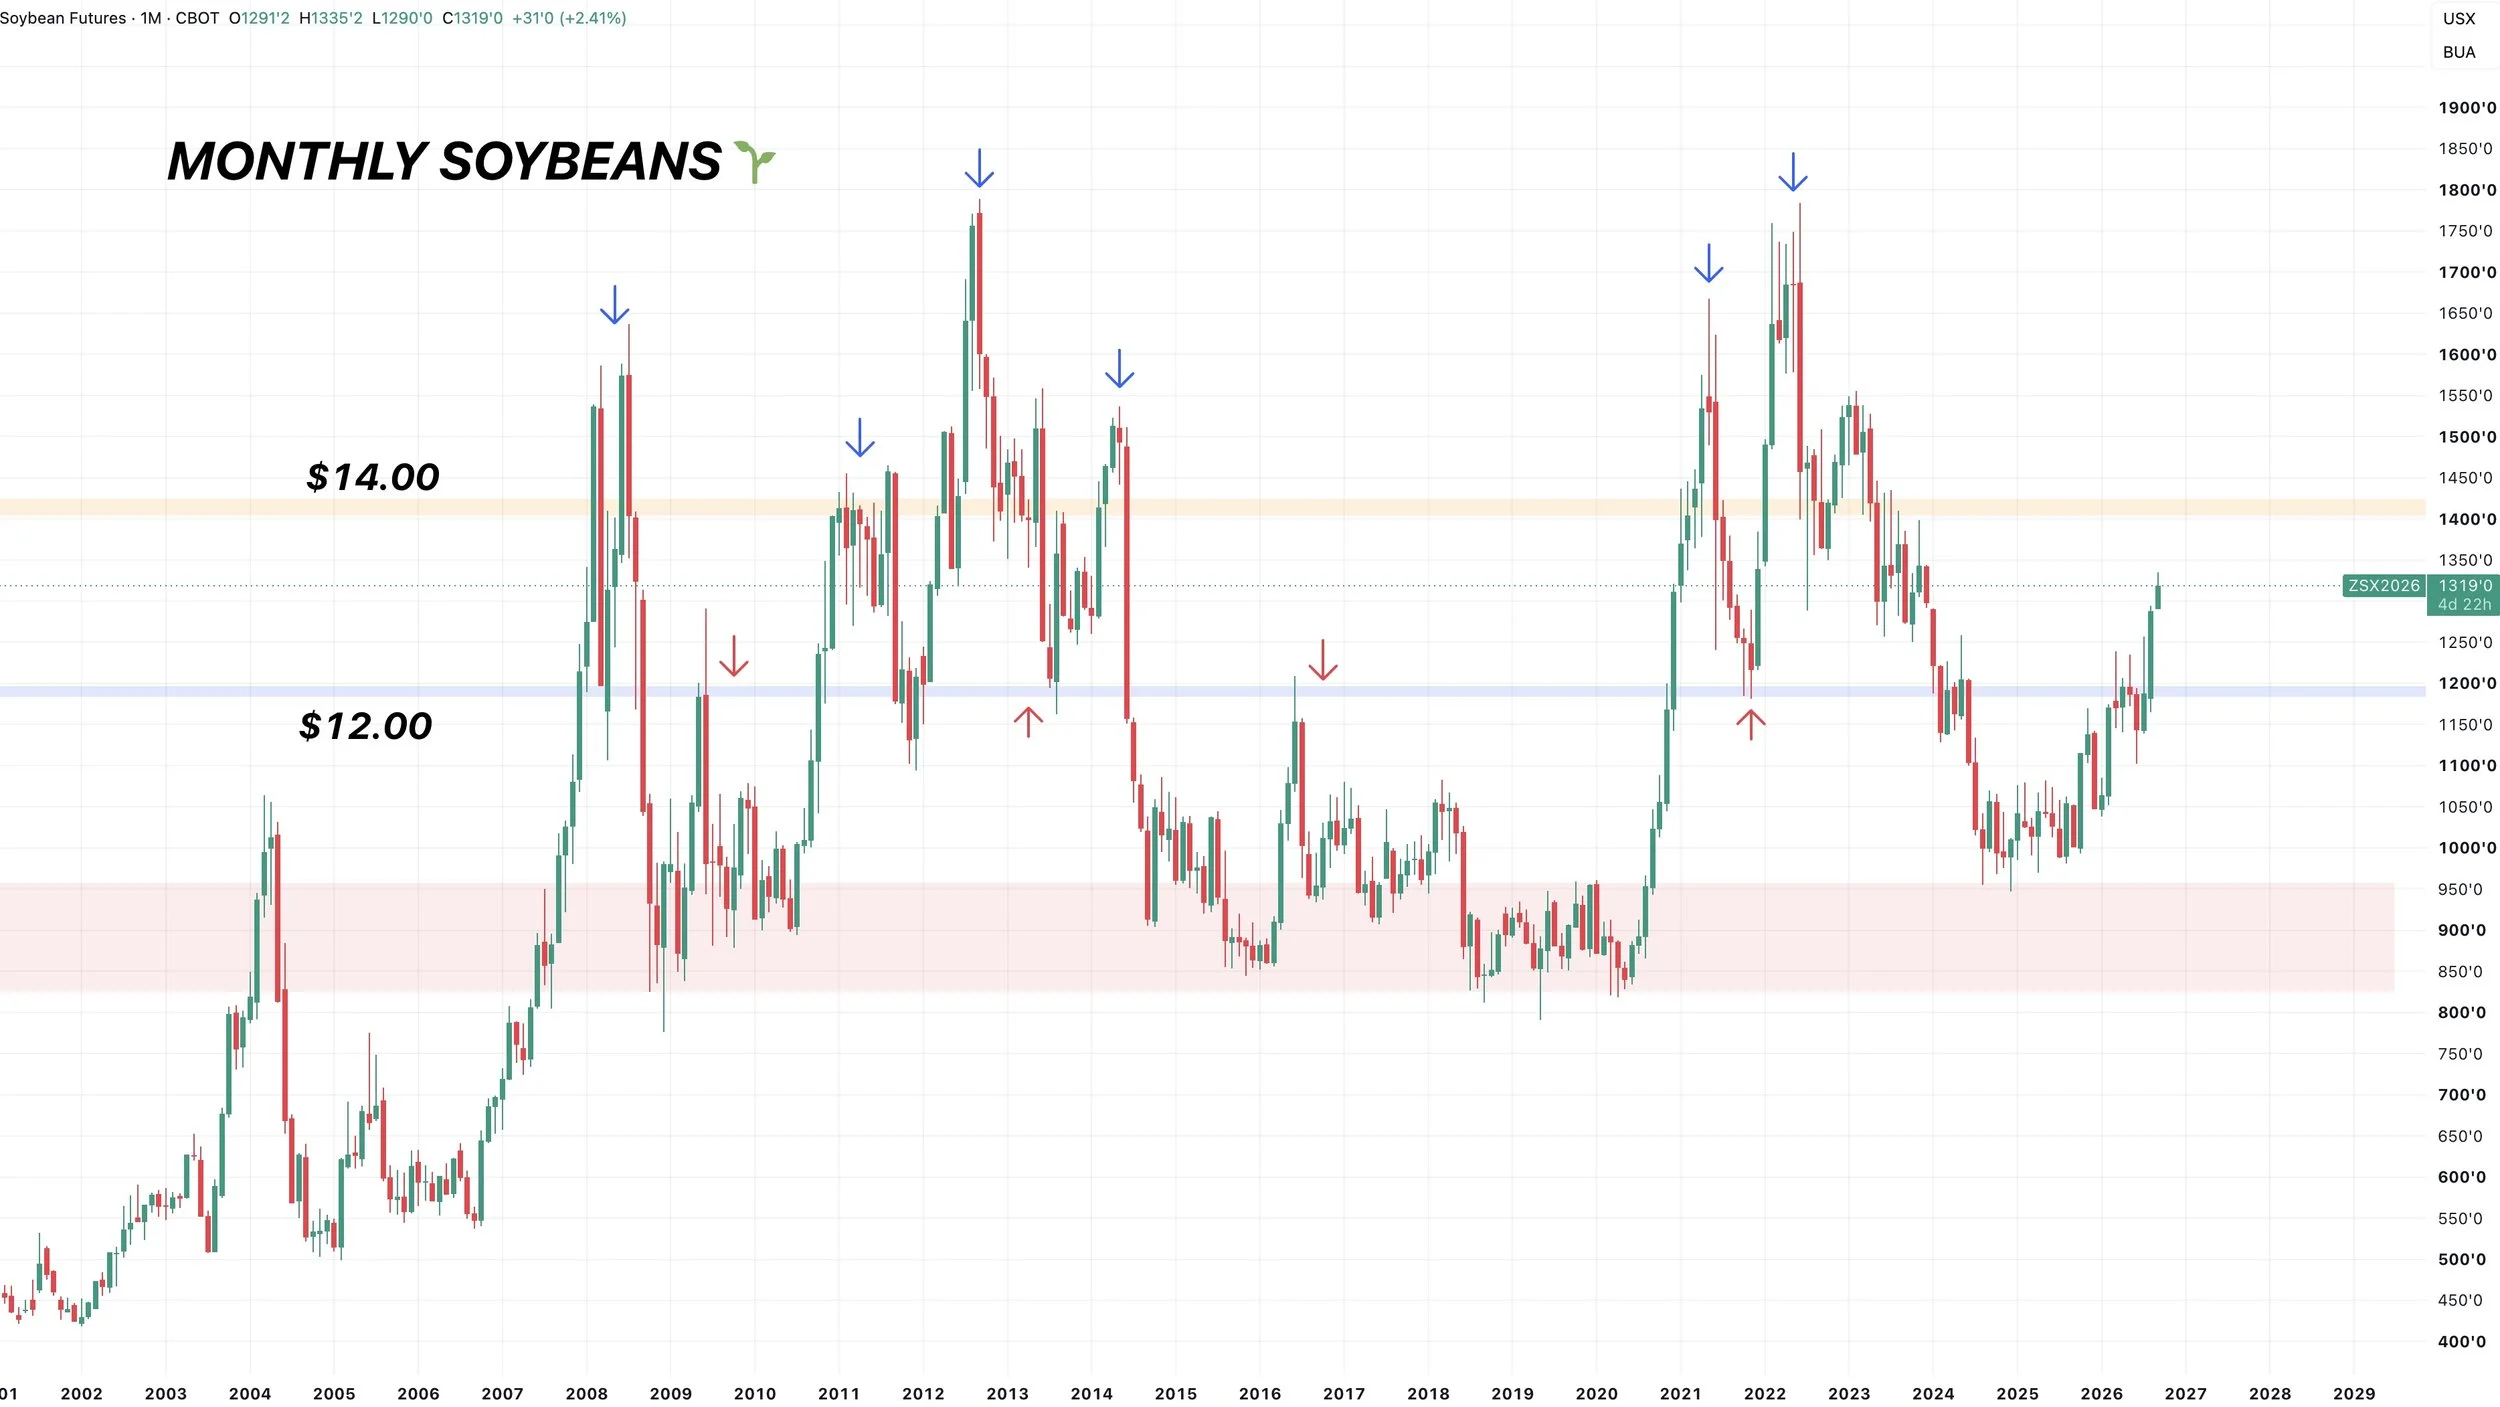
Big picture, I think we have a ton of room to run.
And I think we will see at least $14 soybeans at some point.
We broke some major resistance last month.
We have never seen us close above that $12.00 resistance on a monthly basis and not run to at least $14.00
That doesn’t mean you shouldn’t be managing your risk if you're someone who doesn’t have all of the time in the world, but those with time we don’t want to be oversold.
Wheat
Dec KC Chart:
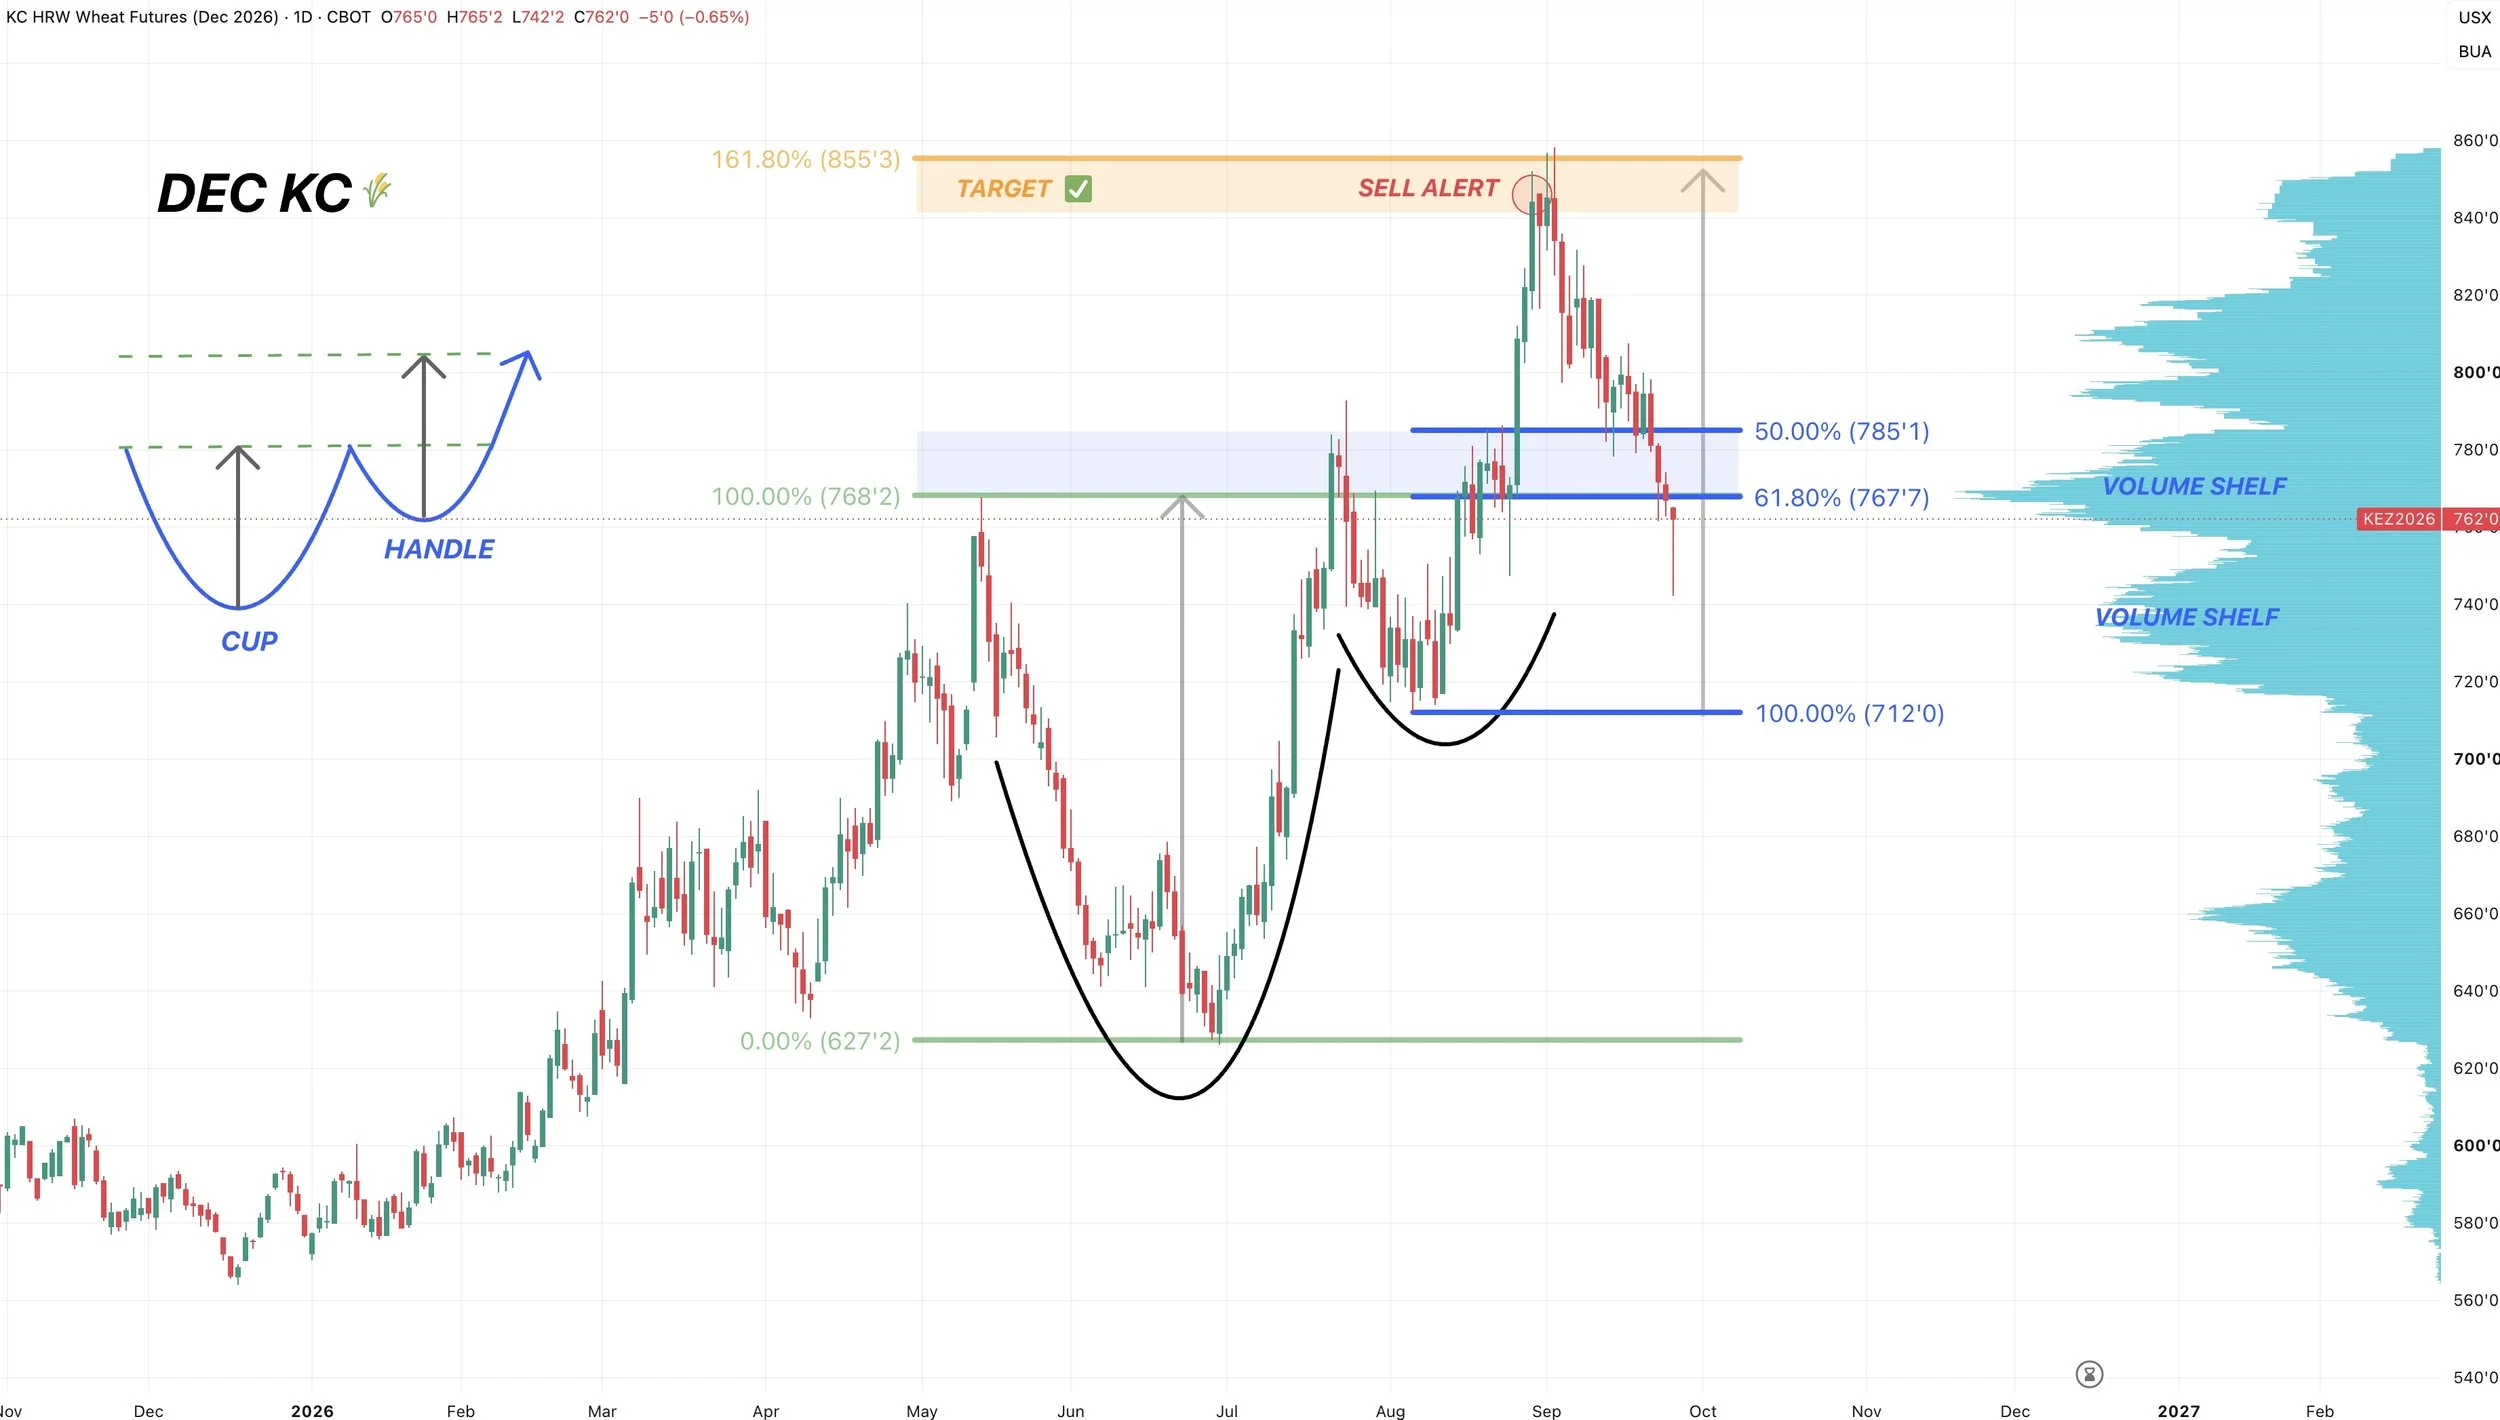
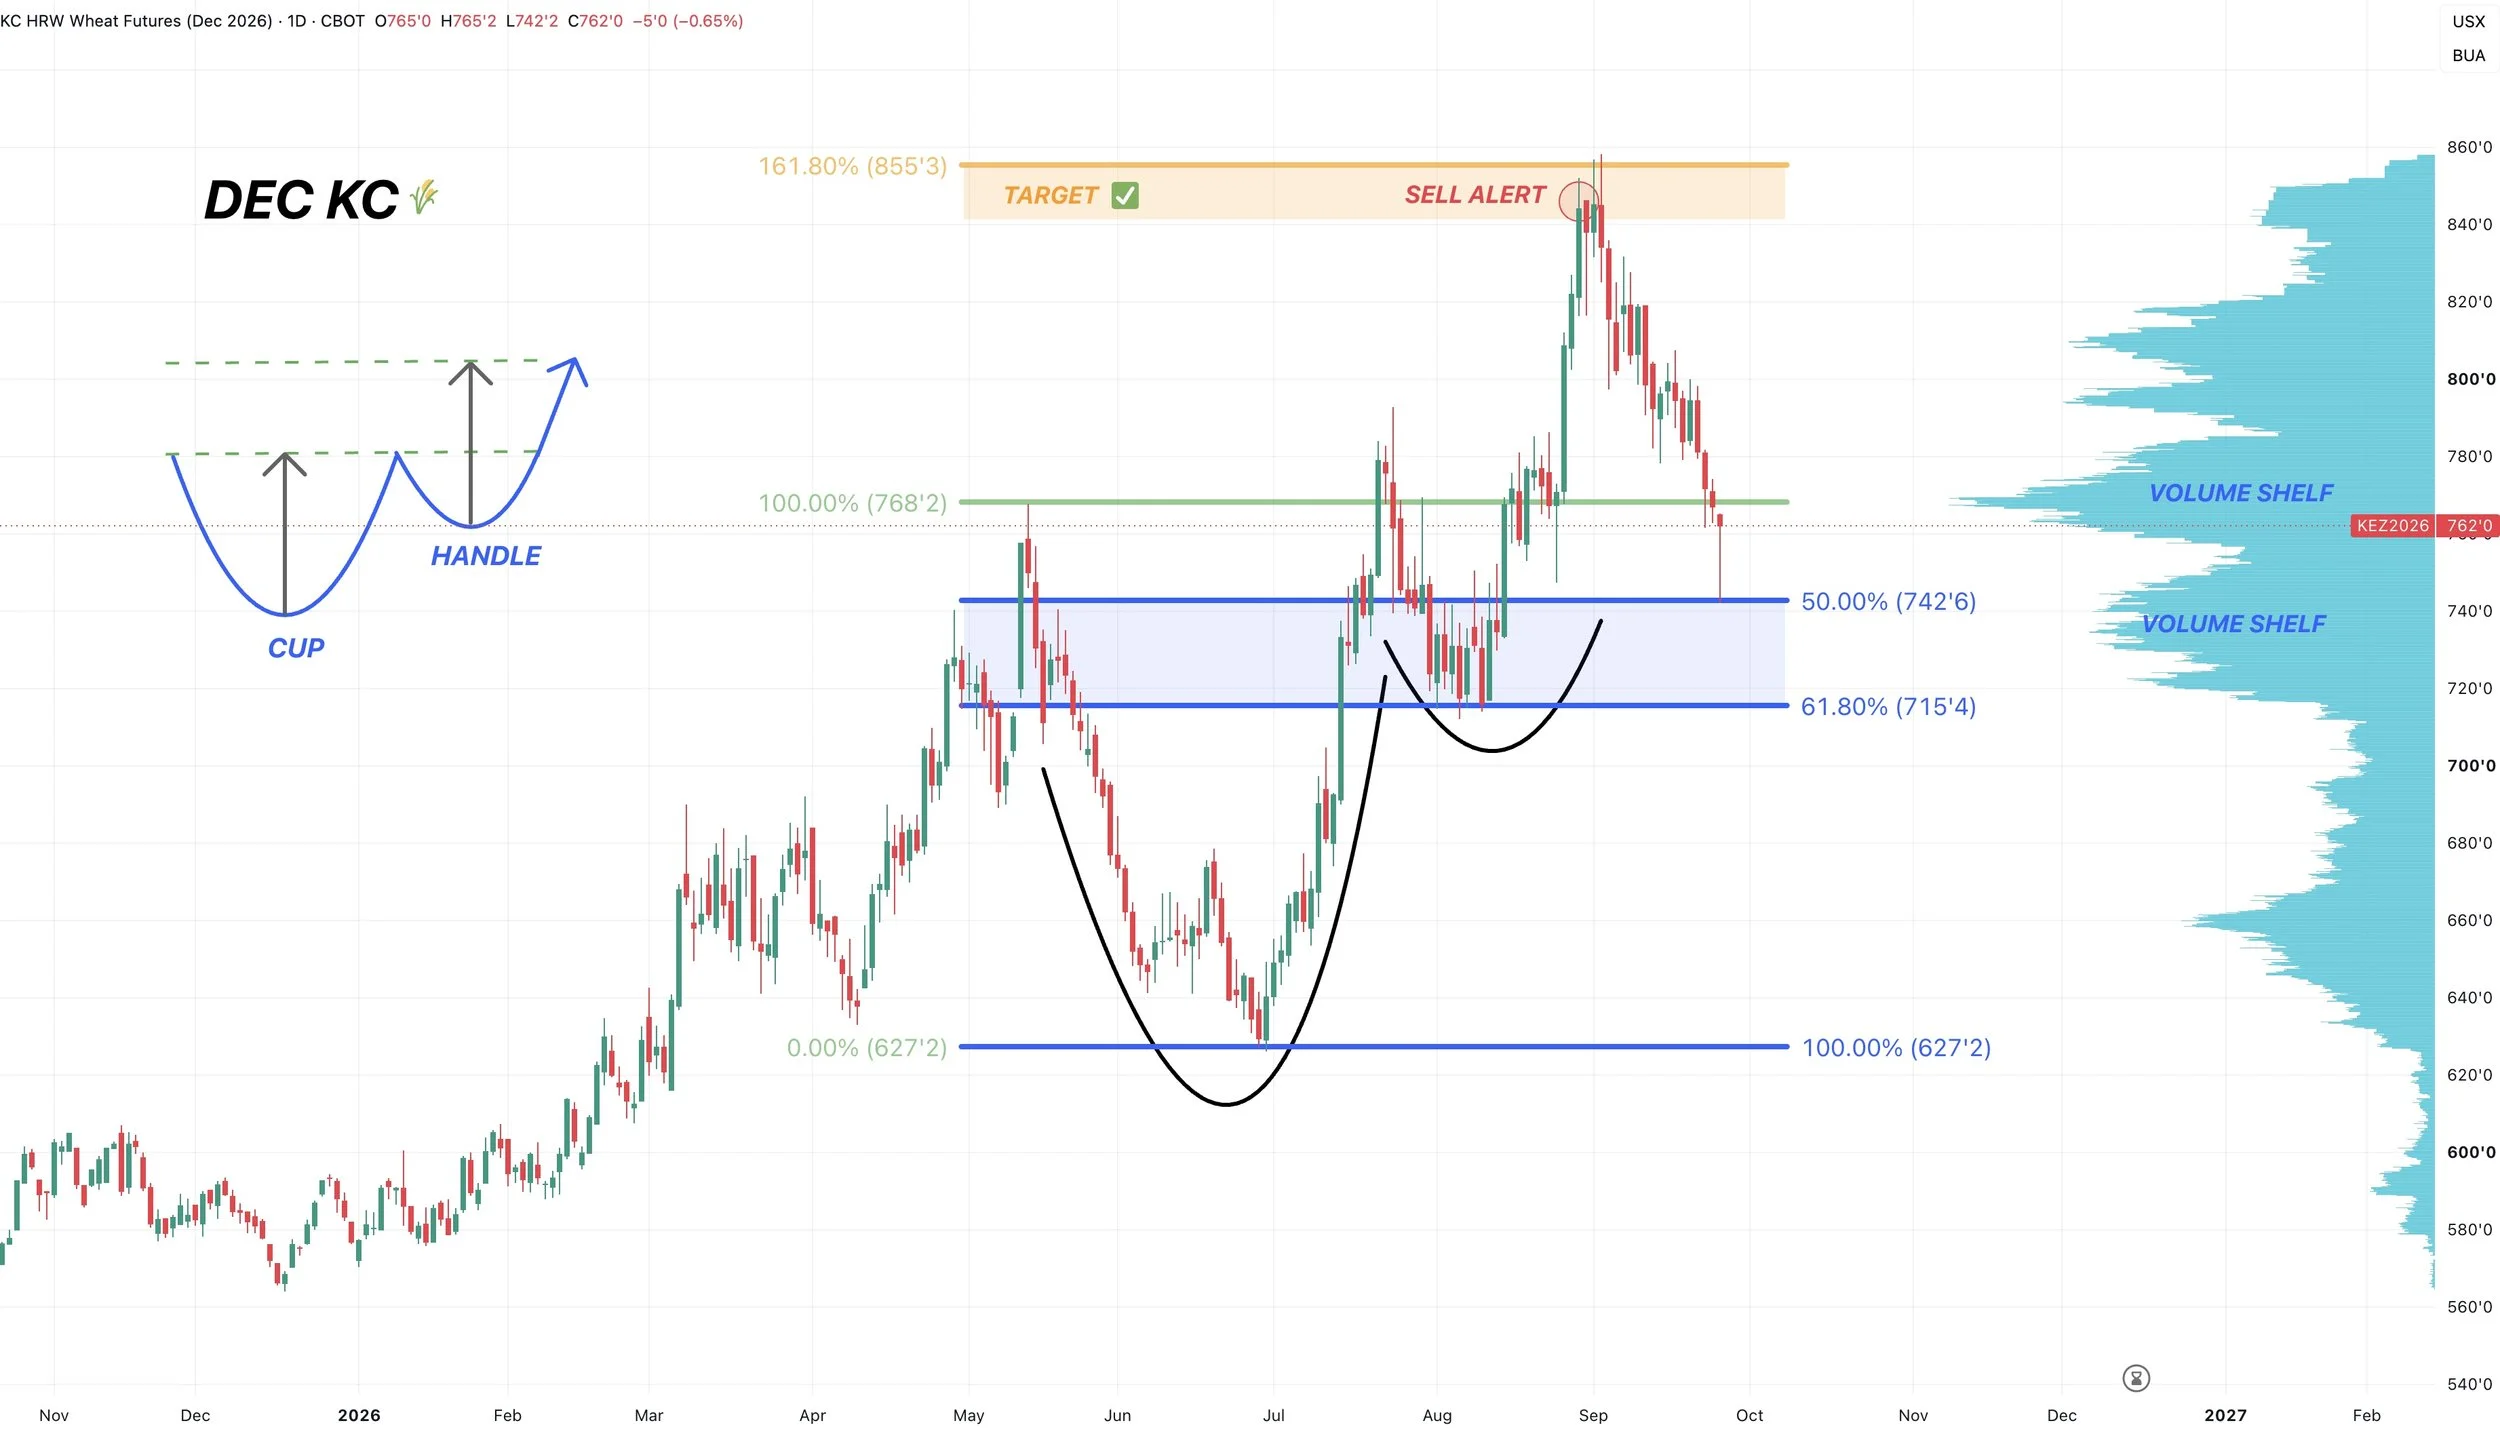
Nice recovery in wheat today too.
We broke below that golden zone down to the August lows. Which has been our original downside target since those highs and that sell alert at $8.50
As that's not only the golden zone but also a major shelf of volume and re-tests the highs from May and July.
We closed just below that level today.
Is it bad we are are below the first golden zone?
Not necessarily.
When we broke below that support overnight, we came all the way down and tagged the next level of support.
We hit the 50% retracement all the way down to the June lows.
Which also aligned with the next shelf of volume.
I have no concerns with wheat unless we break below the 61.8% level at $7.15
The time to get bearish was back at the highs when we hit that target and had bearish divergence, not down here at possible support over a $1.00 off the highs.
We had that buy signal a day or two ago down here. As we feel like this is a good area to buy back previously sold calls, and an area to look to re-own wheat if you followed the $8.50 sell signal.
If you missed it: Click Here to View
Weekly KC Chart:
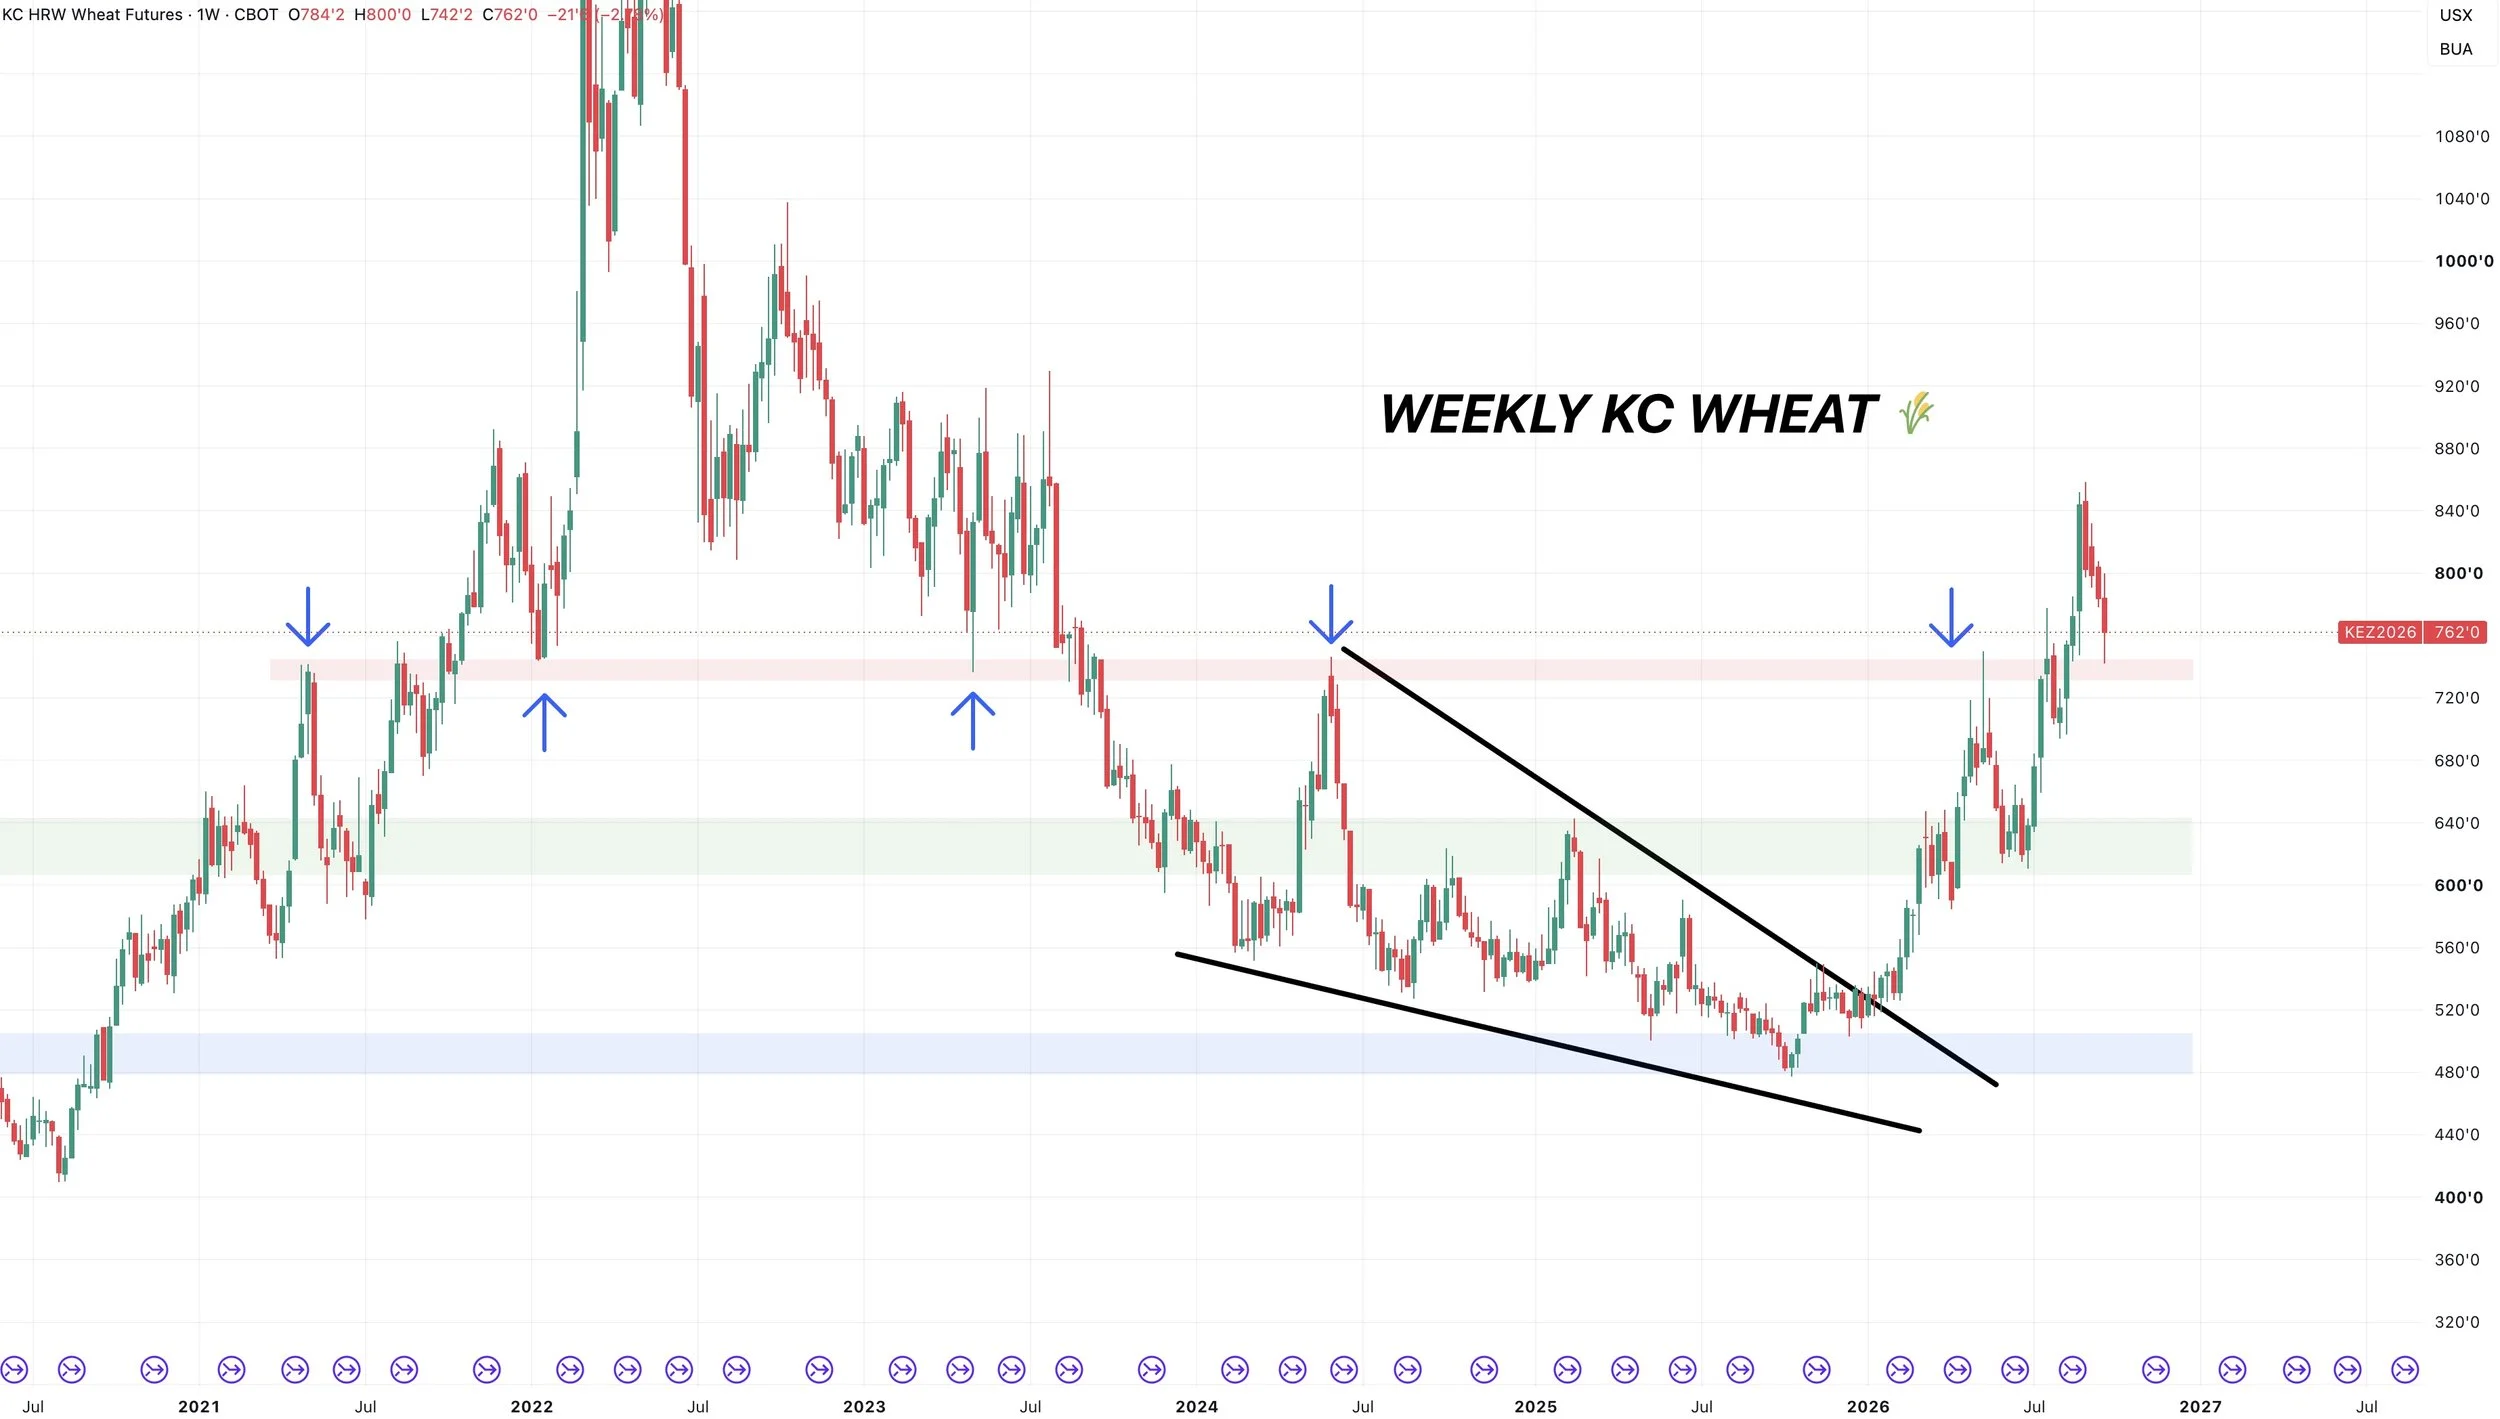
There is nothing bearish about the weekly chart.
I am far from convinced this wheat market is done with it's run.
If you look here, wheat had a massive breakout earlier this year.
We broke above the highs from May.
Which was also the highs from 2024. It was also the lows from 2022 and 2021. It was the highs from 2021.
So it's been a very clear pivot area for wheat over the years.
All we have done now is simply come back down and re-tested the point of breakout.
Huge pull backs like this in wheat are not uncommon all at all.
The bull run in 2021-2022 feautured 4 separate $1.00 to $1.50 pull backs before continuing higher.
I'd like to think we hold this rough area down here.
I would only start to get concerned if we started to break below this big pivot spot.
Cattle
Nov Feeders Chart:
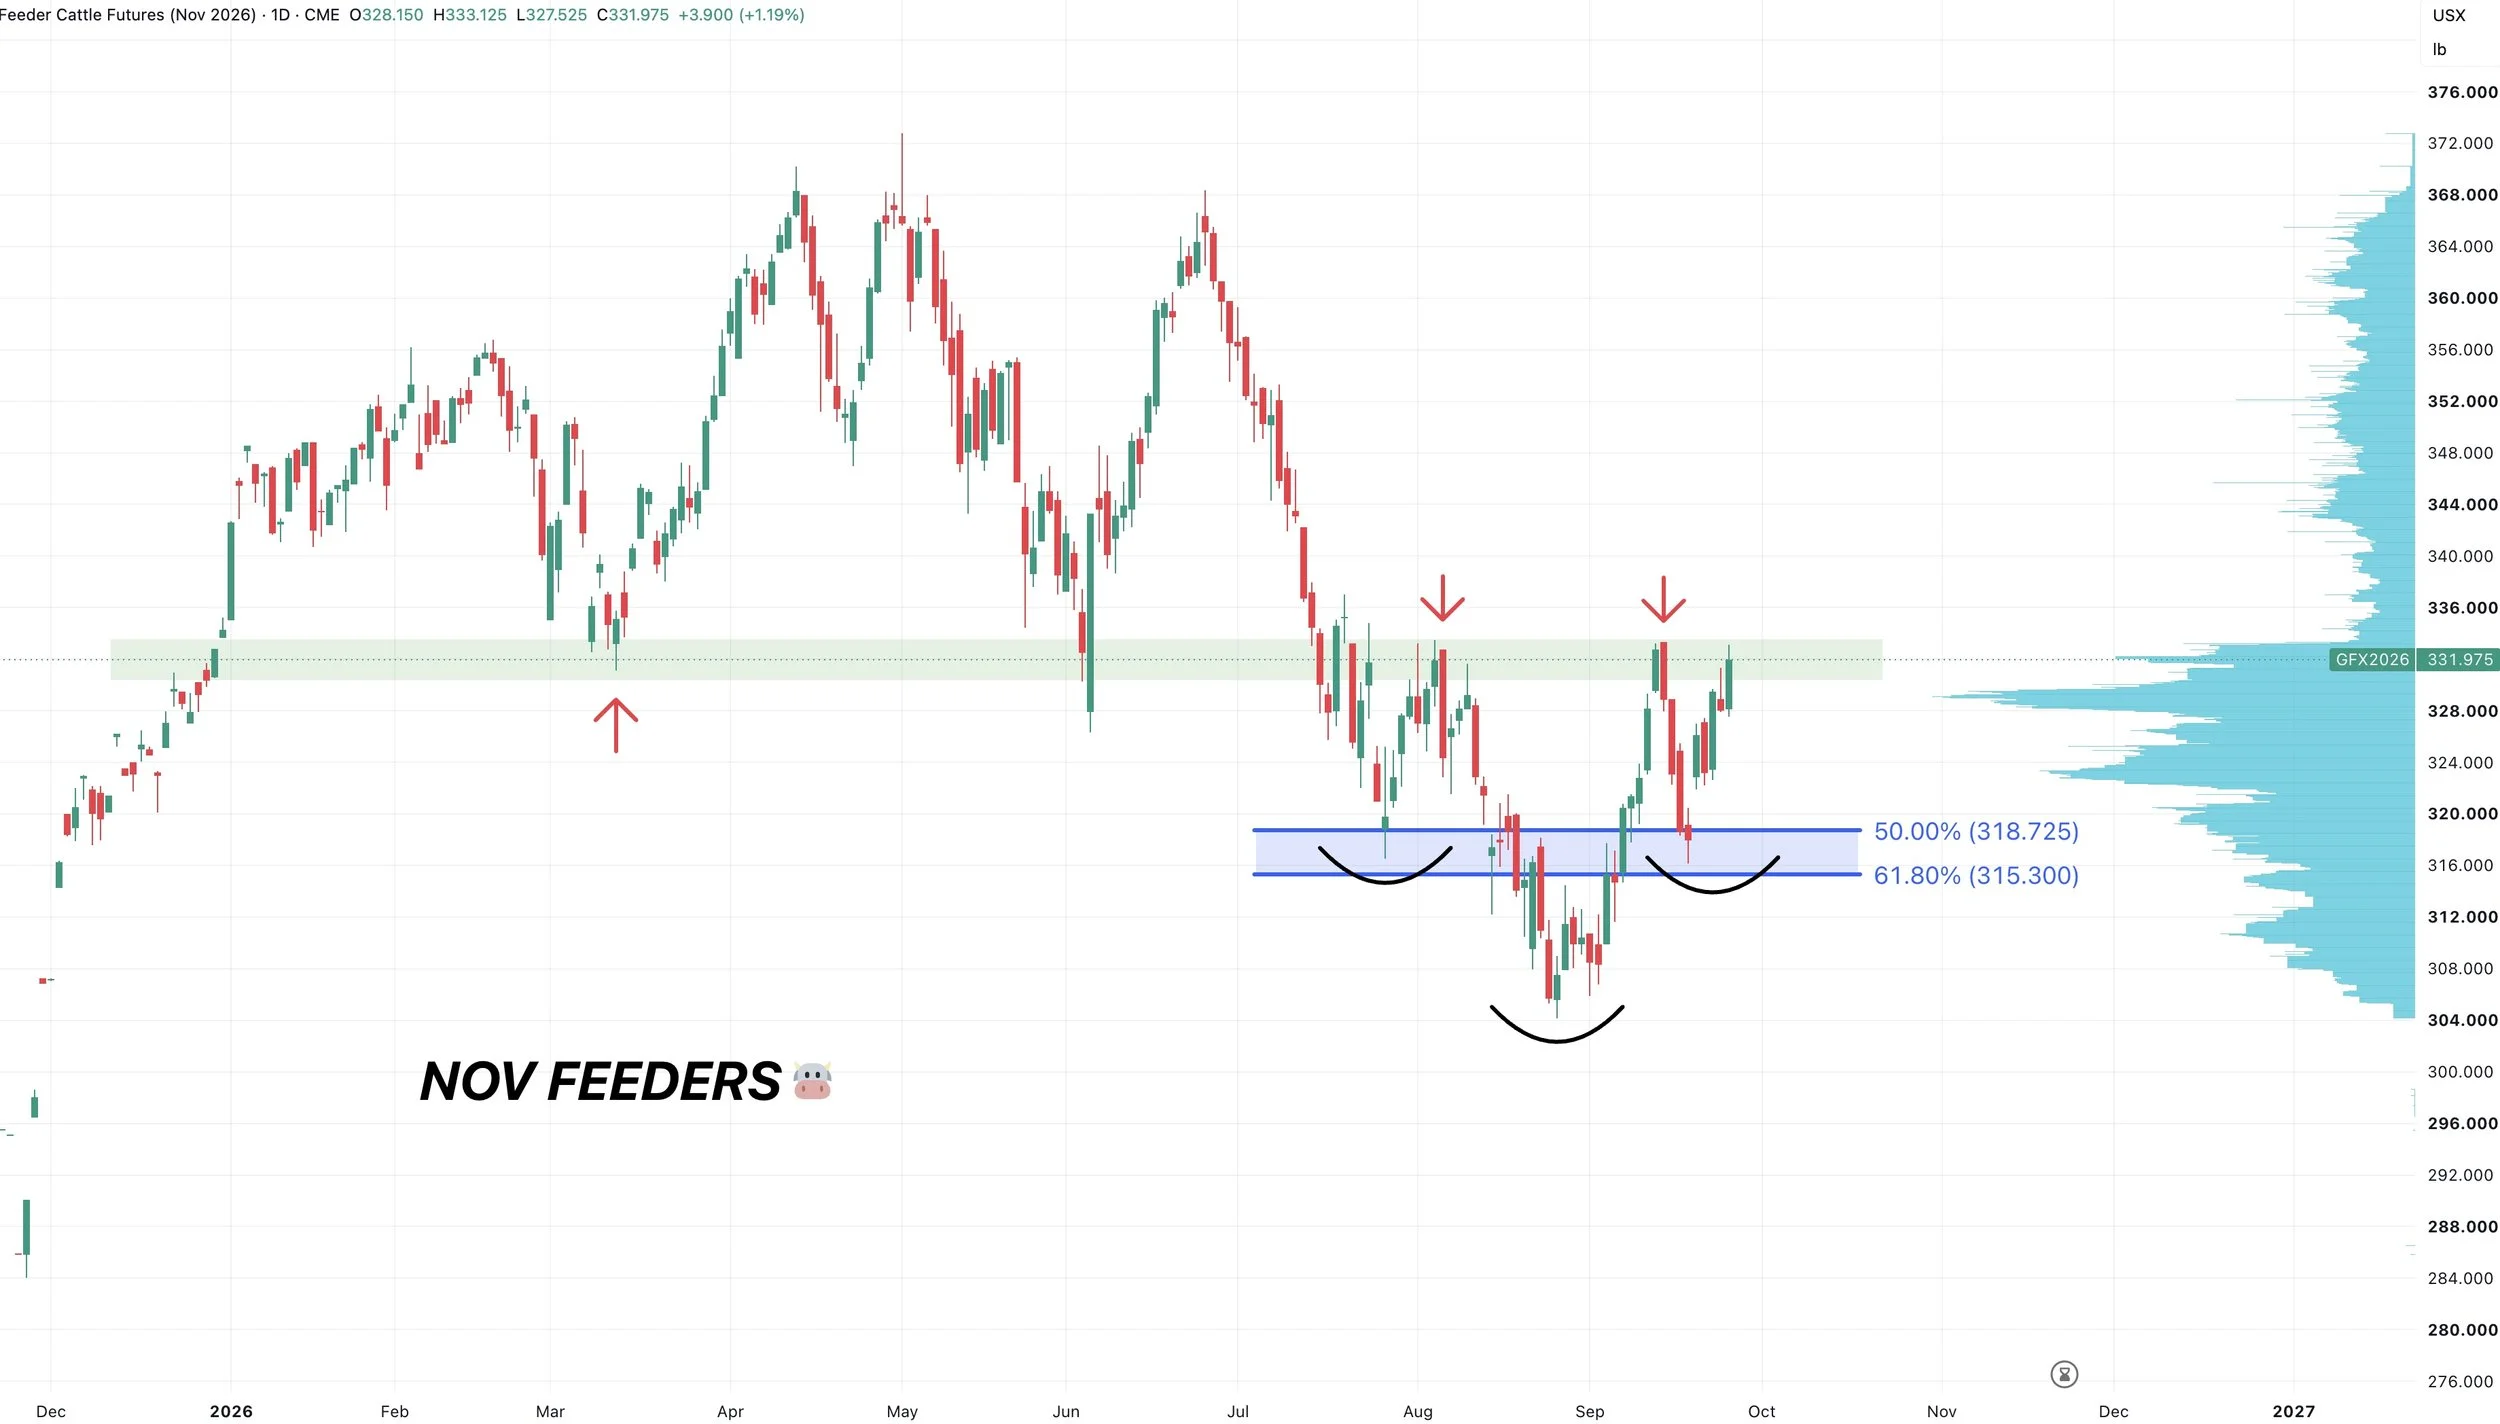
Something to note is that I have switched my charts from Oct to Nov and Dec as they have the most volume.
Pretty good price action in cattle.
We found a bottom exactly where we needed to in that golden zone.
We still have this potential inverse head and shoulders pattern I am keeping my eyes on.
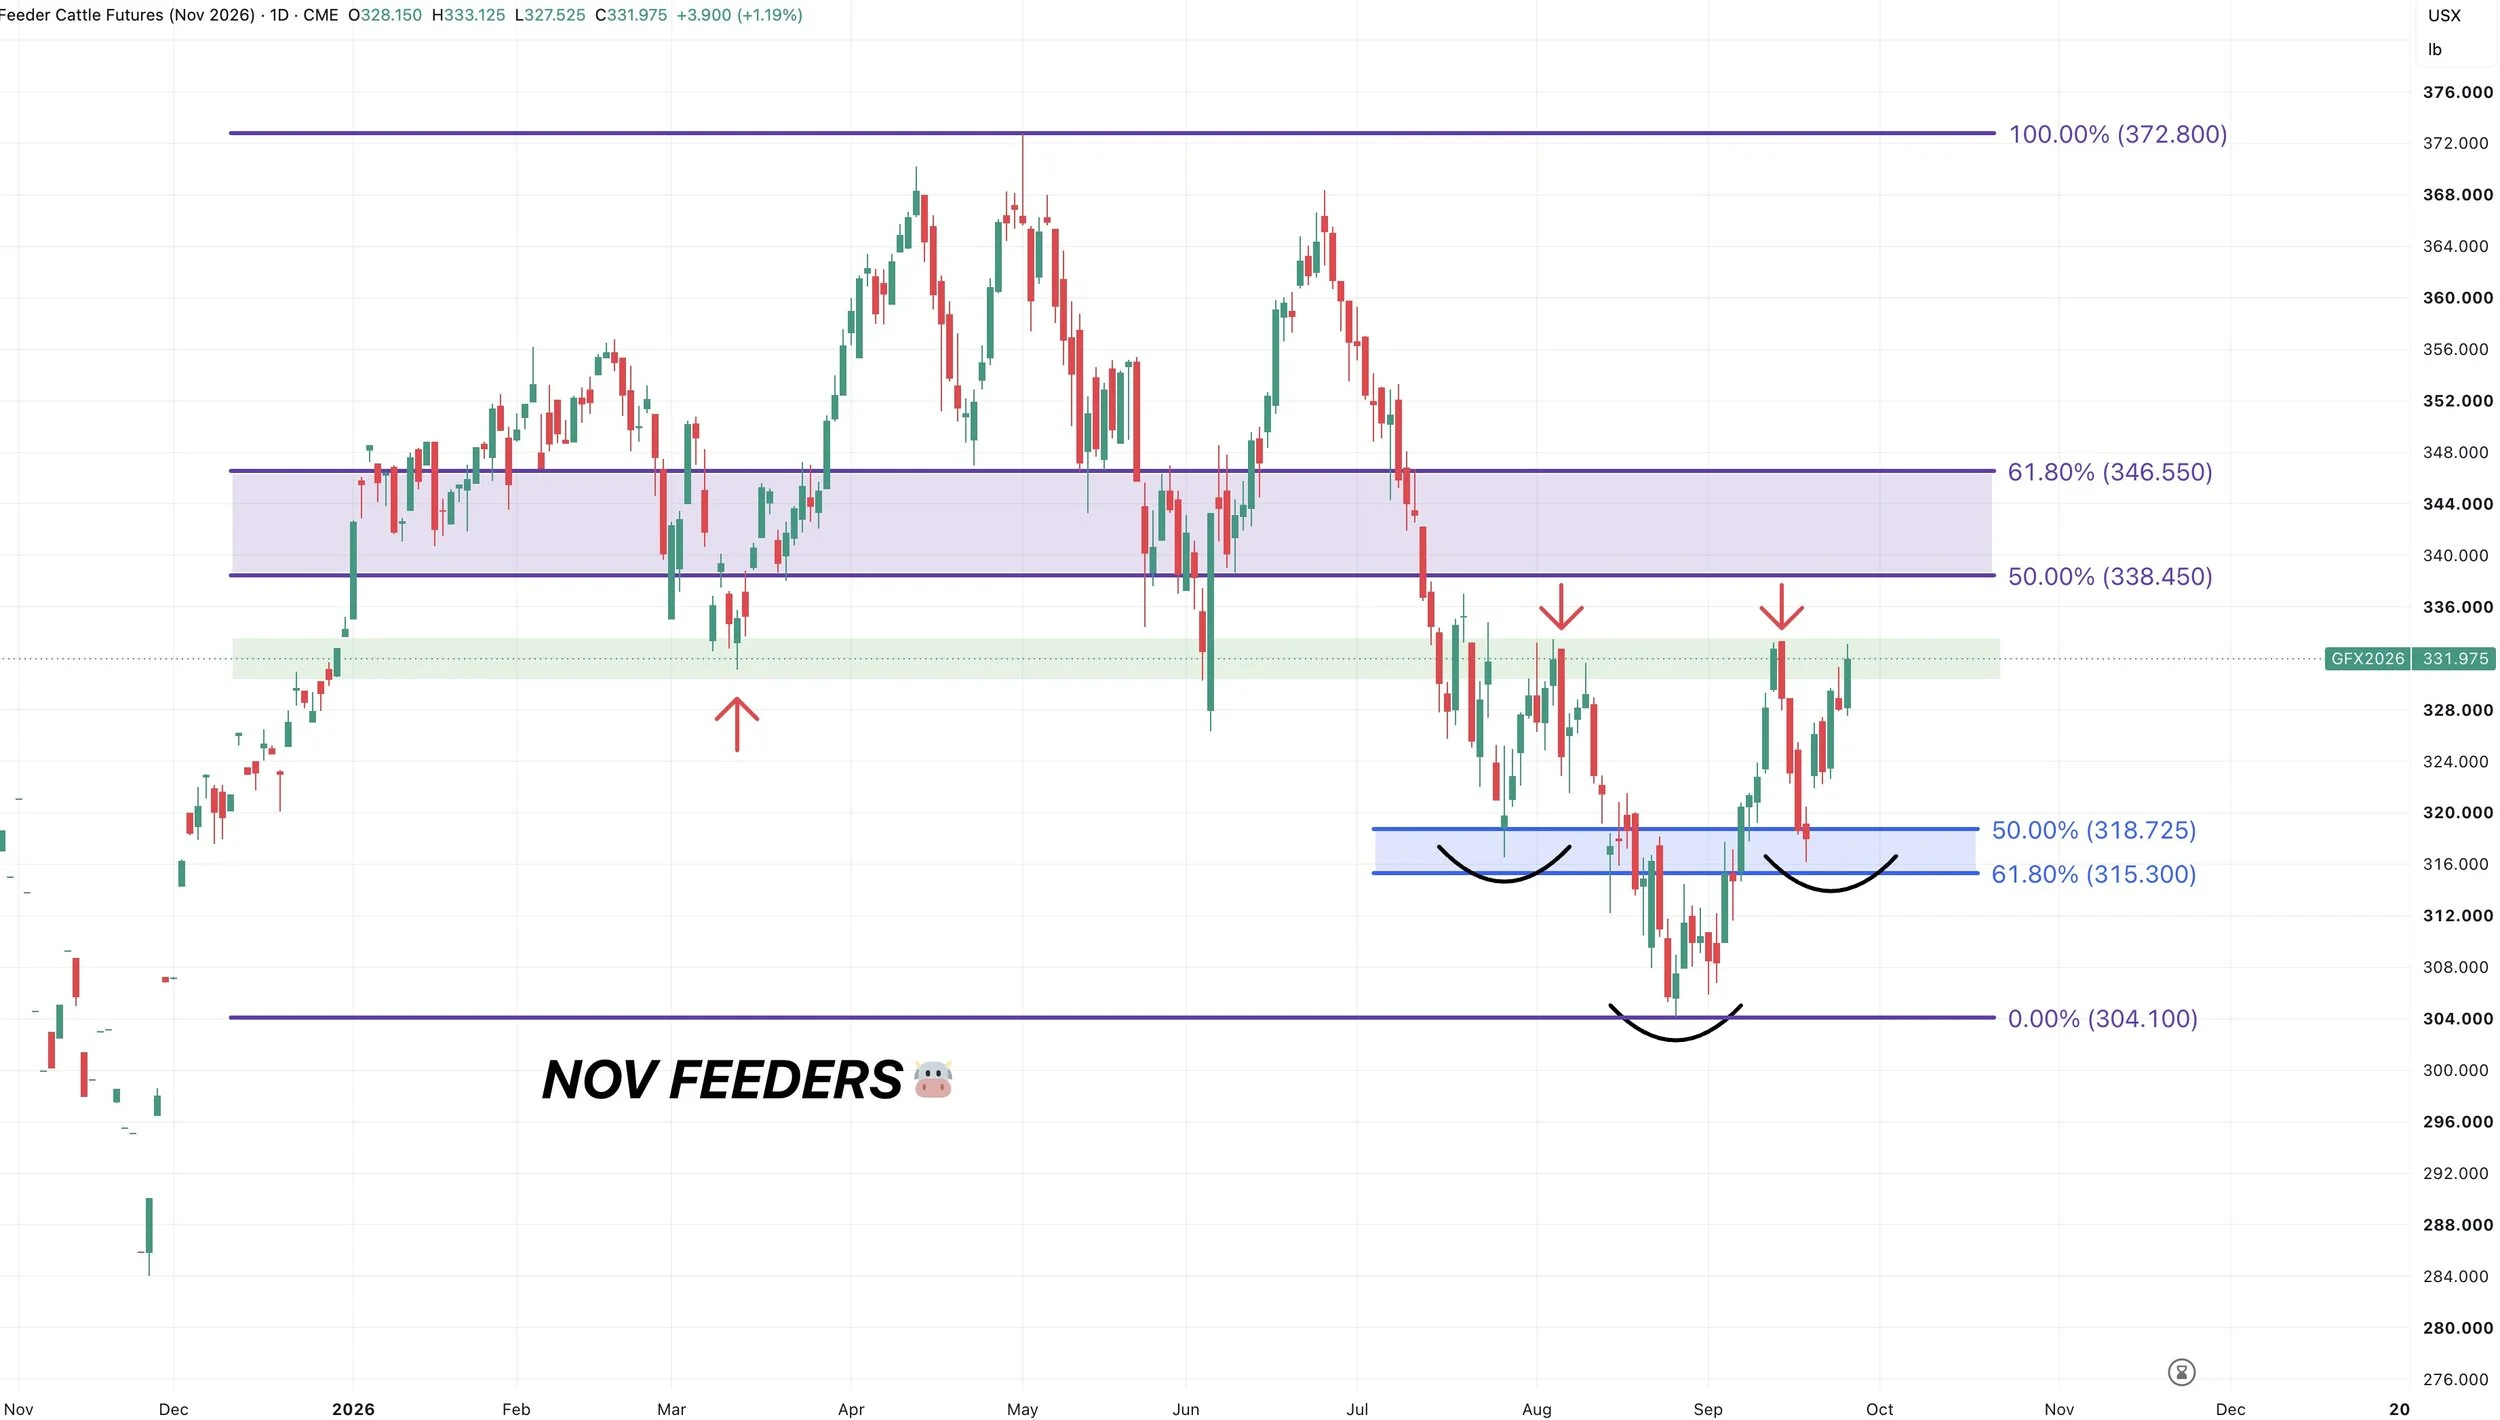
We are running back up into resistance. If we are able to break above the recent highs it should offer more upside.
As the head and shoulders needs a break above for confirmation.
This is pretty key resistance. And where the market has found support or rejected a handful of times now.
This is also peak volume, so a break above could accelerate some upside.
The next target is subject to change, but for now that golden zone up to those May highs is going to be an area to watch if we can bust above this key resistance.
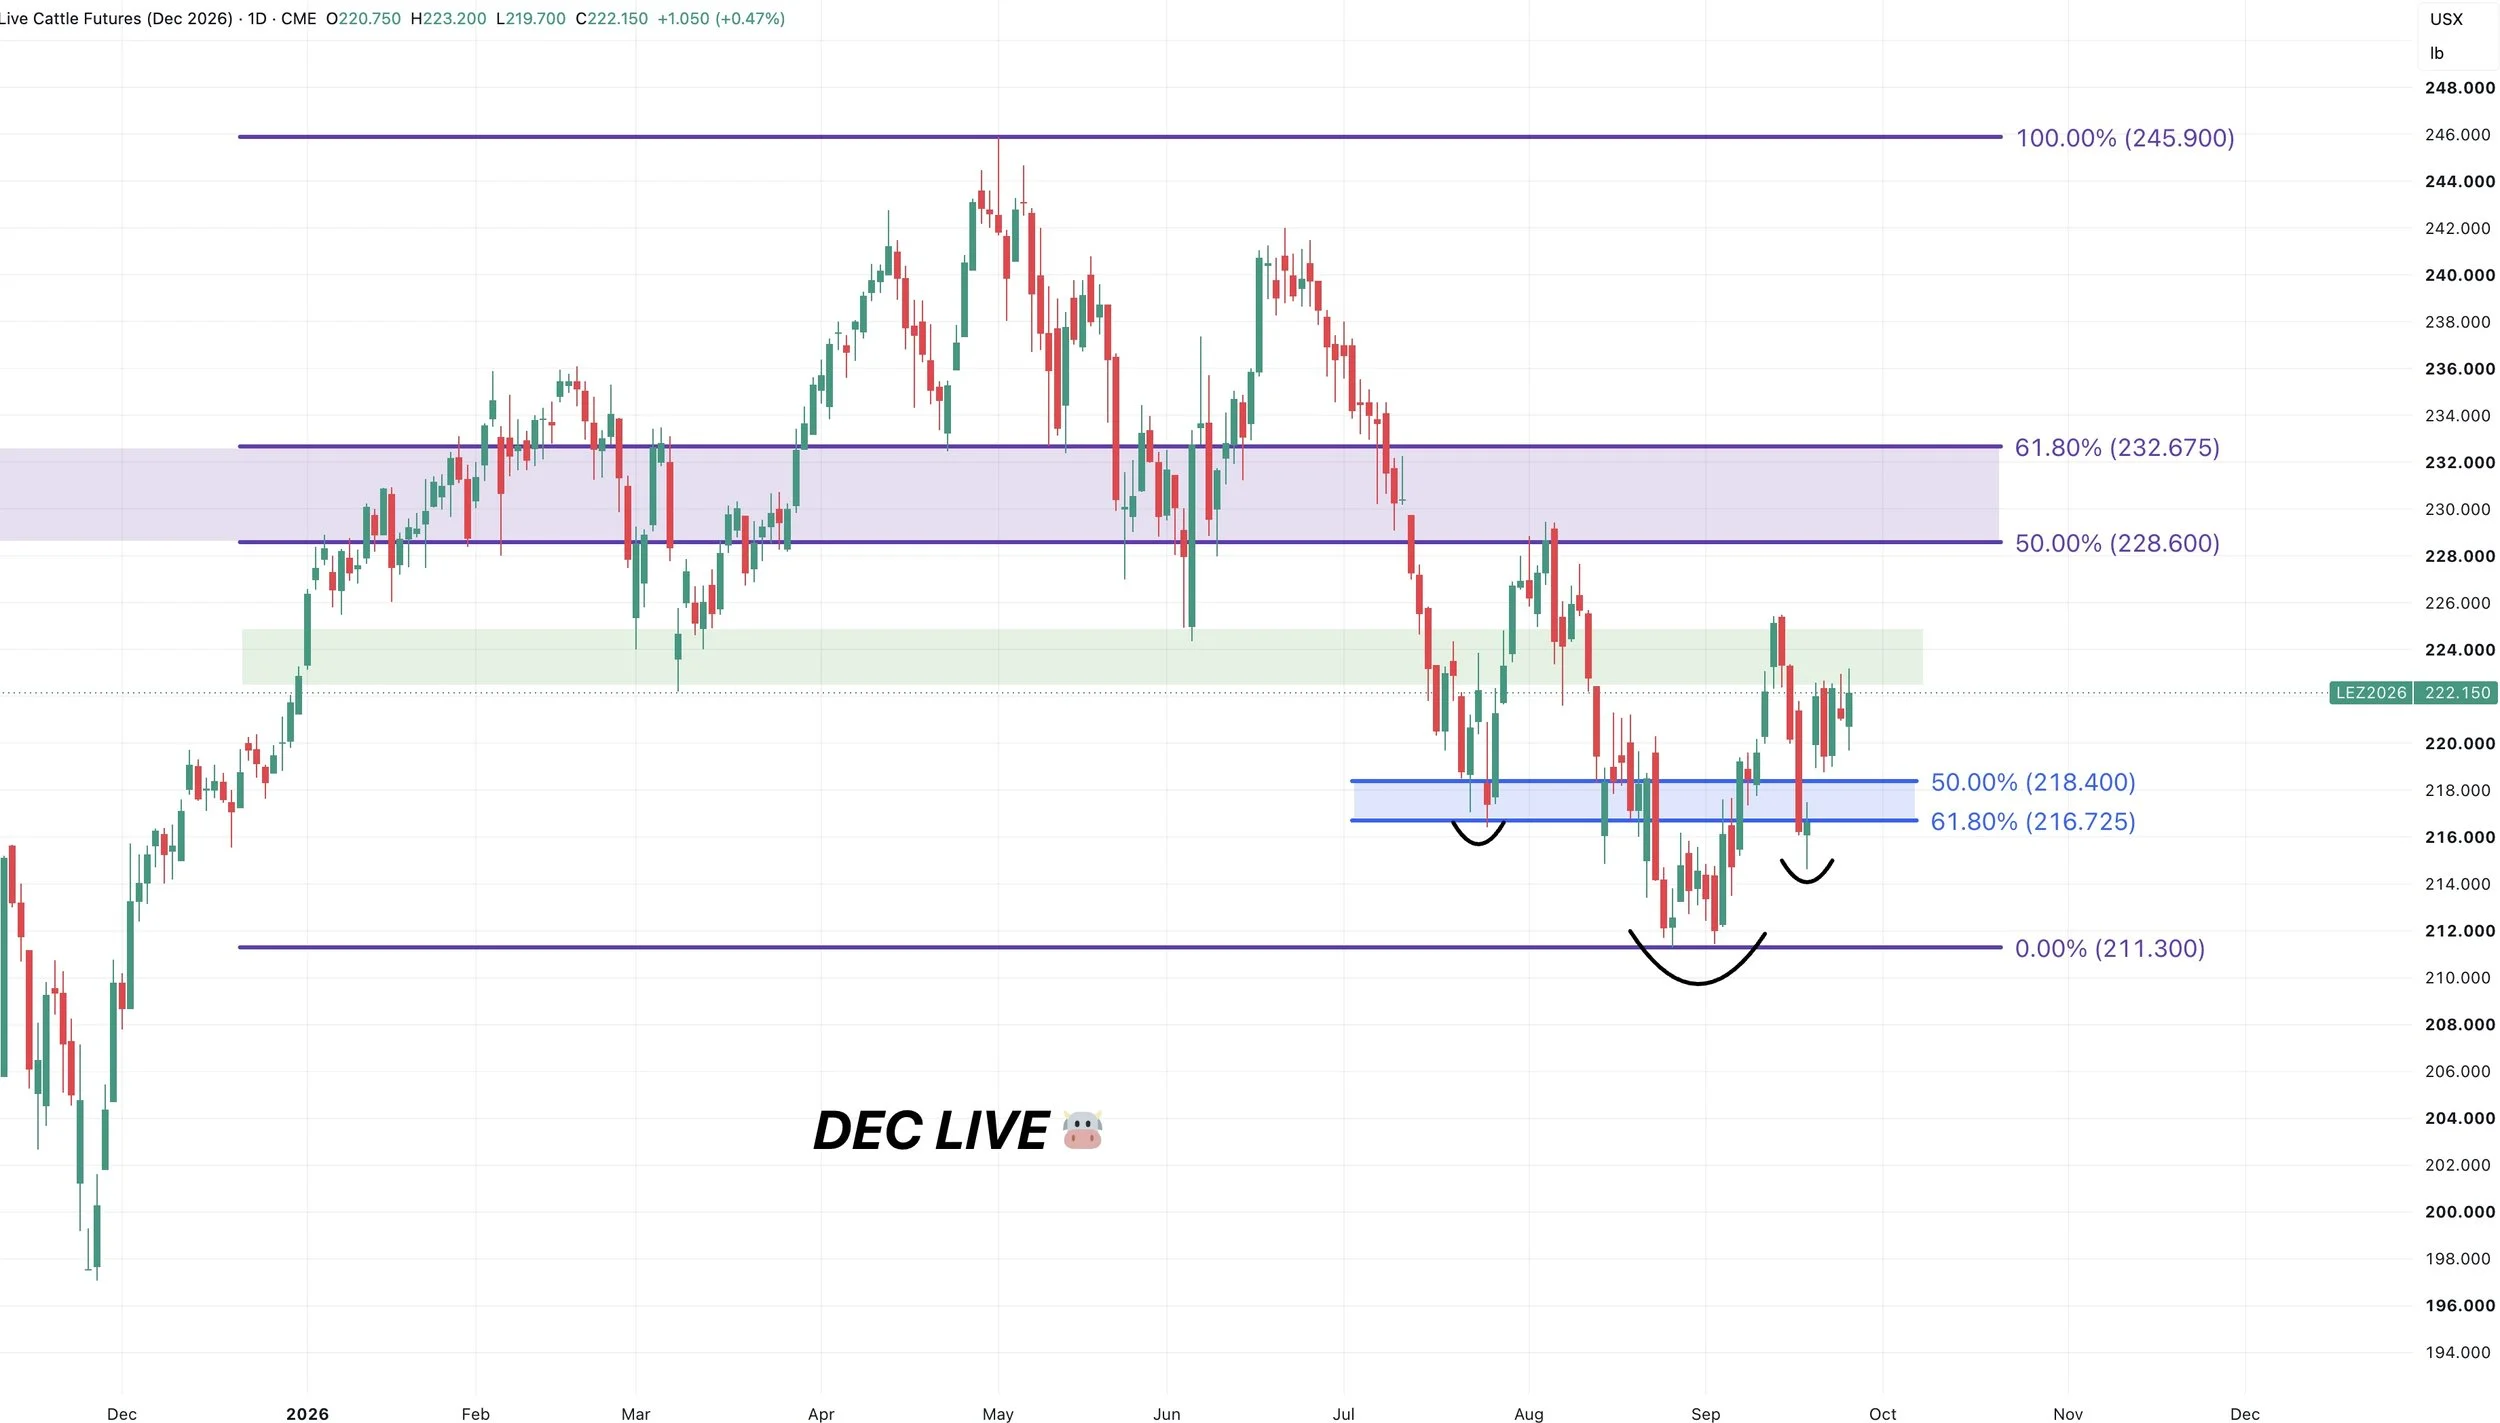
Dec Live Chart:
Live cattle doesn’t have as clean of a chart as feeders.
We held where we needed to in the golden zone.
Now nearing some big resistance here as well that need to break above to open the door to more upside upside.
If we are able to crawl into the golden zone up to the May highs that would likely be a great area to de-risk. But first we need to break the recent highs before getting excited.
We also have a possible inverse head and shoulders pattern here. Which is often a reversal pattern.
Want to Talk?
Our phones are open 24/7 for you guys if you ever need anything or want to discuss your operation.
Jeremey & Office: (806)484-1214
Sebastian: (605)280-1186
Email: sfrost@dailymarketminute.com
Hedge Account
Interested in a hedge account? Use the link below to set up an account or give us a call.