
CHINA OVERREACTION? USDA TOMORROW
MARKET UPDATE
You can scroll to read the usual update as well. As the written version is the exact same as the video.
Timestamps for video:
Overview: 0:00min
Corn: 2:50min
Beans: 9:35min
Wheat: 13:40min
Cattle: 15:00min
Want to talk?
Office: (806)484-1214
Futures Prices Close
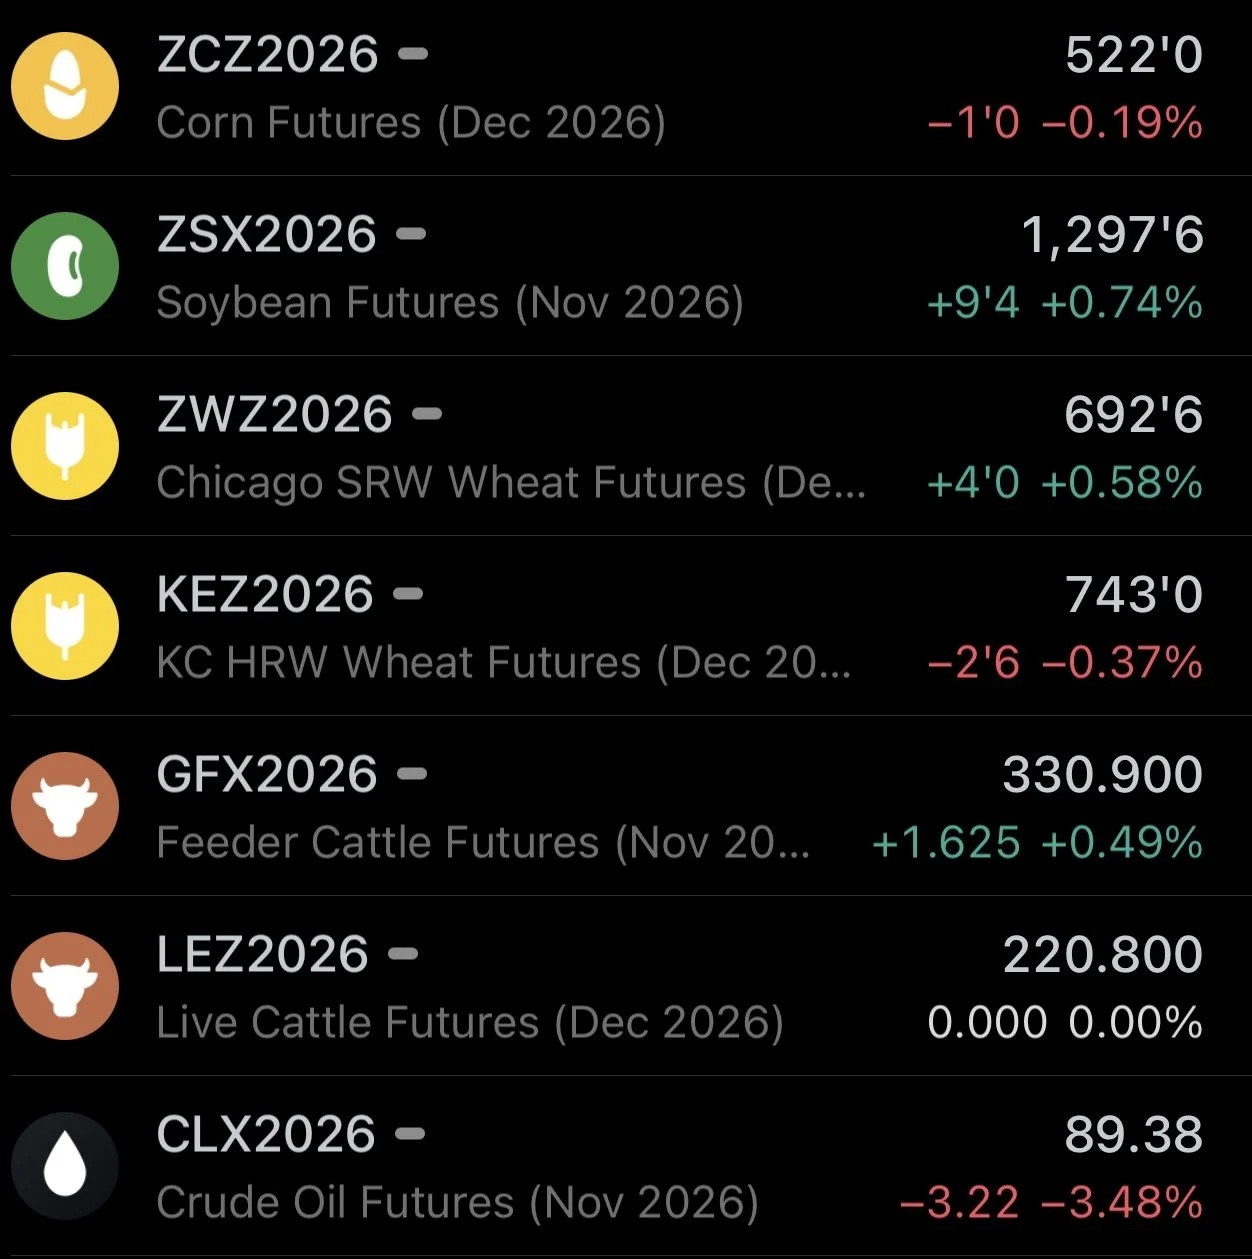
Overview
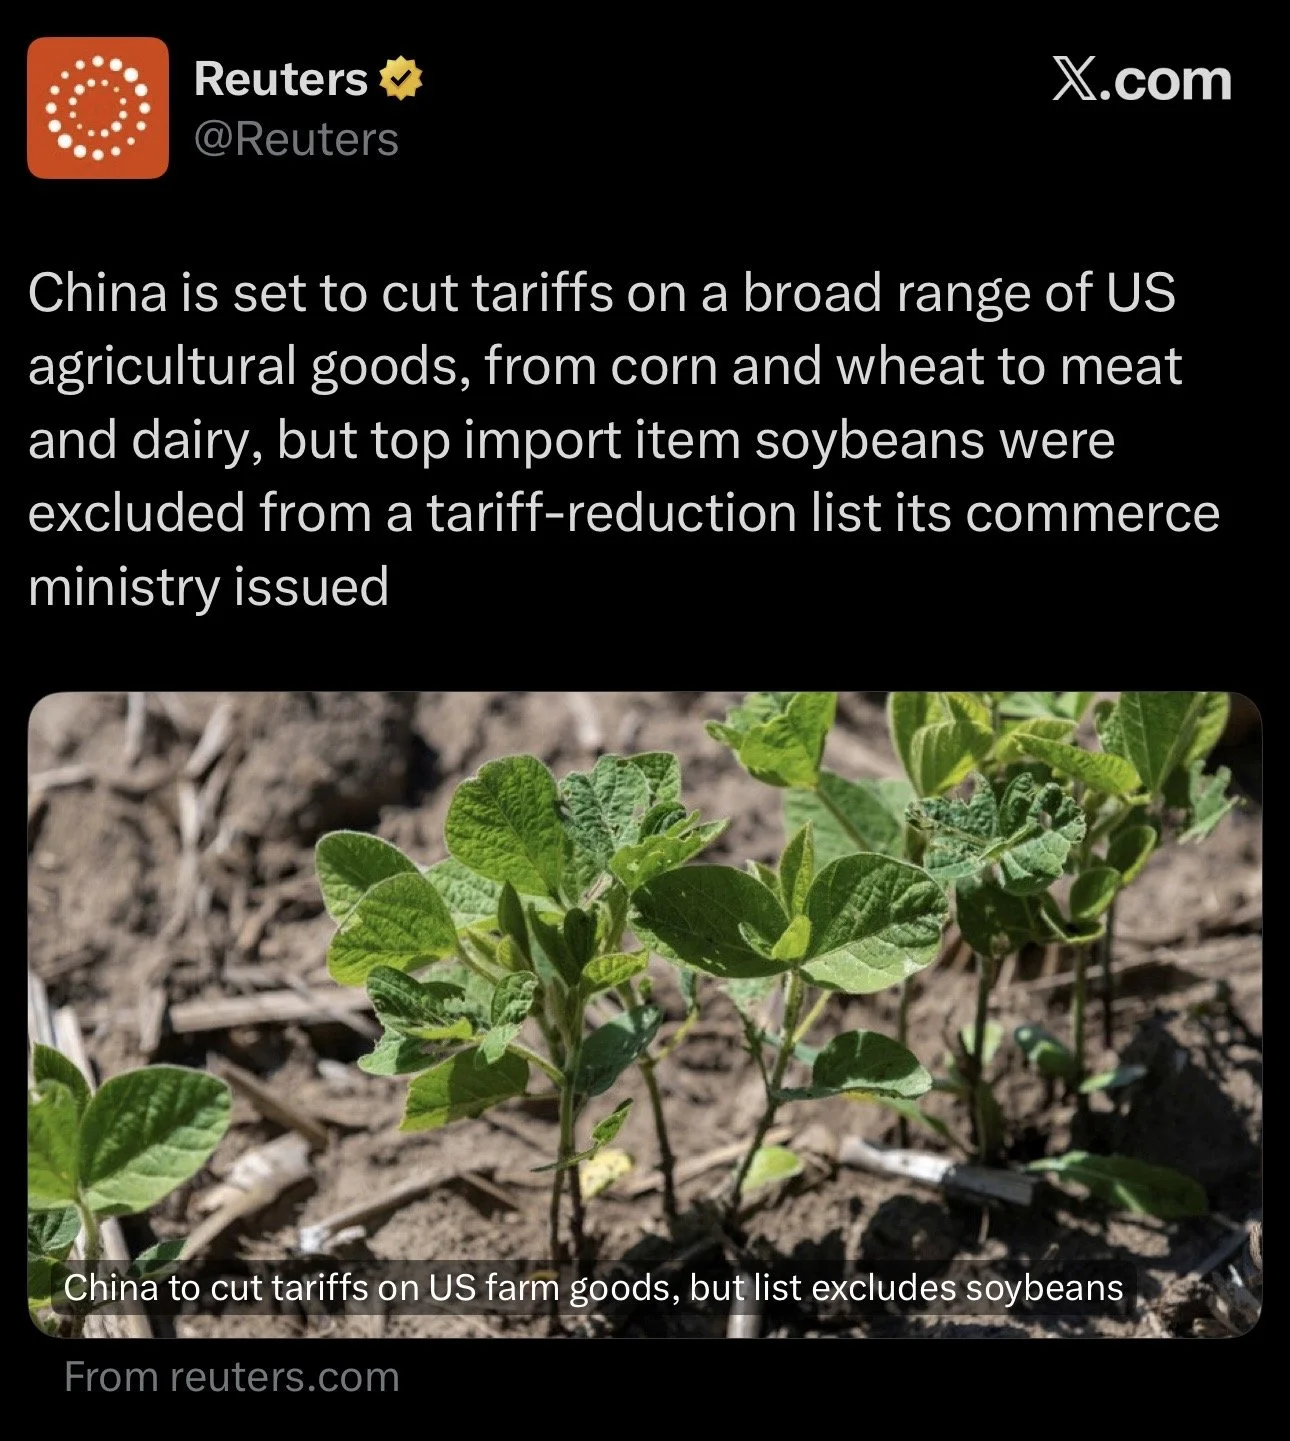
Grains mixed following yesterday's weakness after the release of the China details.
As for the China news, Jeremey already covered this in yesterday's audio.
But essentially, China cut tariffs to nearly every ag product outside of soybeans. So they cut tariffs on corn, wheat, meat, and almost everything except soybeans.
Why did they do this?
To keep it short and simple, soybeans are really just a chess piece when it comes to the US and China. It's the product we export the most of to China.
By keeping the tariff on beans, it helps give China more bargaining power in future negotiations.
There are two buyers when it comes to soybeans.
1) You have private buyers. The tariffs make it harder for them to buy US beans when we have to compete with Brazil. As they have to pay for that tariff.
2) You have the government owned buyers. This is who has been buying our soybeans. They have continued to buy despite the tariffs. Because unlike a private buyer, that tariff money simply goes back to the government. So does it matter if they tariff themselves? Probably not.
So keeping those tariffs on doesn’t help us gain extra demand. But does it really matter if China is going to buy it anyways? I would argue not really.
So overall, it wasn’t as bearish as the market made it seem yesterday. And the reaction was somewhat overexaggerated in my opinion. Although the meeting did fail to feed the bulls, which was a risk we had been talking about.
As for the non-soybeans. They cut tariffs. What does this mean?
Well it makes it cheaper for China to buy non-soybean products. So if they decide they want to buy corn or wheat, it's now cheaper to do so.
The meeting did not include details on exactly what China will buy. But it now makes more economical sense than it did with the tariffs.
The meeting wasn’t bearish, but it didn’t necessarily feed the bulls either. It just reassured us that the goals they agreed to will be met.
But nothing is really new. As the details from the agreement haven’t changed since we originally got them back in May.
Quarterly Stocks Tomorrow
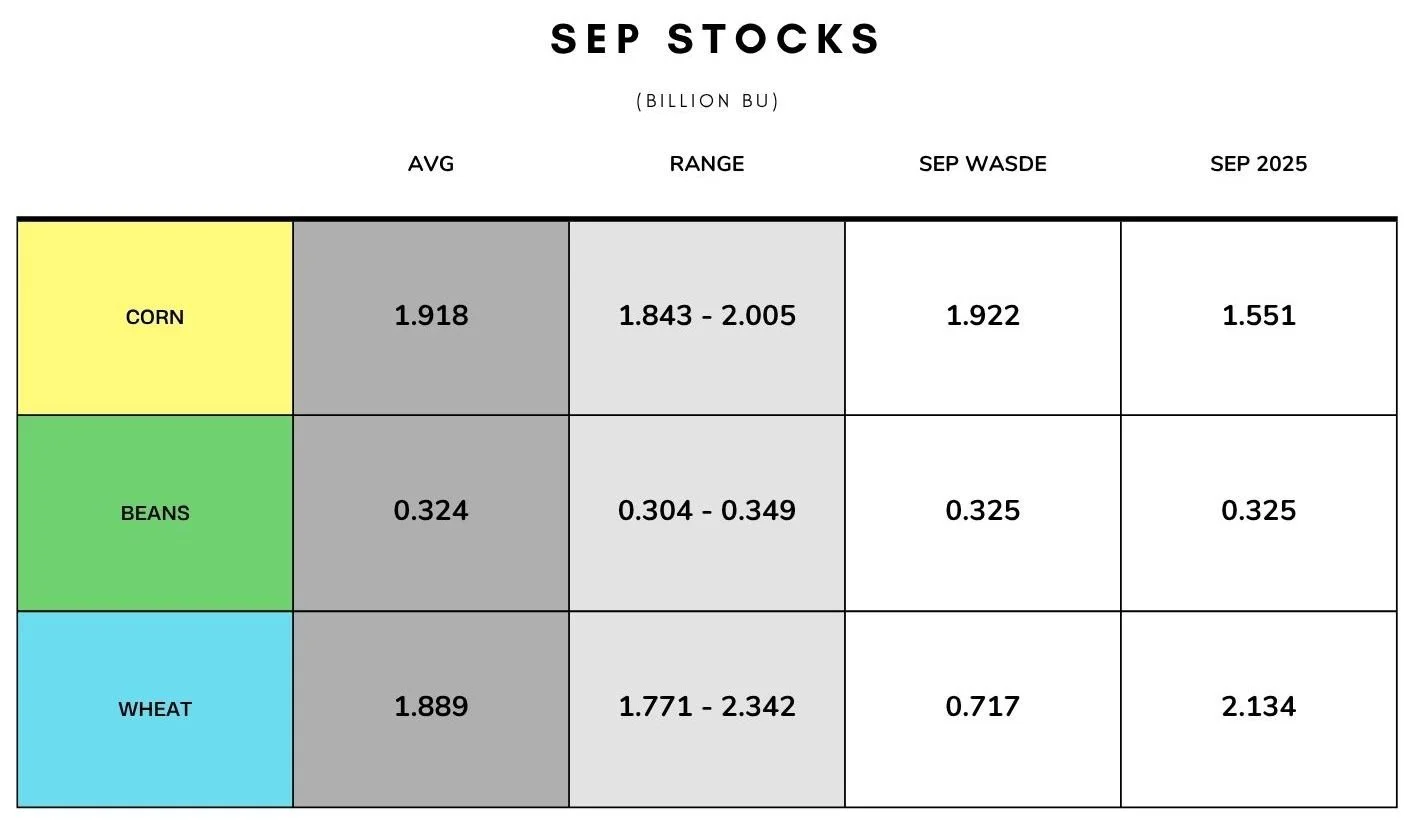
We have the USDA's quarterly stocks report out tomorrow.
Here are the estimates for tomorrow.
Corn (billion bu)
Avg: 1.918
Low: 1.843
High: 1.925
Sep WASDE: 1.922
Beans (million bu)
Avg: 324
Low: 304
High: 349
Sep WASDE: 325
Wheat (billion bu)
Avg: 1.889
Low: 1.771
High: 2.342
So the trade really is not expecting major changes in this report, but can catch the market off guard given no surprises are expected.
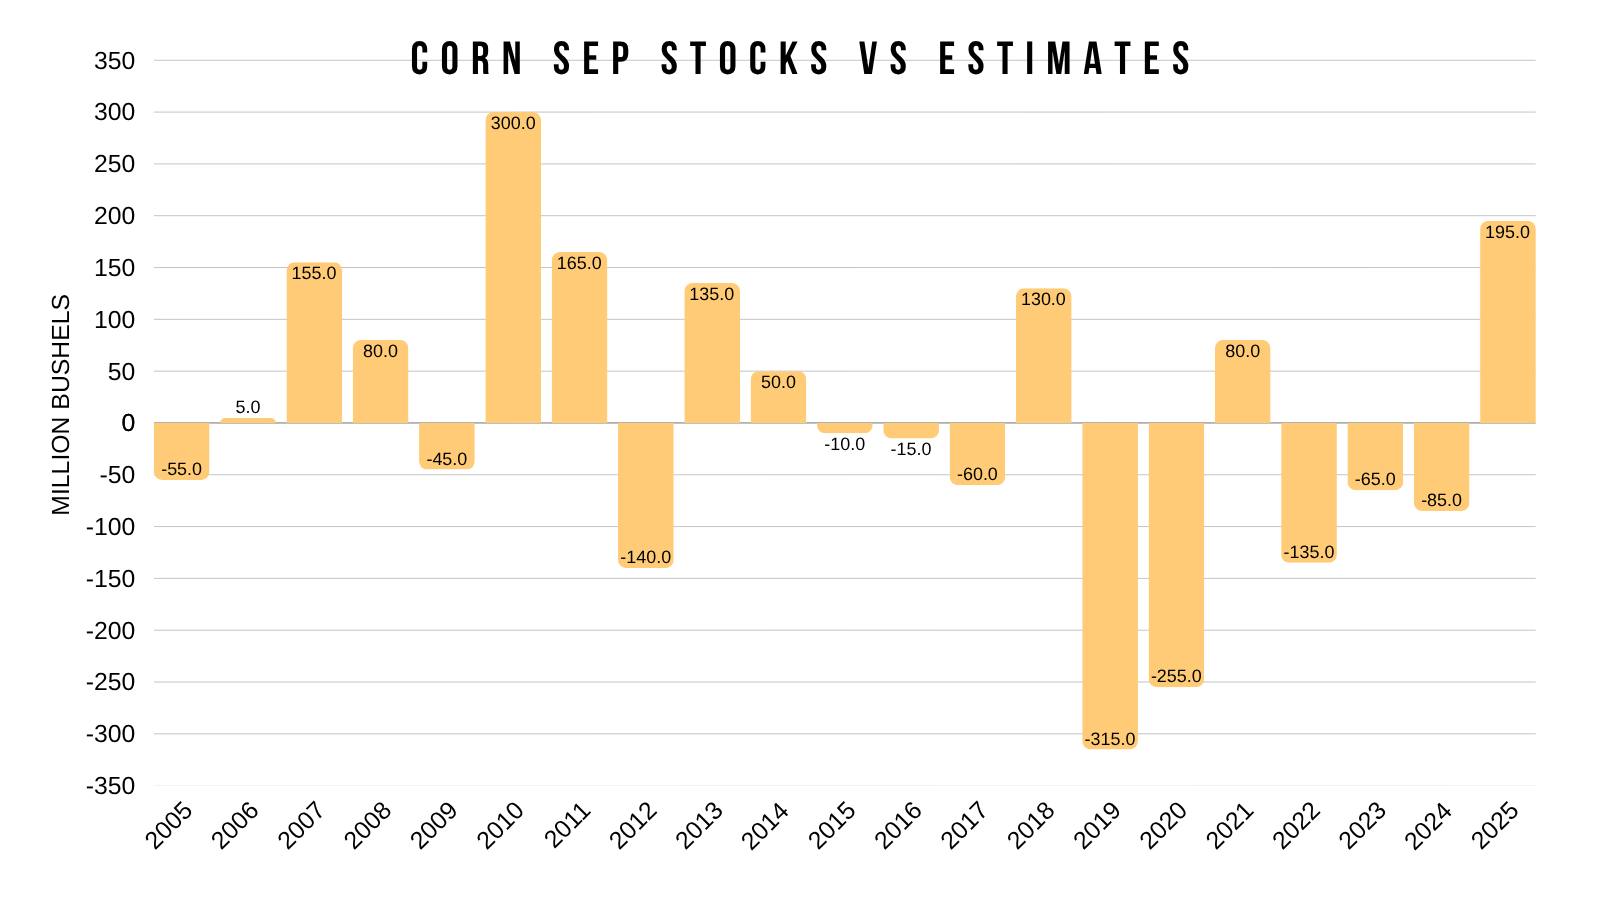
Below is a chart that compares the corn numbers vs the trade estimates.
Corn stocks have come in below the trade estimate in the last 8 of 11 years.
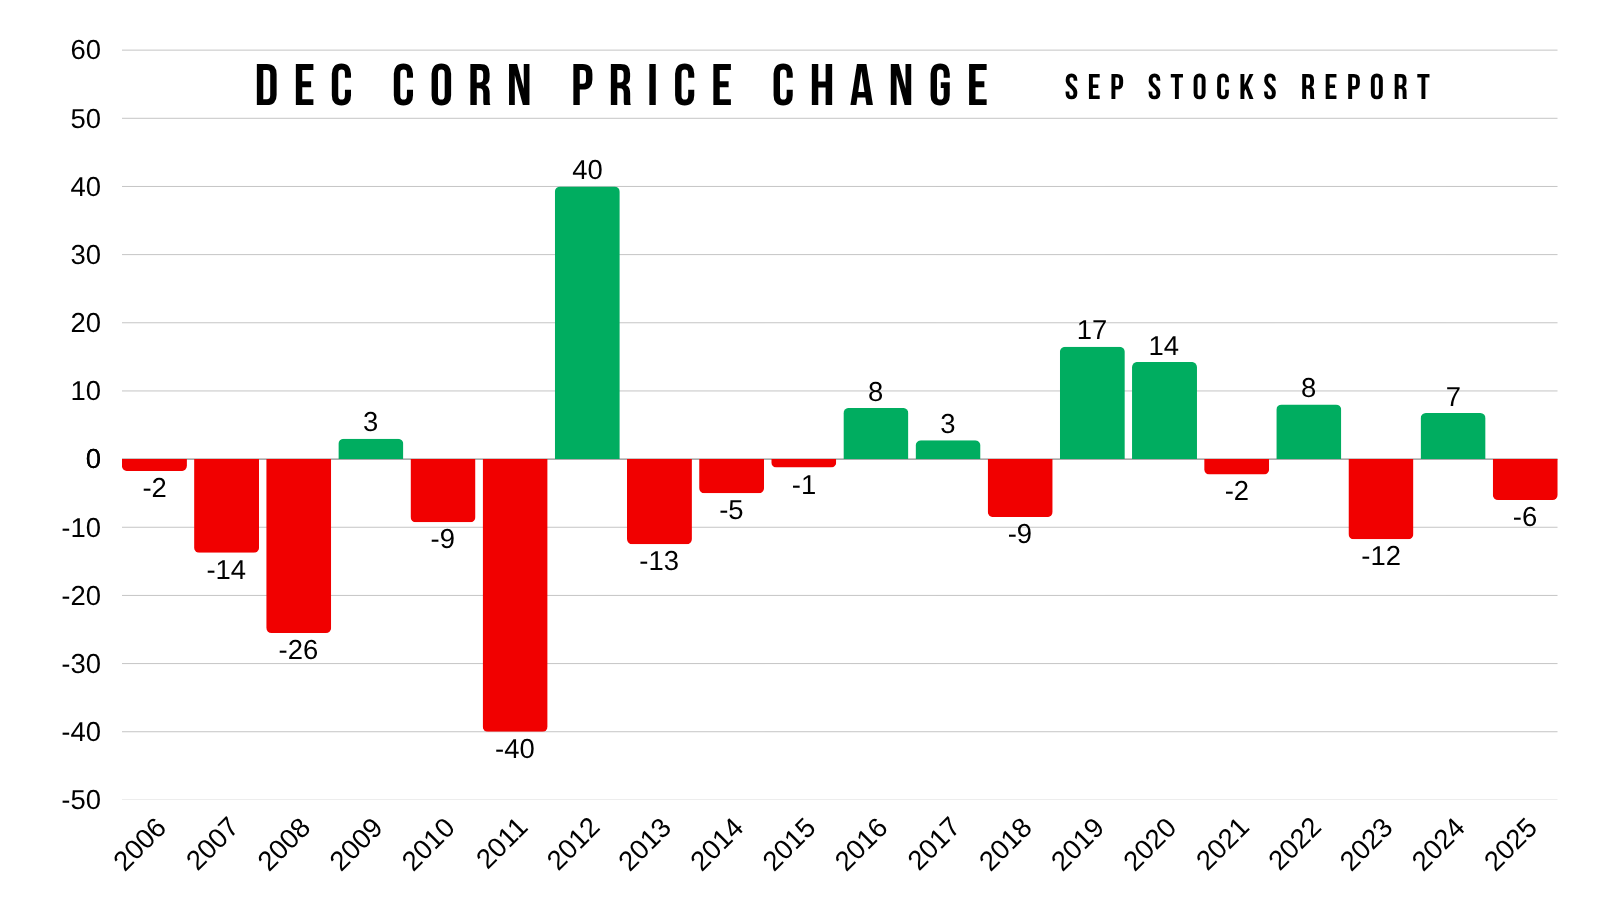
Here are the past price changes for this report.
This report can move the market, but has been on the tame side over the last decade for corn.
We haven’t moved 20 cents since back in 2012.
We've only moved more than 10 cents just 3 times in the last decade.
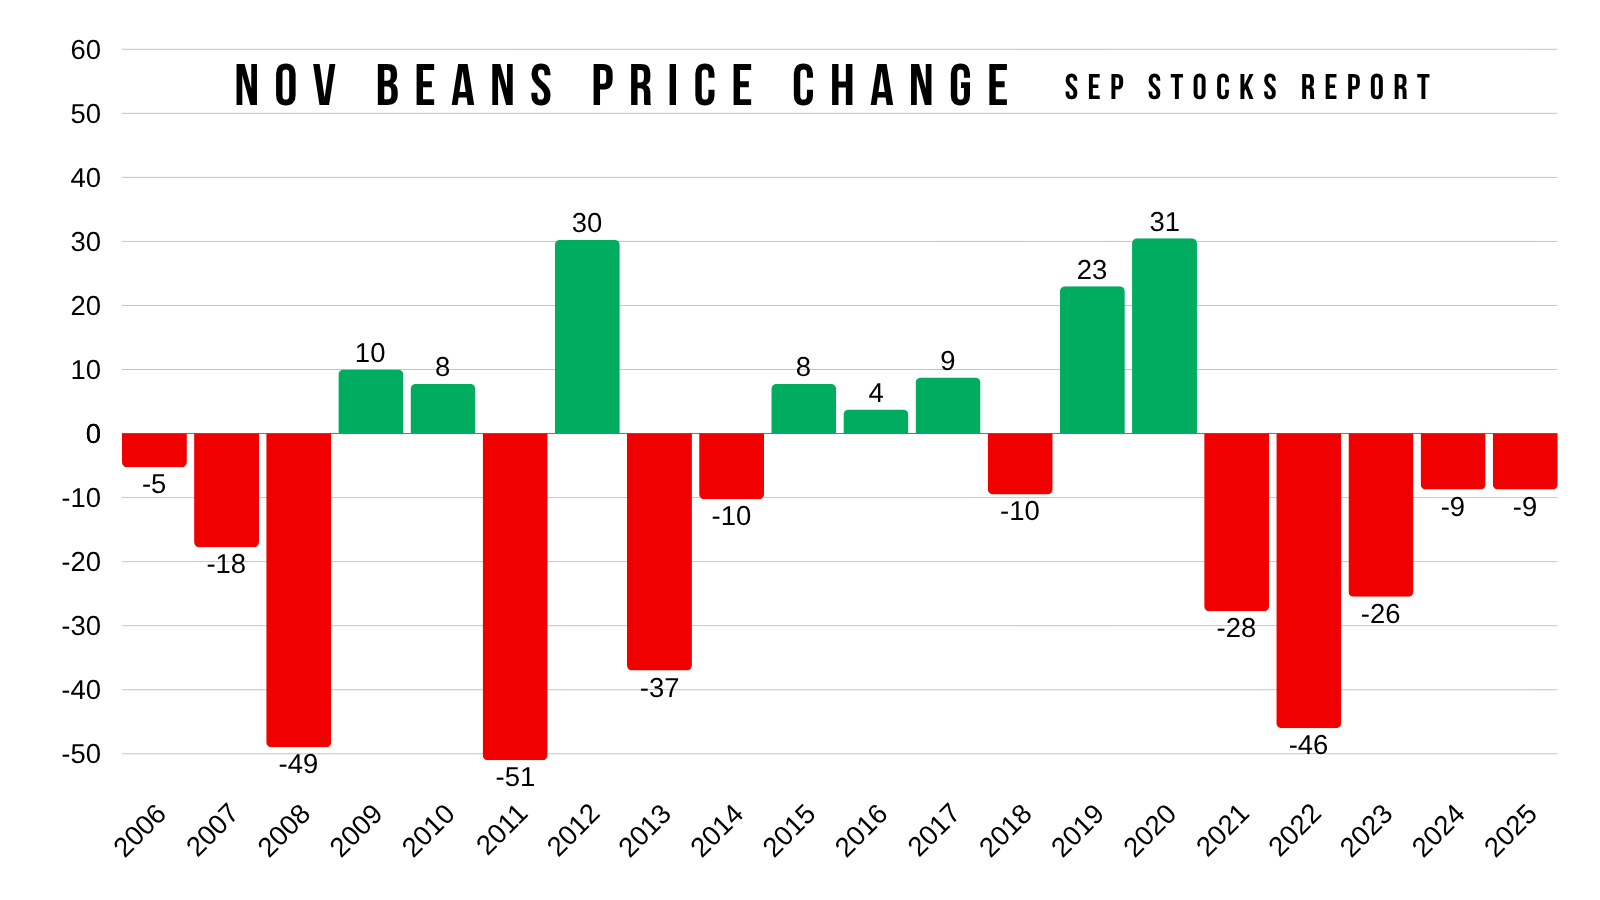
Soybeans on the other hand tend to move a little more compared to corn.
We've seen us move 25 cents or more in 8 of the last 20 years.
We have also traded lower on this report for 5 straight years in a row now.
Today's Main Takeaways
Corn
Fundamentals:
If you want a more in depth fundamental analysis, check out some of my past updates where we talk about it. As we'd just be beating a dead horse talking about the fundamentals today.
Friday's Update: Click Here
Last Tuesday's Update: Click Here
Long term, I still see plenty of upside in corn and the rest of the grains.
We have a tight world situation. We have a tight US situation.
We a balance sheet that could very easily get tighter from here in my opinion. As smalll crops don’t tend to get bigger.
We have record demand. We are not at prices that are going to ration that demand.
You have inflation, crude, diesel, and the rest of the macros adding fuel to the story.
The funds are record long. When they are record long, they tend to defend that position for a while. Rather than simply puking and getting short.
We have a Super El Niño that's not going to be helping global production.
So I see plenty of potential long term heading into next year.
Pullbacks are healthy. There is a reason I was pretty vocal about being cautious up near $5.50 earlier this month heading into harvest, and why we had that sell alert on Sep 2nd.
But now, I don’t like selling anything here and am waiting for the next opportunity.
2010 vs 2026
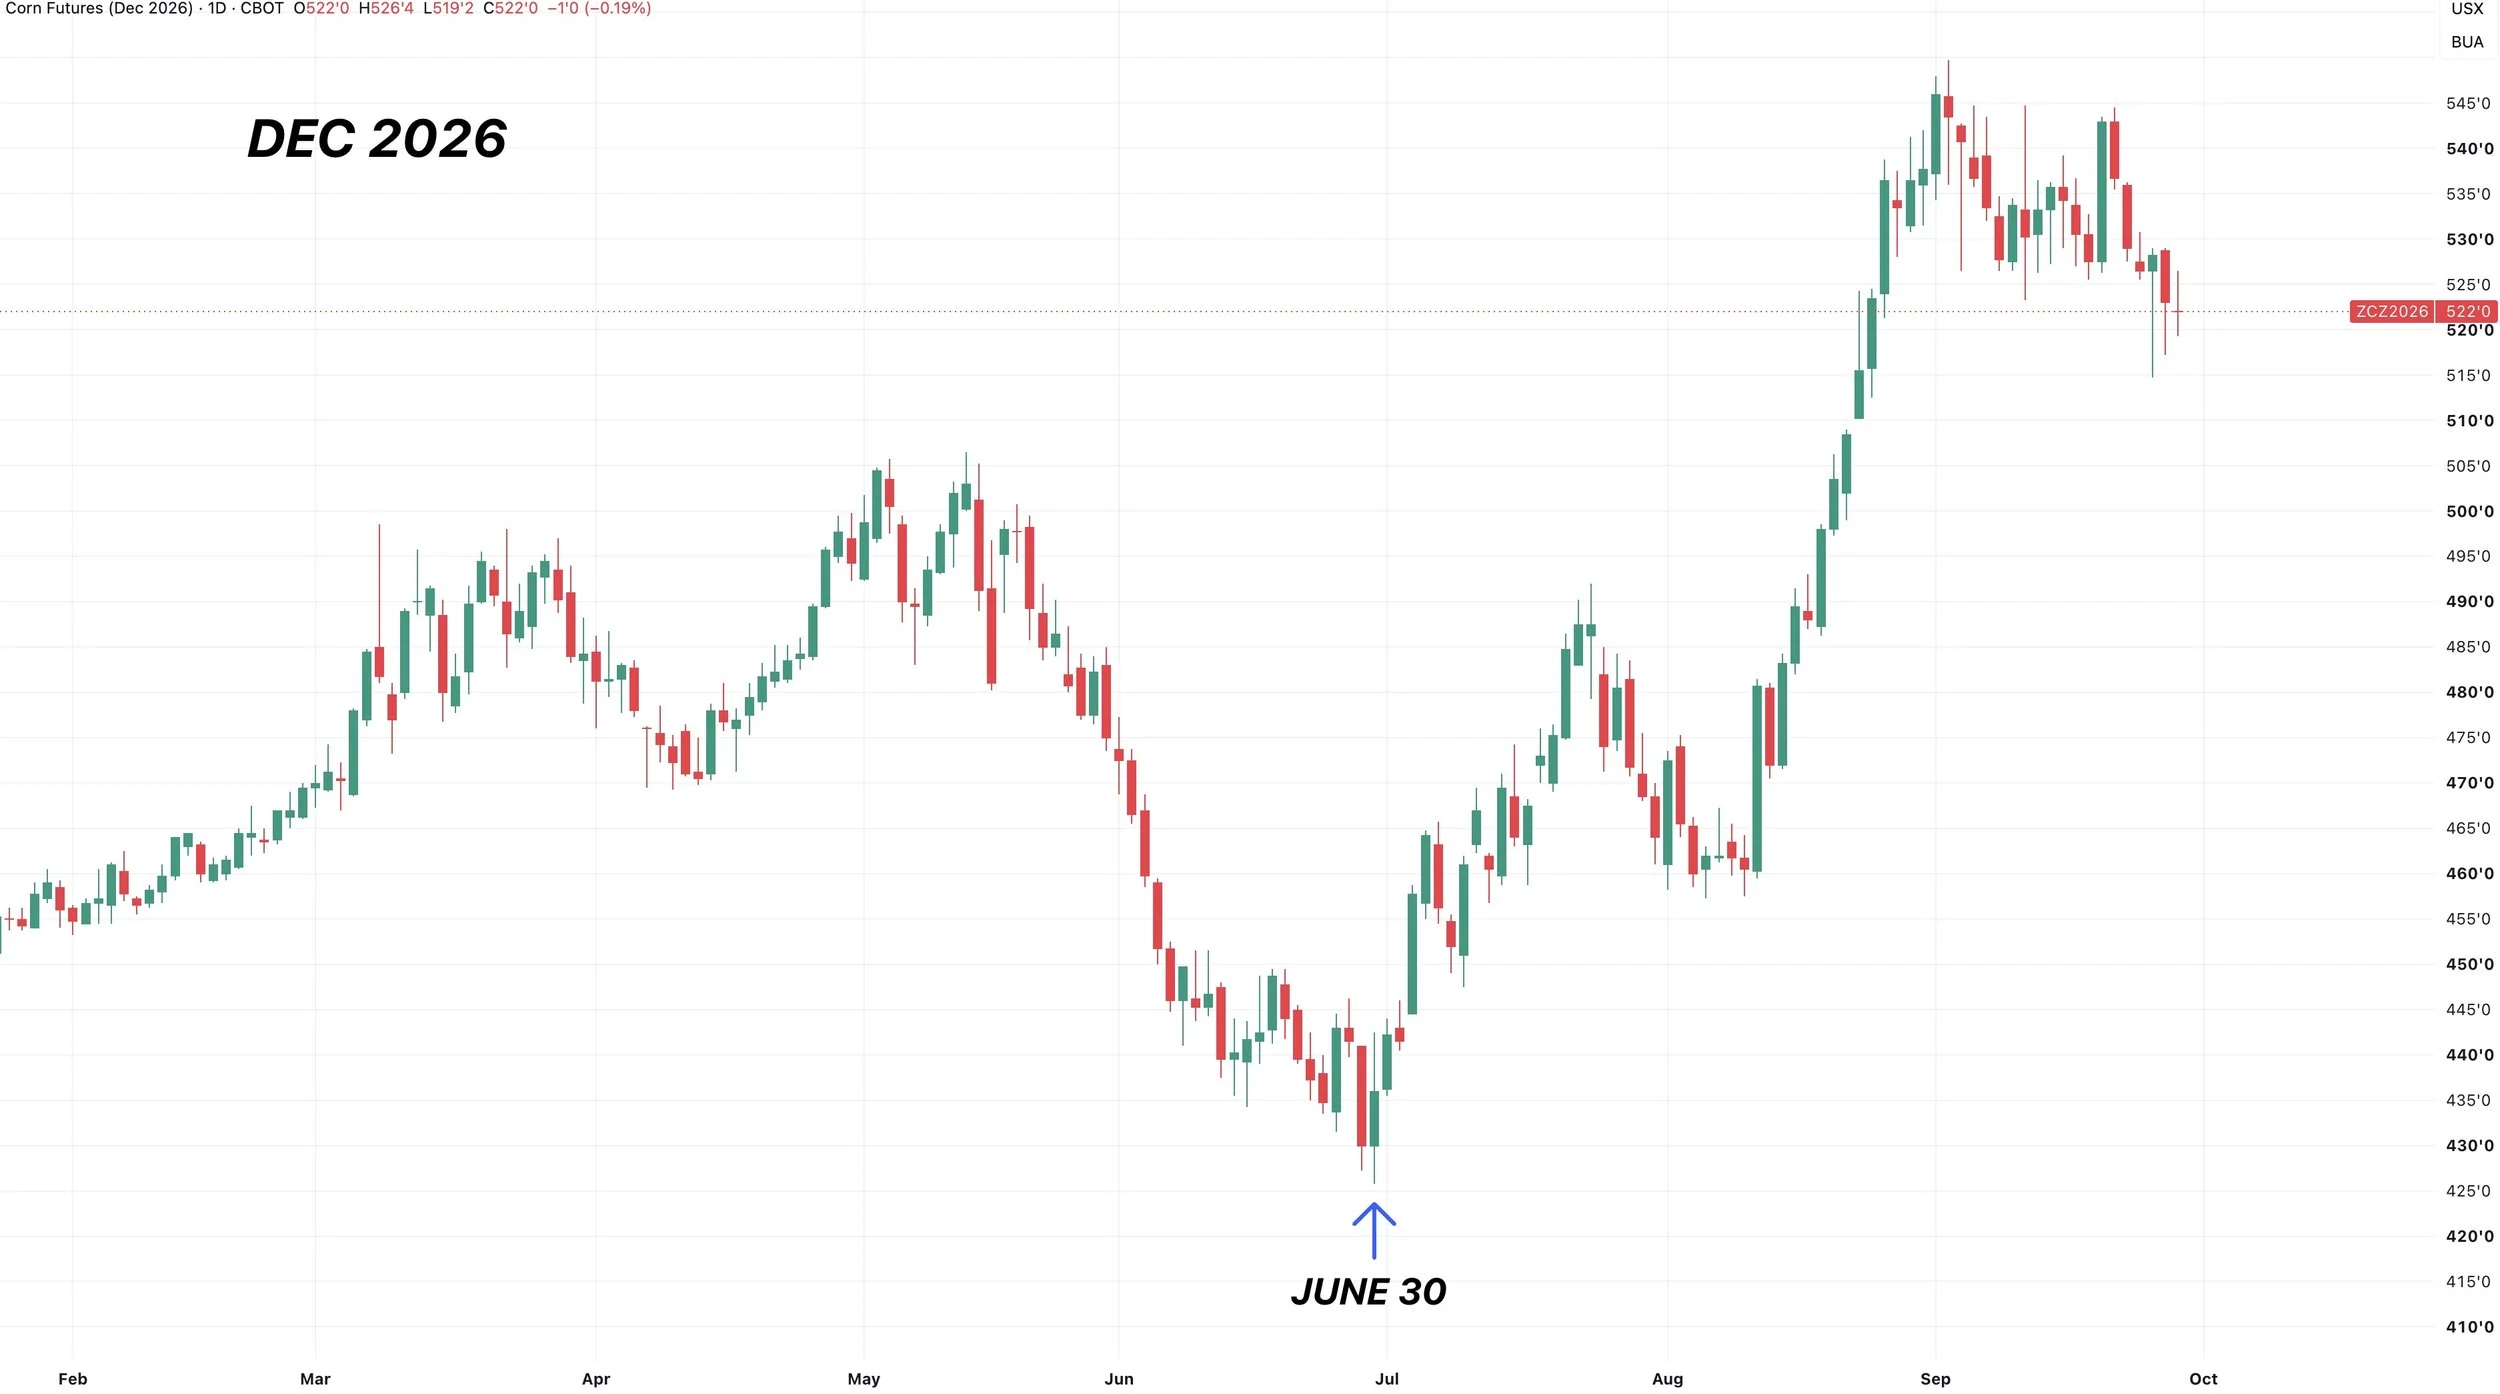
Did you know there is only one other year we have posted our lowest price of the year in June?
The year was 2010.
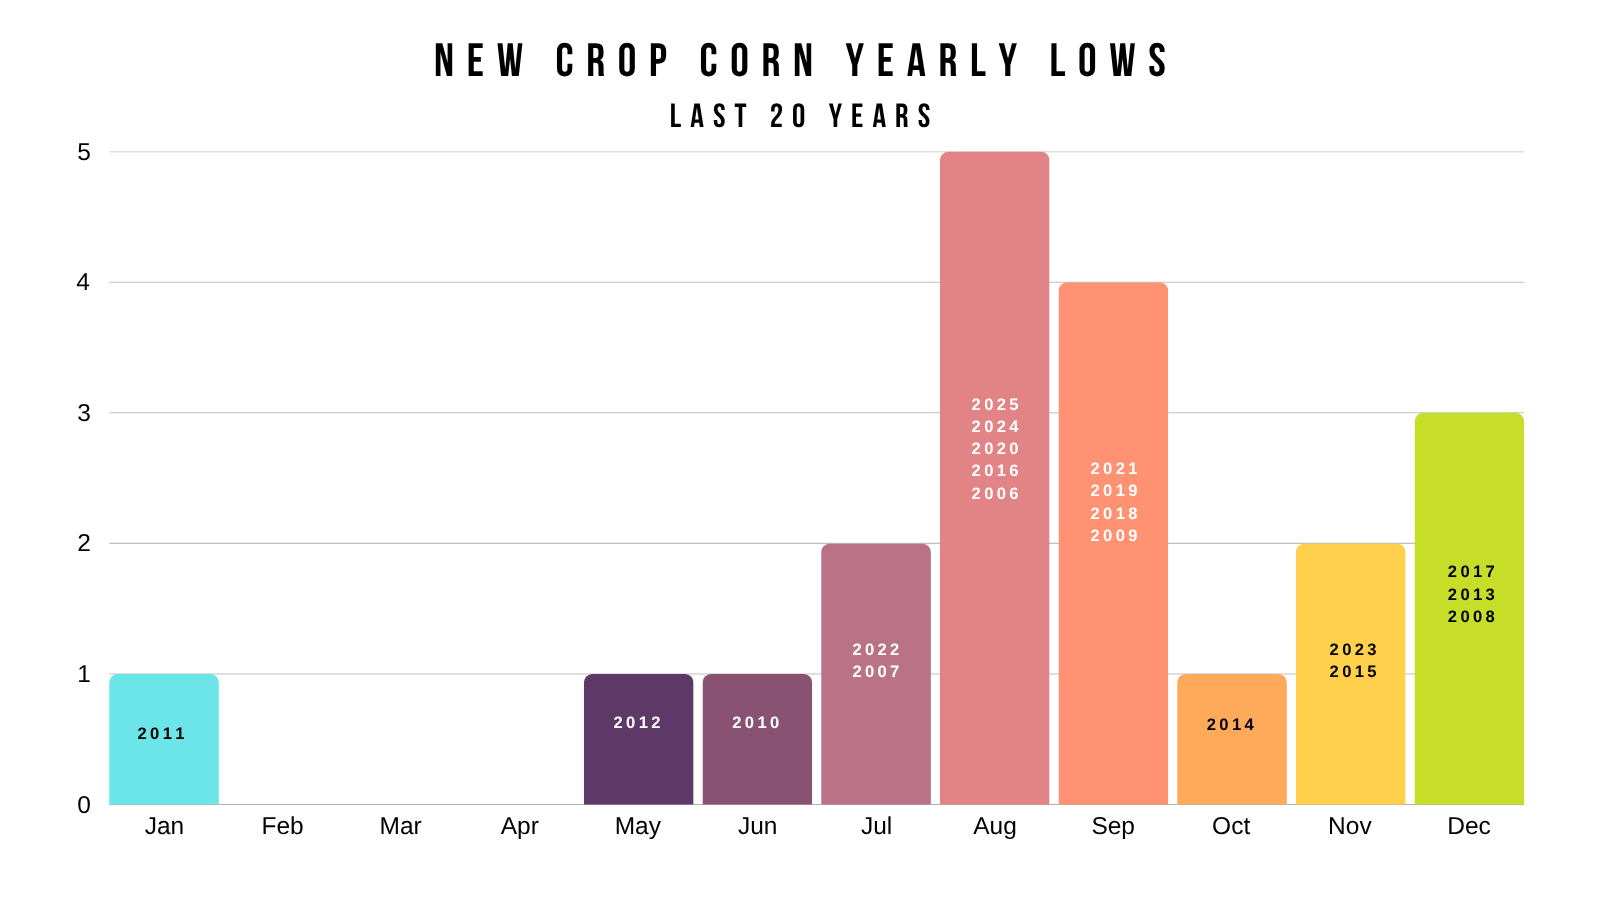
In 2010, we posted our lows on the day of the June 30th stocks report.
When did we post our lows this year?
June 30th.
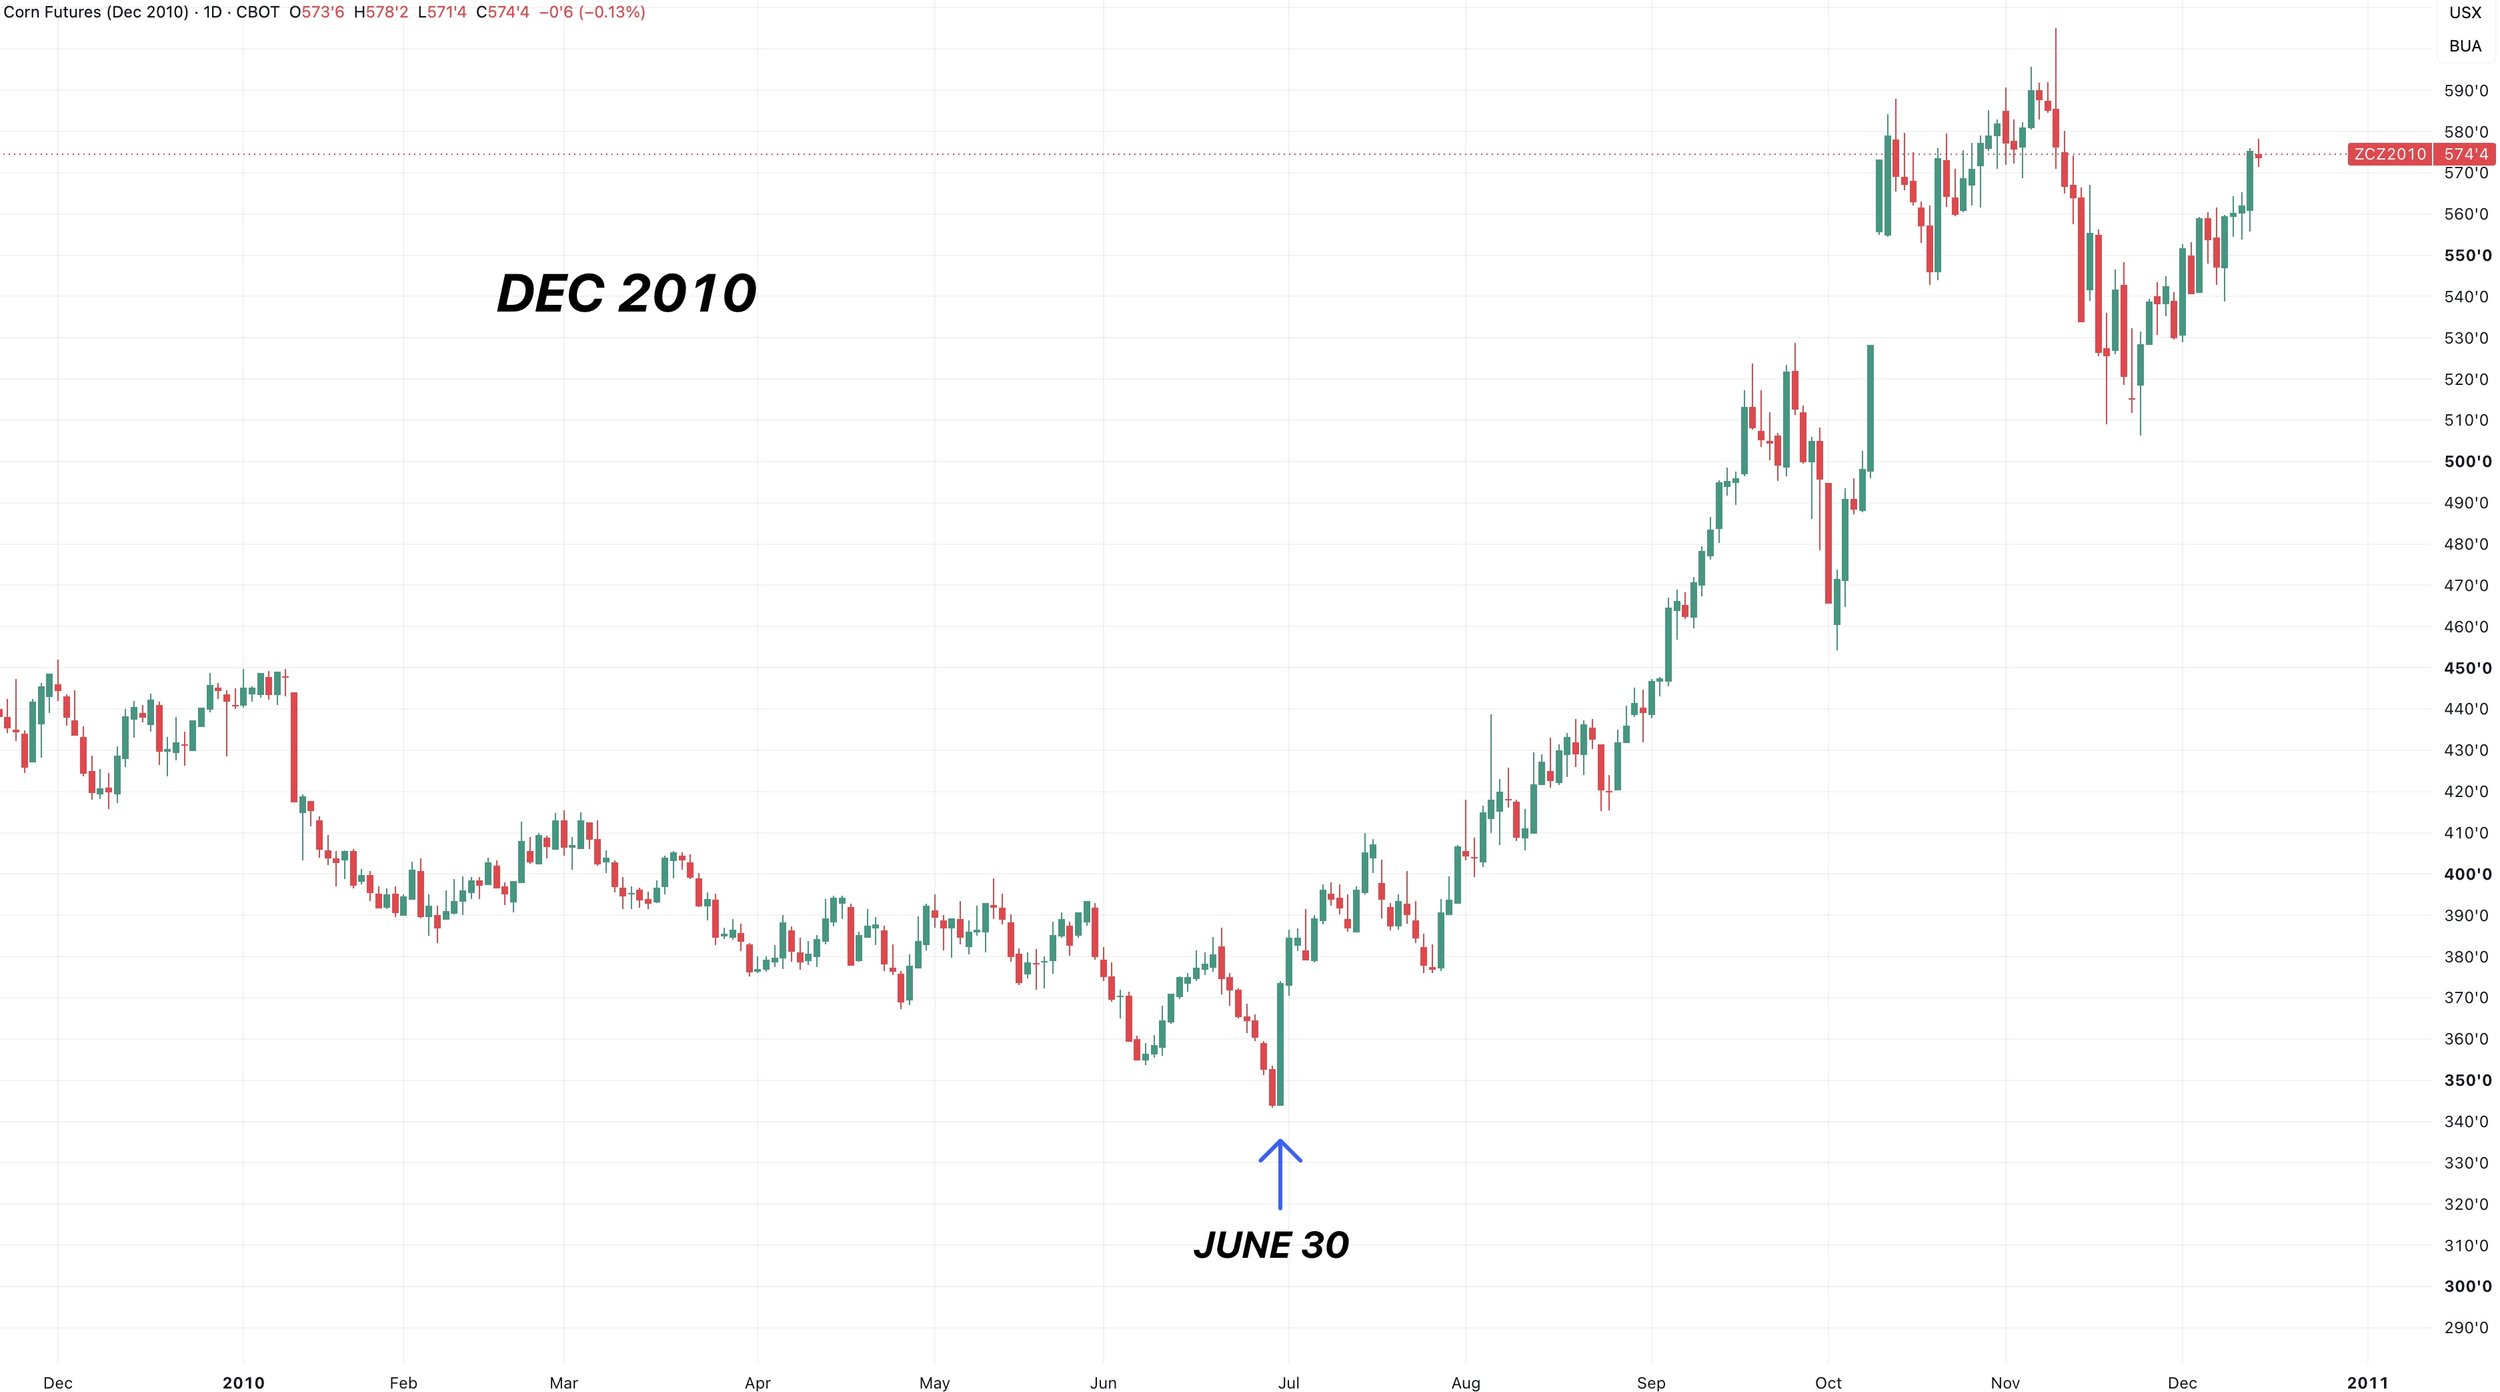
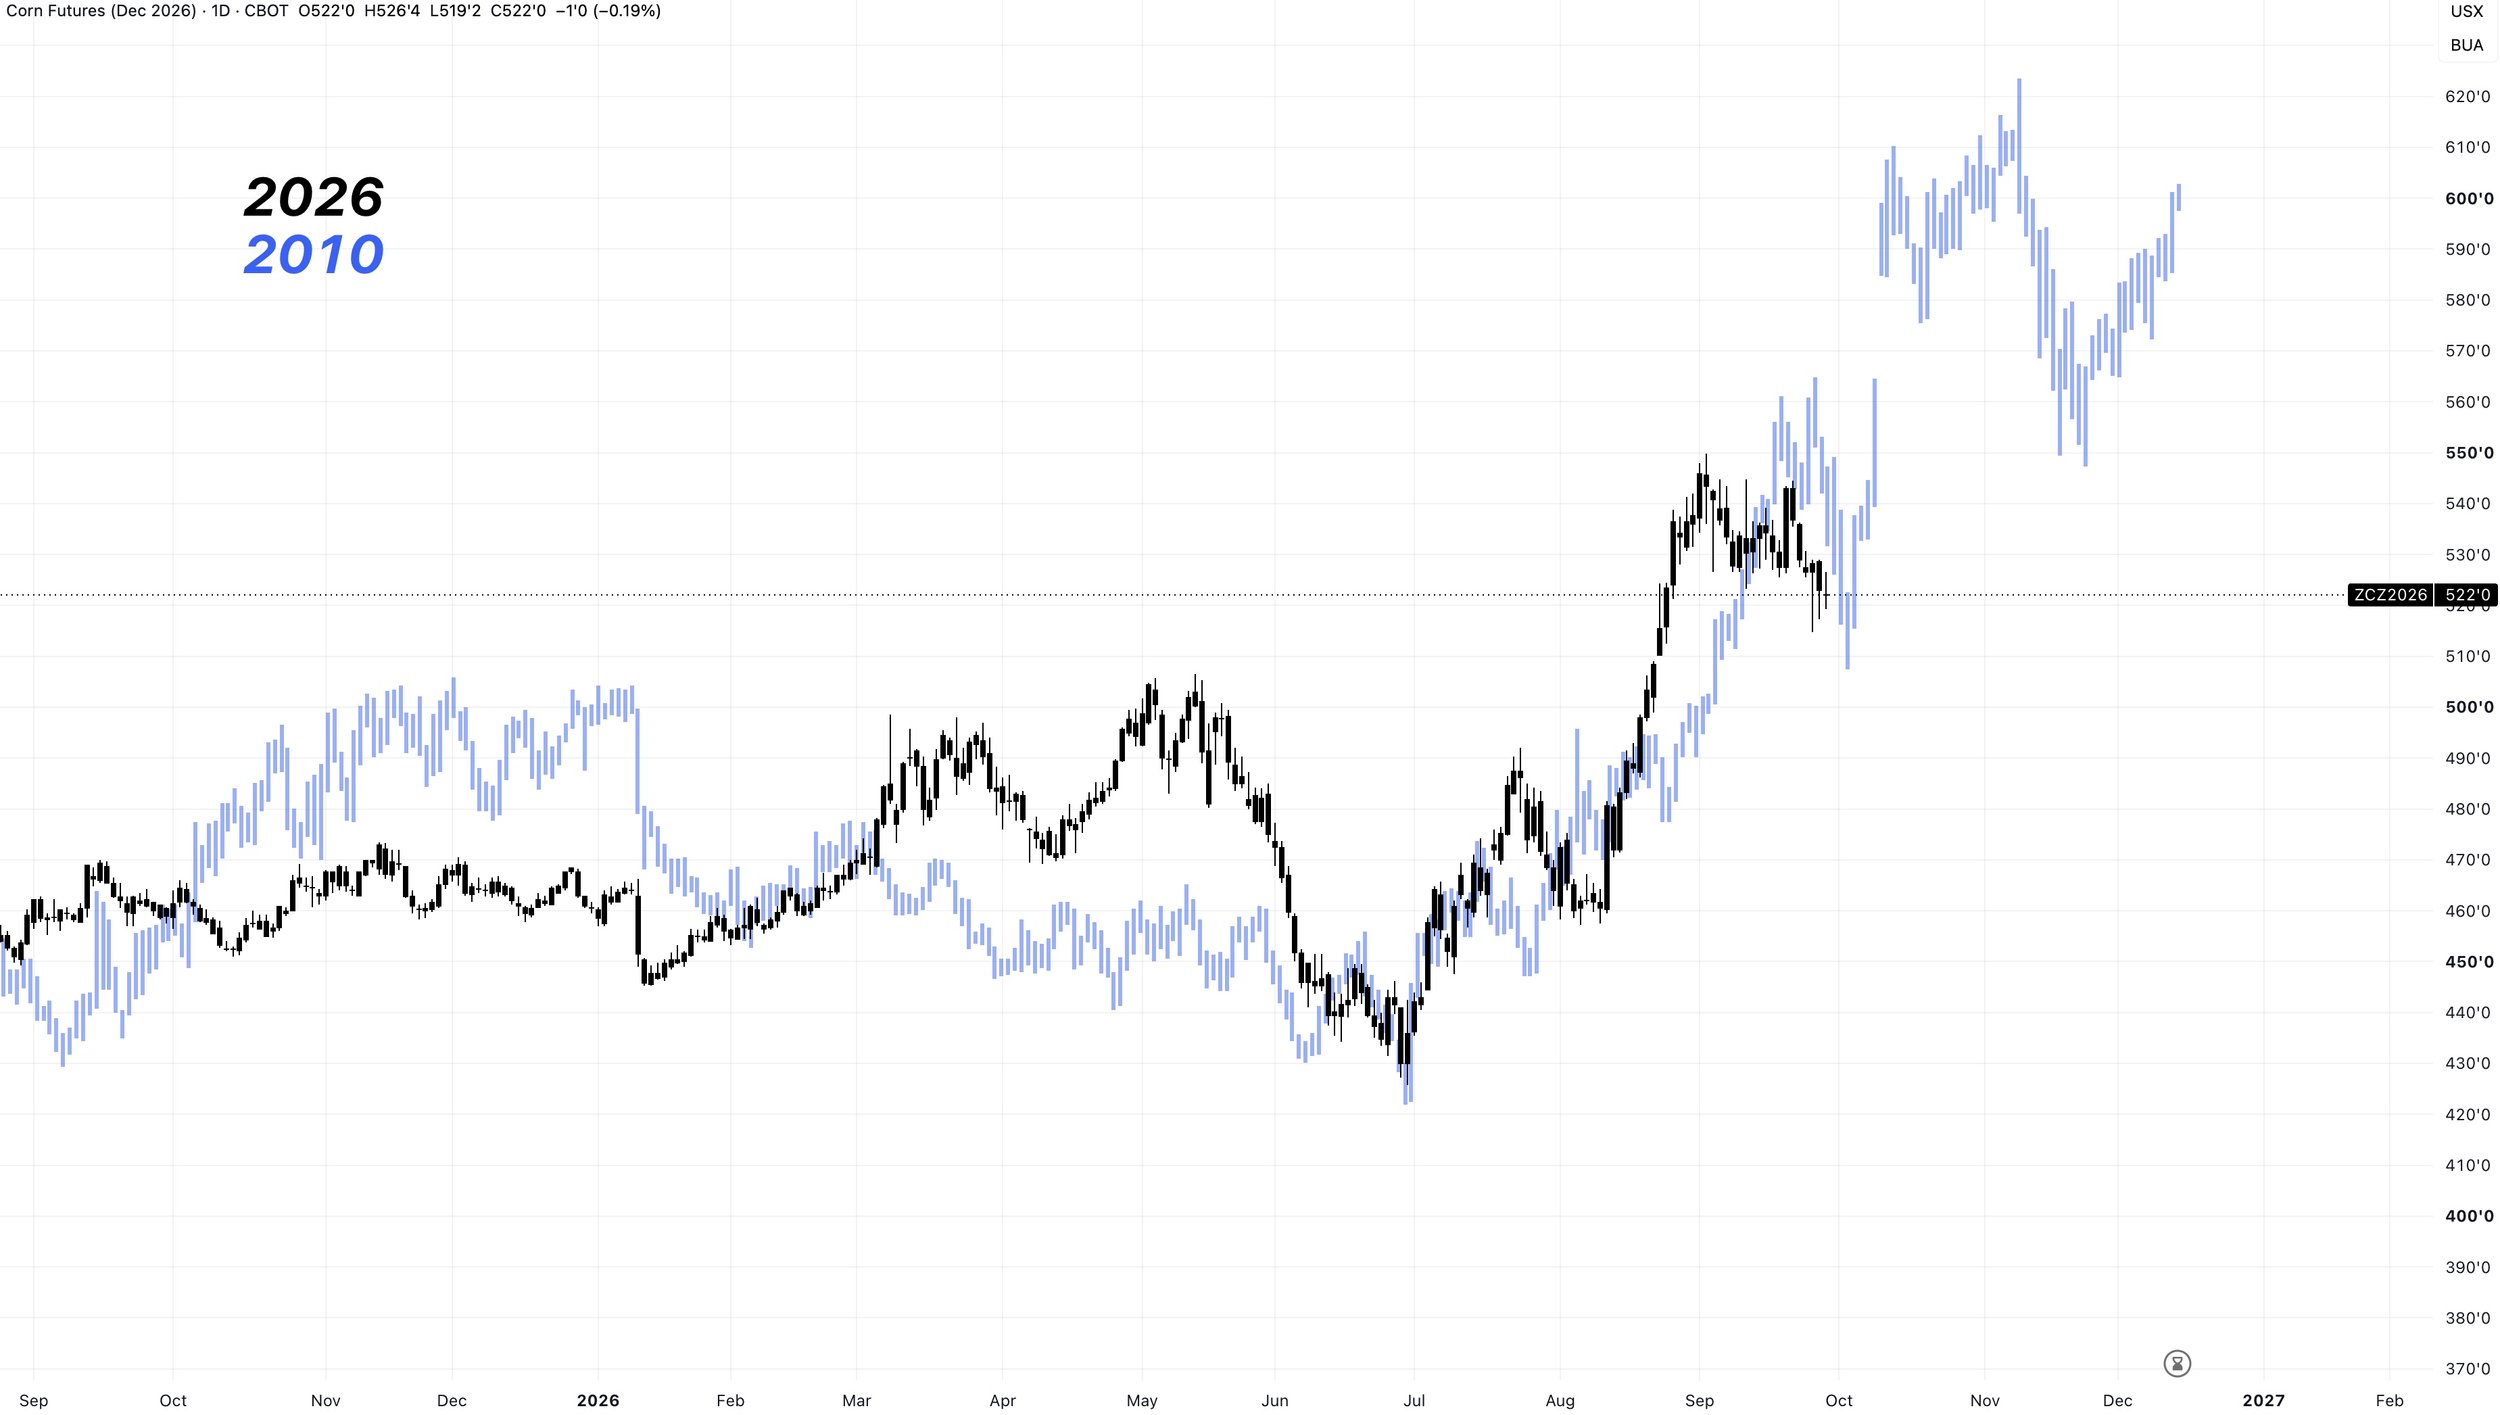
Here is the Dec-10 pattern overlayed on top of Dec-26 corn.
The 2010 chart is not the actual prices from 2010 but rather compares the pattern.
Decently similar price action.
Just thought I'd throw this out there today.
Post August Highs:
I've already covered this countless times this year.
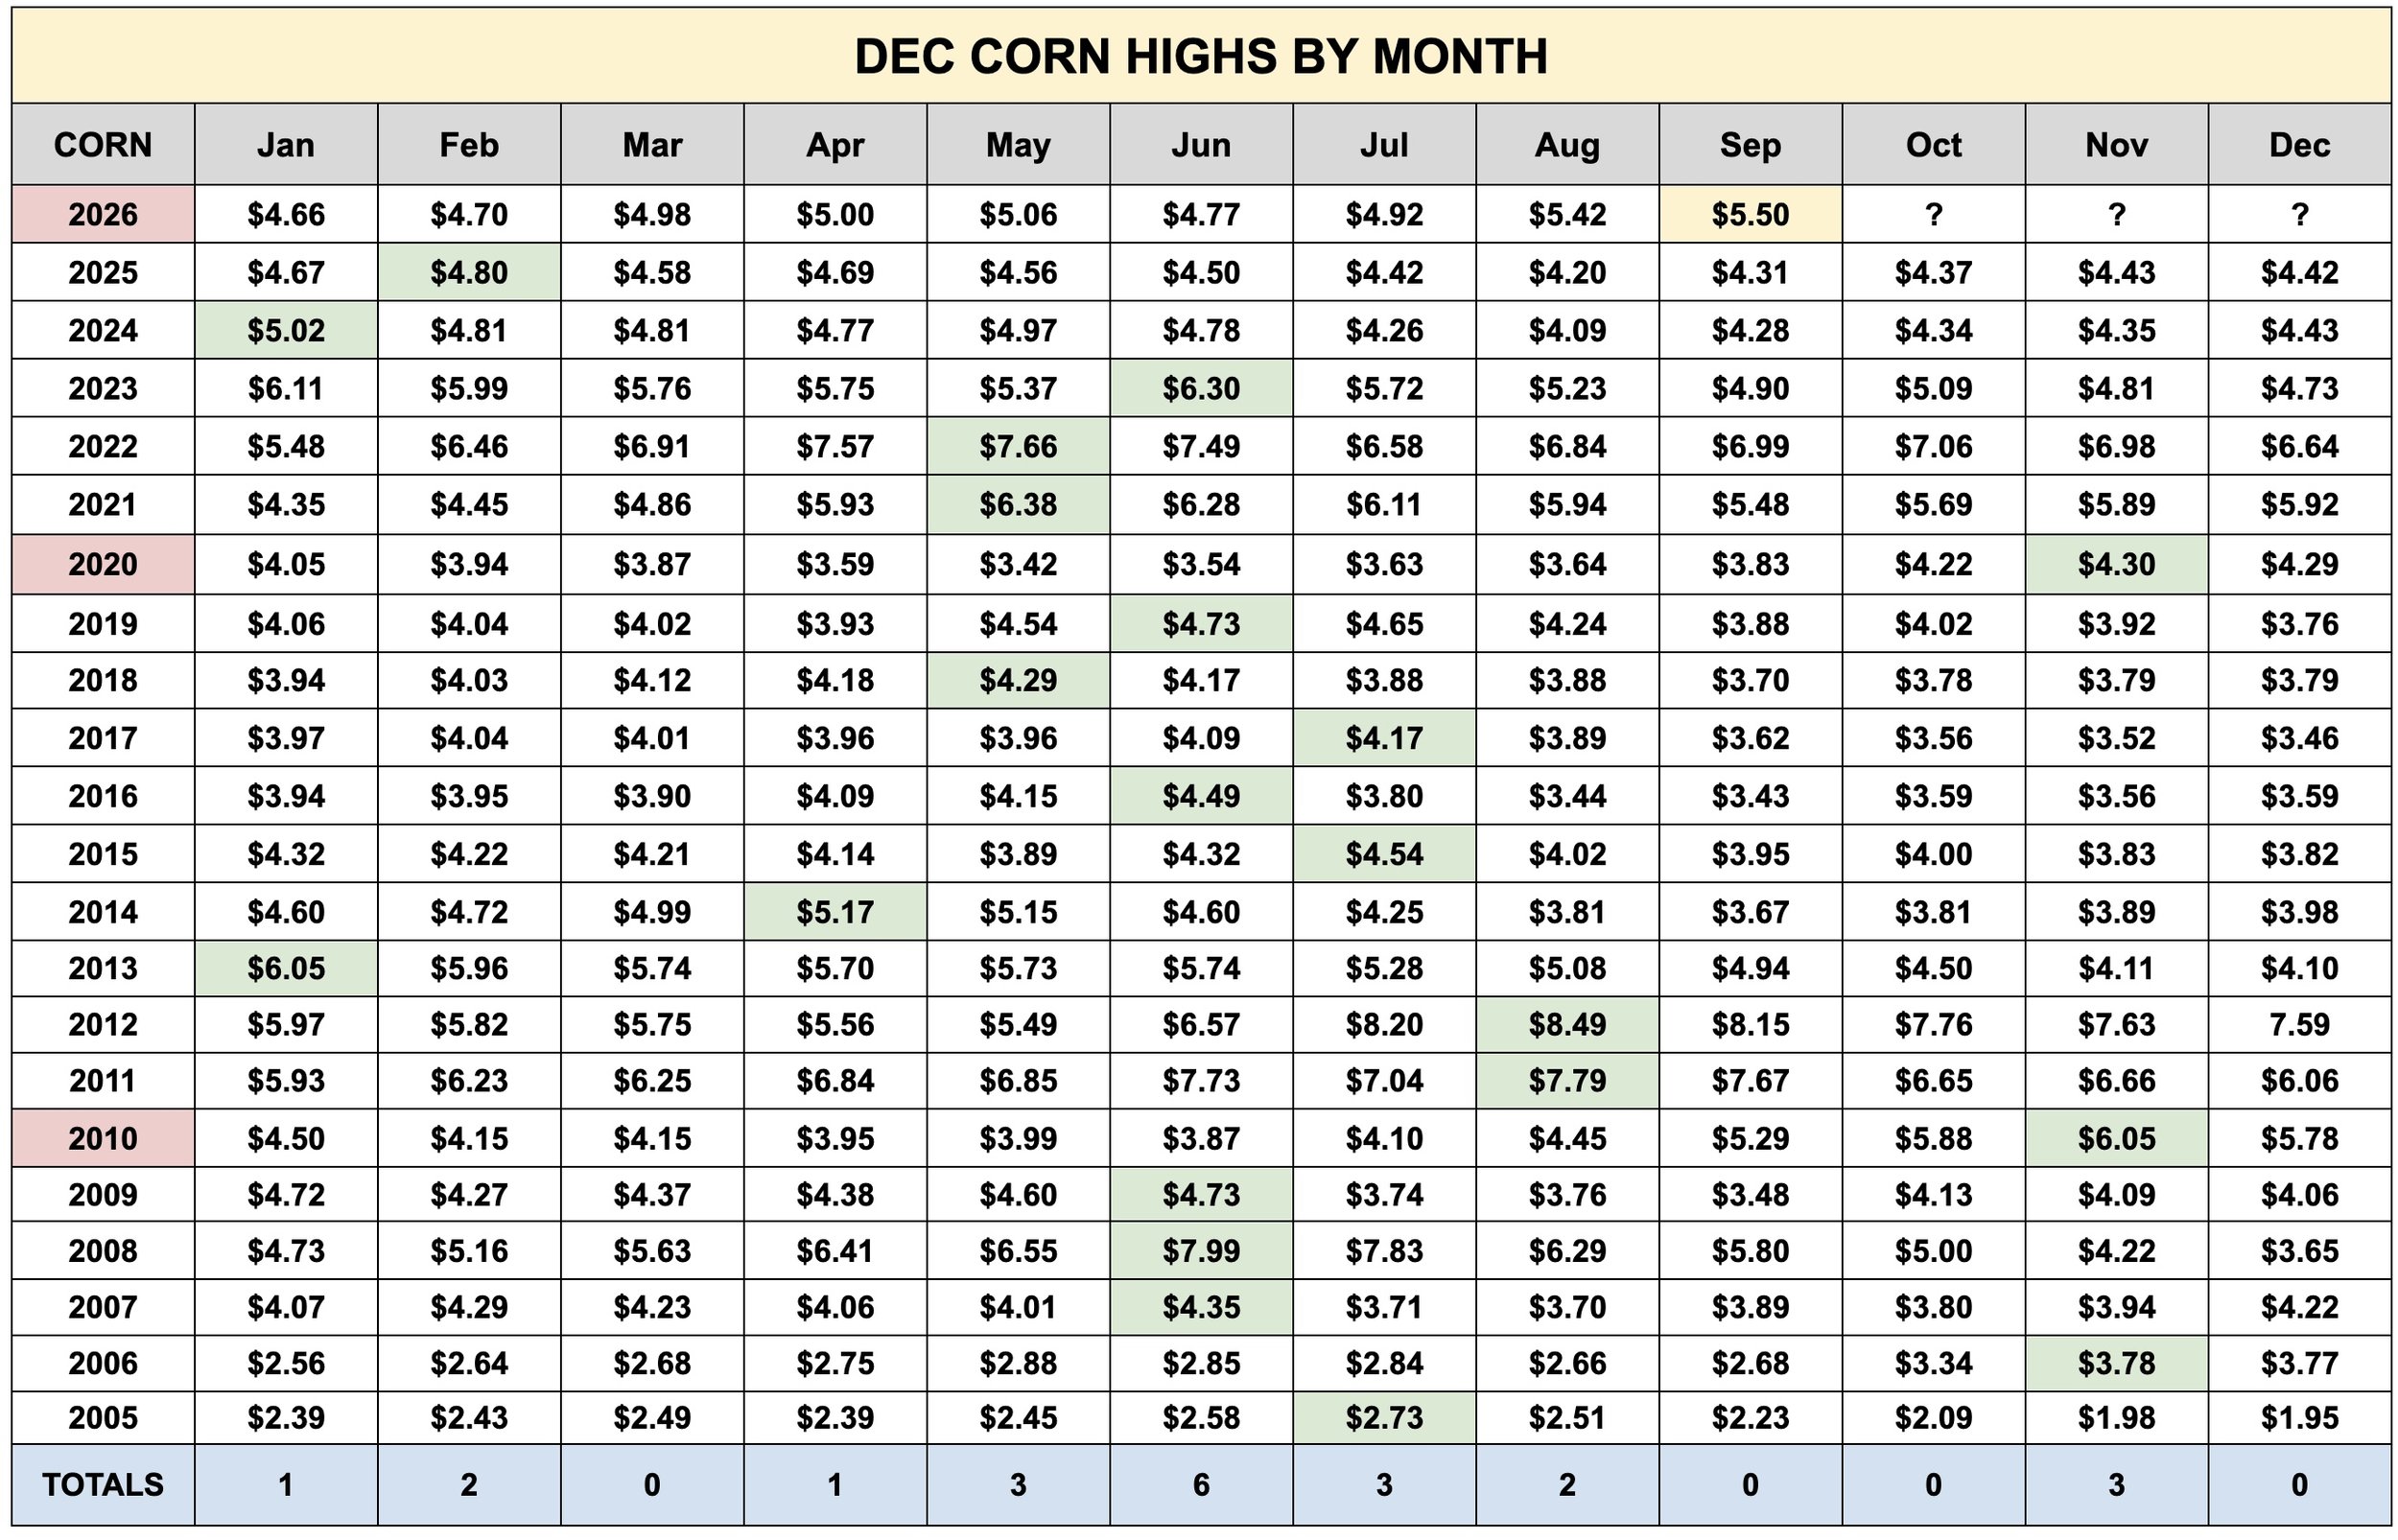
But I did want to again point out that in at least the last 20 years, corn has never posted it's highs for the year in September or October.
Obviously doesn’t mean it "can’t" happen. 2024 and 2025 posted those anomalies early in the year despite never having done it.
However, the last 2 times we posted our highs later than August were 2010 and 2020.
Coincidence? Maybe. Maybe not.
Both years the highs came in November. When that happened, a lot higher prices followed suite the next year.
I'd argue that end of year rallies like that tend to hint at something larger unfolding.
Quick Seasonal Data Update:
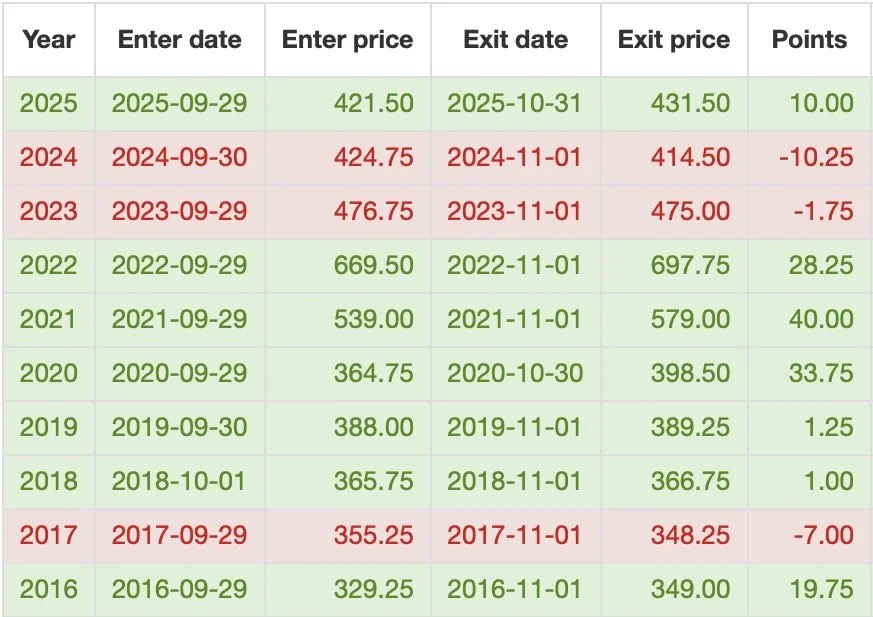
Seasonally this October time frame tends to be friendly.
From today's date by November 1st we have been higher in the last 7 of 10 years.
Although several of the years were only a penny or two of a change. But only one year saw even noticeably lower prices through the month.
Pre-Report Trade Ideas:
Disclaimer: there is risk of loss trading futures and options. Past performance does not necessarily indicate future results. This is our opinion and should be treated as such.
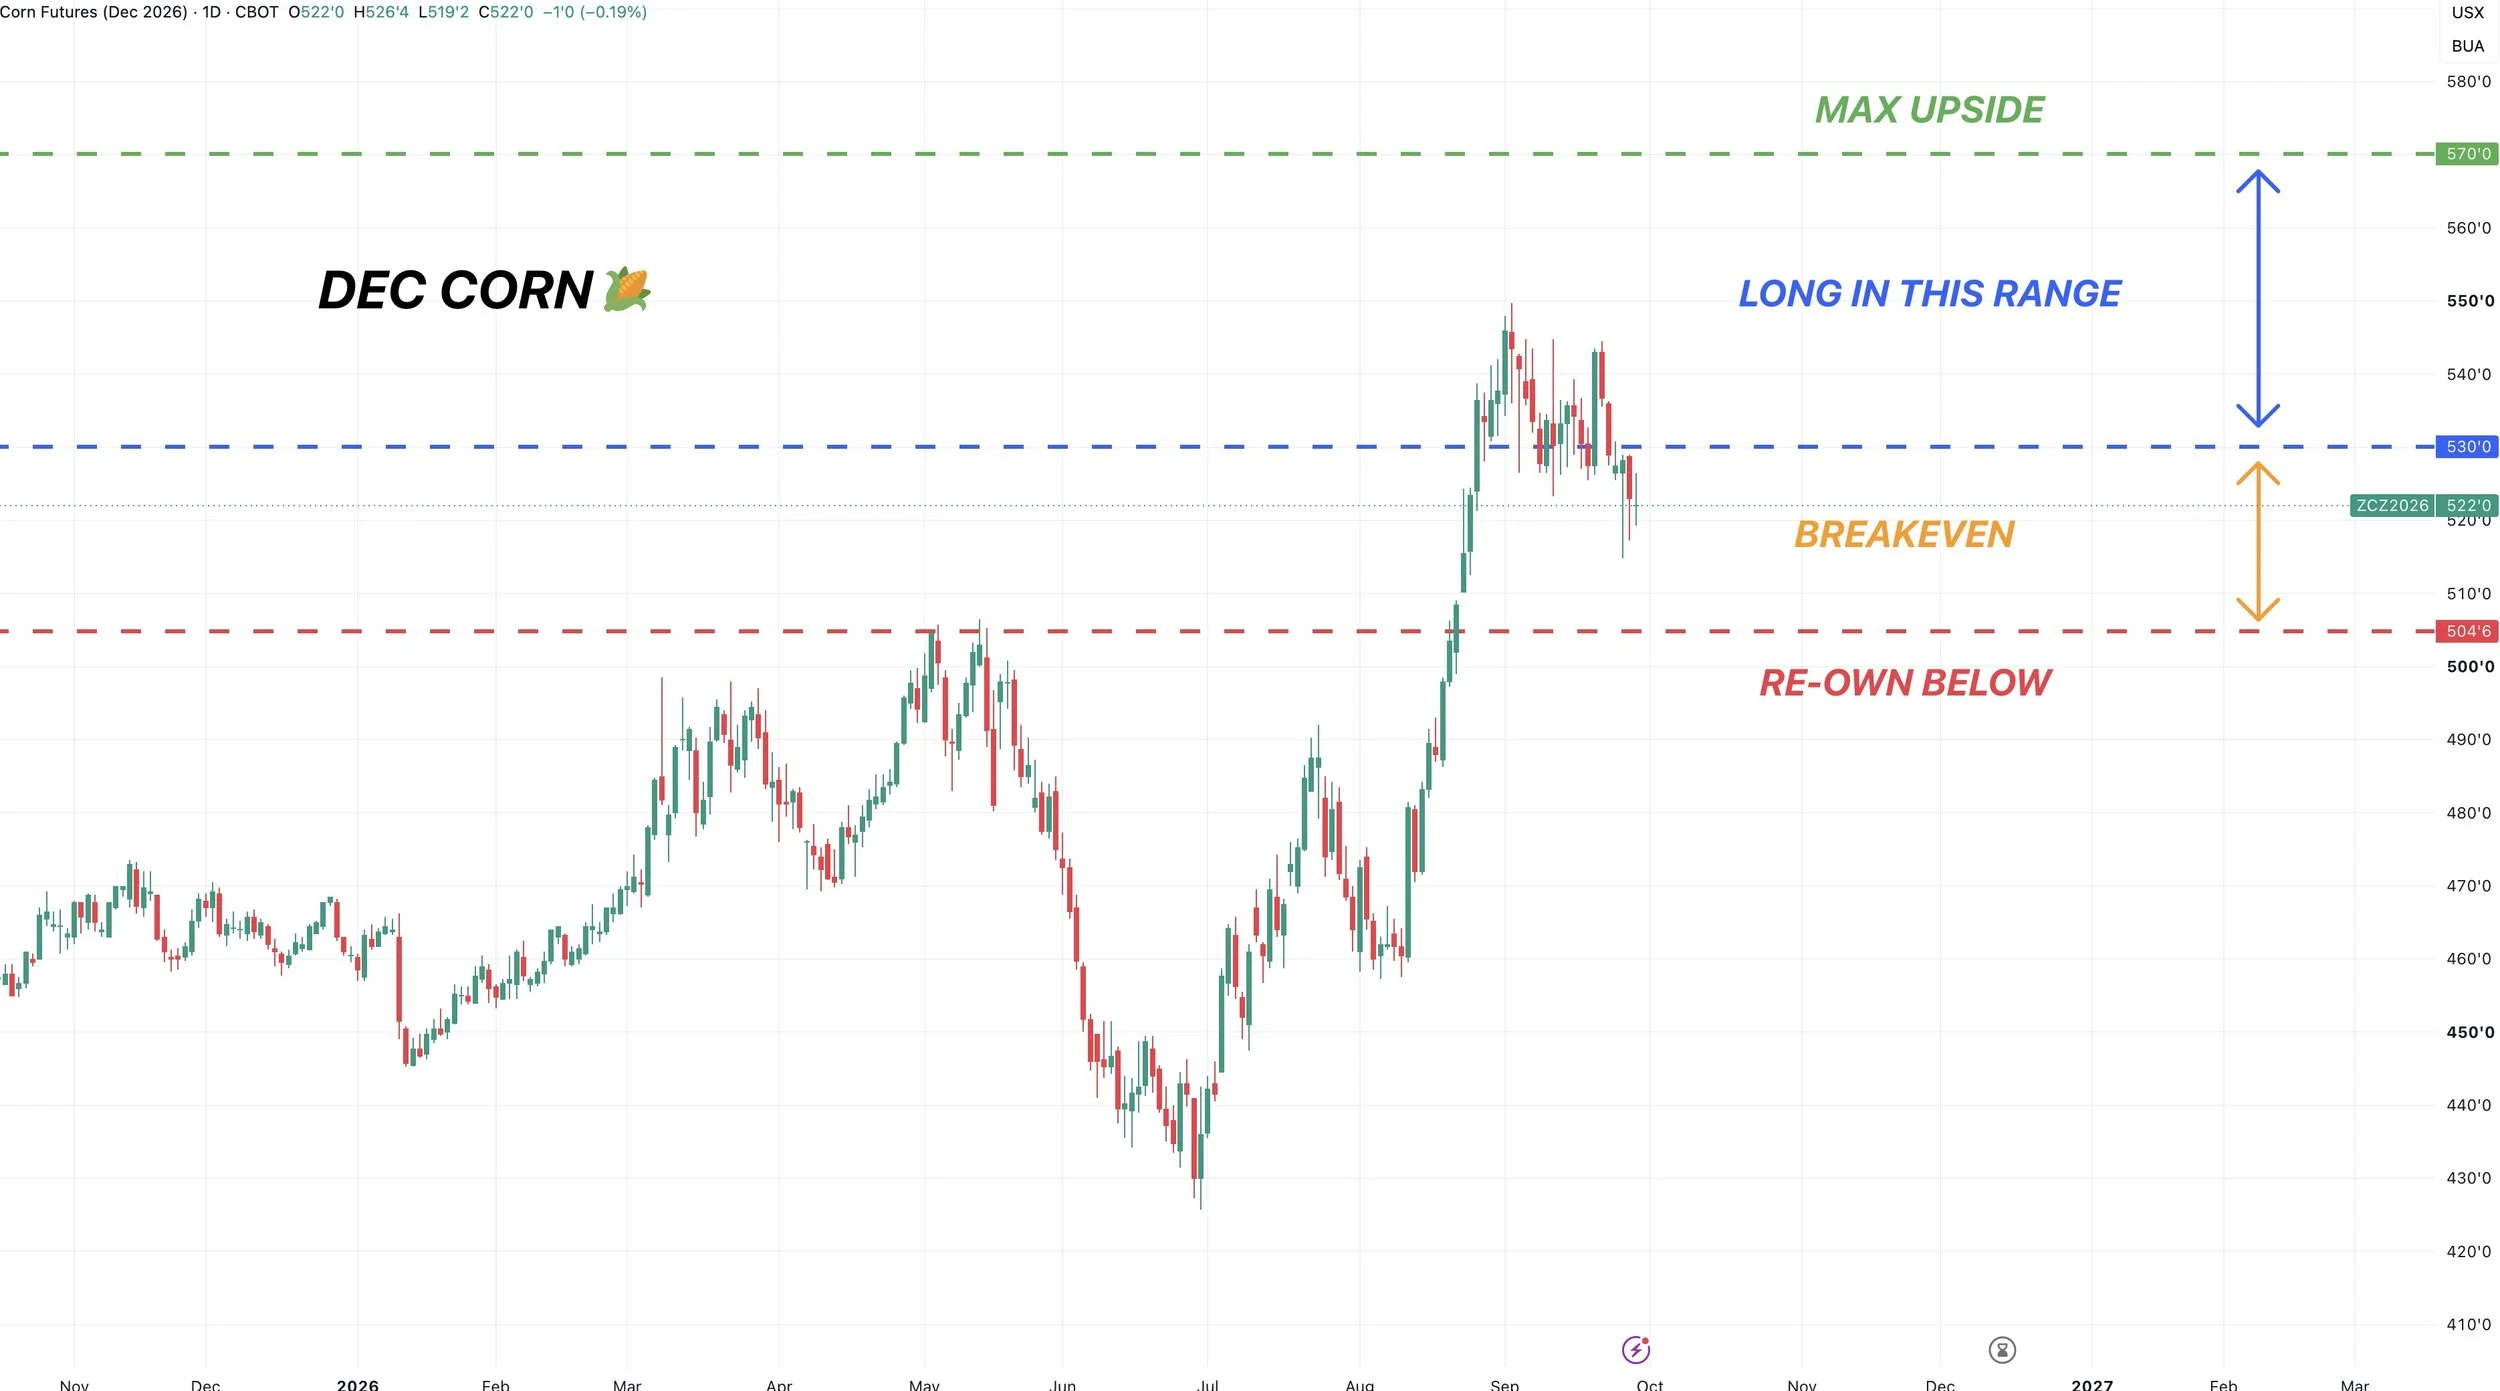
If you are someone who is oversold or made sales higher than where we are and wants some upside exposure, here is one strategy you could consider.
You could sell a put to buy a call spread. The exact quotes will change, but you could do a similar trade to this for about even money. However, selling options does require margin.
For example:
Sell $5.05 put
Buy $5.30 call
Sell $5.70 call
So your max upside would be $5.70 where you sold the call. So that would be about 40 cents of upside.
If we drop below $5.05 and the sold put, you would re-own.
We will get into the charts, but I believe this would be a great spot to consider re-owning if it came.
Anything between $5.30 and $5.70 and the options make money.
Anything between $5.05 to $5.30 is a breakeven.
You could also look at simply selling puts to collect some premium. As selling a put down at support lets you collect a premium in exchange for a chance to re-own at support.
If you are someone who is undersold and would like some downside protection.
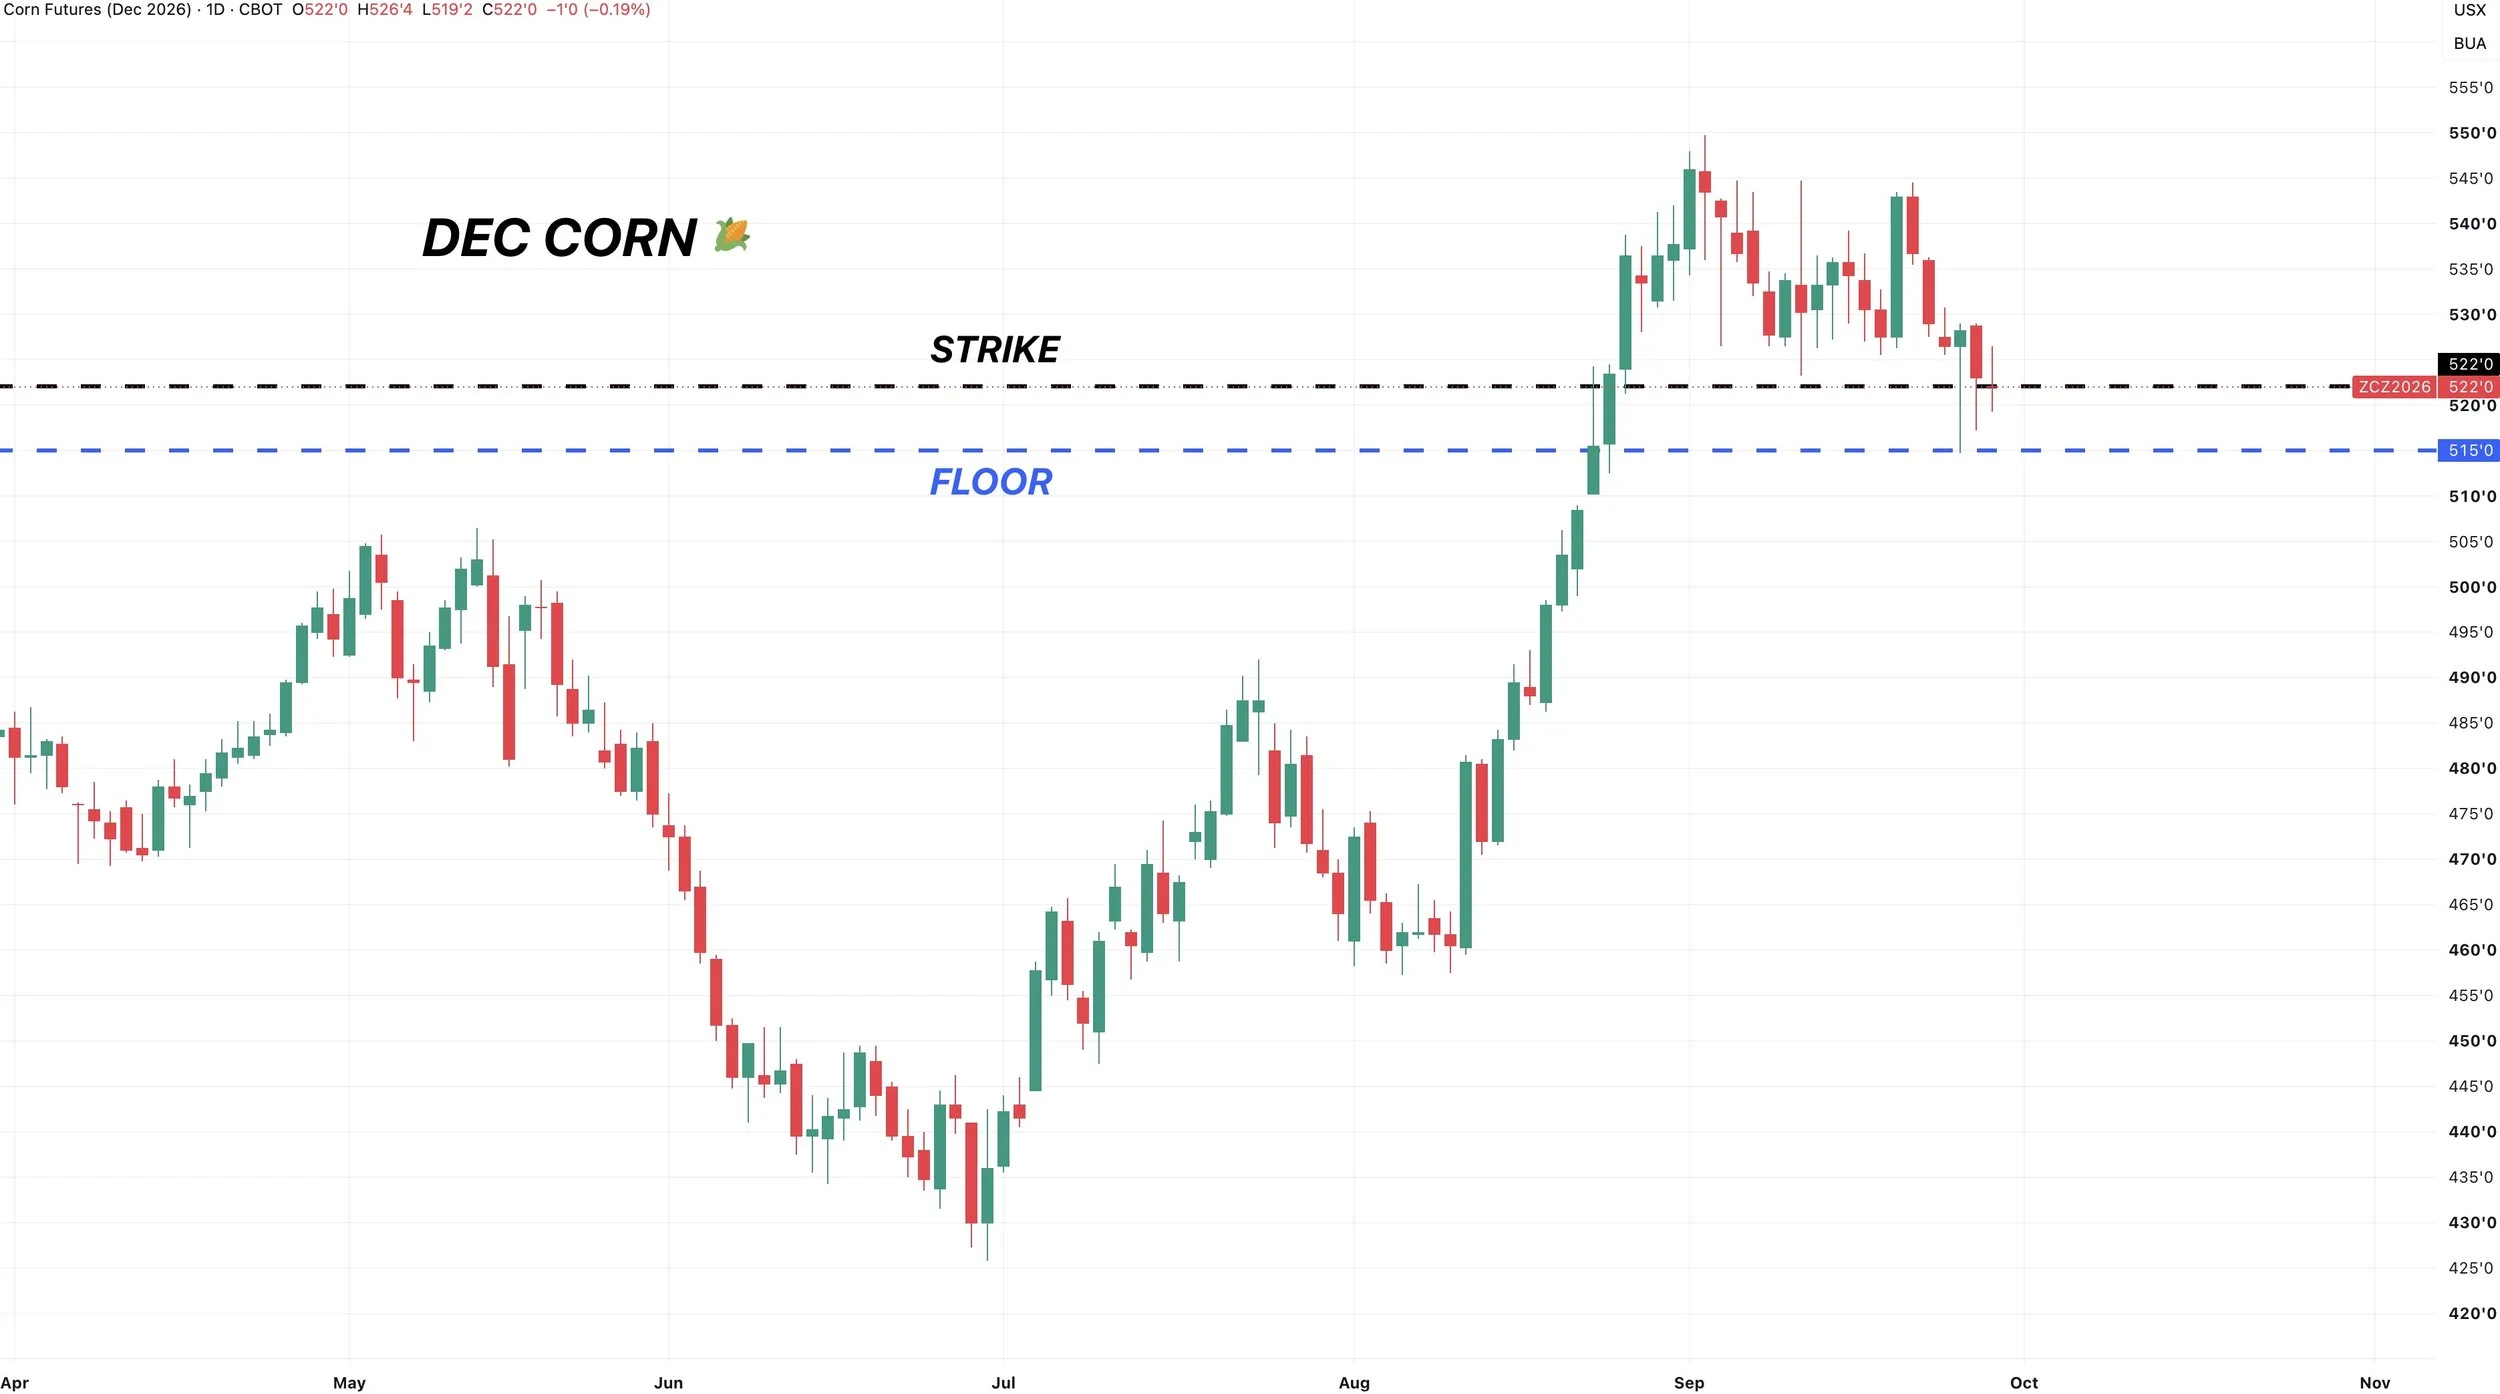
You could simply consider spending a little bit of money on a put to lock in a floor.
It really depends how long you want protection and how you plan to follow it up.
You could get yourself a floor anywhere from $5.00 to $5.20 for anywhere from a week to a month or even longer depending on how long you need it.
There are benefits to short term ones and long term ones.
One example would be a short dated new crop put that is at the money and expires in 3 weeks. So it would cover you for the next two USDA reports.
This would give you a floor of around $5.15
But it really depends on your needs. So if you are uncomfortable and feel like you should have a floor, give us a call and we can figure out what makes the most sense for you.
Office: (806)484-1214
Corn Charts
Dec Corn Daily Chart:
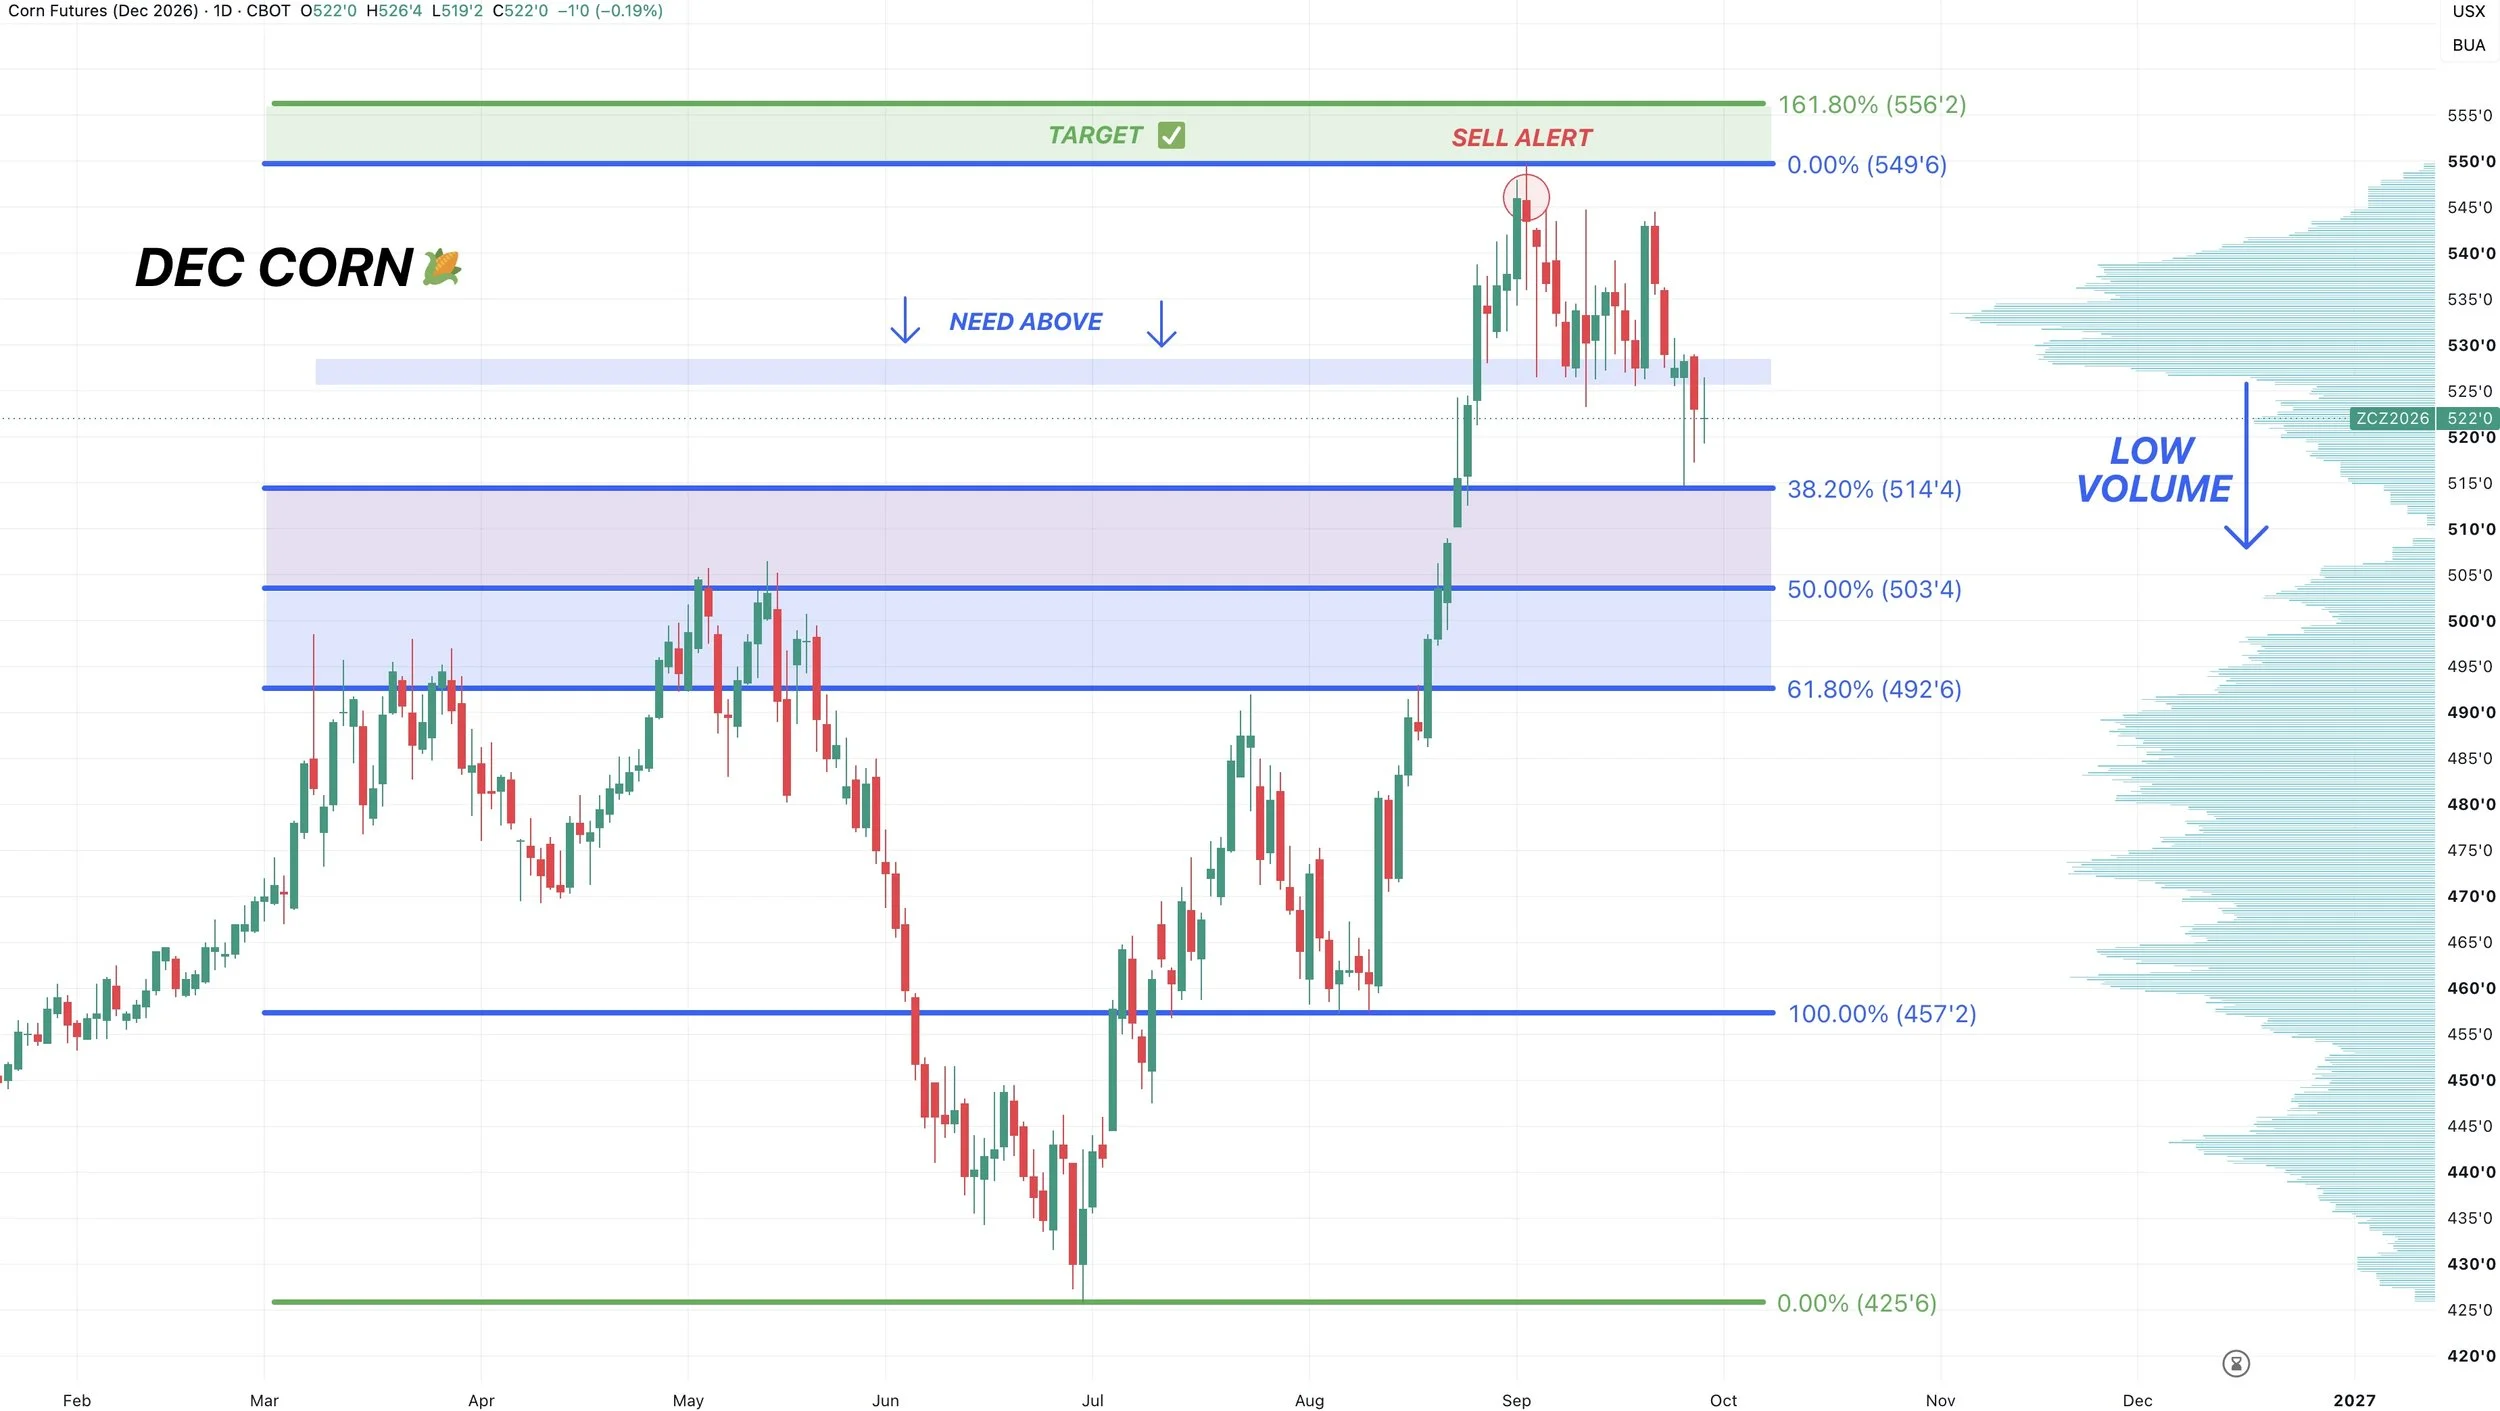
Corn broke some key support, but the dip has been bought the last few days.
When we broke that support, we came down and hit the 38.2% retracement down to the August lows.
My downside target for the correction to end has been between 38.2% to 50%. So it was technically deep enough for the correction to be over.
However, to be confident that we have printed our lows, we need to break back above that prior support around that $5.30 area. As right now, there is no definitive indication that the low is in yet.
If you notice, below that level the volume is very light so there isn’t much support below it. So we need to break back above it, or the risk would still be lower.
If we are unable to do that, there is always a possibility we could drop a little further. Perhaps down towards $5.04 and the 50% retracement. Which would align with re-testing the May highs.
I do not see us getting much below that level. So if that level comes, I would view it as an area to re-own.
The 38.2% to 50% levels from $5.04 to $5.14 would be considered the "buy zone".
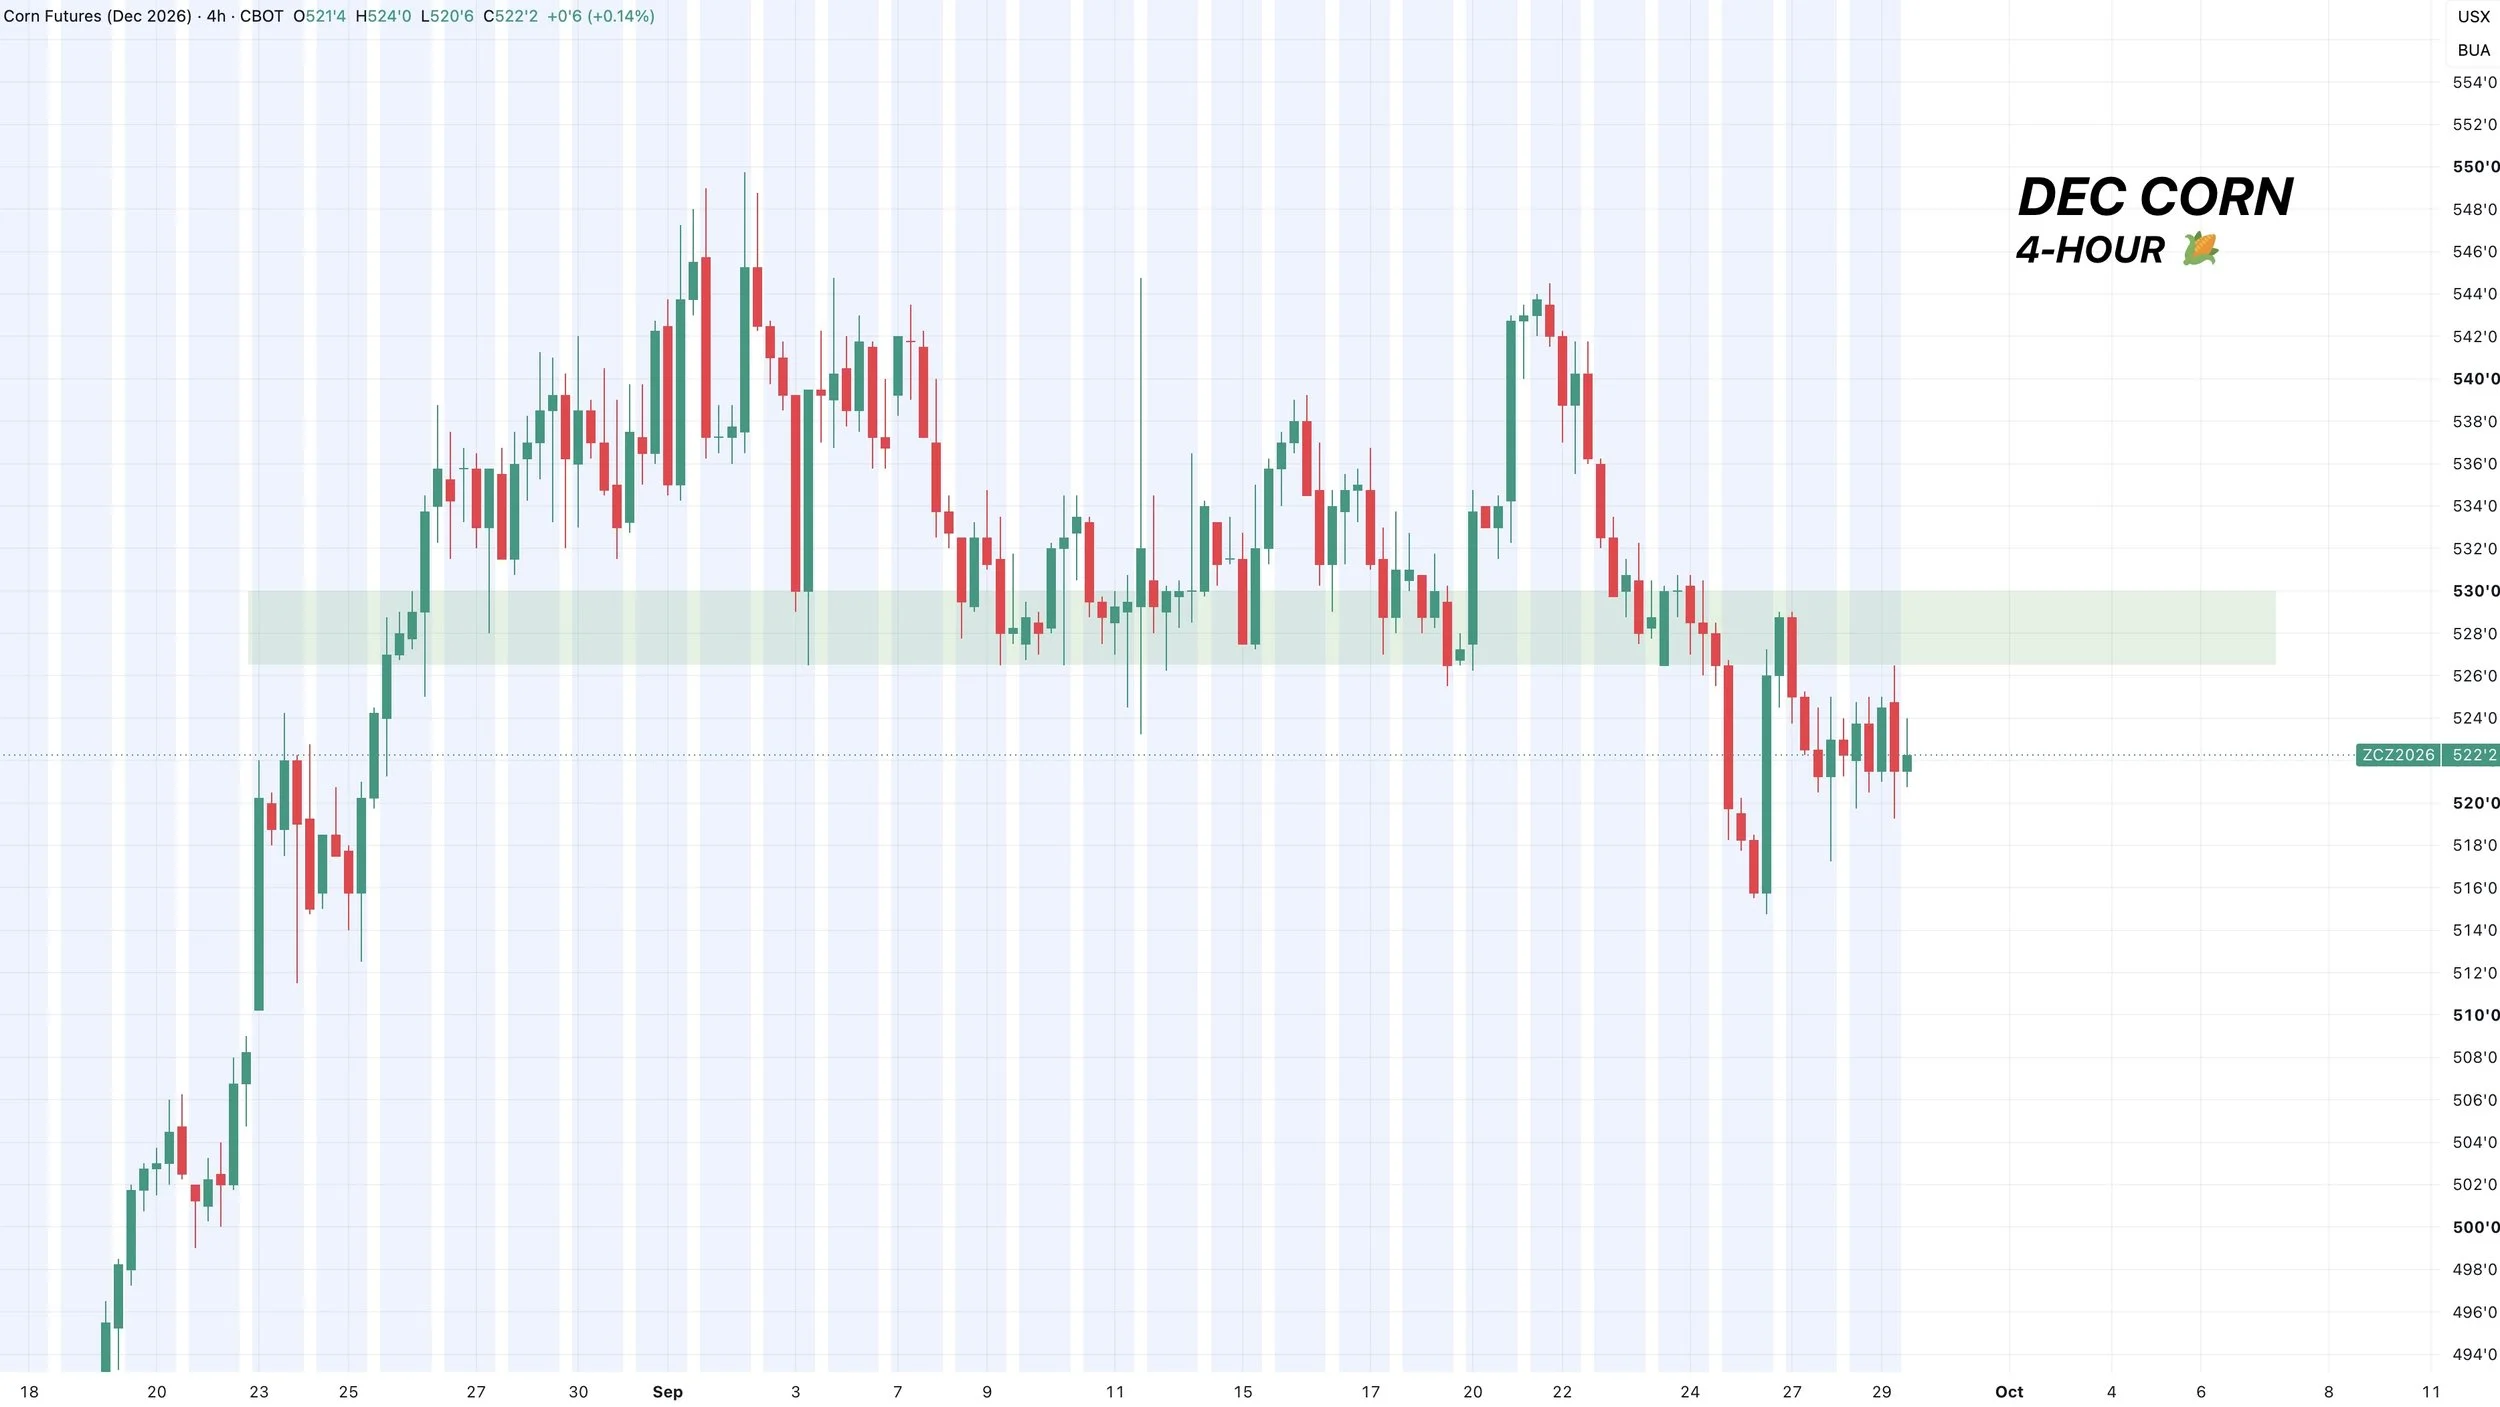
Here is a 4 hour chart to give you a more clear example of that prior support and the level we need to break above.
We had clear support in that $5.26 to $5.30 range.
We then broke that support.
If we can break back above, that would be a good sign and possible indication we've printed the lows.
But so far, all we have done is simply came back and re-tested that prior support as new resistance. Rejecting so far.
Weekly Chart:
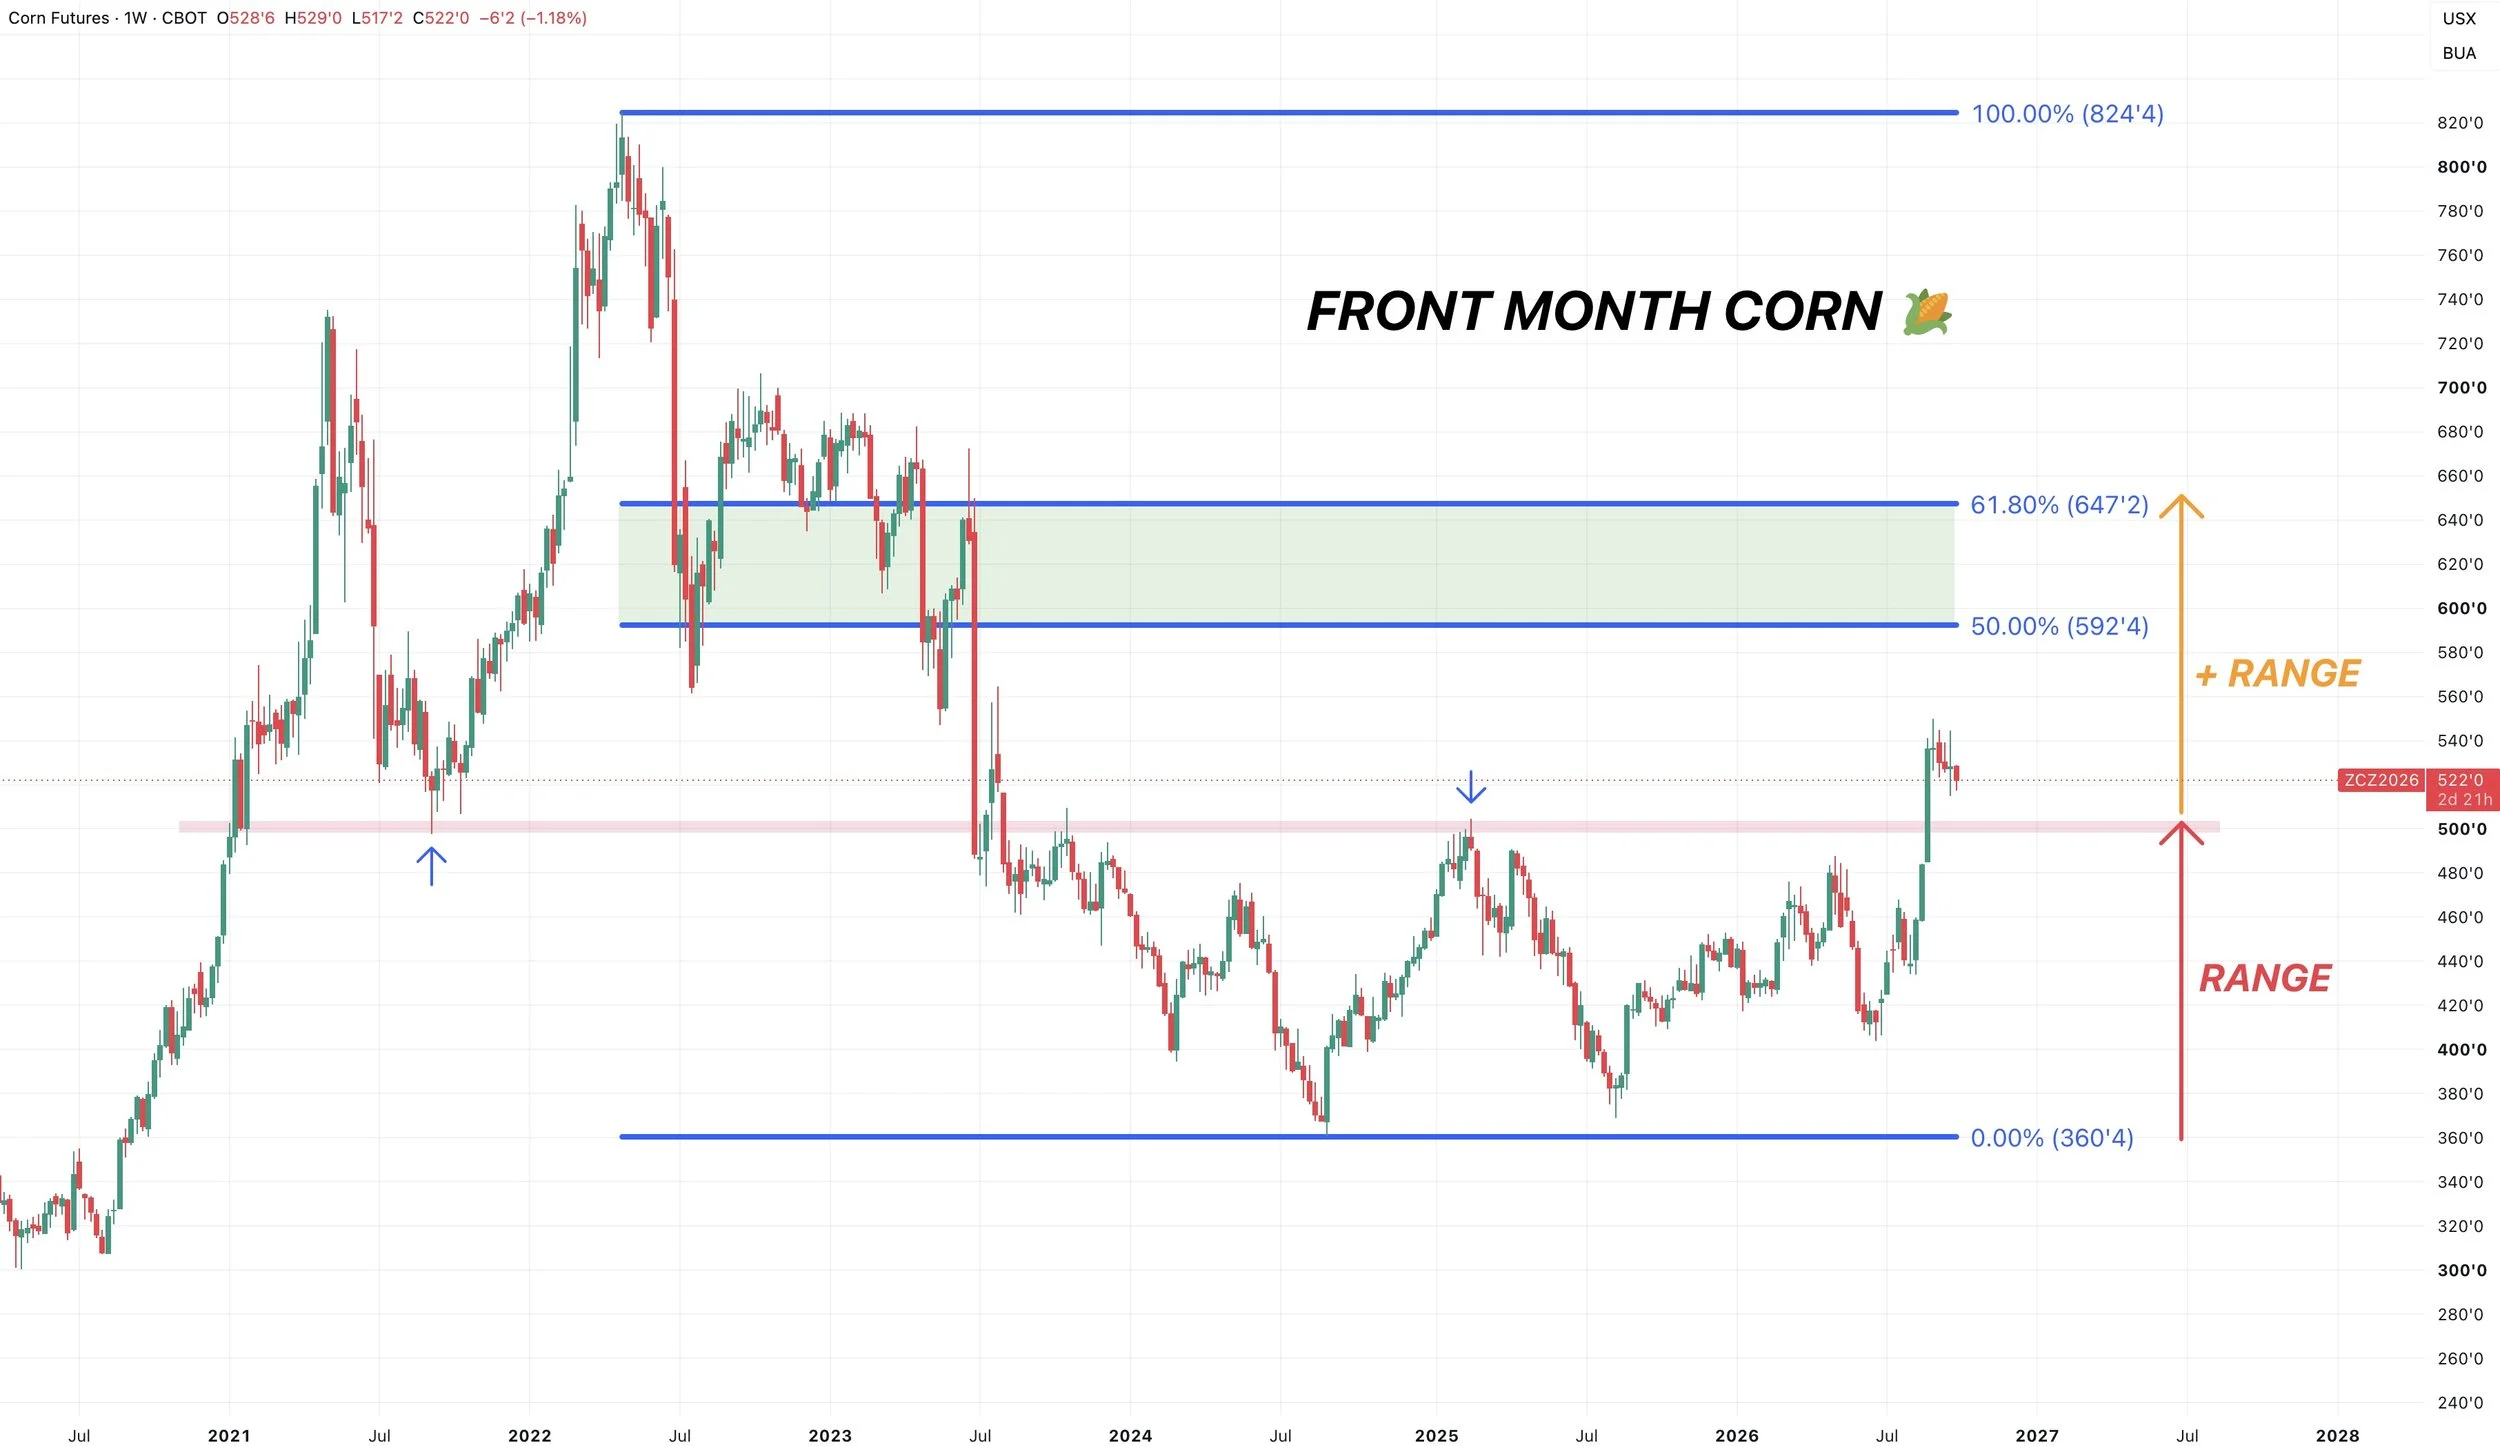
If you zoom out, I'd say there is around 20 cents or so of potential downside risk from here.
With plenty of upside.
So I would argue the upside possibility does outweigh the downside from here.
The weekly and monthly charts are anything but bearish.
We could drop down to the $5.00 range, and the structure would be completely fine.
Breaking out of a 3-year sideways range isn’t bearish either.
Soybeans
Fundamentals:
Like in corn, not going to spend anytime on the fundamentals today as nothing has really changed and there isn’t much we haven’t covered. So going to keep today short and sweet.
The meeting with China didn’t provide anything new for the market.
I still think China is going to buy exactly what they said they would.
But by them doing that, we very well might have to ration demand to non-China destinations. As we don’t have enough soybeans to meet China's goal and to sell the same amount to non-China destinations that we did last year.
Crush demand is a record. Exports have improved drastically. They're nearly double what they were last year.
The world situation is getting tighter even with record crops in Brazil and the US, now we have the Super El Niño that shouldn’t be helping world production. As we're already seeing some negative impacts in parts of the world.
Meal just posted multi-year highs. Diesel is at record highs.
The soybean market has plenty going for it long term.
One thing I did want to note is basis.
Some areas have basis that's just on fire. So check yours out. If you are in one of those areas, take advantage of it. Because once harvest gets going, that basis won’t be there.
As some areas are struggling to get beans with the harvest delays.
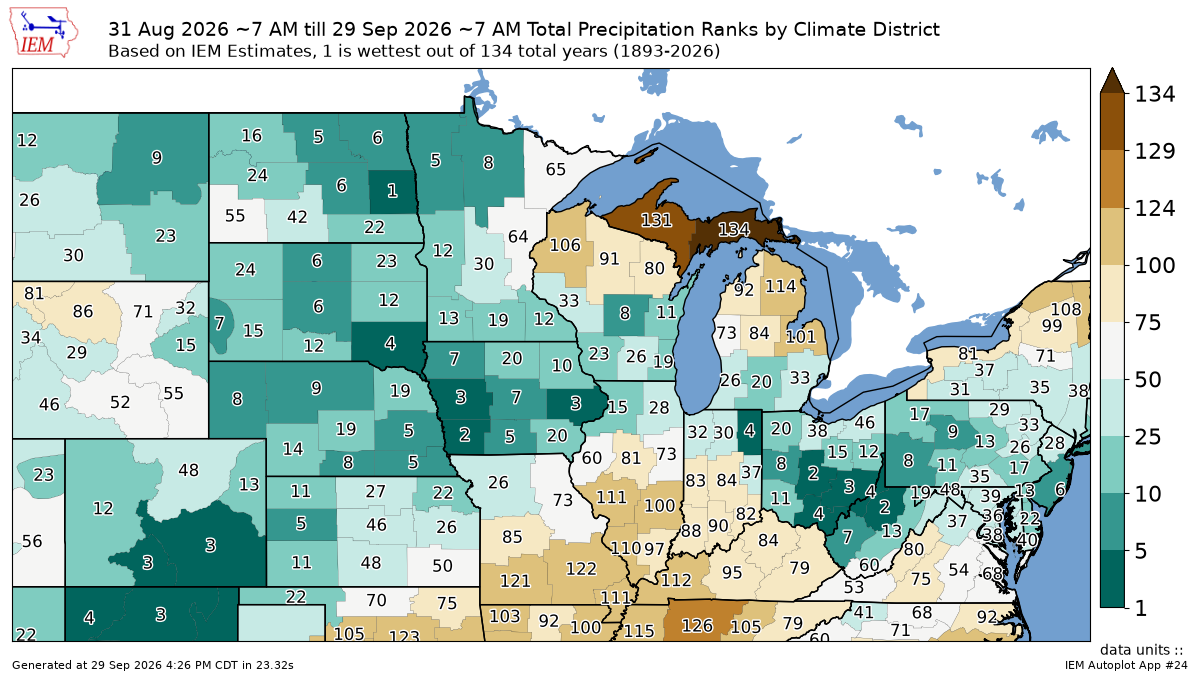
Given that places such as Iowa are having their wettest September on record.
Quick Seasonal Data Update:
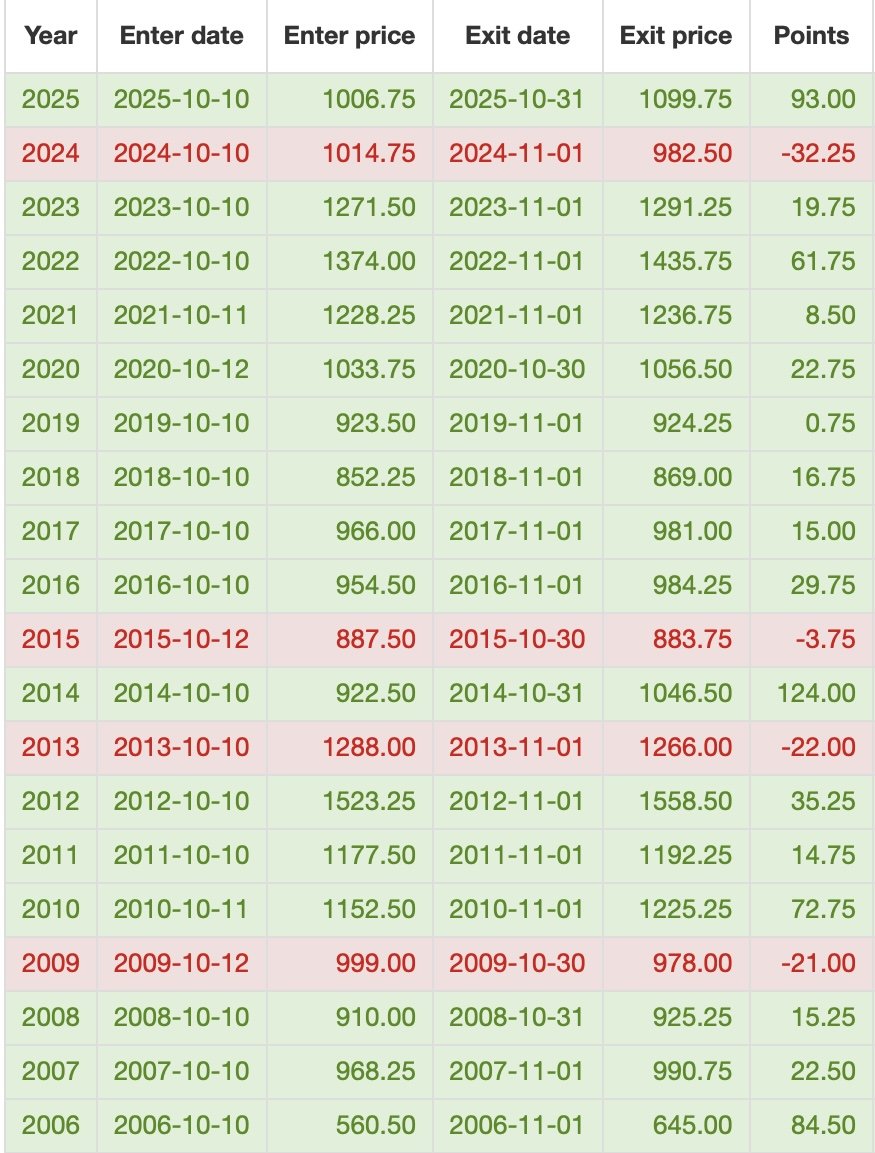
The end of September and early October are one of the weakest time frames for soybeans.
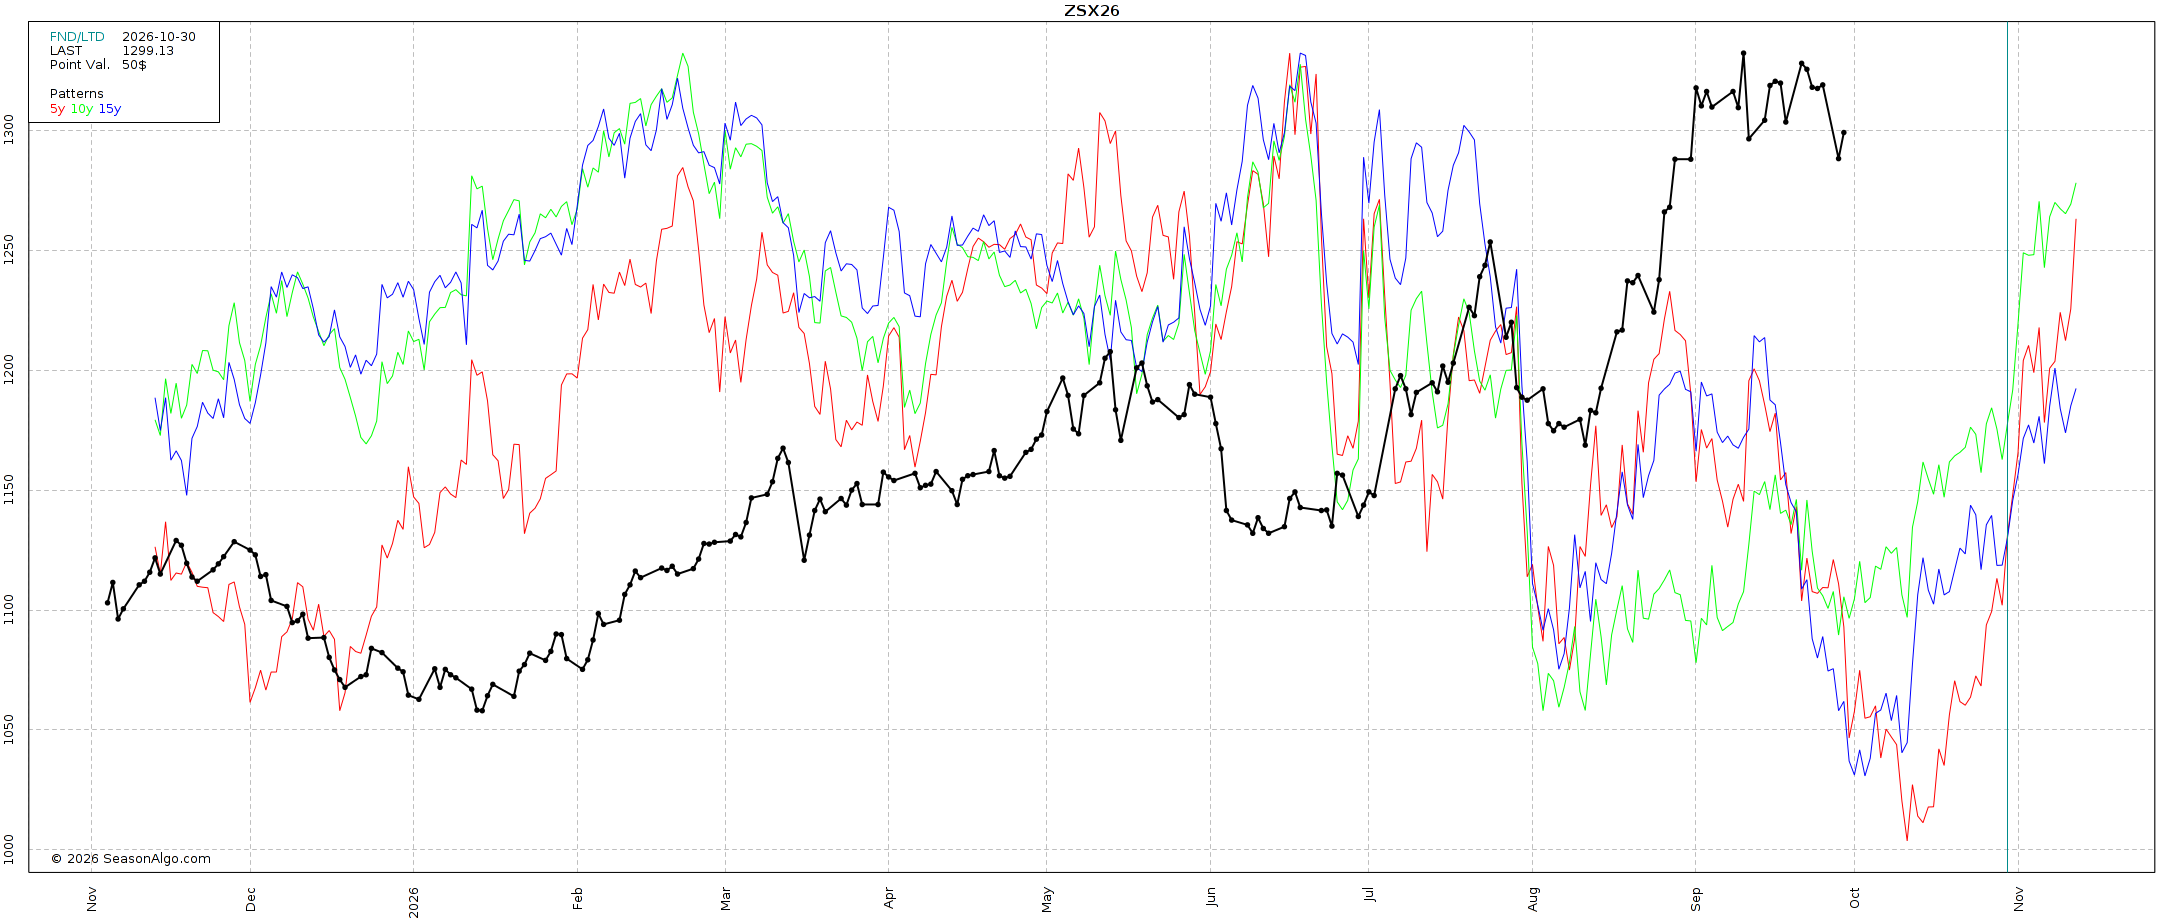
However, from today's date by November 1st we have been higher in the last 8 of 10 years.
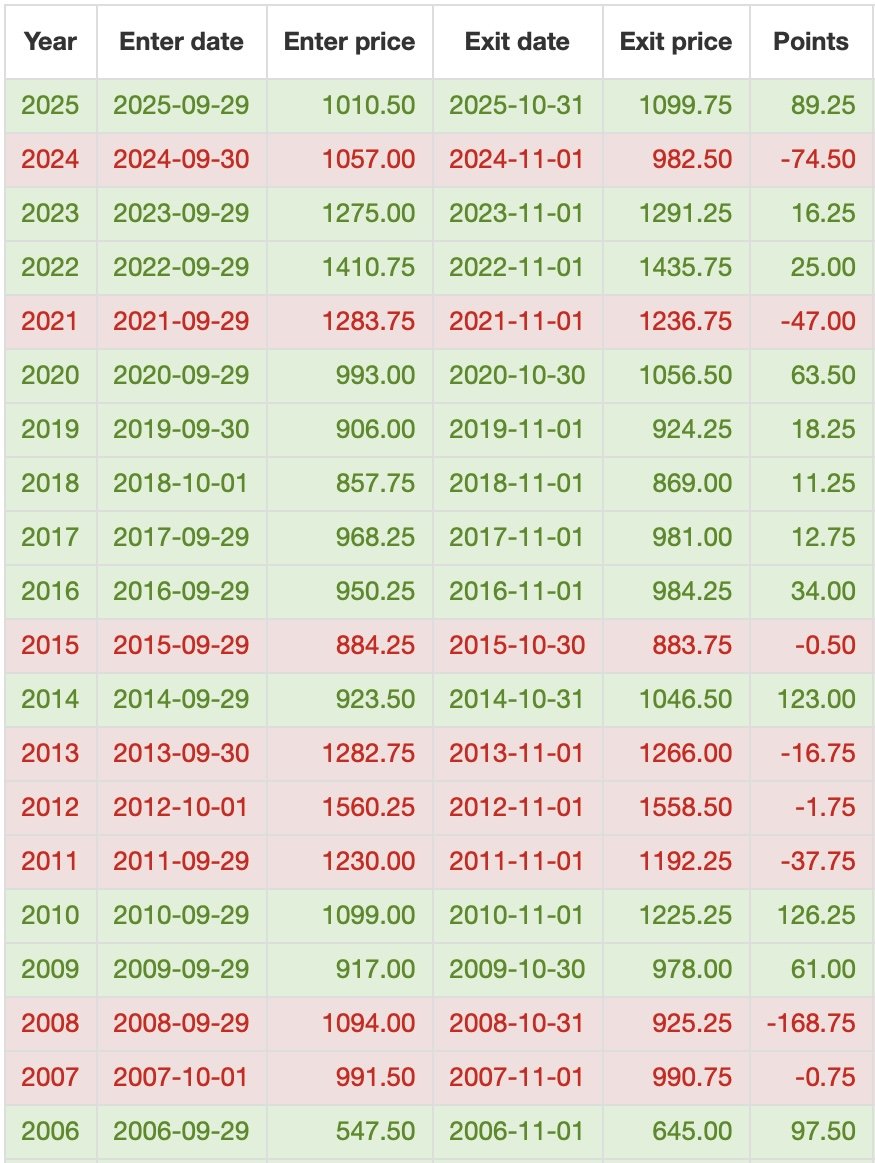
Here is an even stronger set of data.
From October 10th to November 1st, soybeans have been higher in the last 9 of 10 years.
Higher in 16 of the last 20 years.
So heading into November tends to be a friendly time frame.
Pre-Report Trade Ideas:
Disclaimer: there is risk of loss trading futures and options. Past performance does not necessarily indicate future results. This is our opinion and should be treated as such.
Like in corn, if you are someone who wants to re-own soybeans because you are oversold or made sales higher than here.
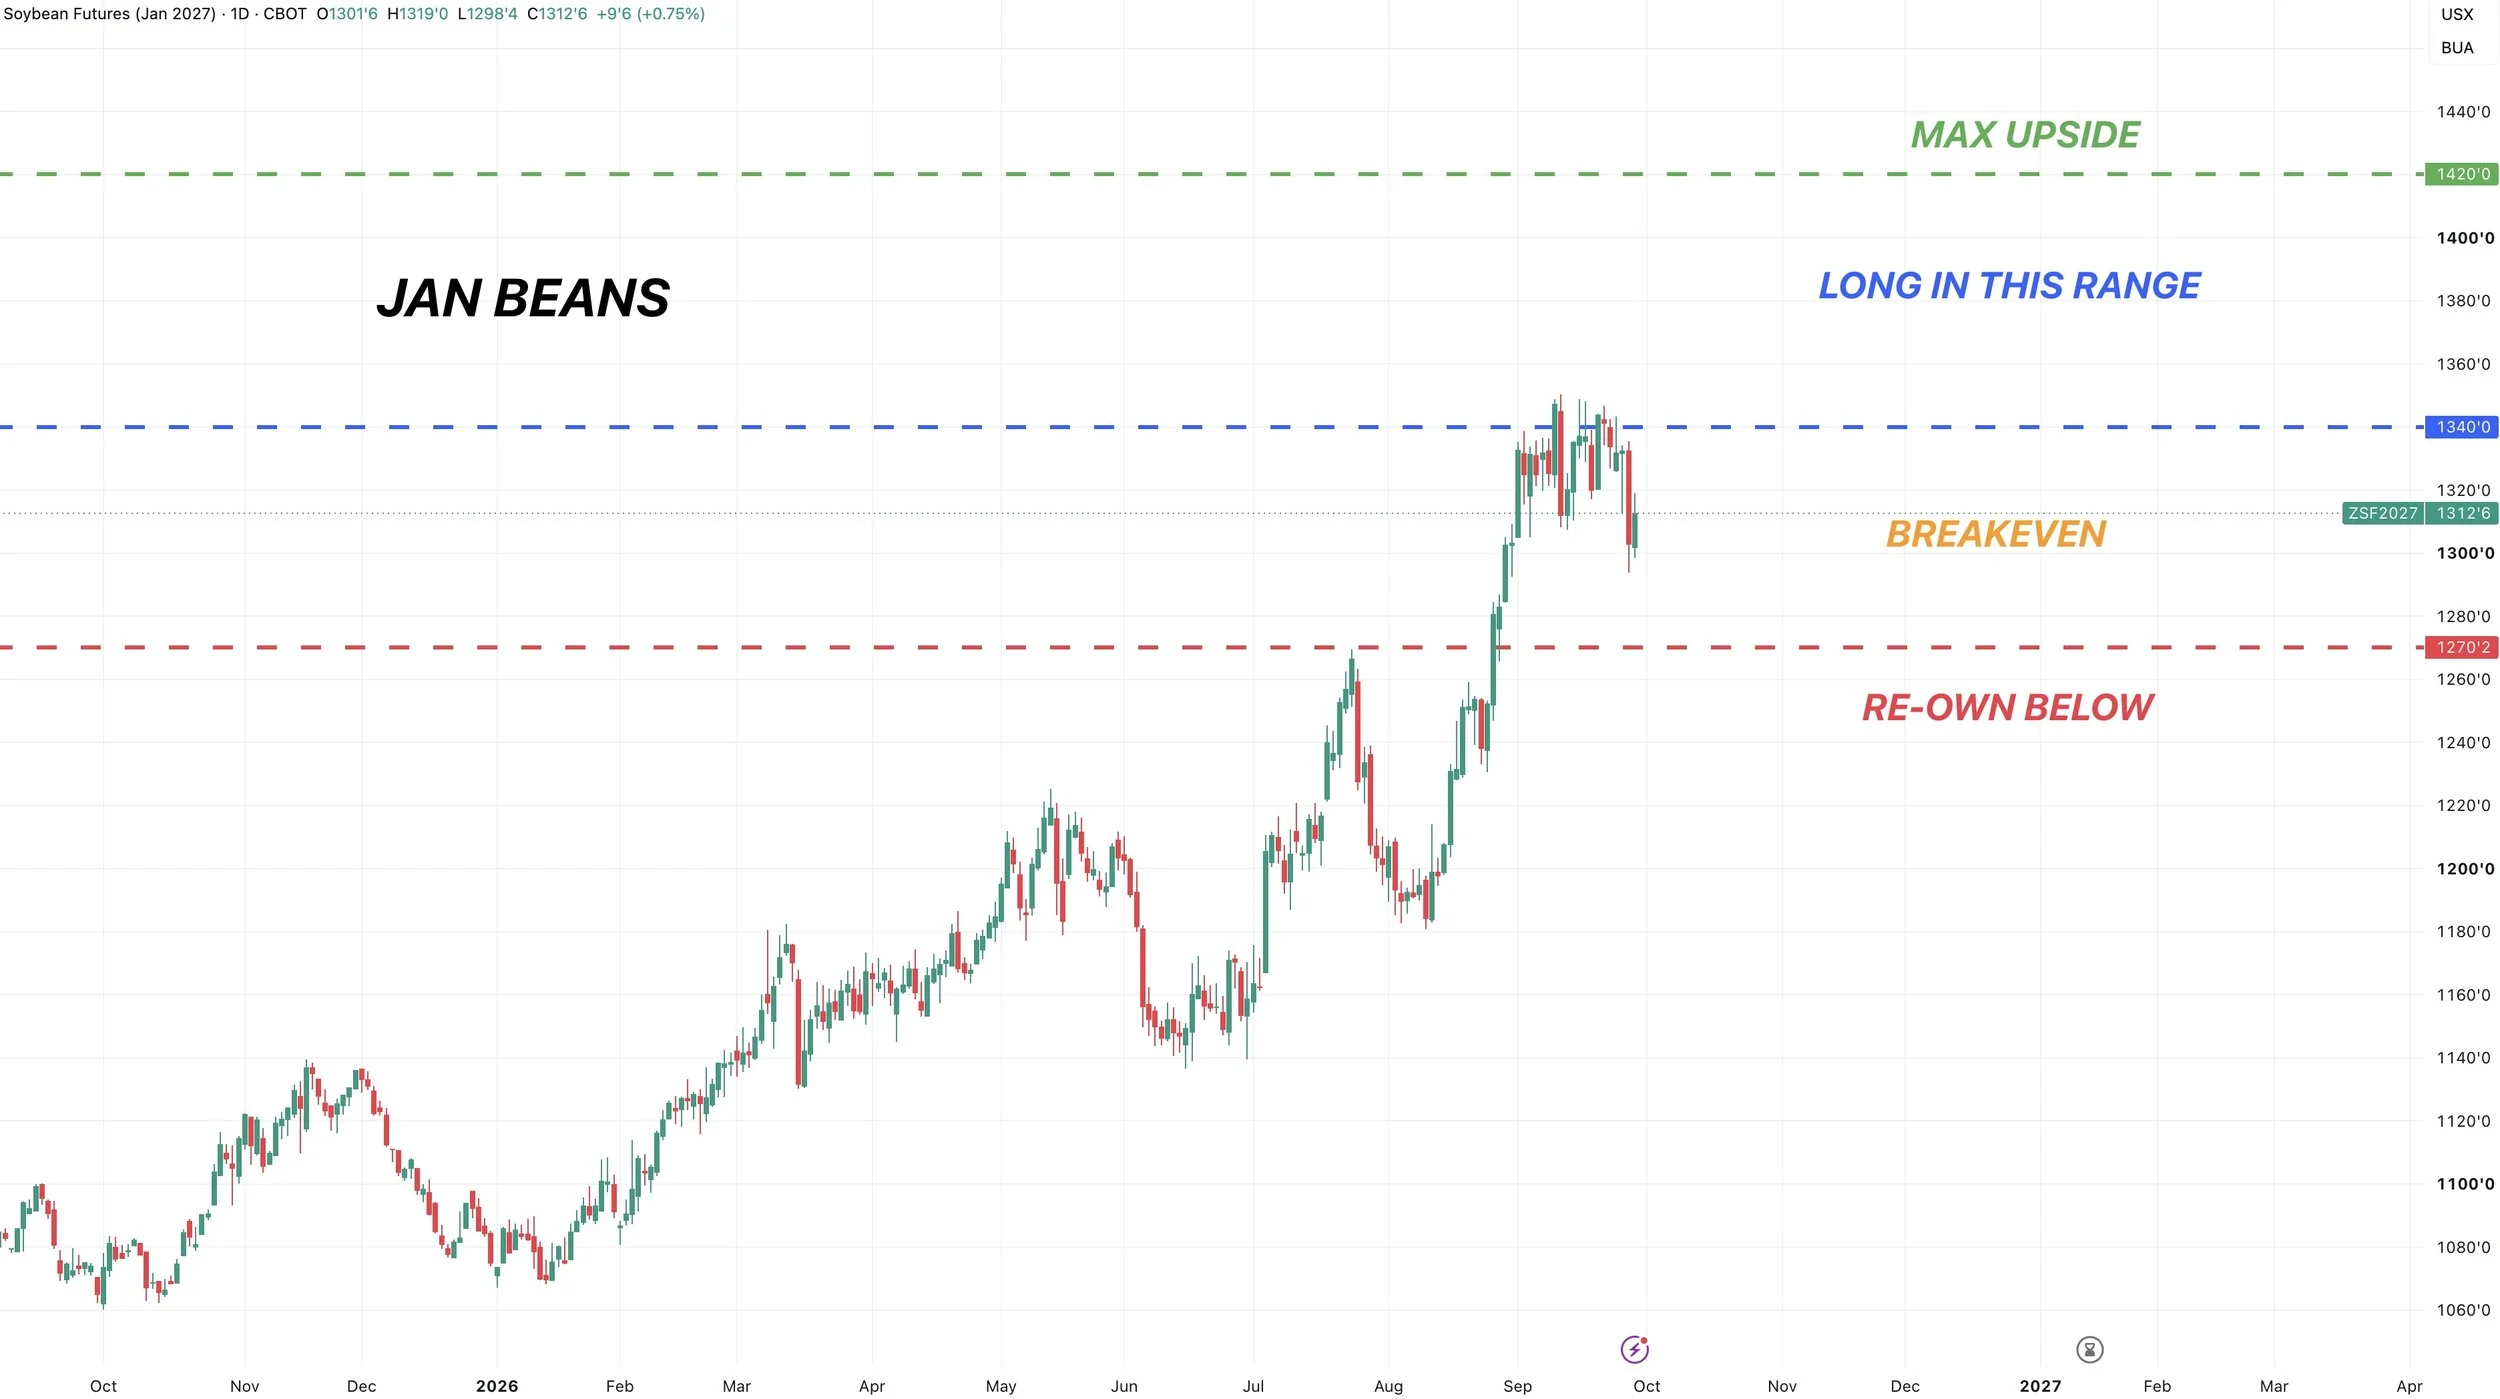
One strategy we like considering is once again going to be selling a put to buy a call spread on January soybeans.
An example would be:
Sell $12.70 put
Buy $13.40 call
Sell $14.20 call
So the max upside is $14.20 or 90 cents of upside.
If we drop below $12.70 you are able to re-own 40 cents below the market.
We also just simply like selling puts down at possible support levels with the recent break in prices.
If you're undersold or uncomfortable, you could look at some downside protection.
As always feel free to reach out if you want to talk through anything.
As not all of these ideas are going to be for you and no operation is the same.
Office: (806)484-1214
Soybean Charts
Nov Beans Chart:
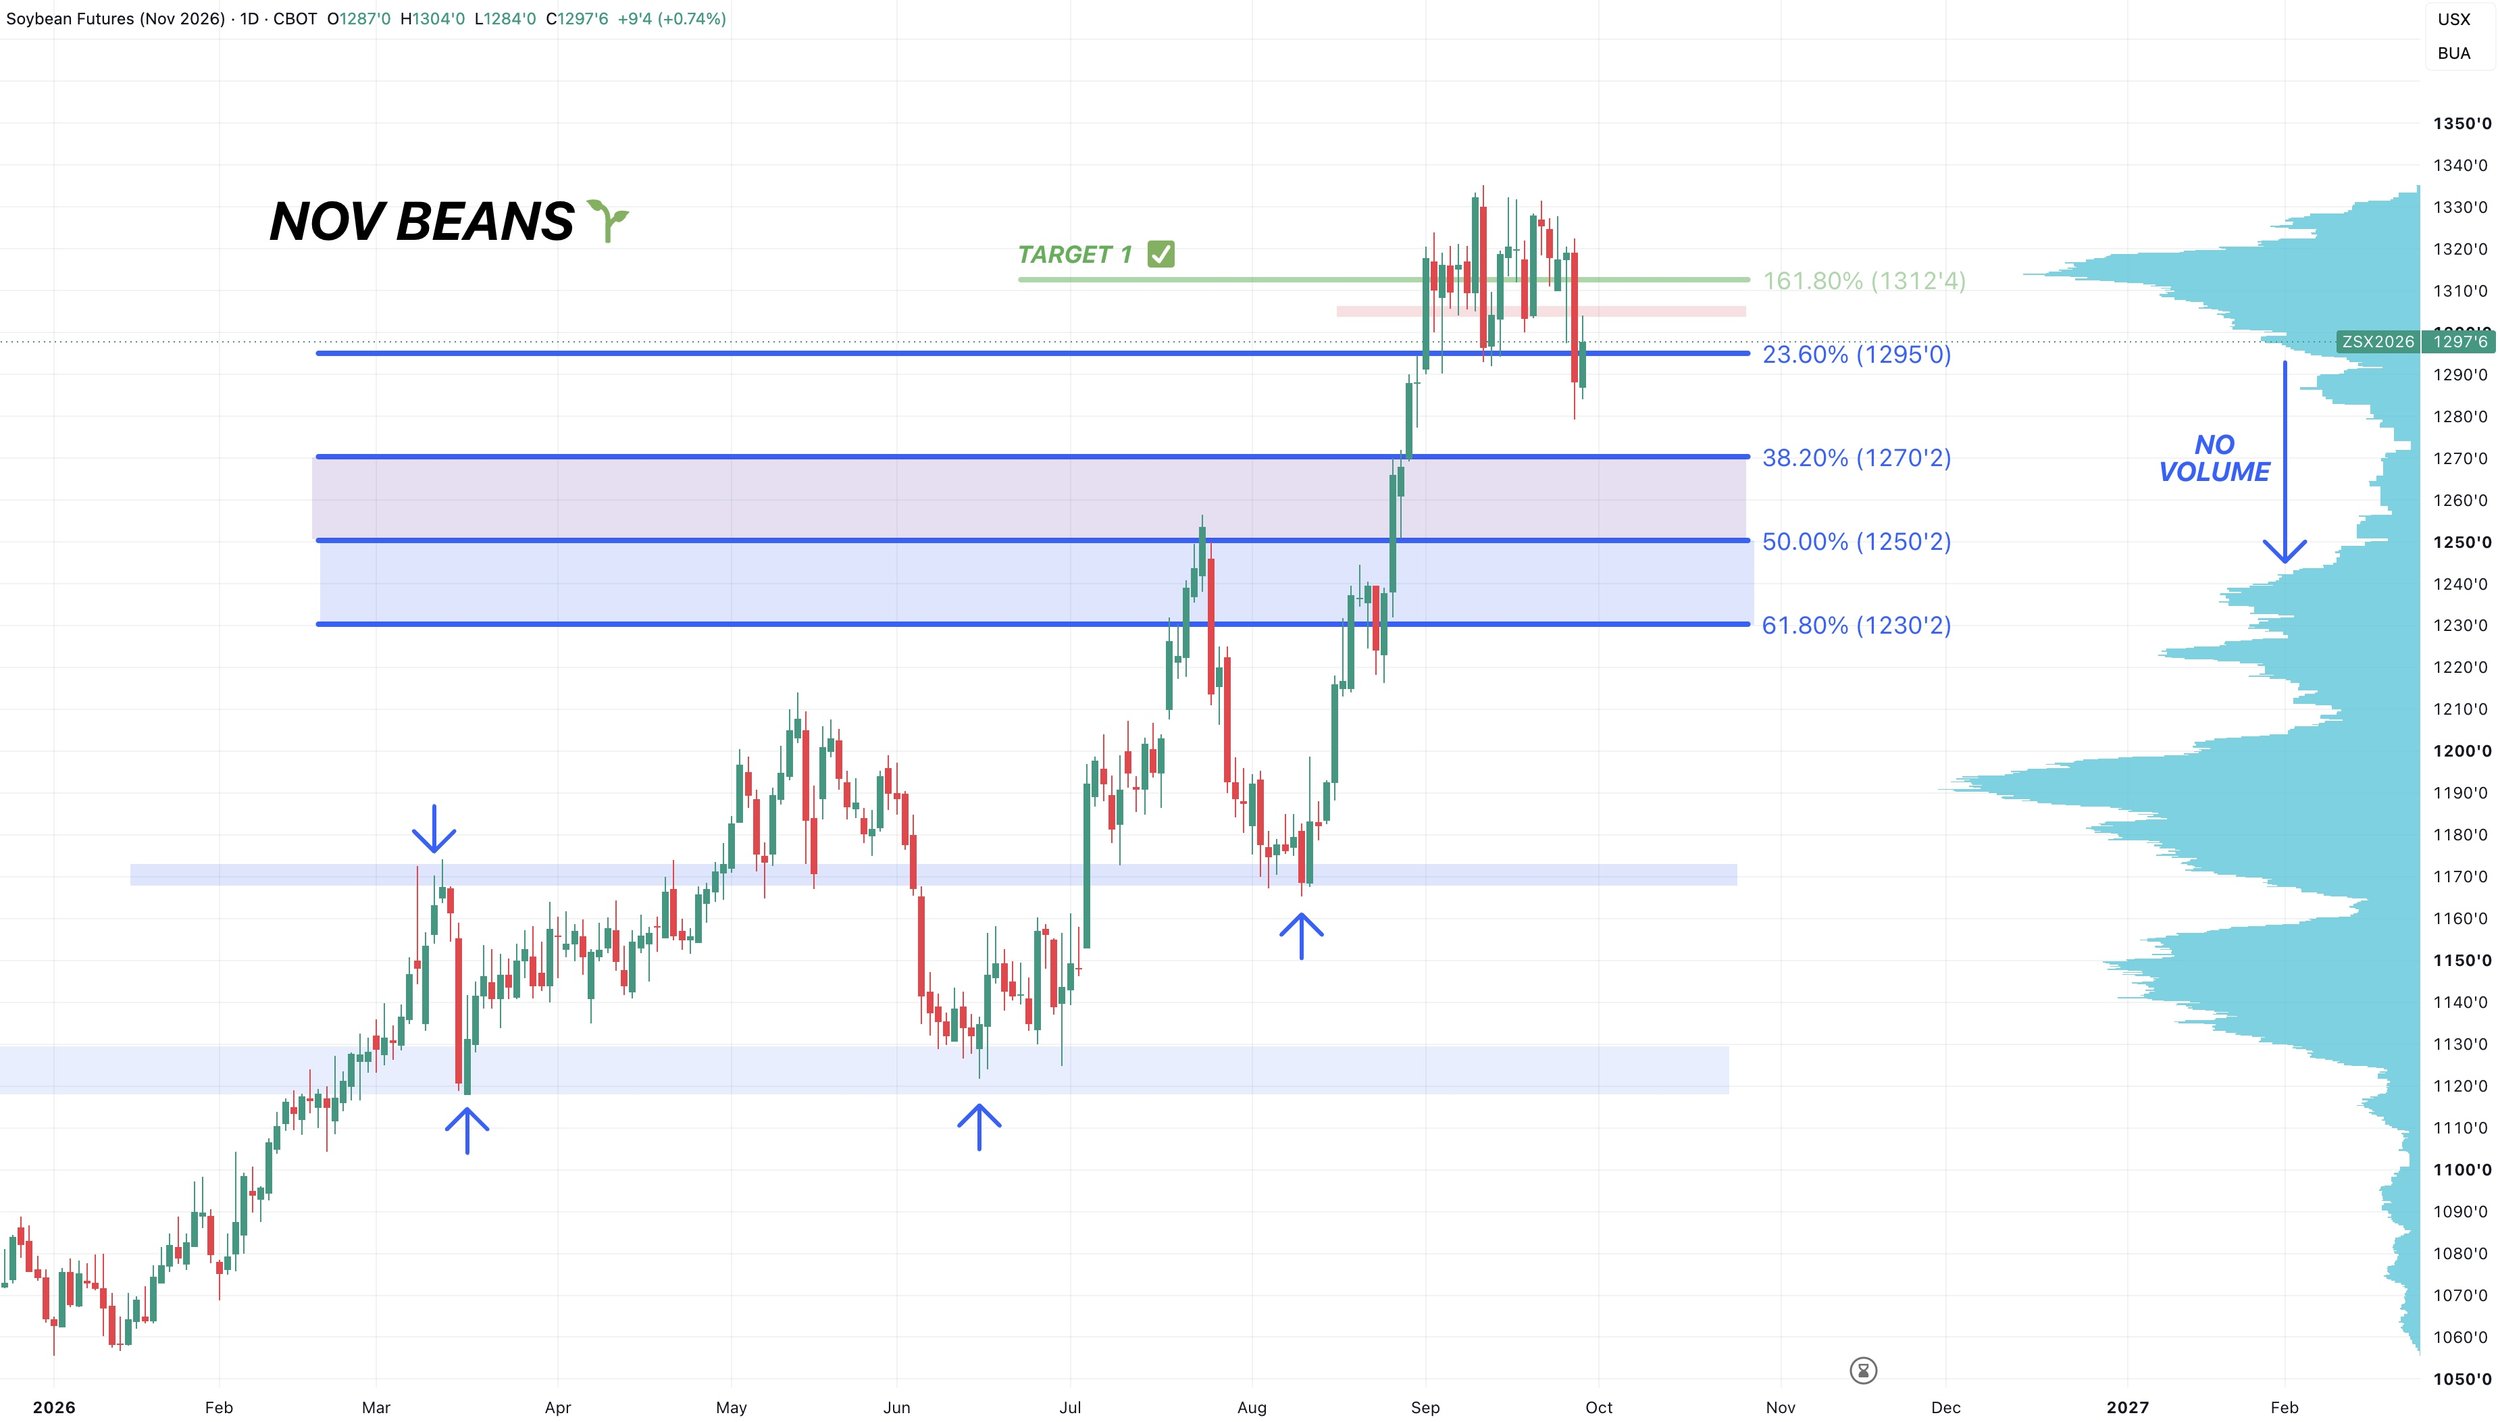
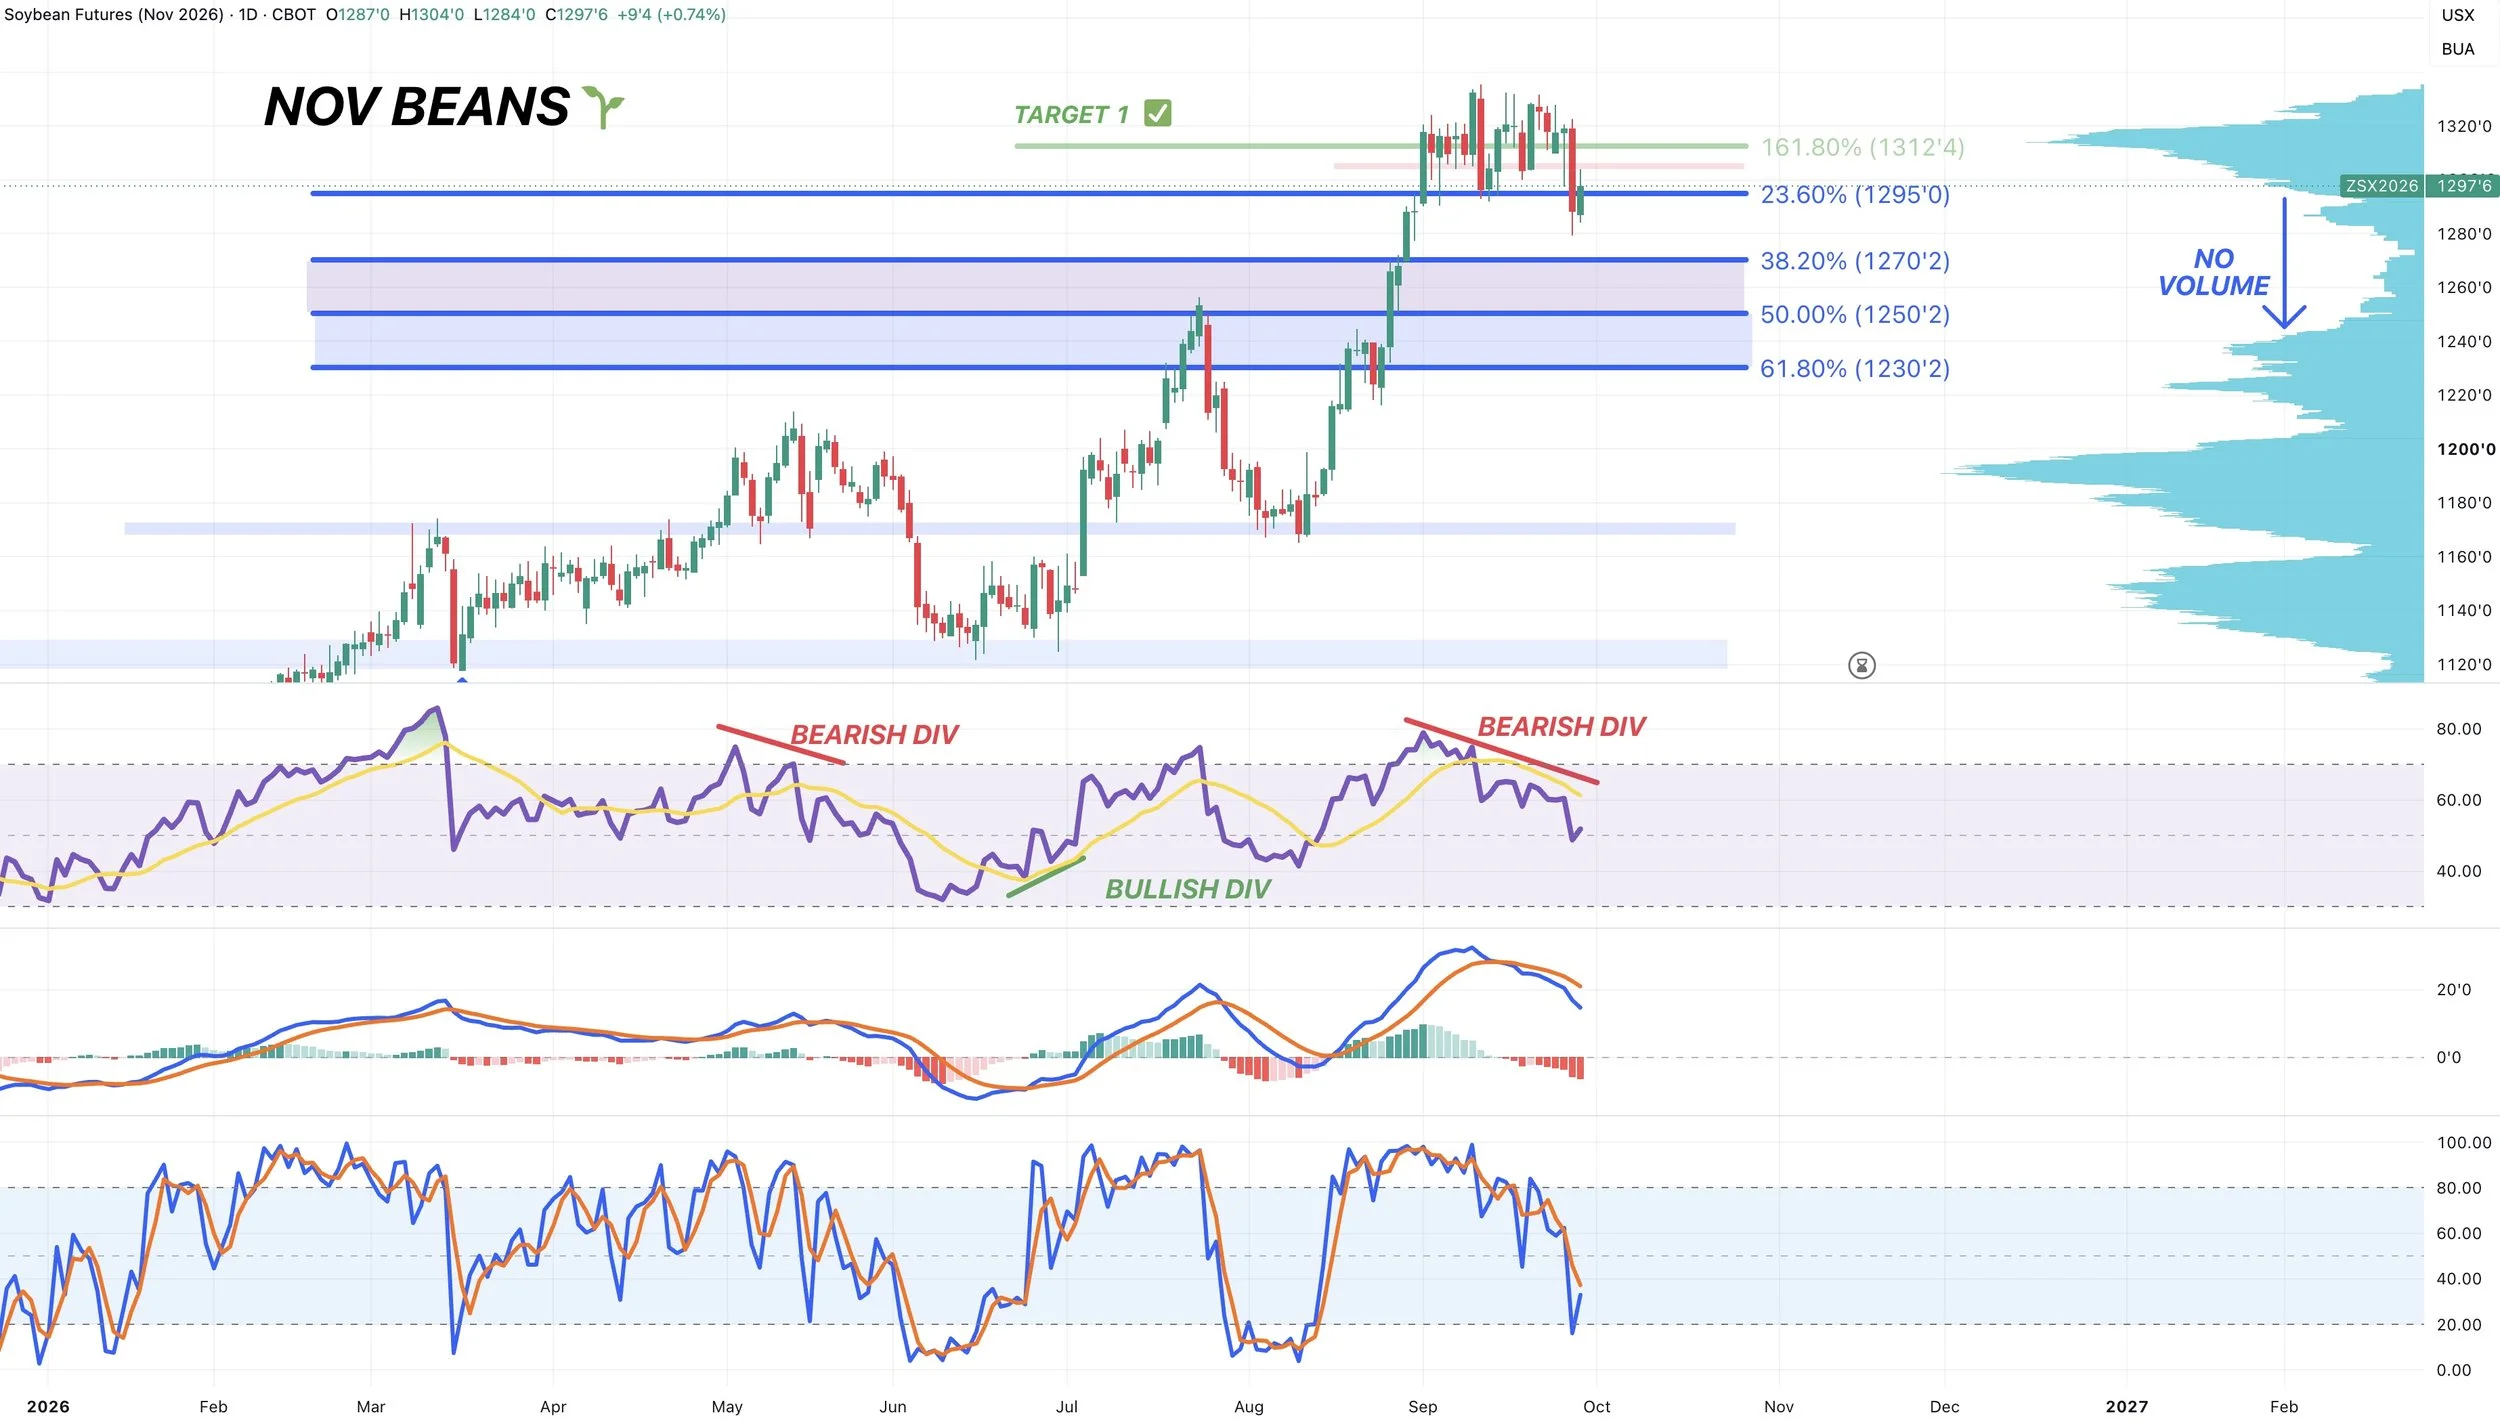
Like in corn, soybeans broke some key support.
As we broke through the bottom of the range we had been trapped in for the last month.
Now what?
We need to see us get a close back inside of that range and back above $13.00 to be more confident we have found a bottom.
Until we do that, this could easily just be viewed as a simple re-test of old support turned into new resistance.
If that is the case, there is still plenty of downside risk and very little support below here.
So we need to get back above that old support or the risk is lower and we could head towards $12.50 to $12.70 (38.2% to 50% retracements of August lows).
If you're able to get back above key support, this could be viewed as a bear trap.
Since we had that sell alert on Sep 1st, I am remaining patient for now.
Here is a 4 hour chart for reference.
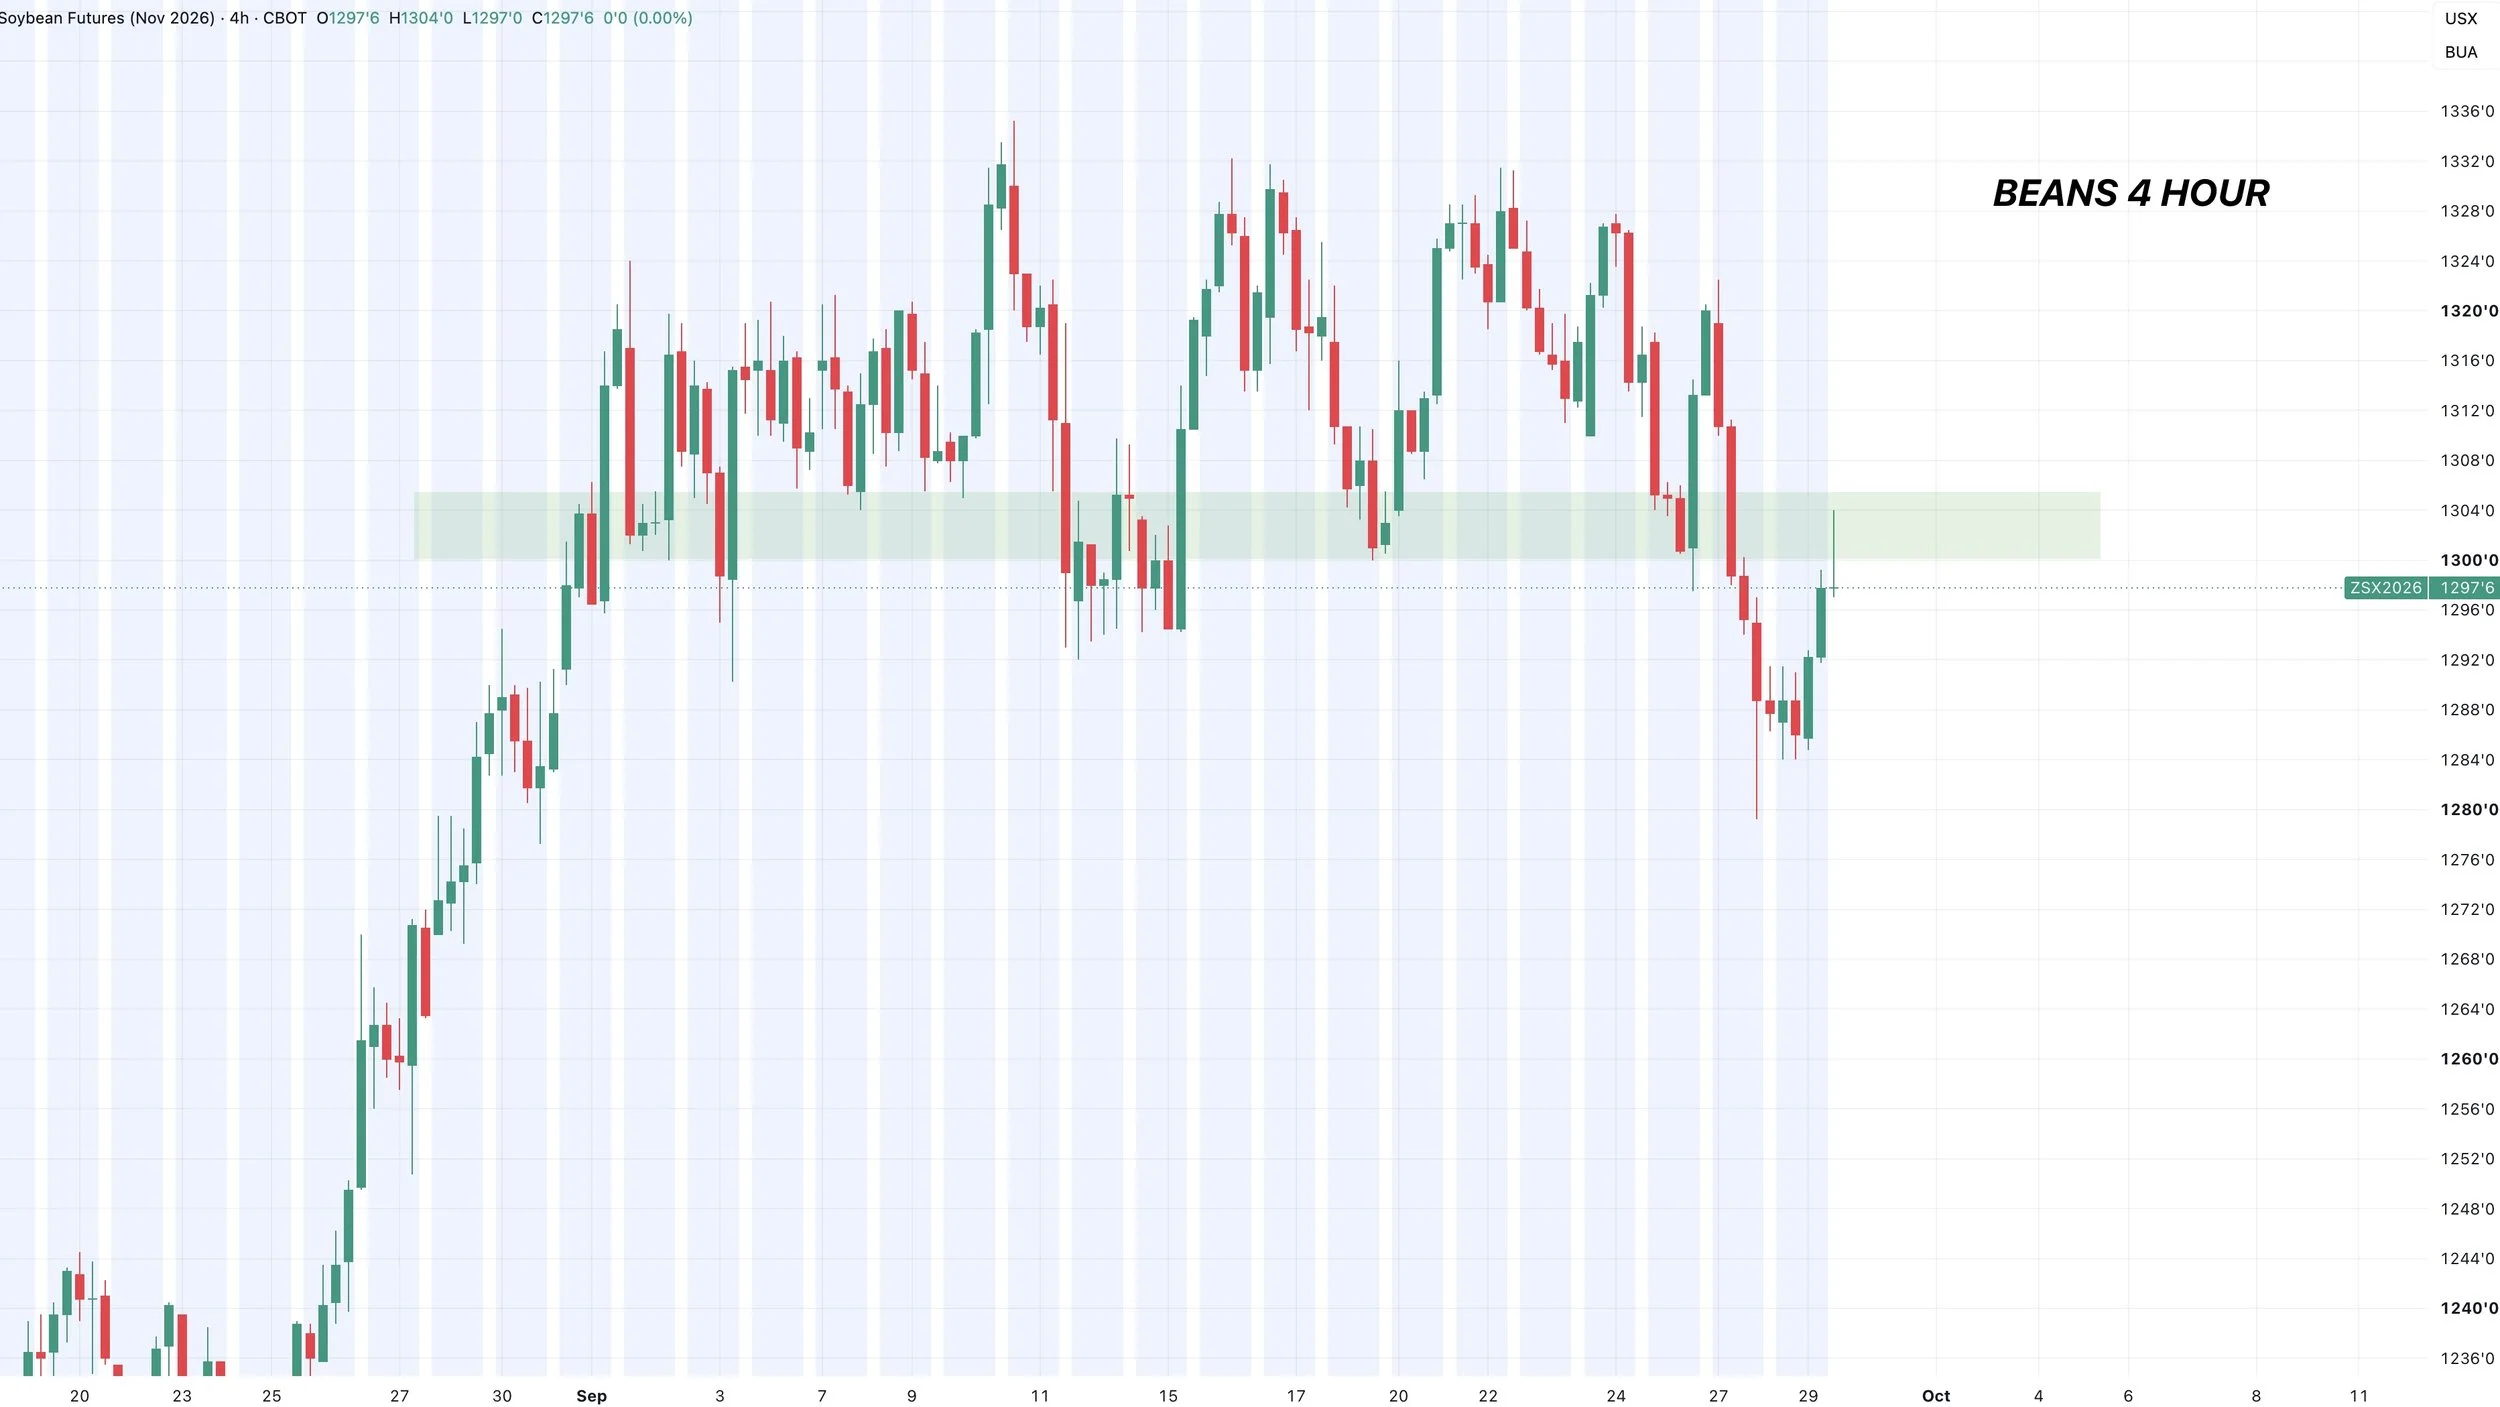
We had that clear support.
We broke it.
We're now re-testing it. So we need to break above for more confirmation of a bottom.
I have been openly cautious the last few weeks, as we had bearish divergence on the RSI. Suggesting we were losing momentum.
We also had the MACD cross bearish.
However, the indicators have now cooled off quite a bit.
This doesn’t mean that this is the bottom, as we don’t have any hard evidence of one yet.
But a correction was a healthy reset for this market.
Wheat
Dec KC Chart:
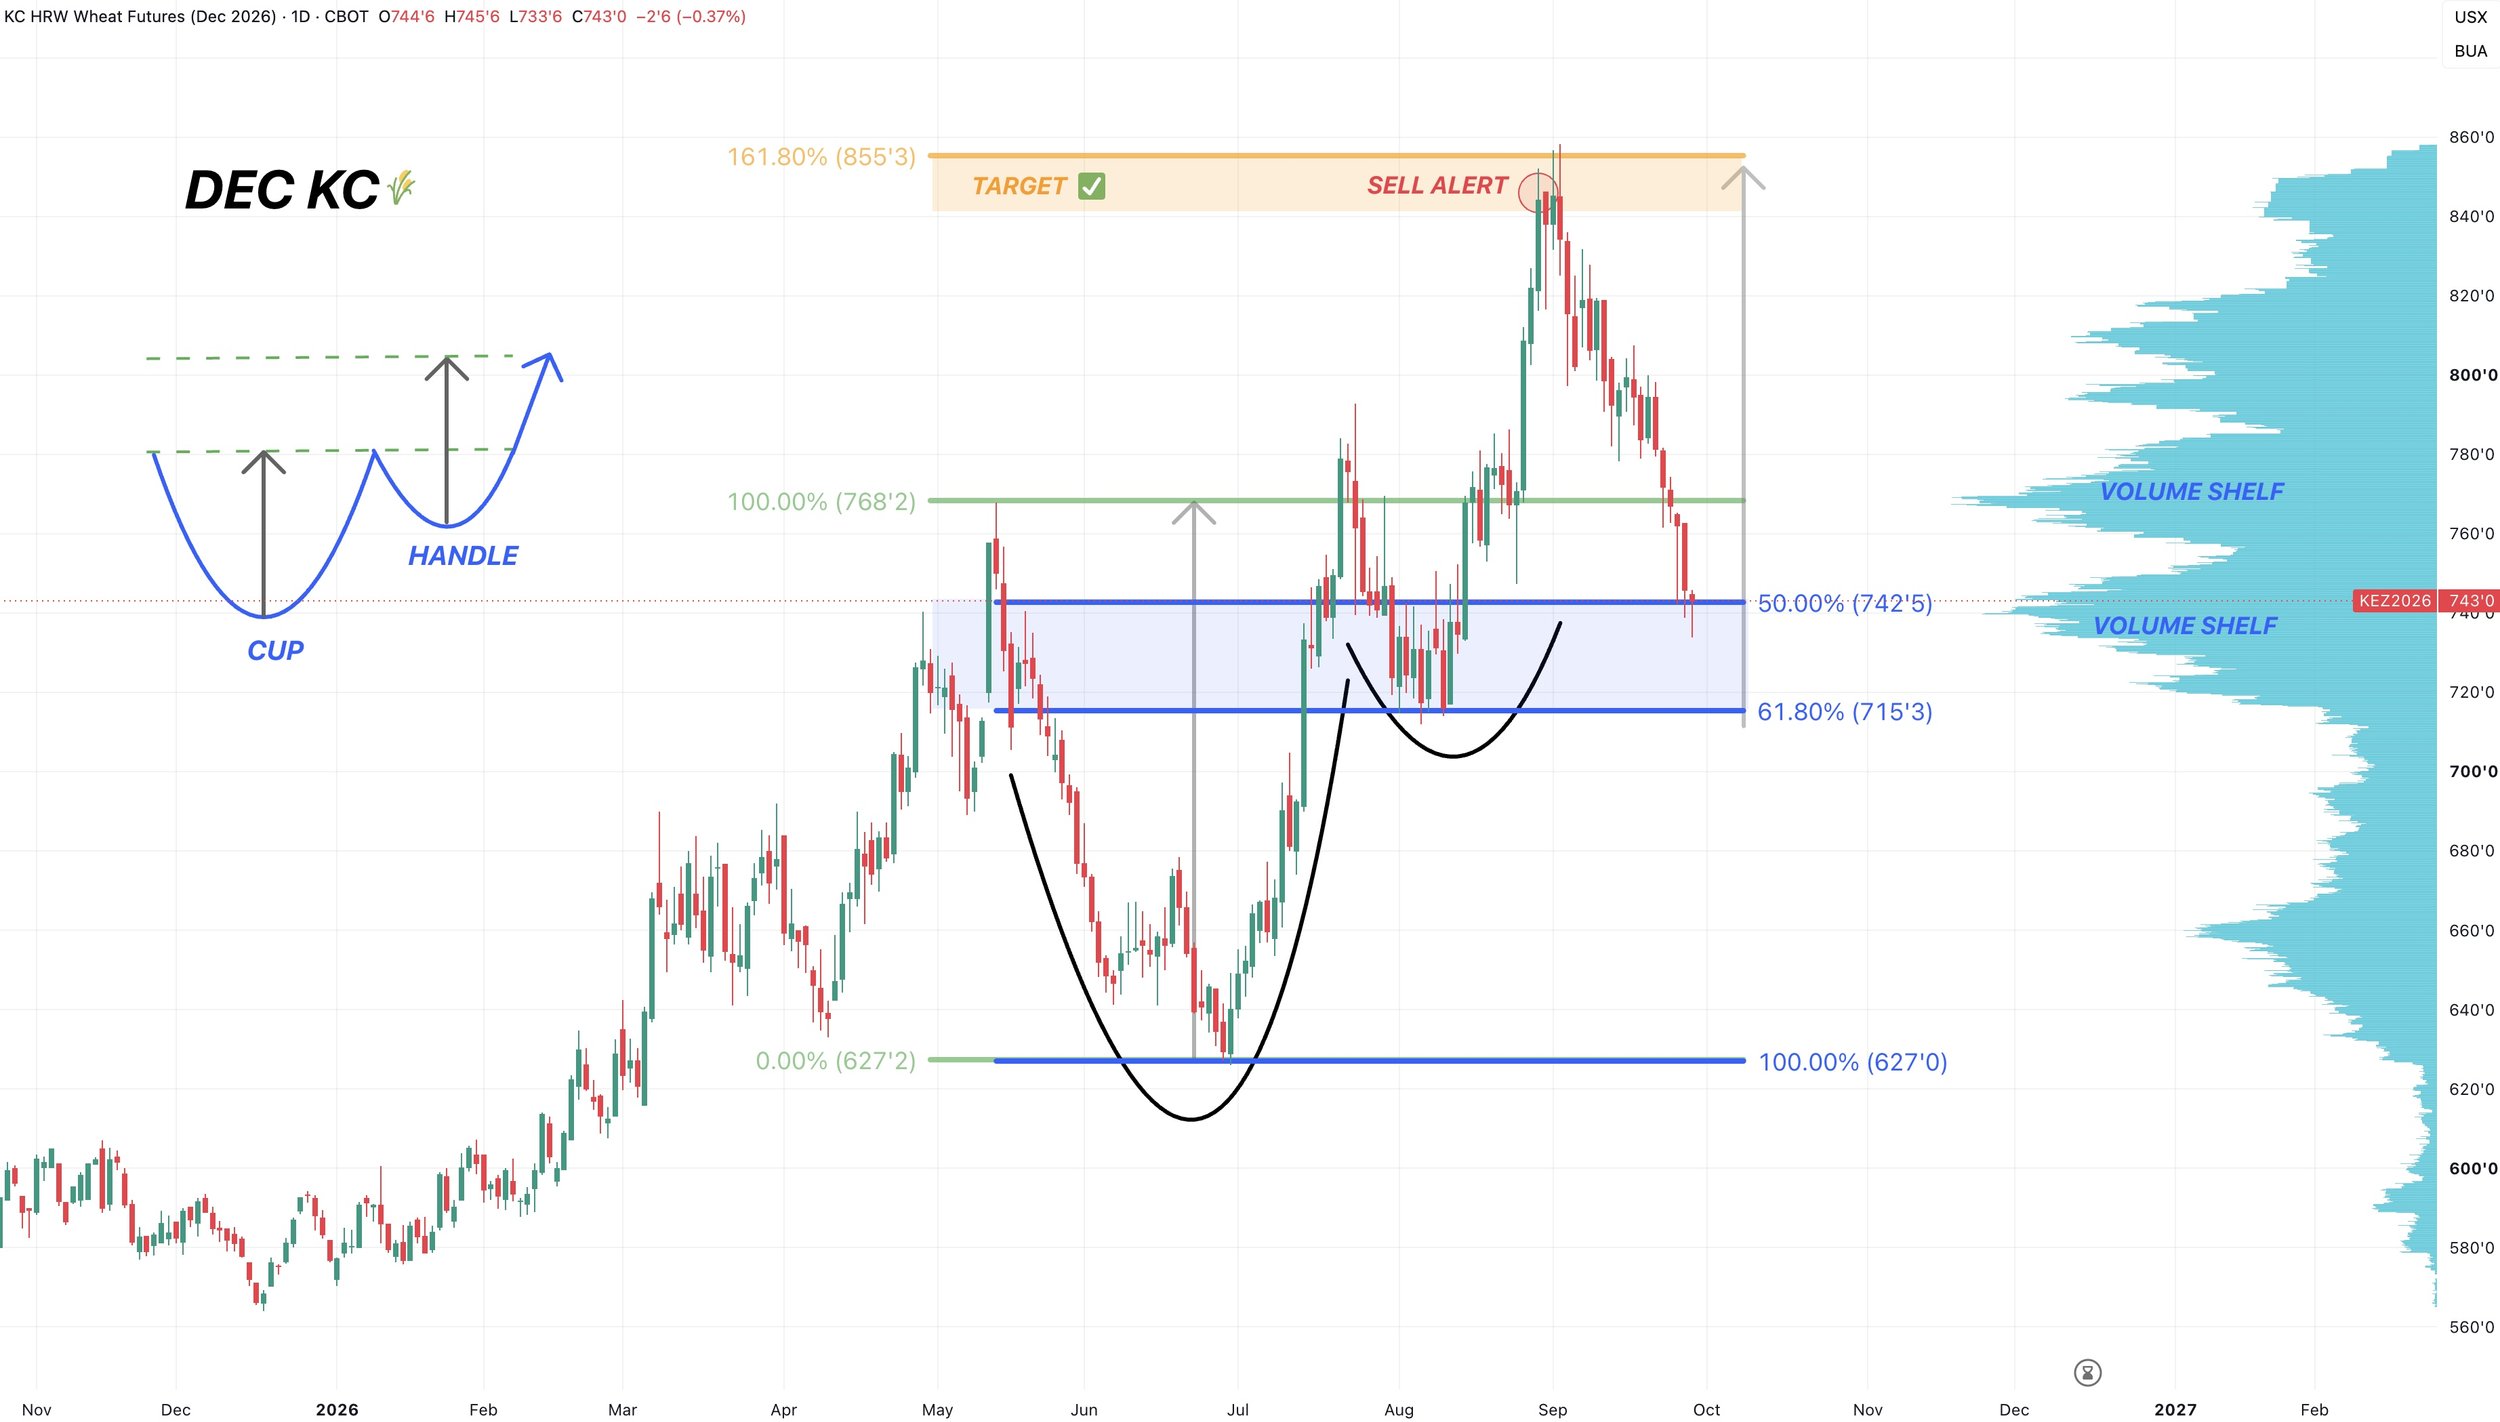
Wheat continues to trickle lower.
We've went lower than I orginally thought we would. However, I do think we are getting close to a bottom.
I would expect us to carve out some lows anywhere between here and $7.15.
As $7.42 to $7.15 is the golden zone down to the June lows.
Not only that, but it's the last big shelf of volume.
If we managed to break below this box, there would be some reason for concern. As there would simply be zero support below this market.
So this box is a must hold spot.
But for now, I don’t yet see any reason to be overly concerned sitting at support.
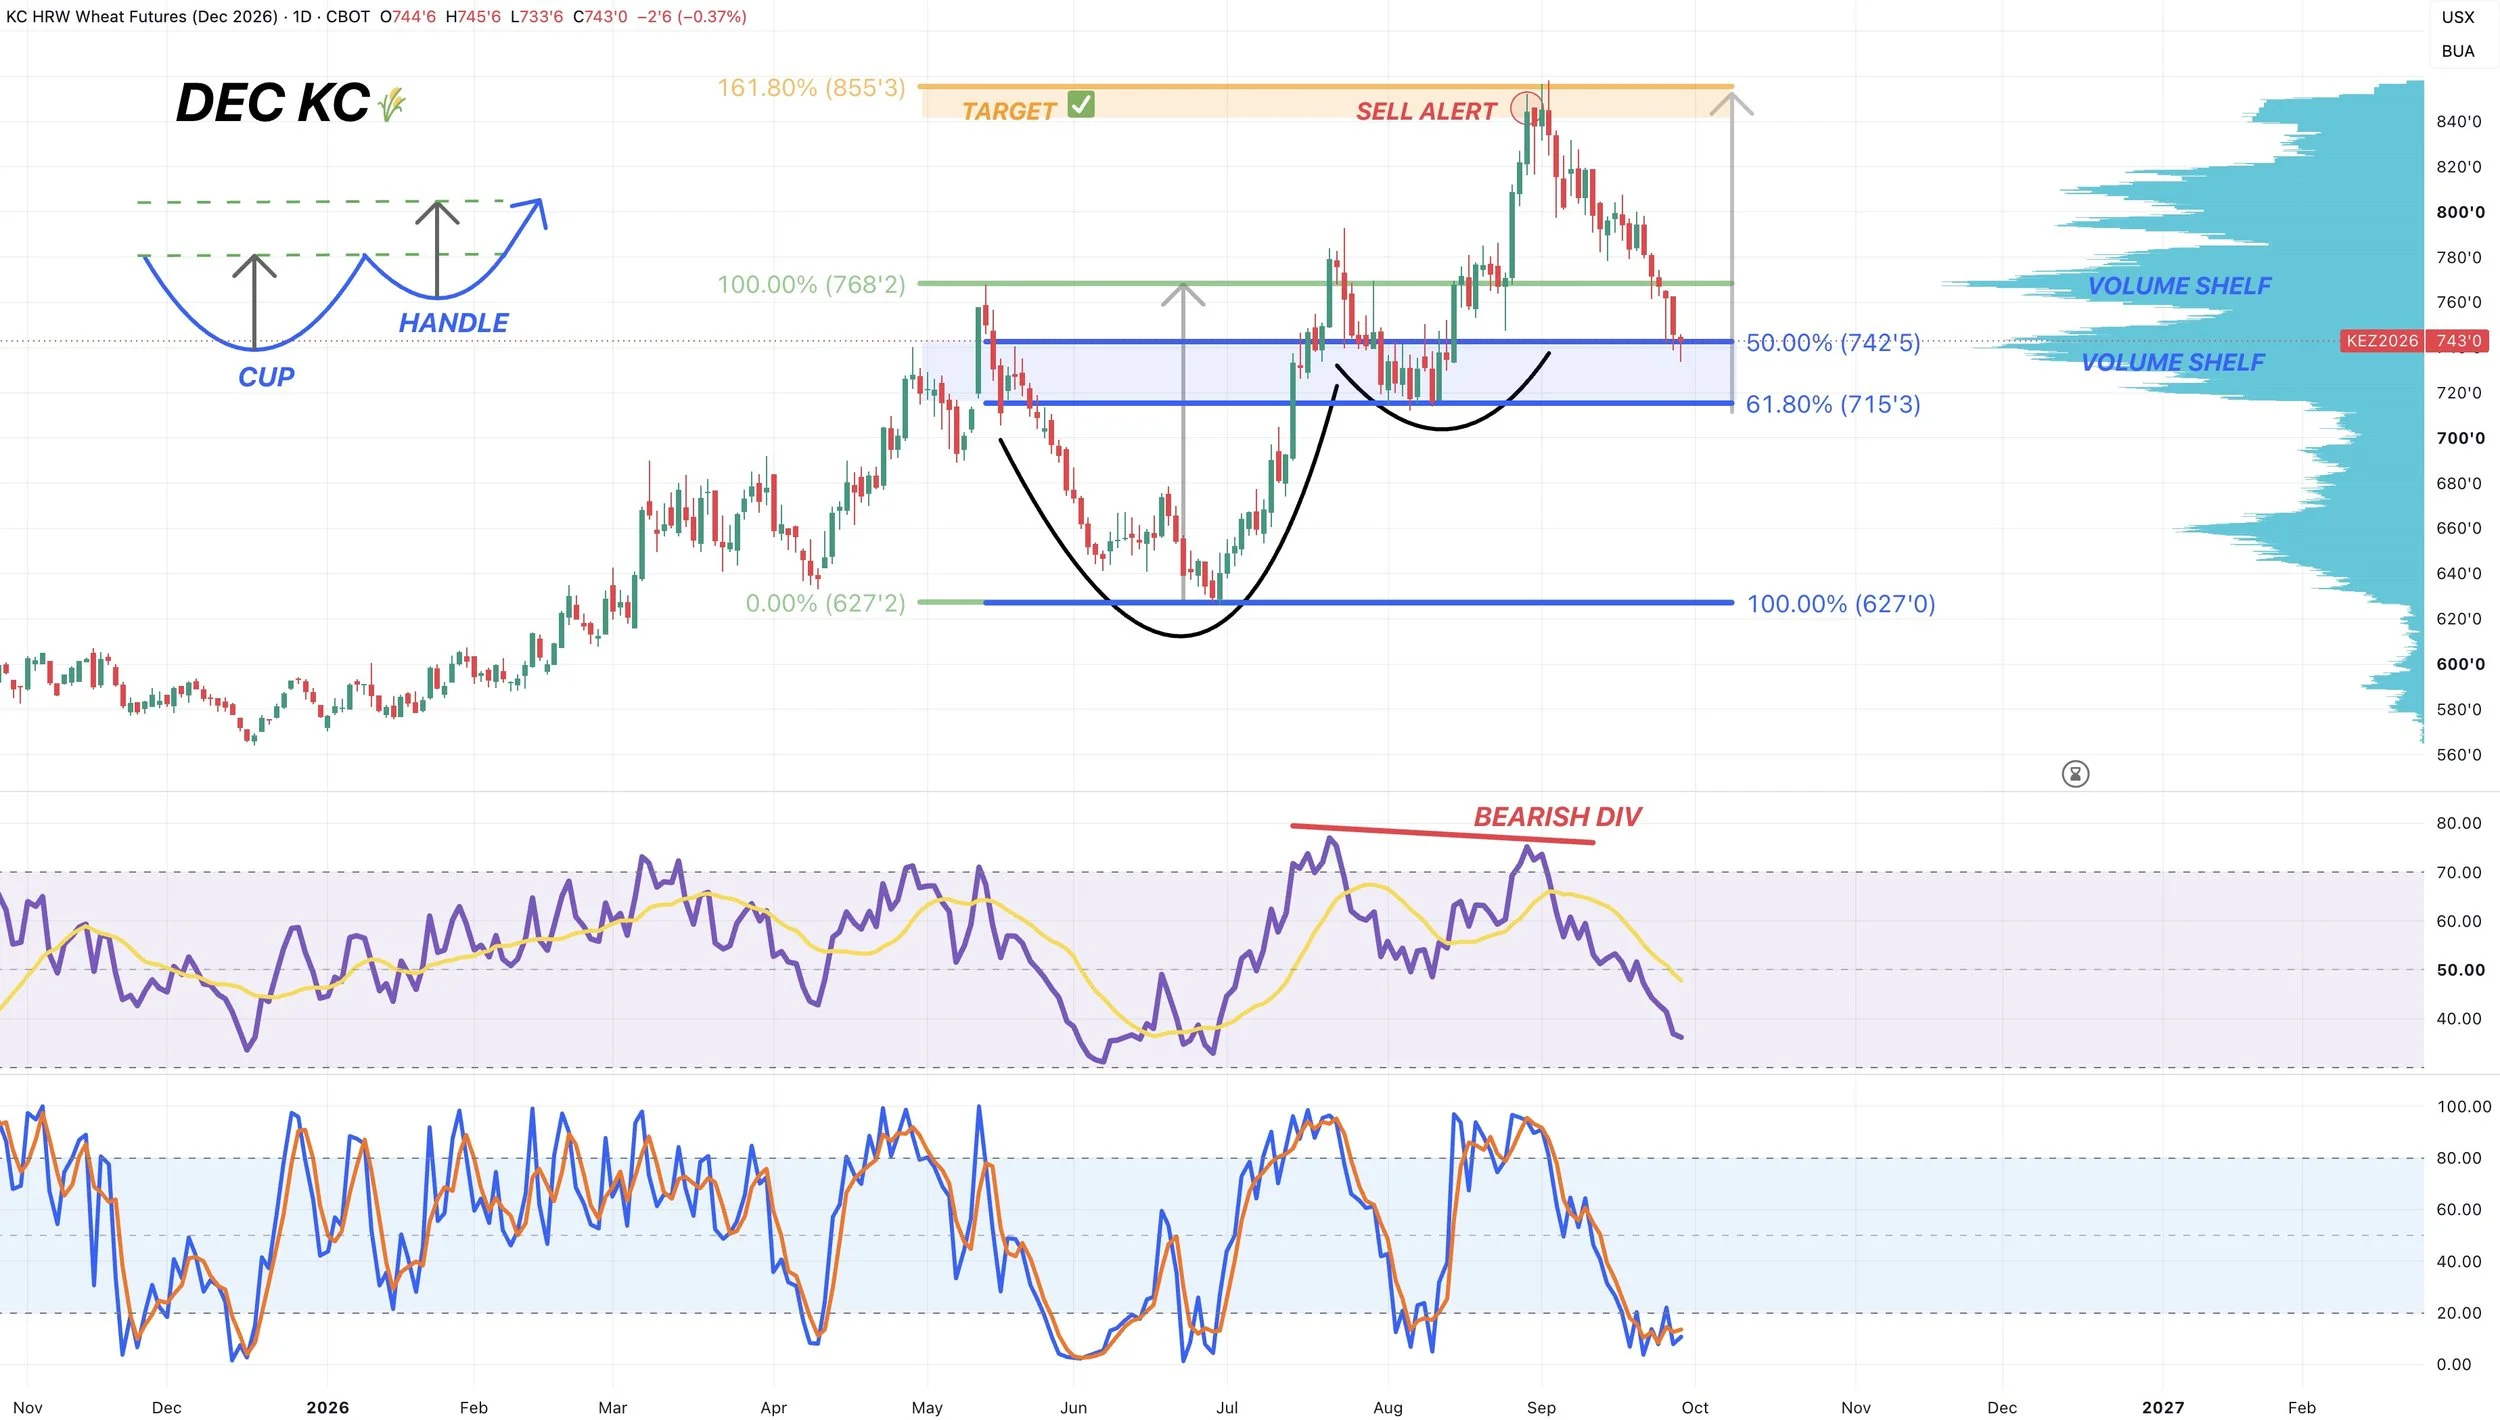
The last time we were this oversold wheat was over a $1.00 lower.
As we are now getting pretty oversold as well on the RSI and stochastics.
Weekly KC Chart:
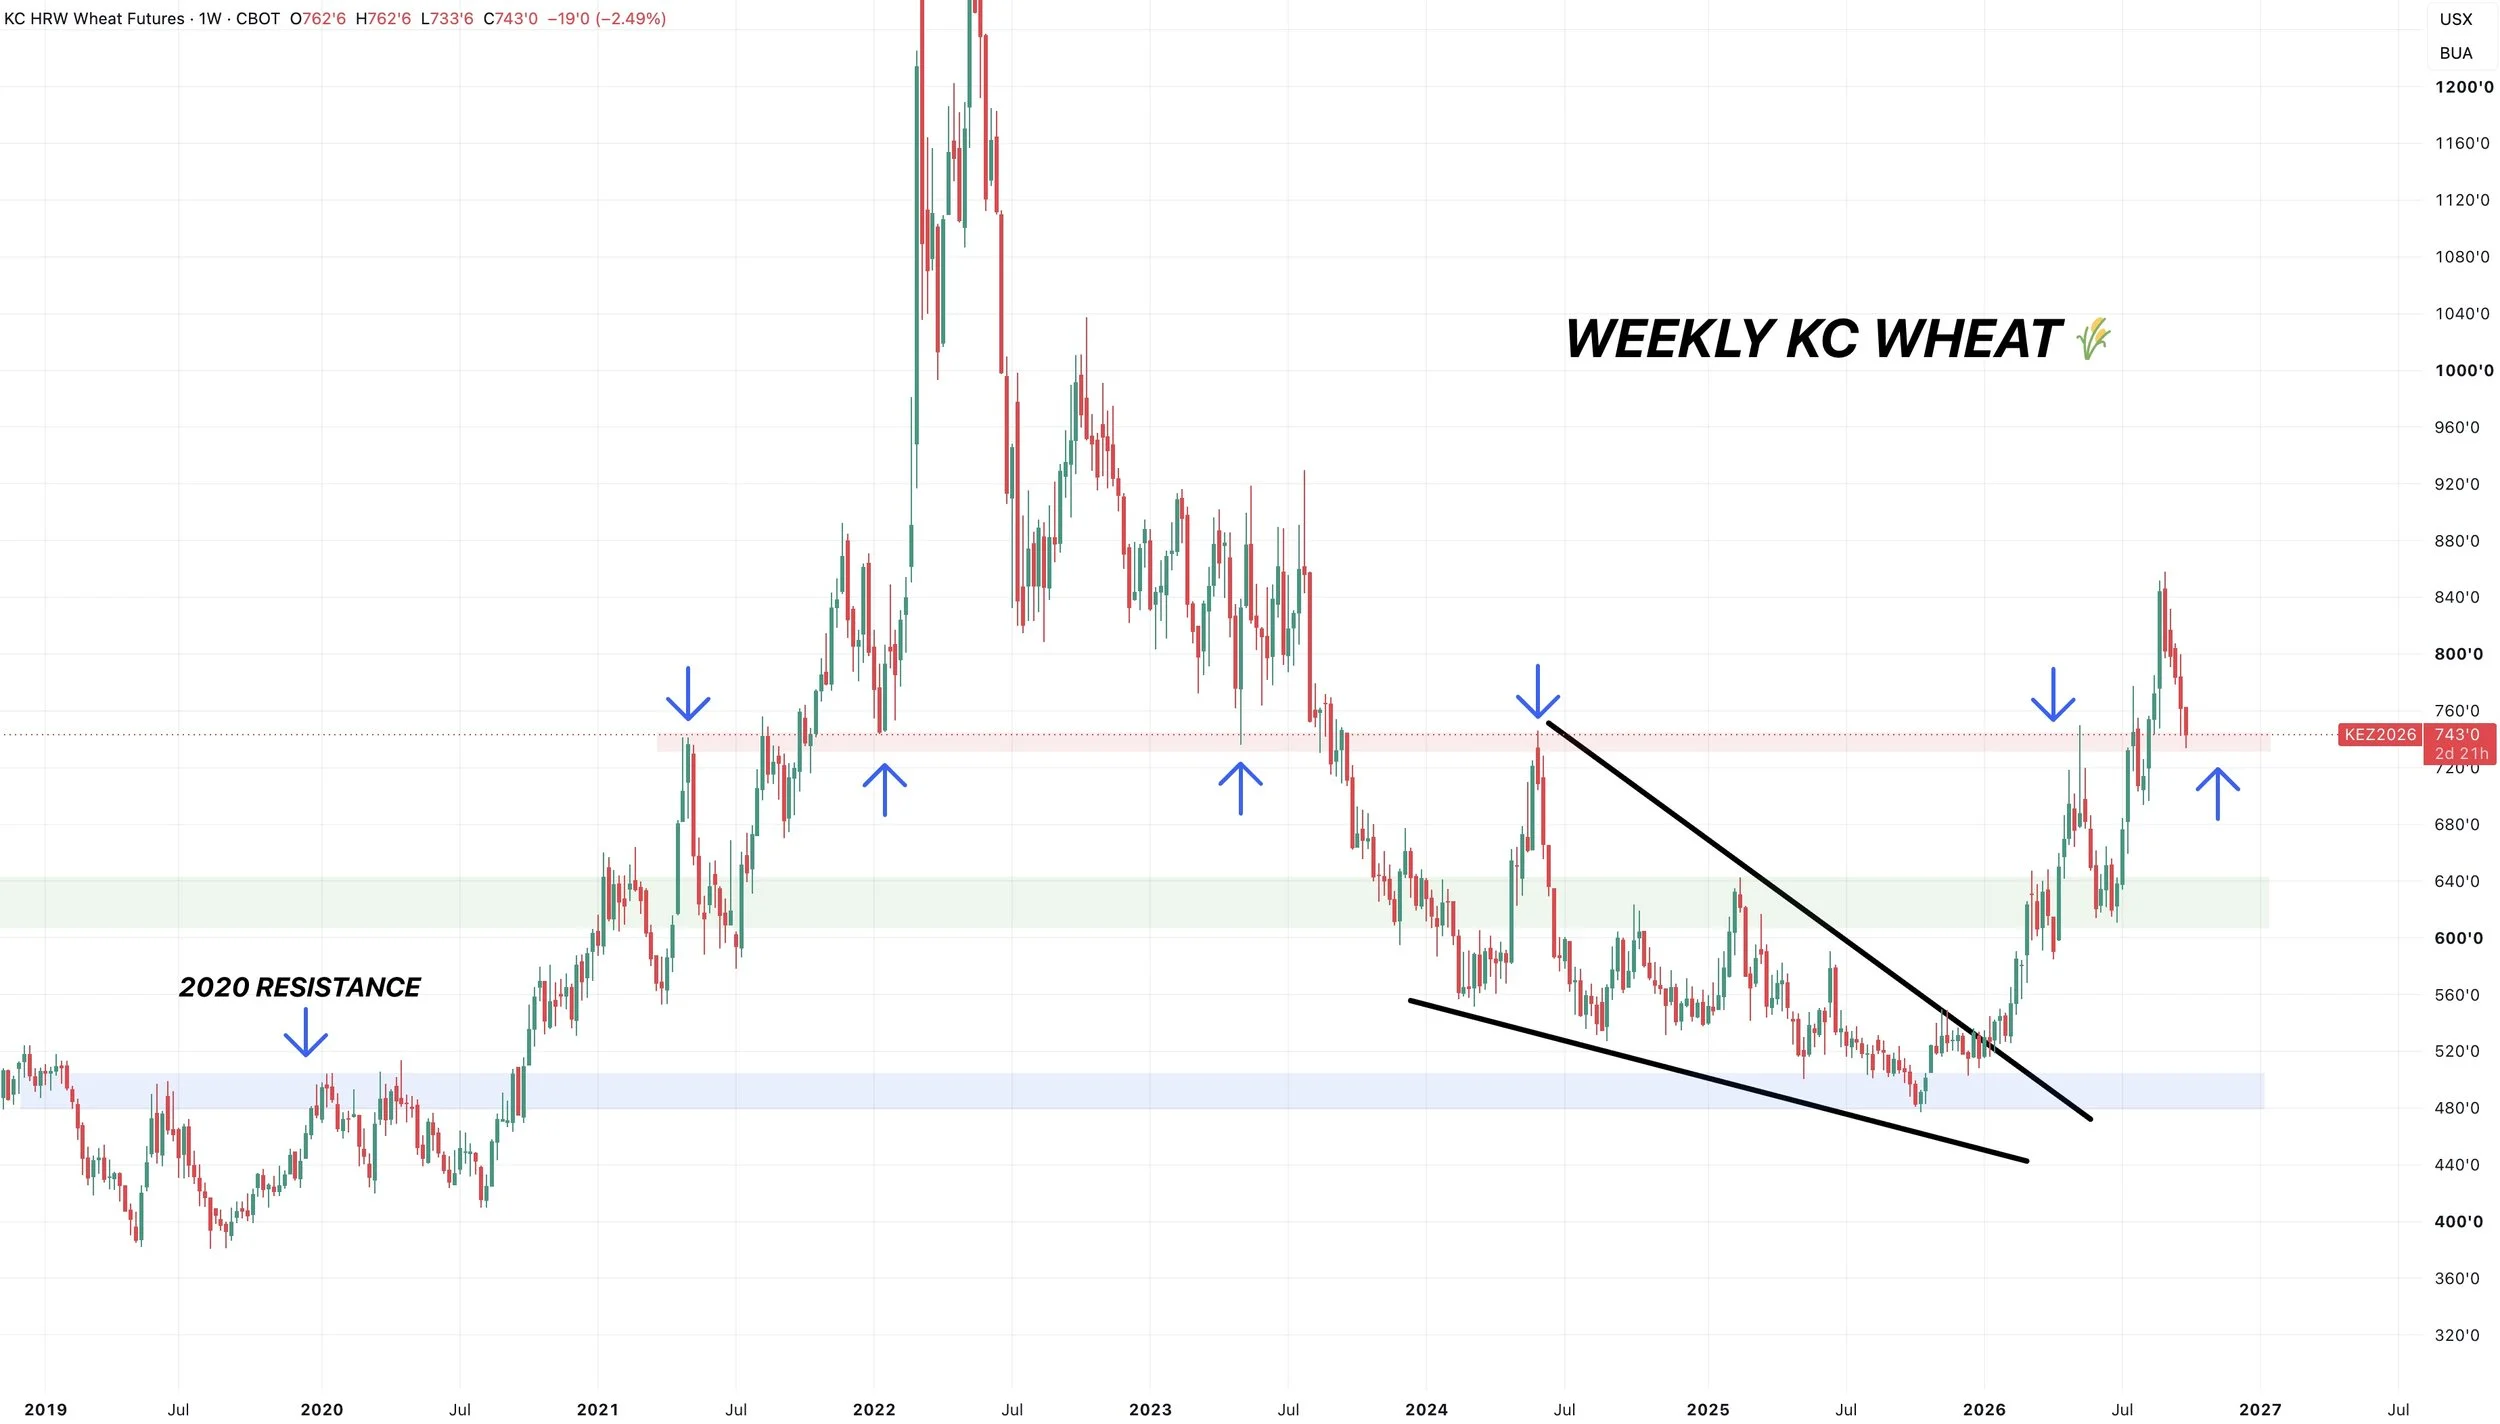
Here is another reason I'm not yet concerned with wheat here.
If you look at the weekly chart, this looks like a simple re-test of old resistance.
This level we are testing right now has been a major pivot in the past for wheat.
As it has marked both the highs and the lows in several separate years.
We broke through earlier this year, now we are re-testing it.
Major sell offs are not uncommon in wheat. Even in bull markets.
The last bull market featured several $1.00 to $1.50 sell offs before heading higher.
Cattle
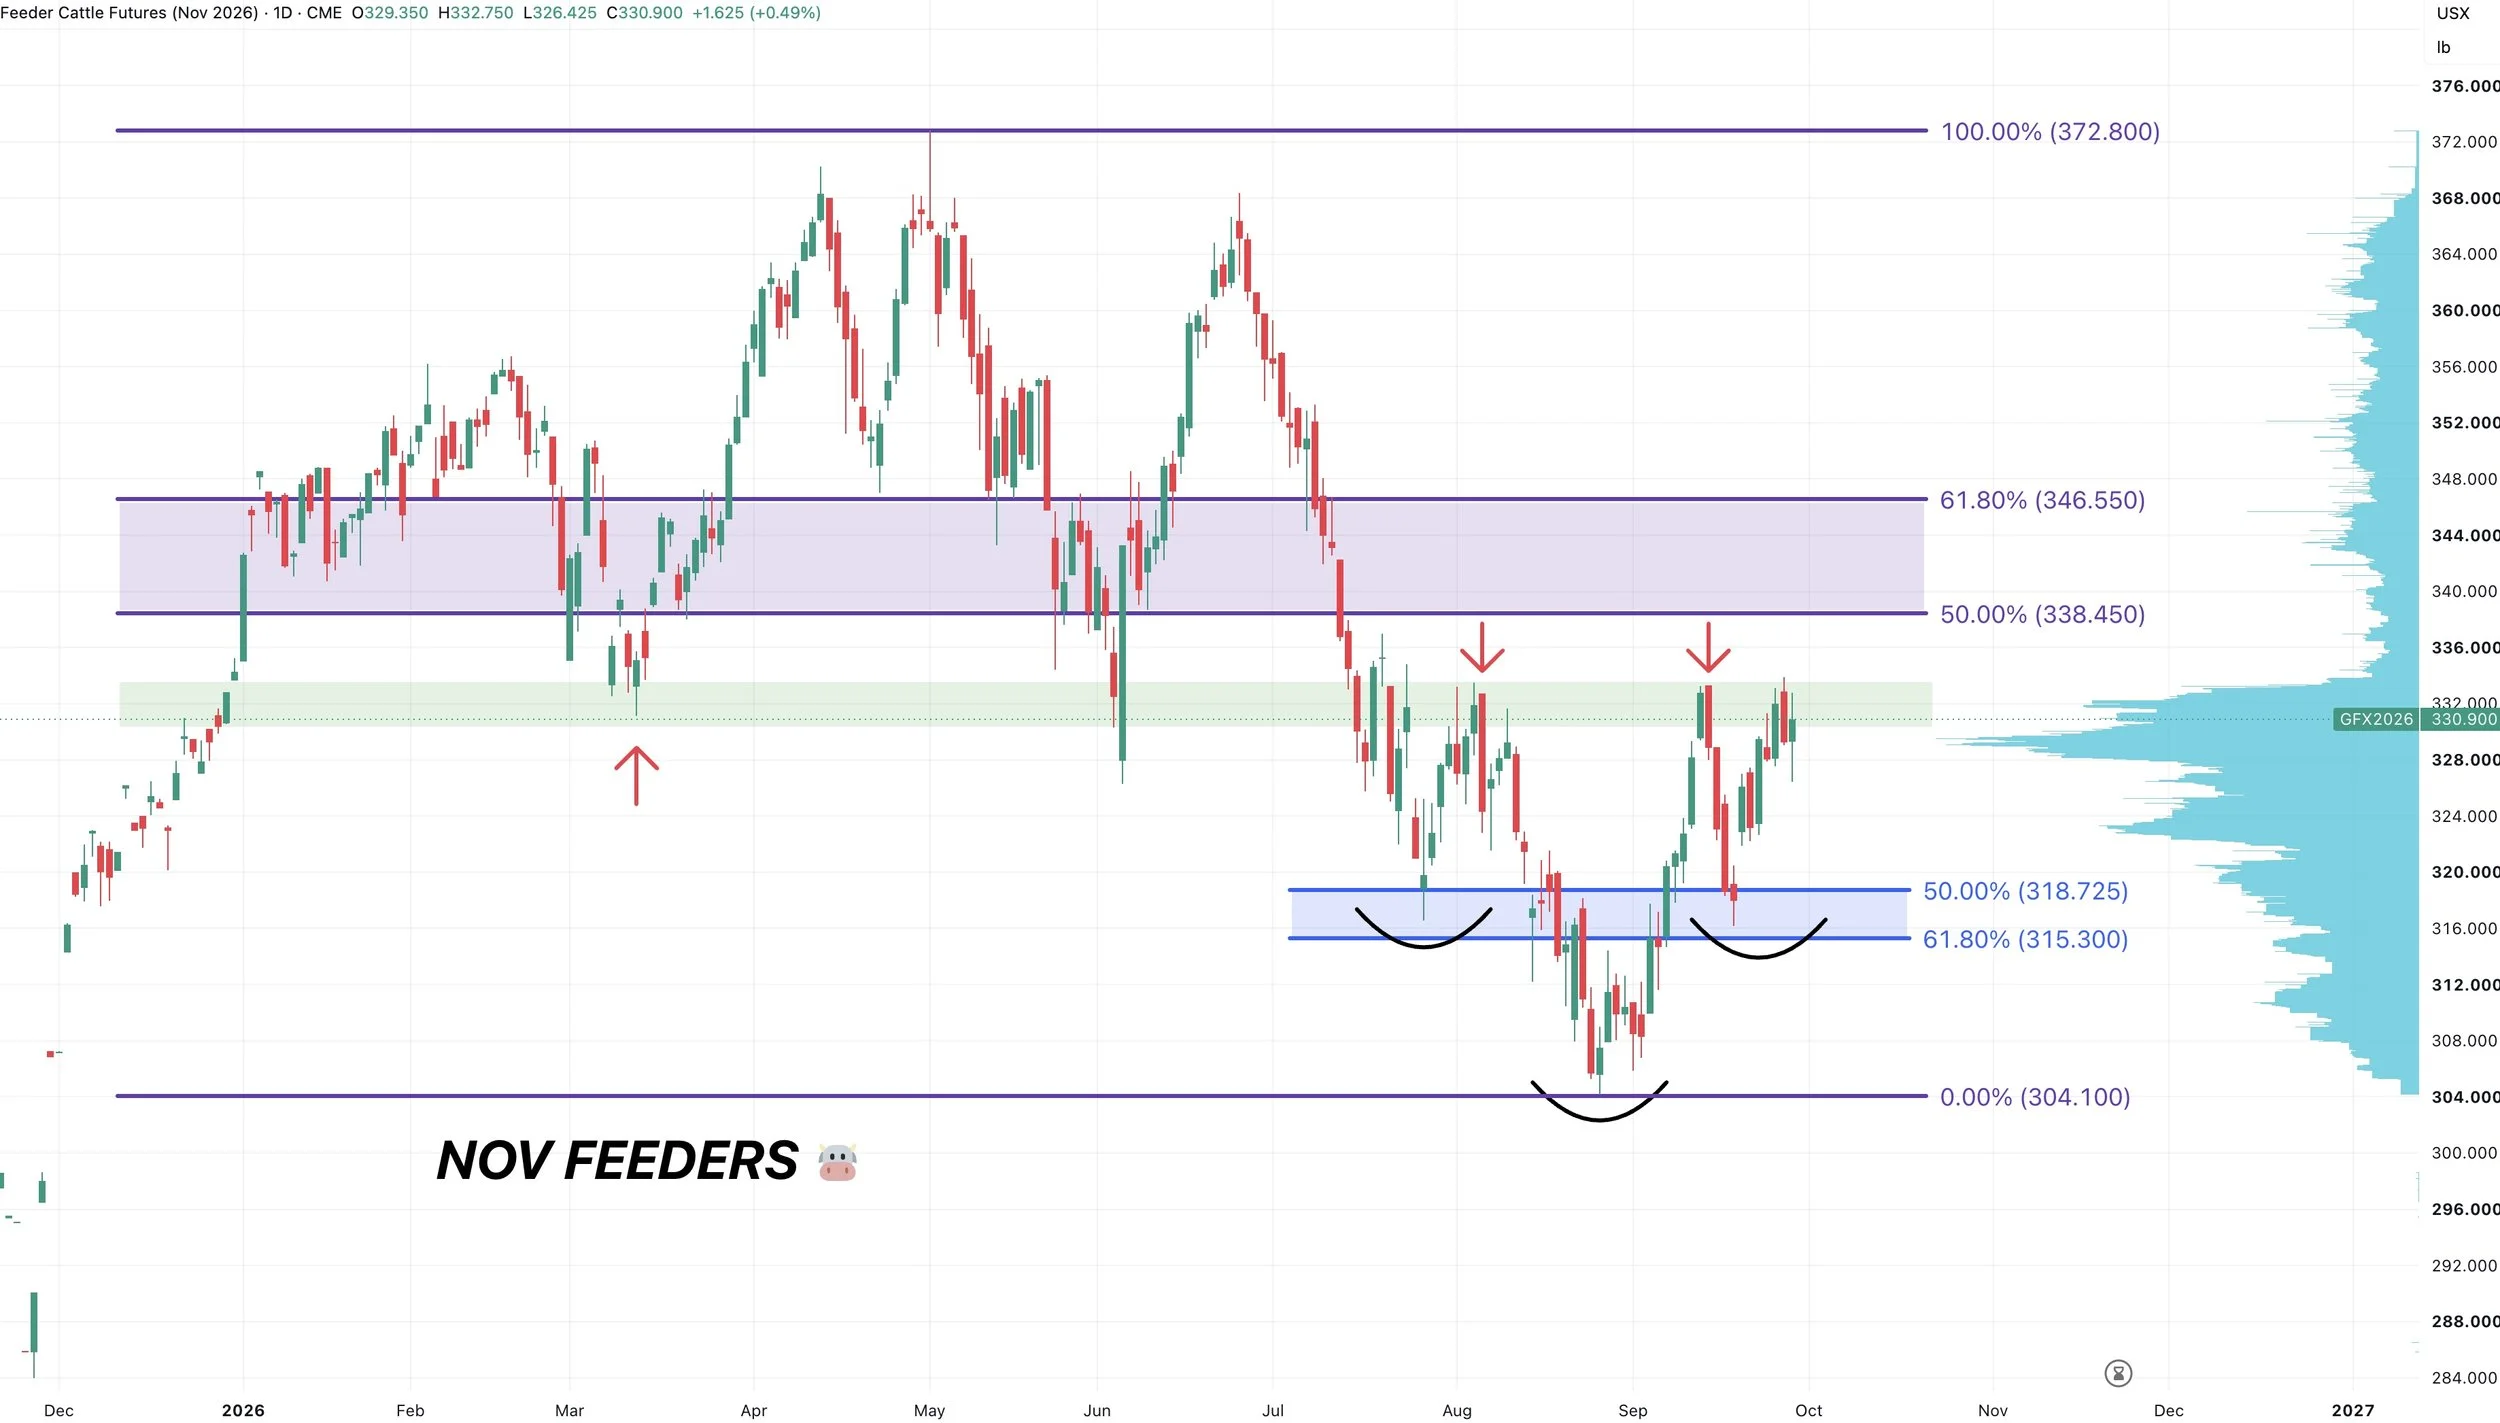
Nov Feeders Chart:
Not much to update here.
We held exactly where we needed to the other week in the golden zone.
We have this possible inverse head and shoulders pattern. Which is a common reversal pattern.
But we're running into clear resistance that we need to break above. This area was the lows from March, the highs from August, and the highs from a few weeks ago.
If you are able to break above this recent highs, it should spark the next leg higher.
If we can do that, I'd be looking to de-risk in that golden zone up to the April highs. But first we need to break through resistance.
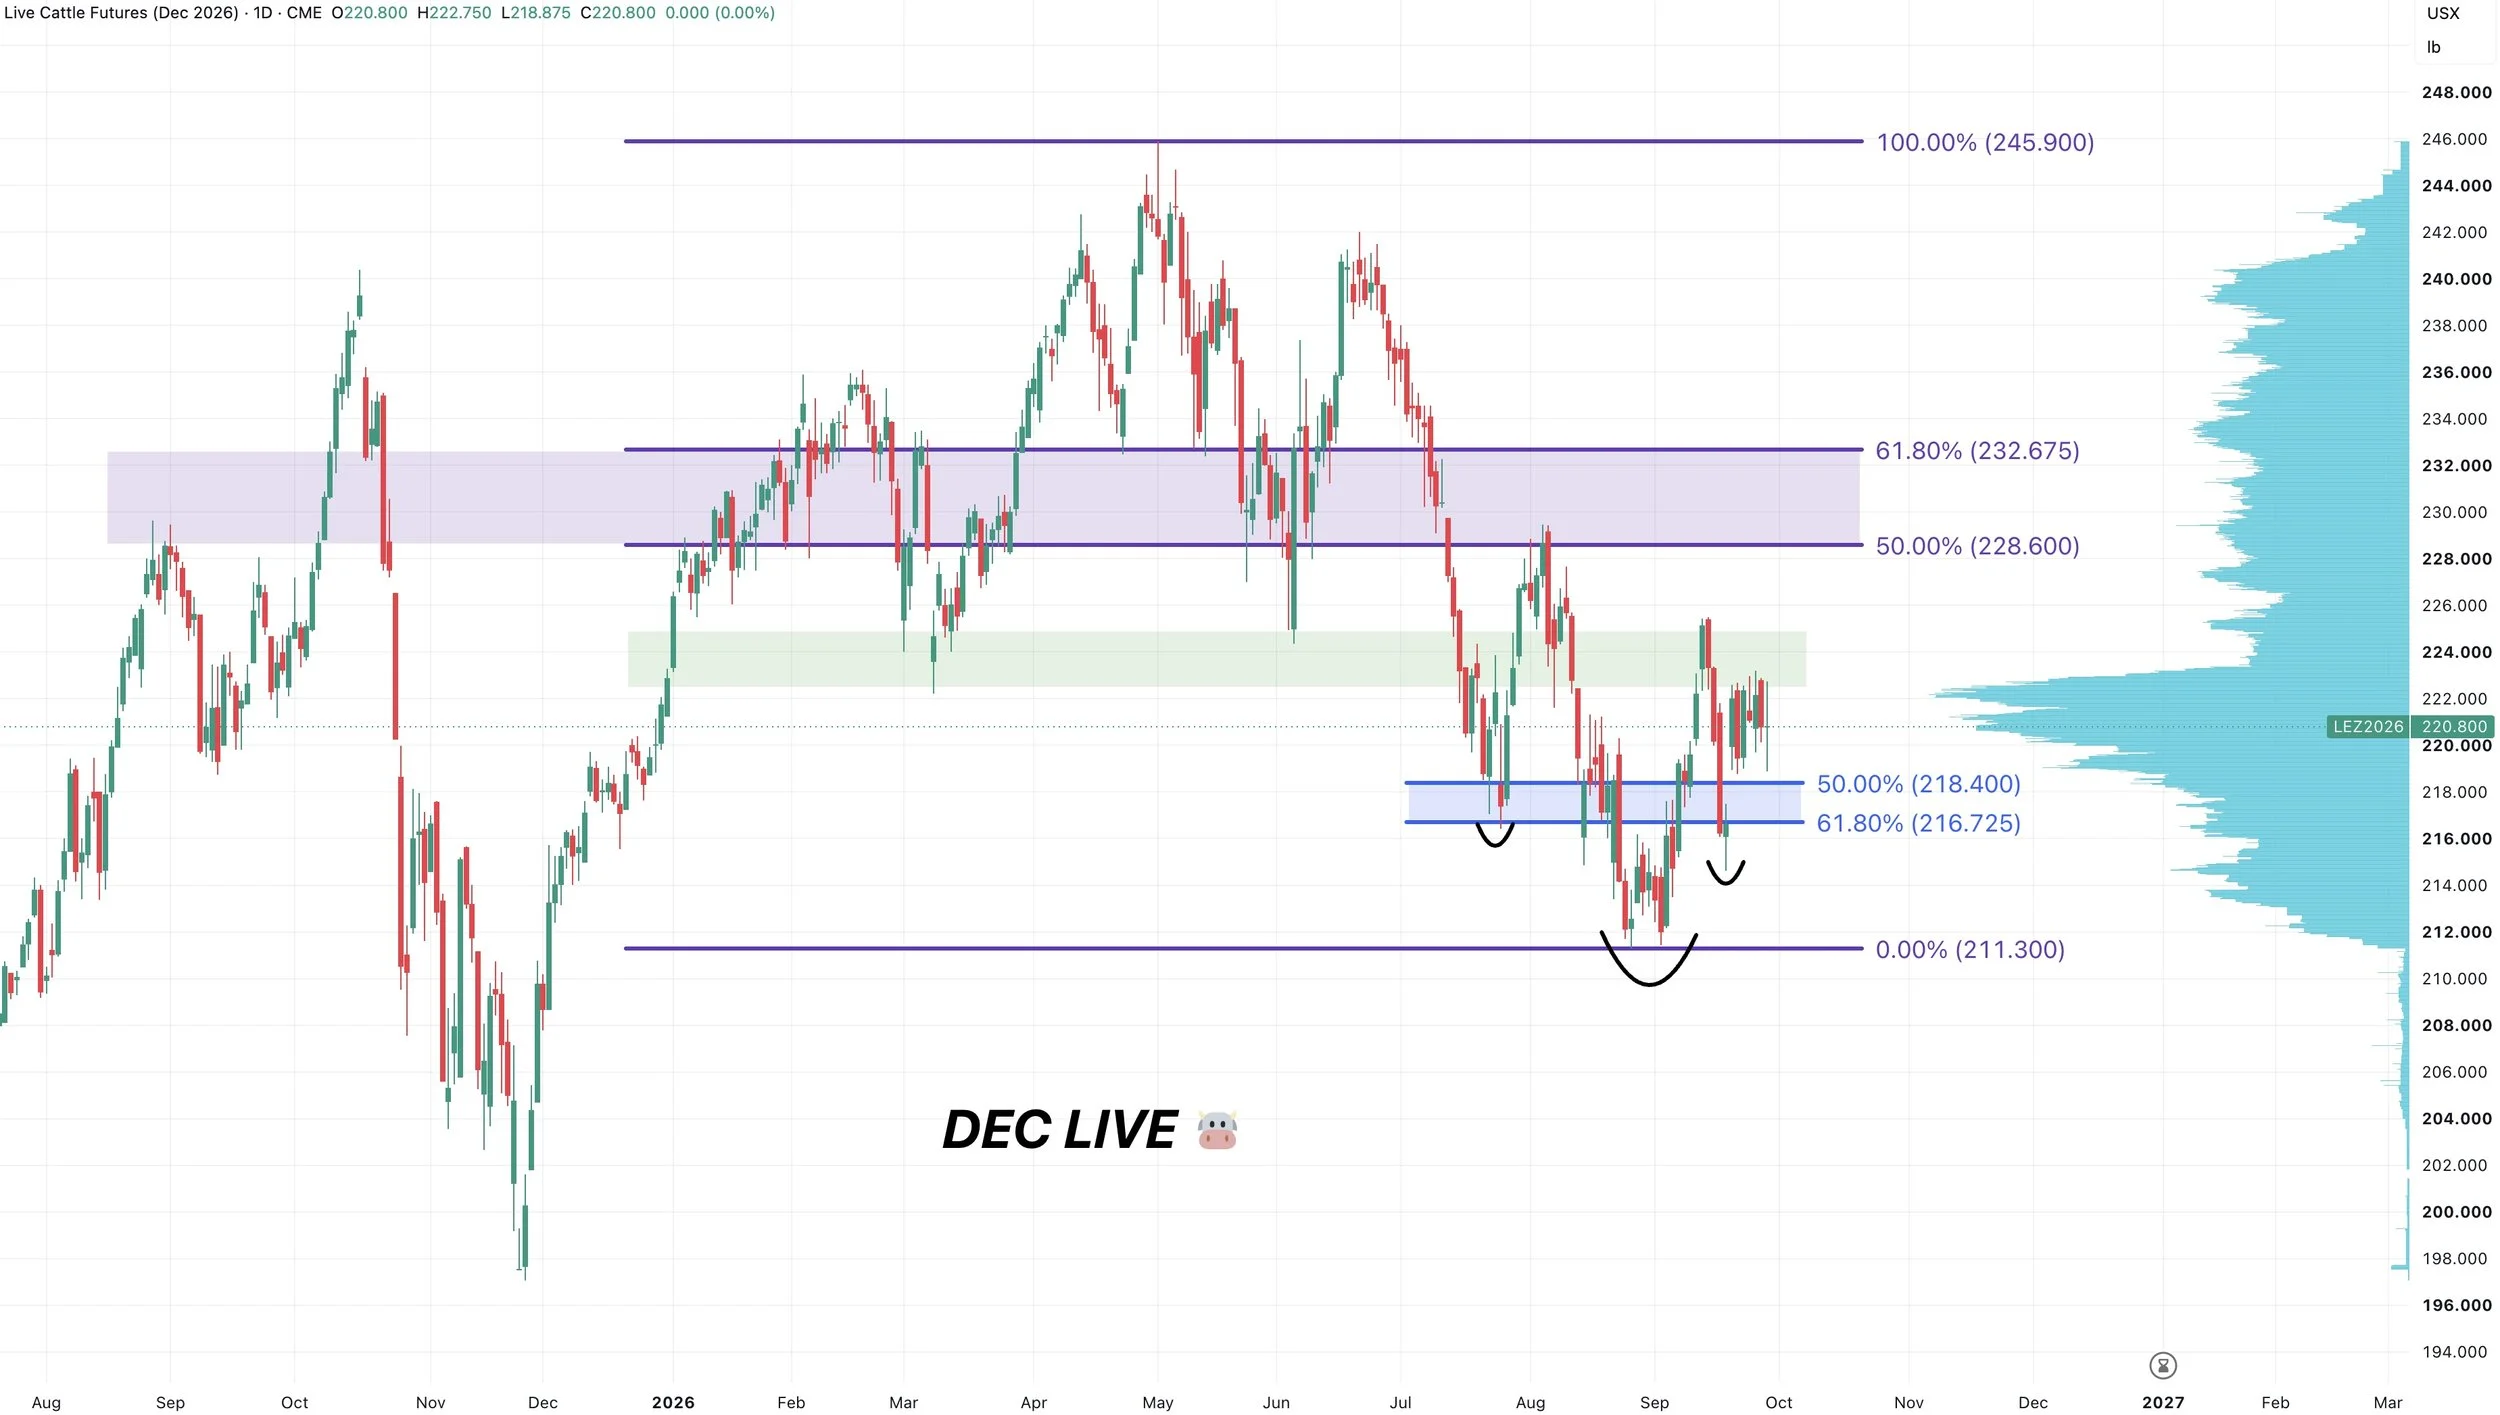
Dec Live Chart:
Pretty similar set up here.
We held where we needed.
We have an inverse head and shoulders pattern.
But now up against resistance that we need to break before getting too excited.
Want to Talk?
Our phones are open 24/7 for you guys if you ever need anything or want to discuss your operation.
Jeremey & Office: (806)484-1214
Sebastian: (605)280-1186
Email: sfrost@dailymarketminute.com
Hedge Account
Interested in a hedge account? Use the link below to set up an account or give us a call.