
USDA STUNS CORN MARKET
MARKET UPDATE
You can scroll to read the usual update as well. As the written version is the exact same as the video.
Timestamps for video:
USDA: 0:00min
Corn Charts: 9:45min
Bean Charts: 13:00min
Wheat Charts: 15:00min
Cattle Charts: 16:30min
Want to talk?
Office: (806)484-1214
Futures Prices Close
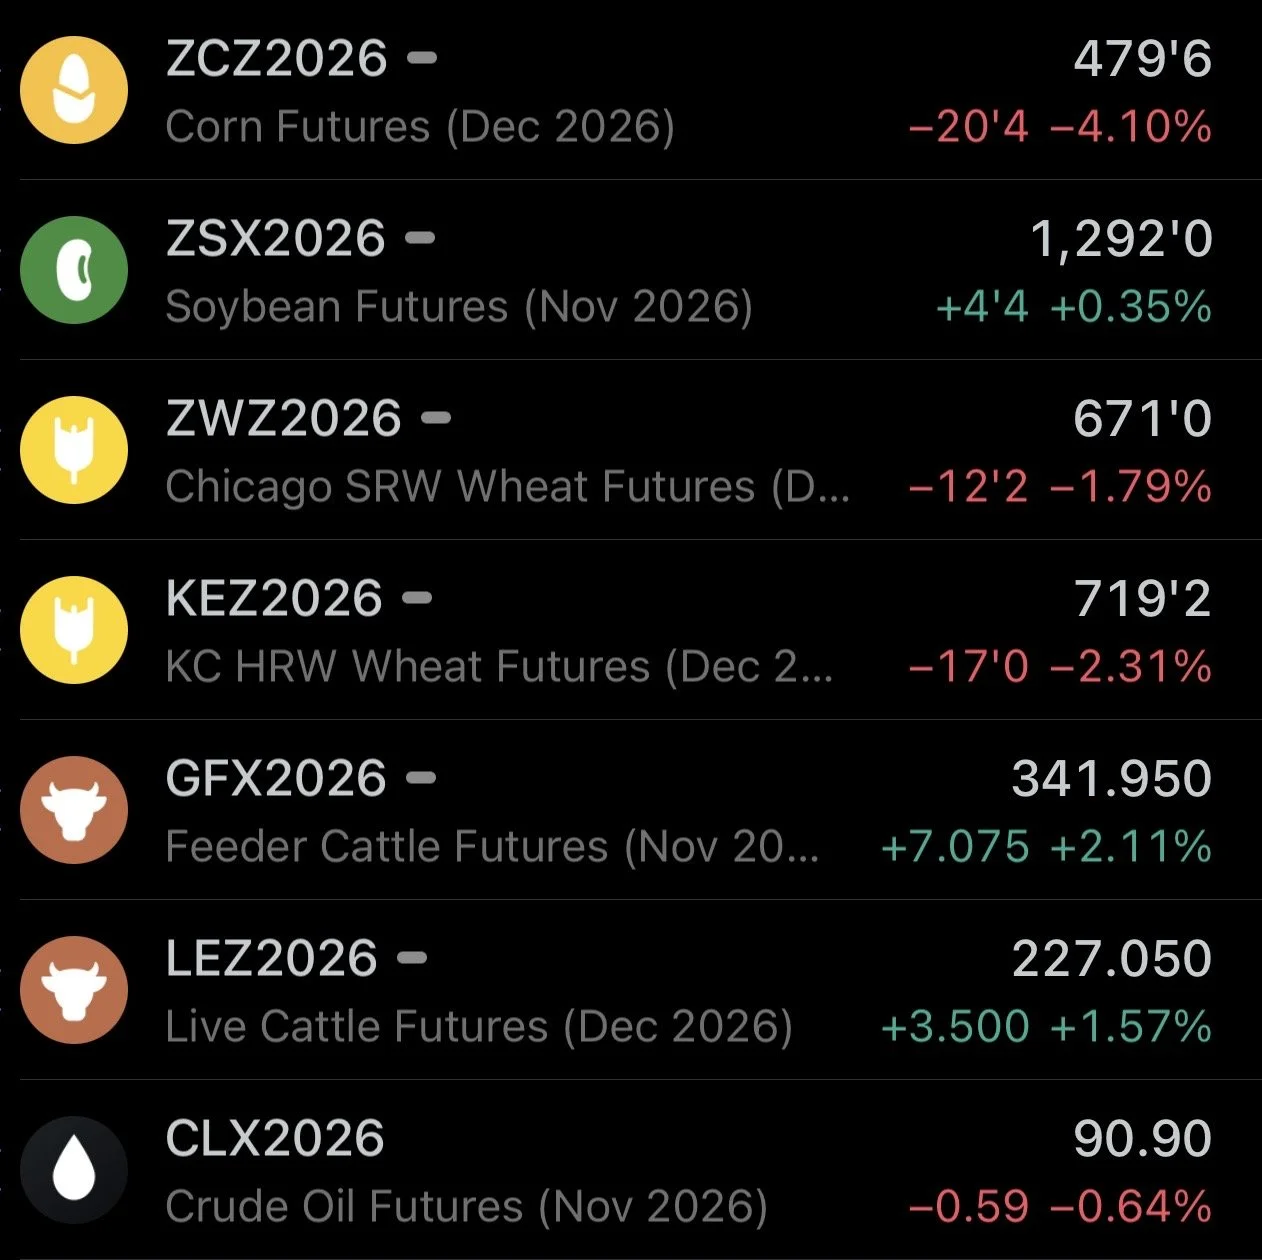
Overview
Corn and wheat smoked on USDA report day today.
The USDA completely shocked the corn market for the 2nd time in two weeks.
Corn traded limit down at one point today.
This would be the first limit move in the corn market since March 2022.
Although corn did close +10 cents off it's lows, and soybeans ended the day in the green after being down -18 cents after the report came out.
Let's get right into the report.
USDA Recap
We'll start with wheat and soybeans first, as they saw less drastic of changes.
Wheat:
Wheat didn’t have a super bearish report despite the negative price action, but was pulled lower with corn.
US carryout came in a little higher than the trade and vs last month.
But the world numbers came in a little lower. The USDA cut some Russia shipments.

Soybeans:
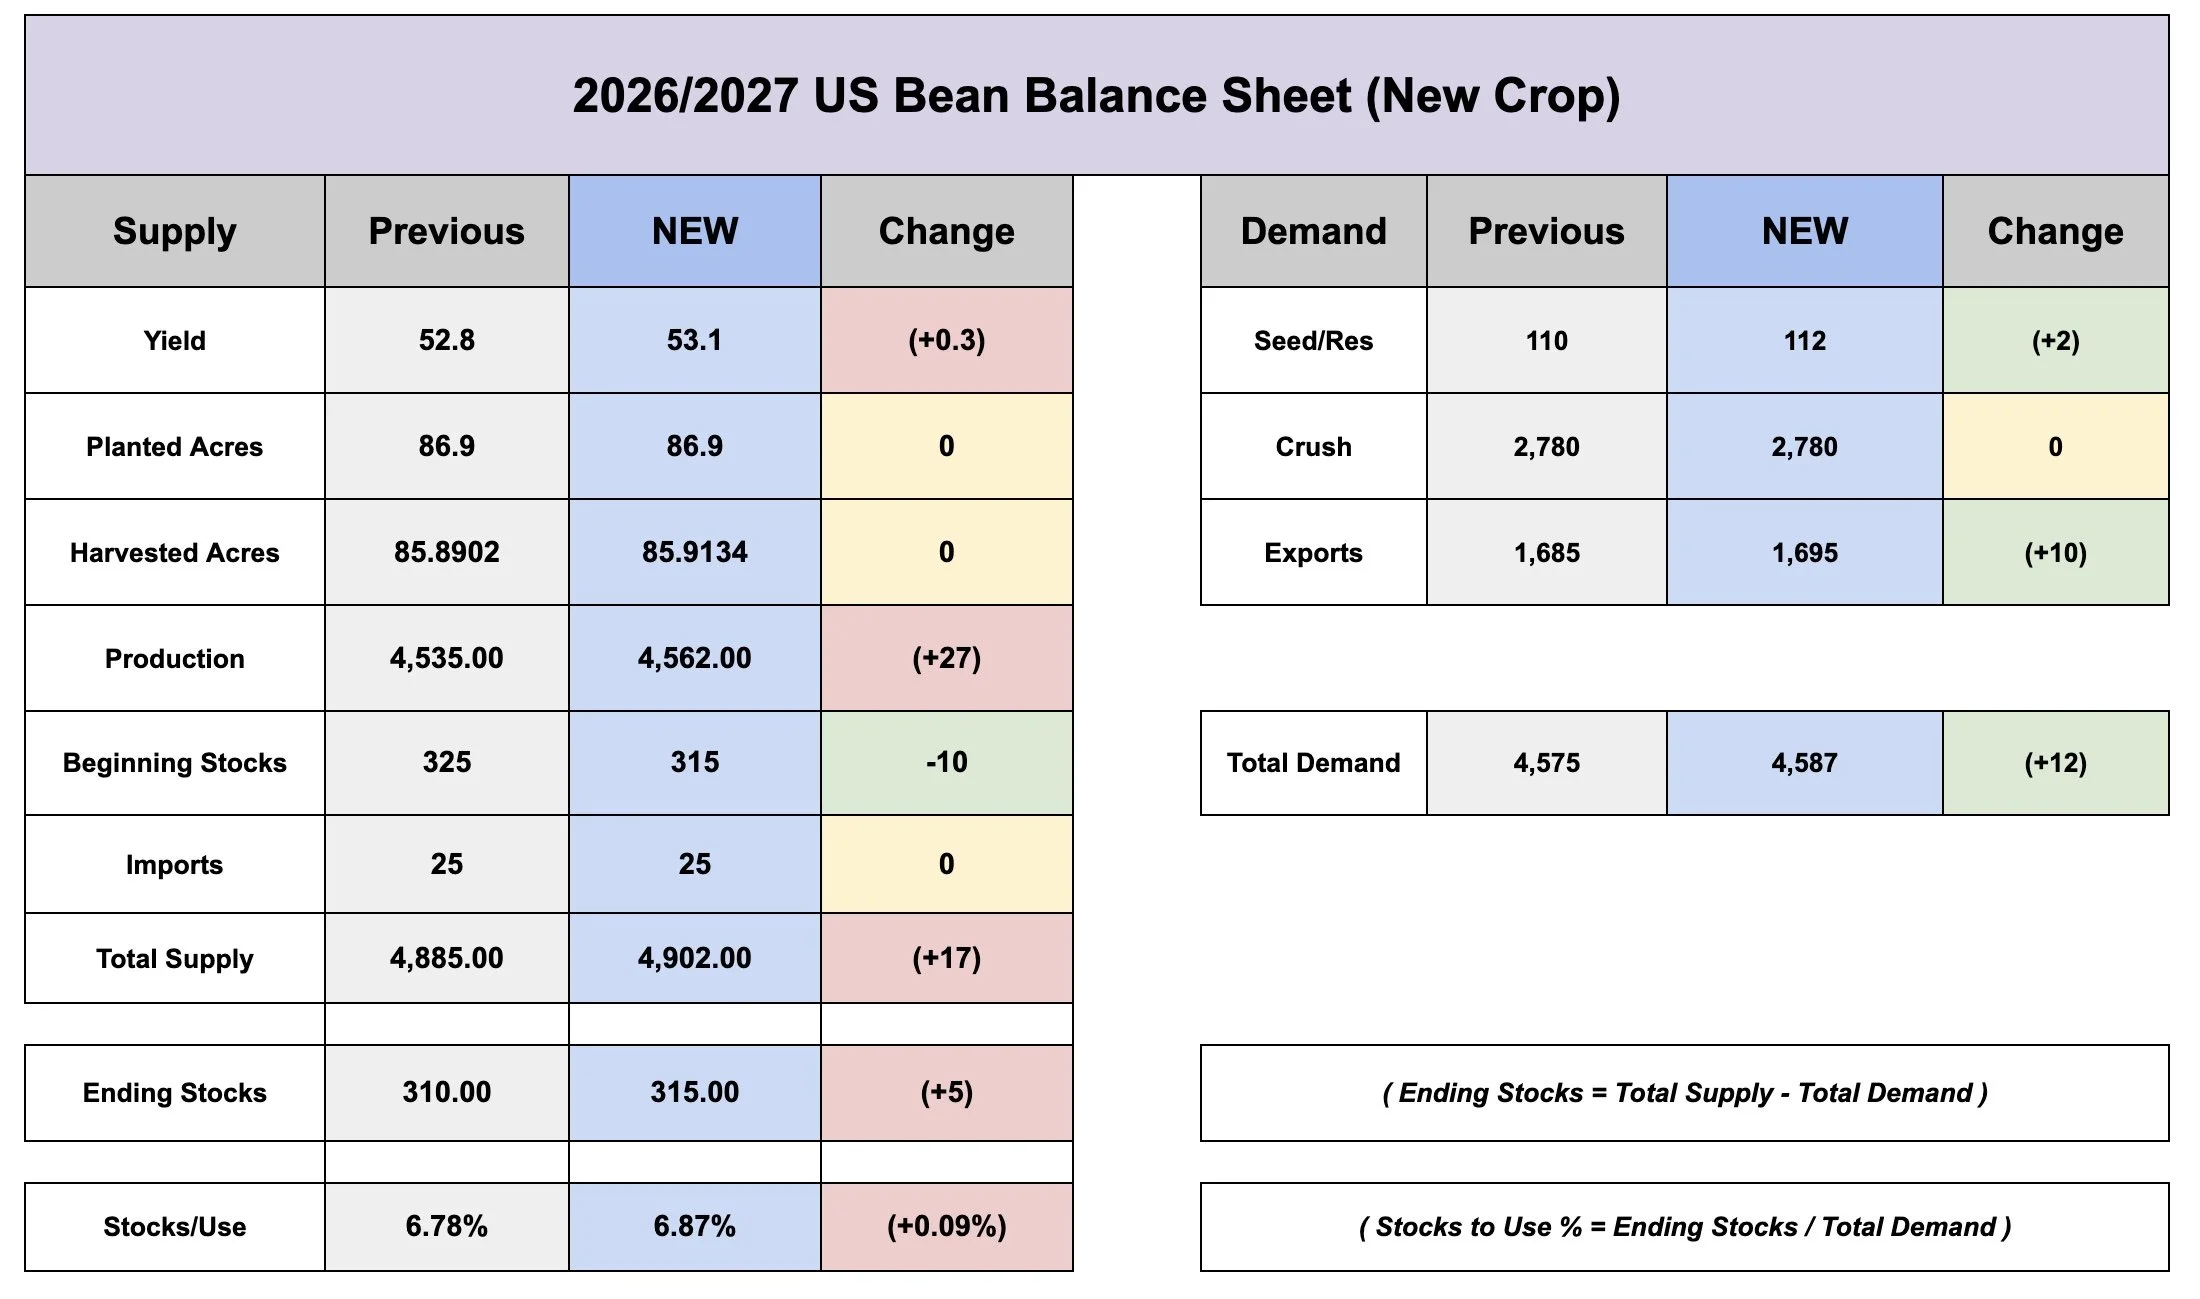
The report was slightly negative for soybeans but obviously not to the extent as it was for corn.
The USDA raised yield by 0.3 bpa from 52.8 up to 53.1 bpa.
Carryout came in at 315 million bu. Which was 5 million higher than last months 310 million and 10 million above the trade estimate of 305 million.
The world balance sheet was expected to get a little smaller but instead slightly increased but not drastically.

Here is what the USDA actually did to the soybean balance sheet.
We had 10 million less beginning stocks we already knew about.
The USDA then bumped yield which rose production almost +30 million.
At the same time they bumped demand by +12 million.
So the net result was a very minor +5 million to the carryout. Altough the trade was expecting it to be -5 million lighter instead.
Corn:
Now for corn. Shocked would be an understatement.
The USDA completely shocked the market once again.
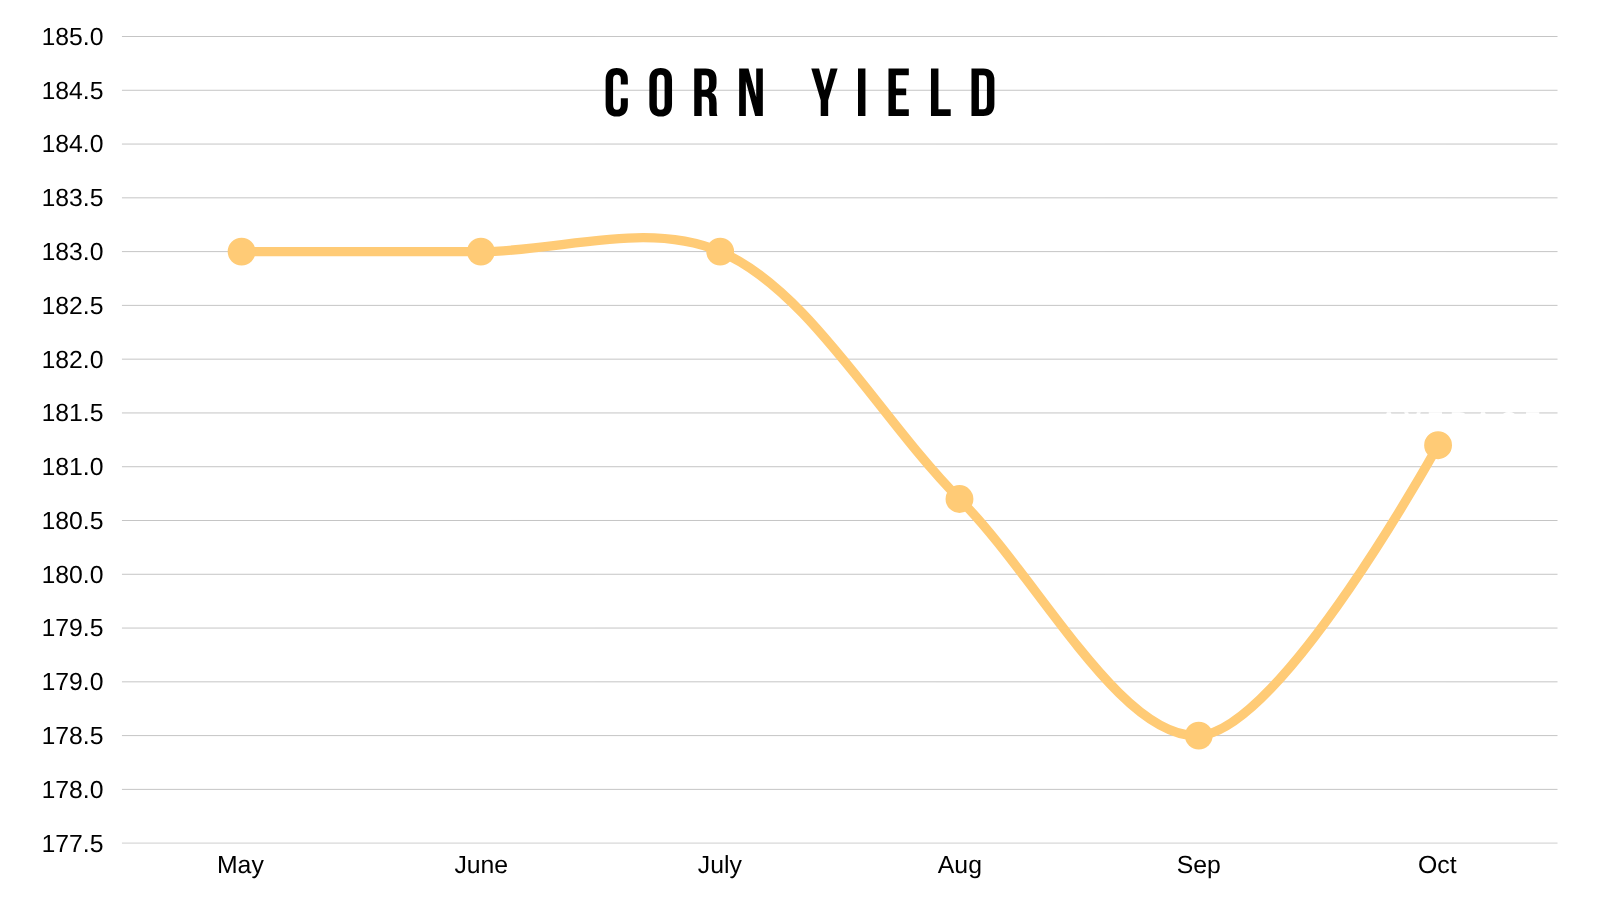
The USDA somehow raised yield by +2.7 bpa. From 178.5 up to 181.2 bpa.
Clearly that was way above the trade estimates. As that was the highest estimate out of every number.
As a result our carryout came in nearly +200 million more than the trade was expecting. The trade was guessing a +100 million increase but it increased by nearly +300 million. Which is a massive increase.
With the bigger US crop, the world numbers of course surprised way high as well.

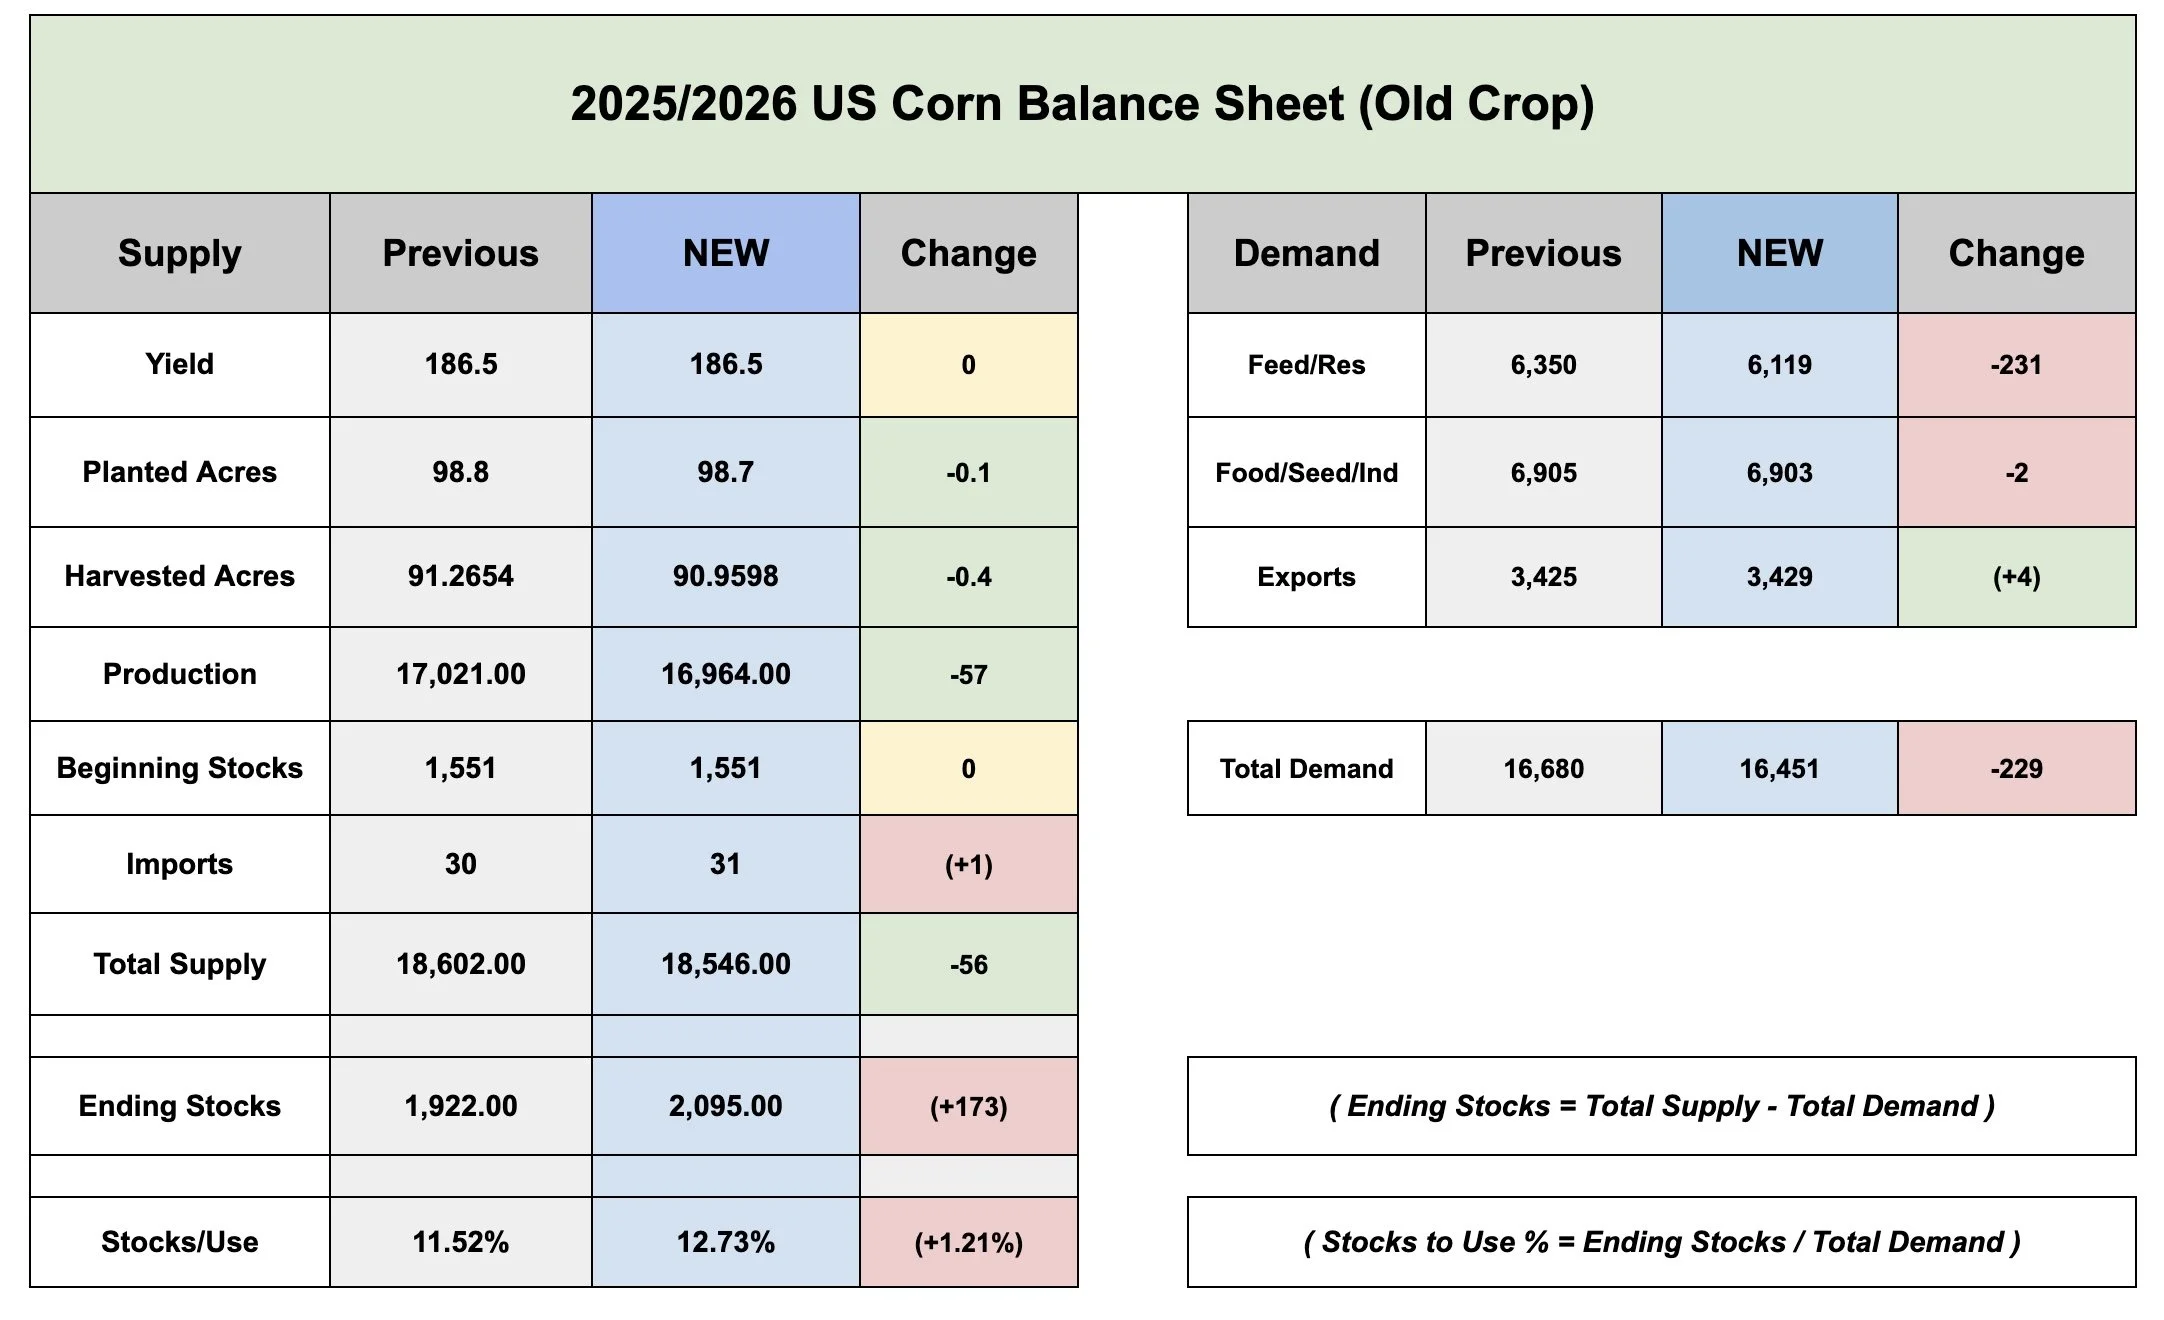
Here is what the USDA actually did to the balance sheet.
First for old crop, we knew they were going to be cutting the feed and resisual demand. Which they did.
They dropped it by -230 million. Some was offset by production losses.
A net result was an increase of +173 million on the old crop carryout.
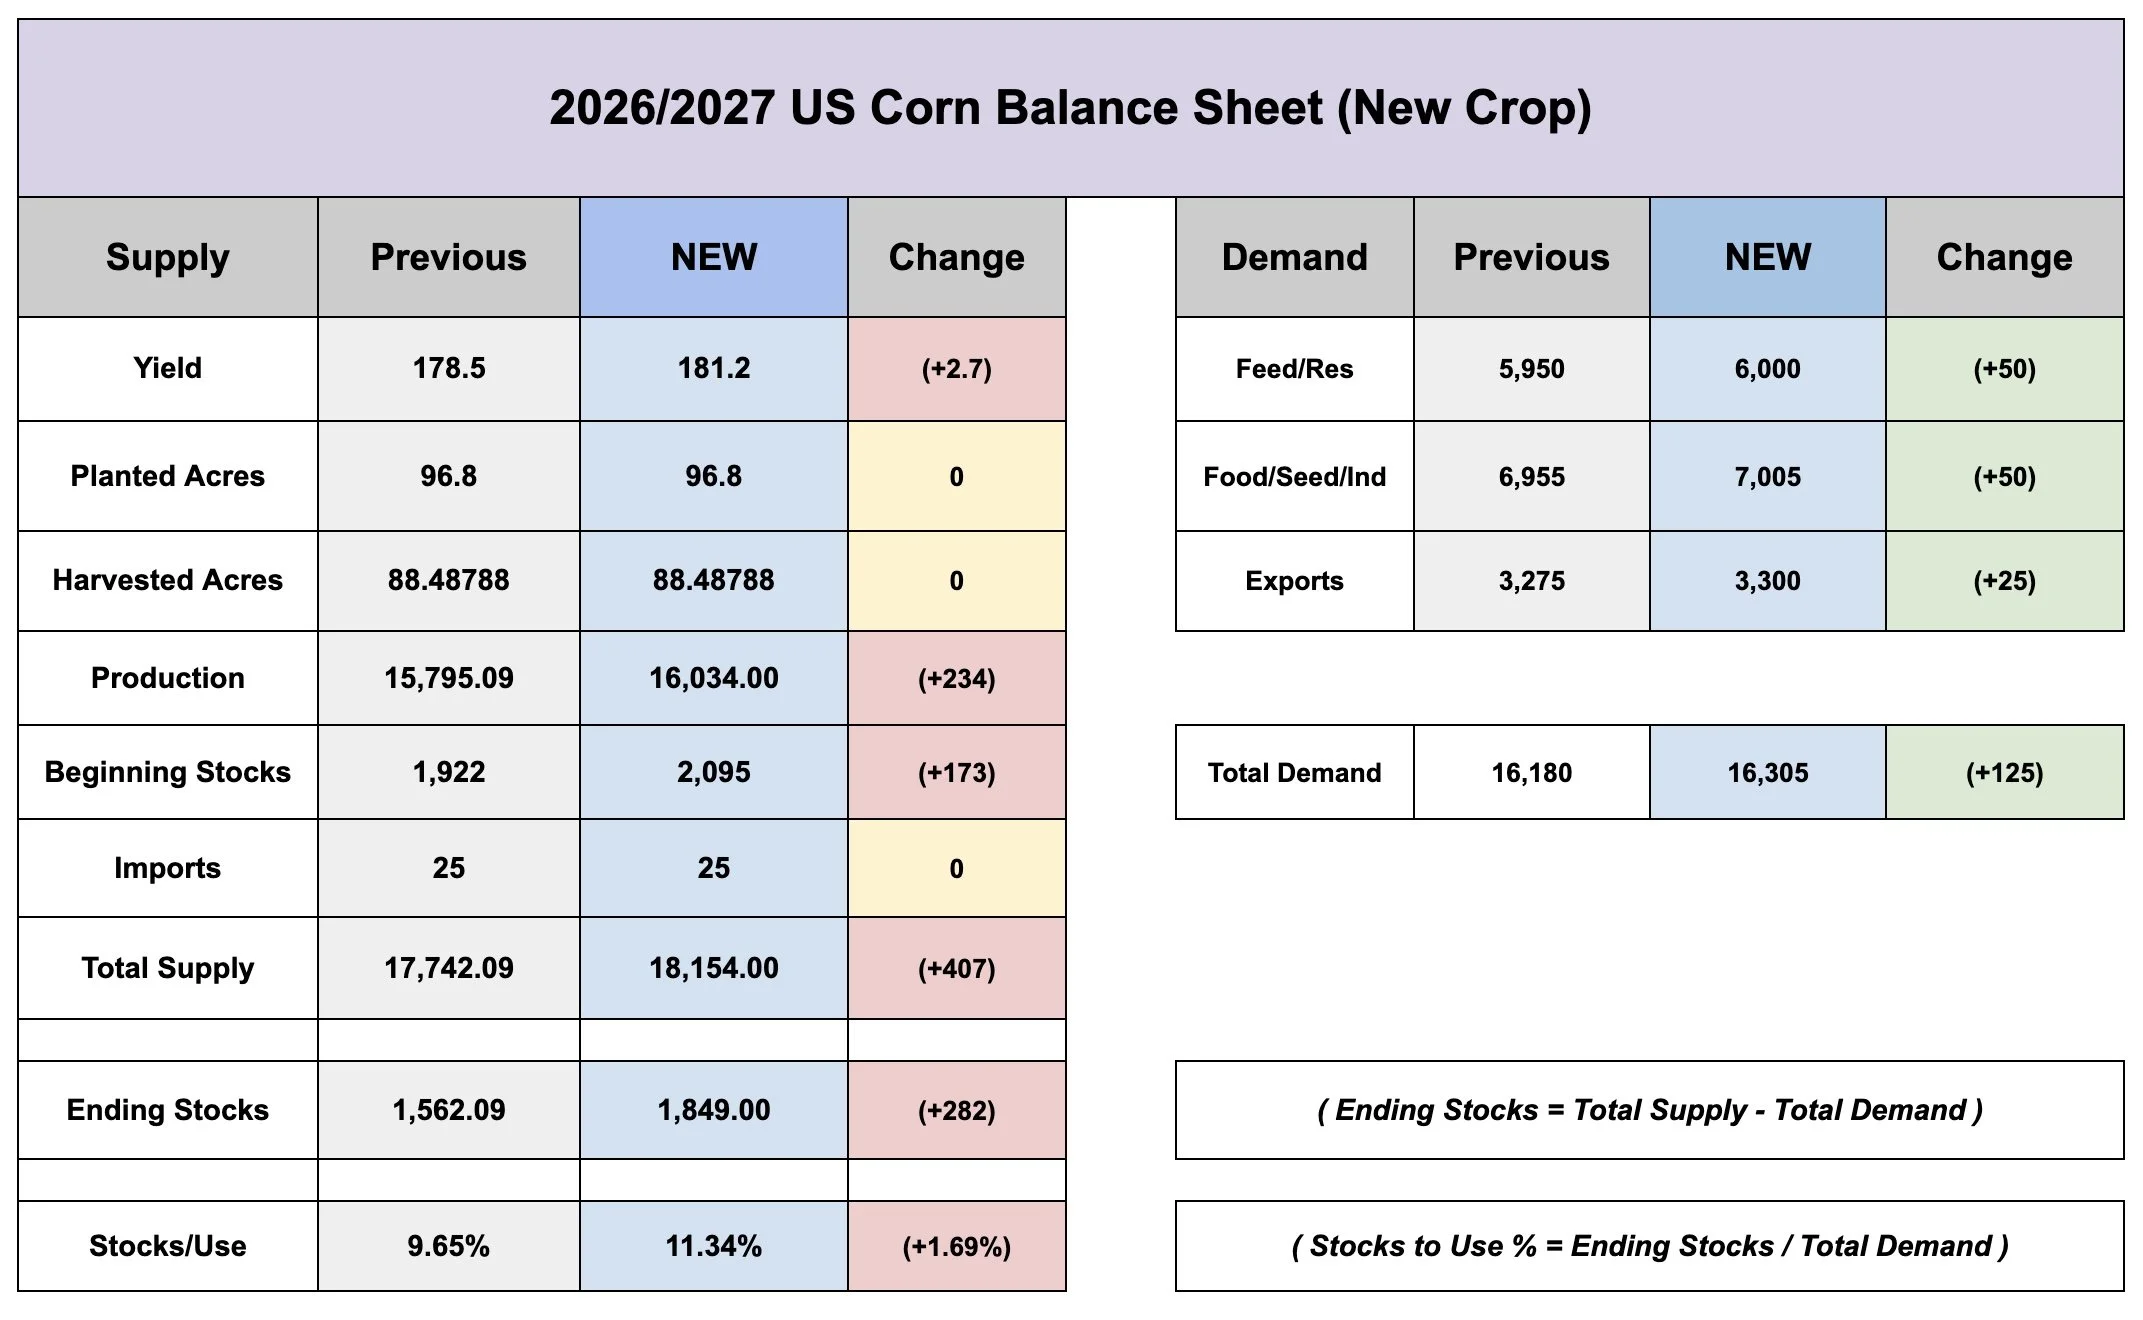
As for new crop.
We got the extra +173 million of old crop in the form of carry in and beginning stocks.
But then the USDA went ahead and bumped the yield by a massive amount. The increase in yield jumped our production by +230 million bu.
So with the extra beginning stocks and bump in yield, our total supply increased by +400 million. Which is a huge number.
The USDA then offset part of that 400 million with some increasees in demand. As they increased demand by +125 million.
The net result was our carryout increasing by +280 million vs last month.
Which brought our stocks to use ratio from 9.7% all the way up to 11.3%.
We needed a -2 bpa cut on yield to offset the extra old crop from the Sep stocks. Instead we got a near +3 bpa raise.
So it was a double whammy from the USDA. Not only did we get the extra old crop, but they made the new crop bigger.
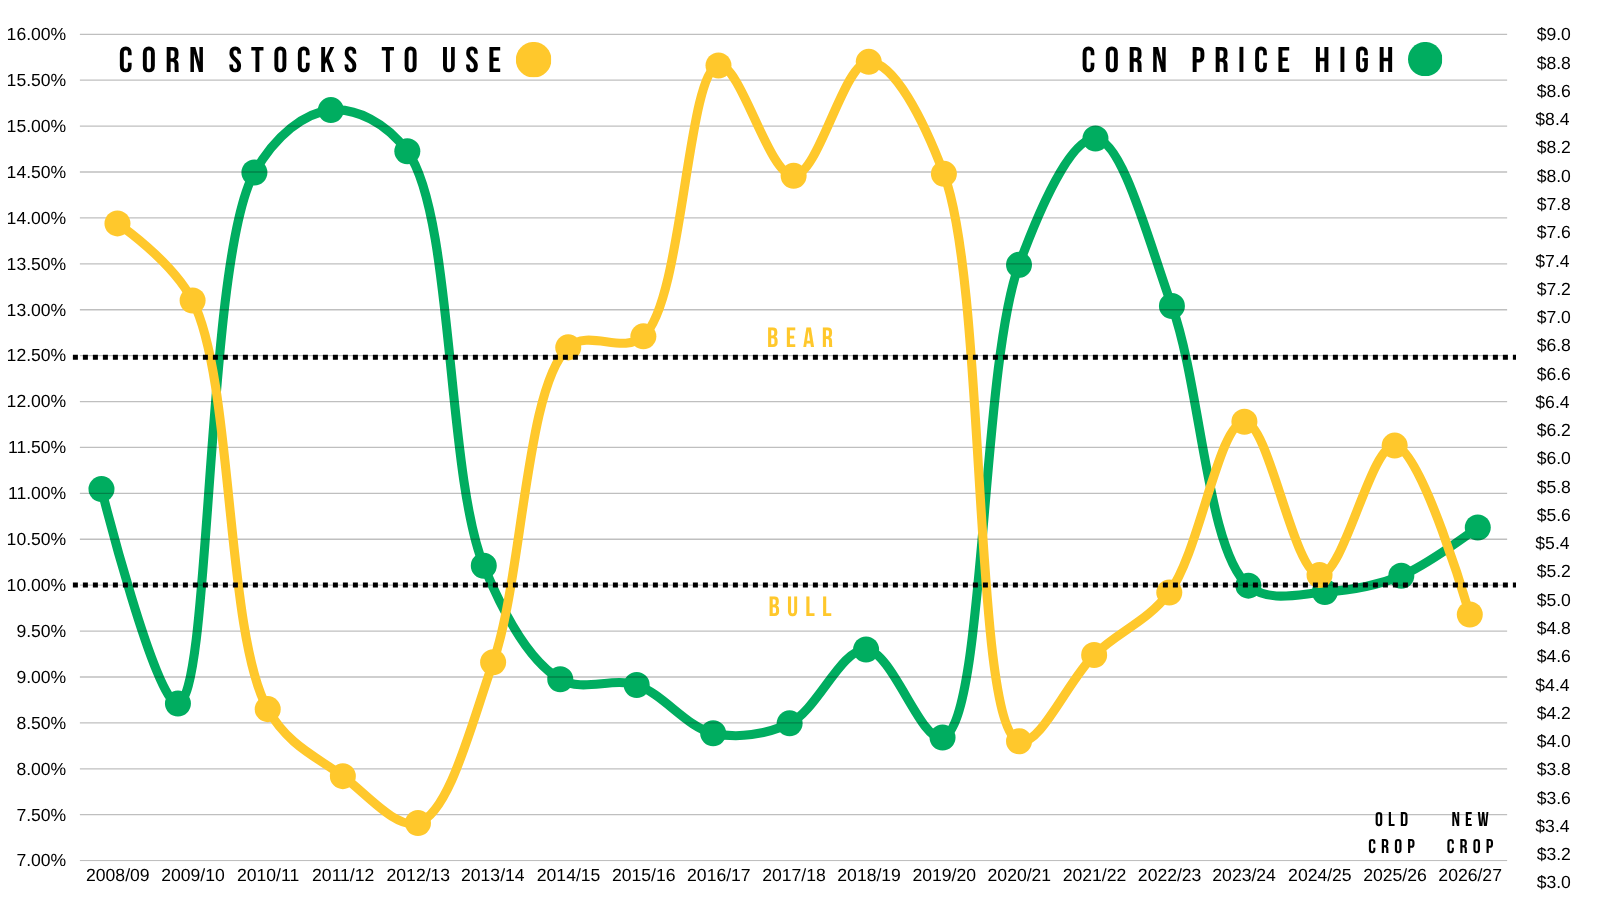
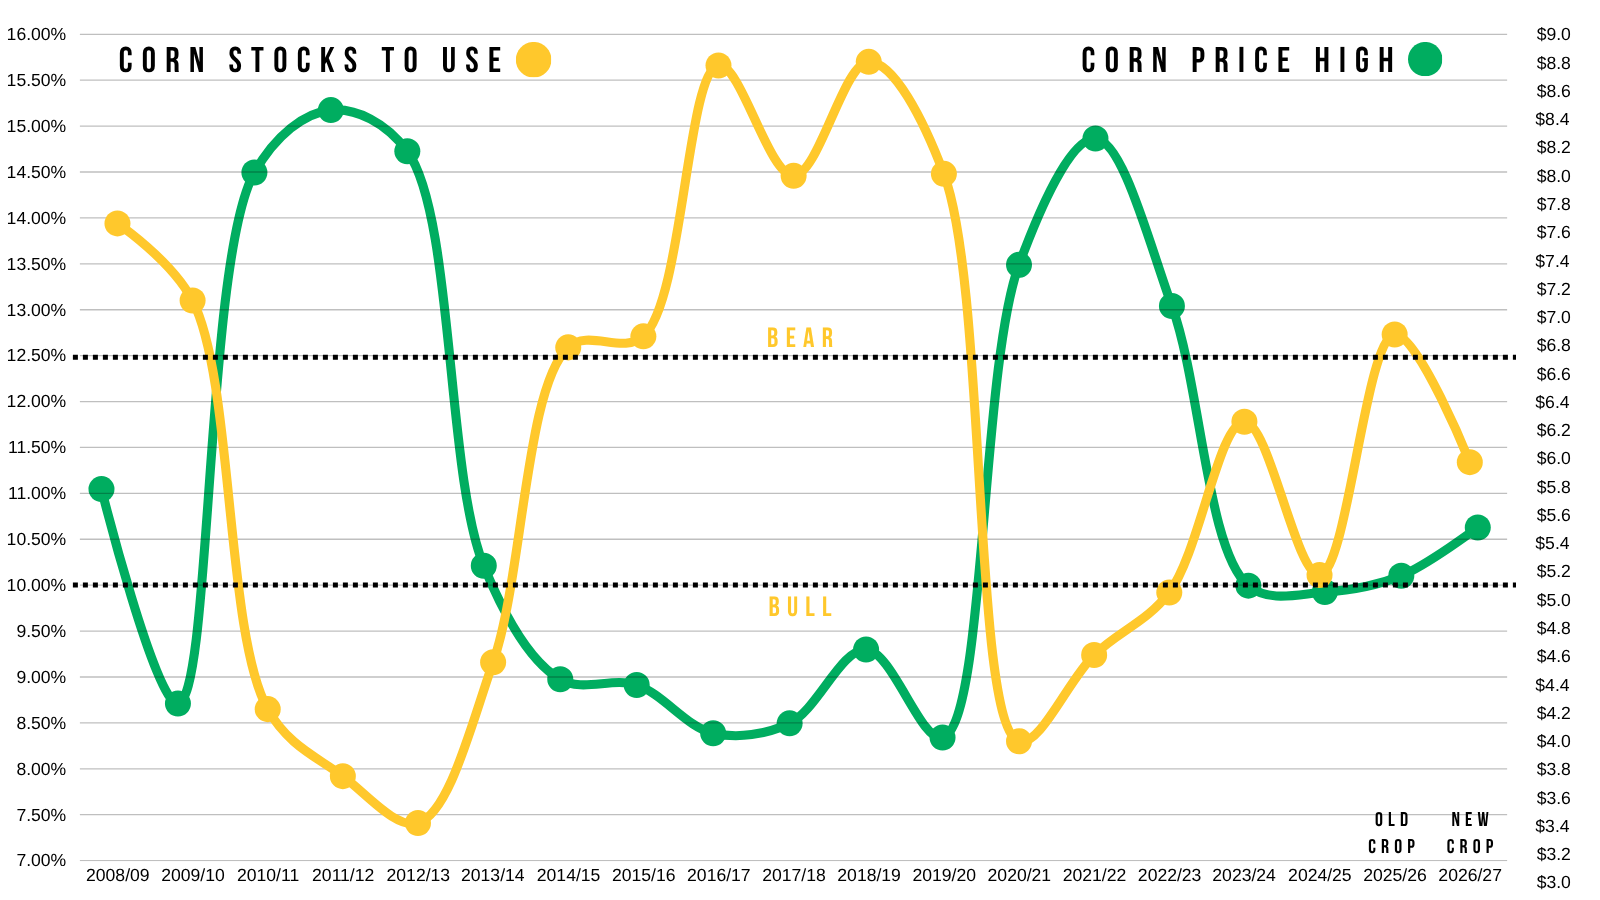
Here is the stocks to use ratio vs corn's highest price of the year.
Here is what it looked like before this report.
Corn was the tightest in the last several years.
Here is what it looks like after this report.
Old crop is now in in that full blown bear territory.
New crop is not even close to the bull territory anymore if this were verified and final.
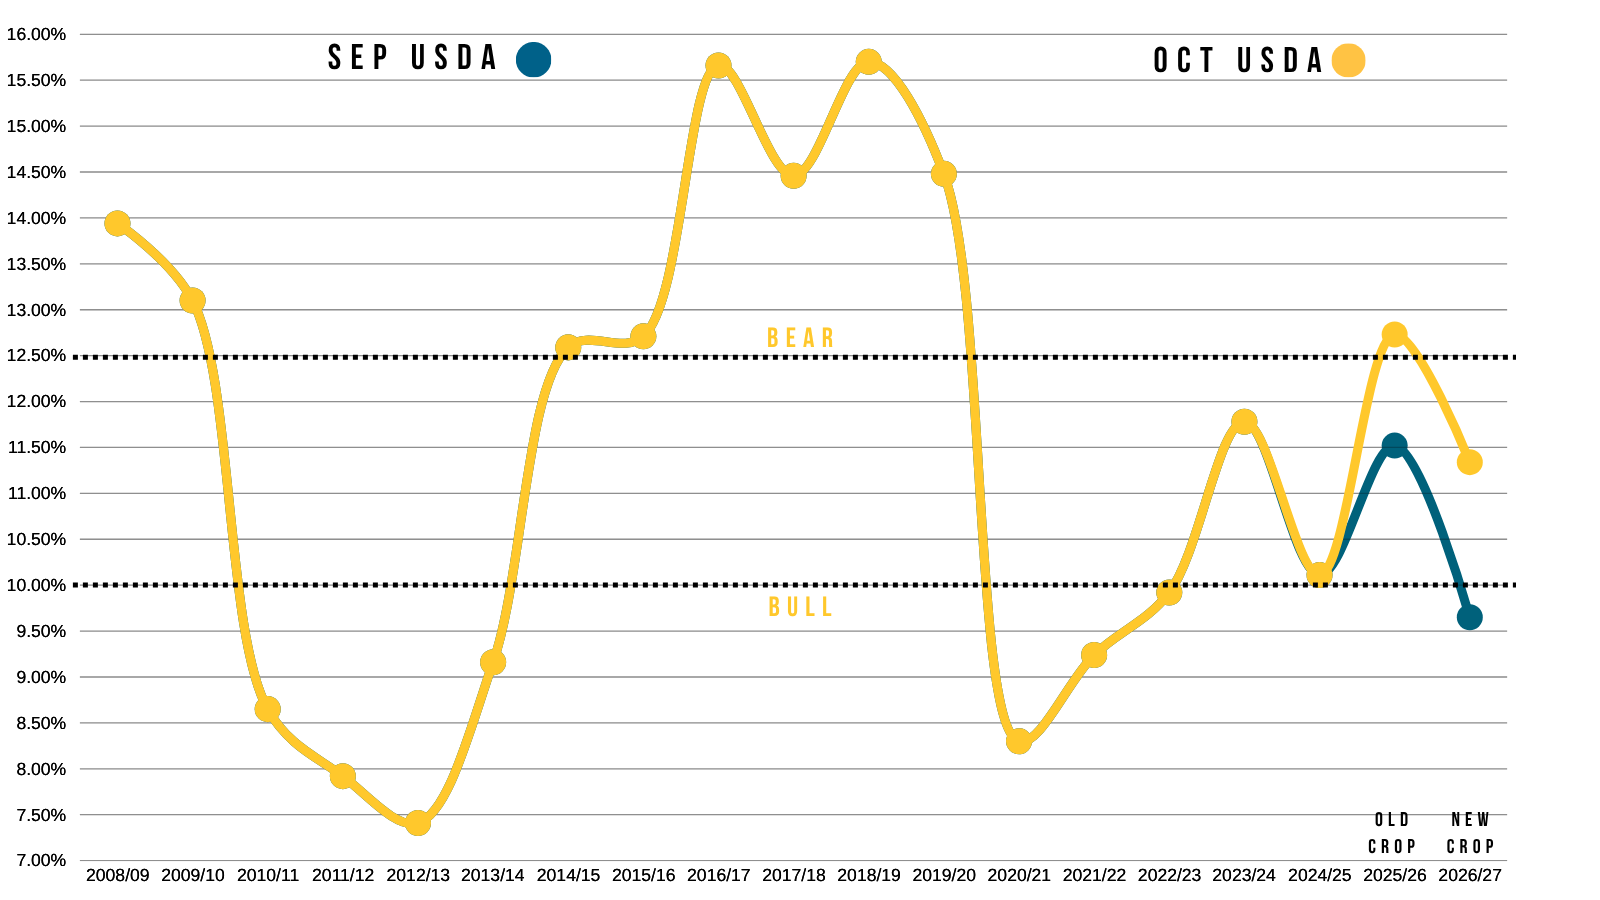
Here is a side by side visual of the change.
Yellow = New Oct USDA
Blue = Last Sep USDA
If this stocks to use was verified, it quickly switches corn from the tightest situation since 2022, to an on par with where the USDA claimed the old crop situation was just a month ago.
How the USDA switched the S/U:
Old Crop: 11.52% to 12.72%
New Crop: 9.65% to 11.34%
So they moved the old crop to the most bearish situation since the last bear market.
That new crop is now back above 10%. Which is usually that magic number between a bulllish situation and a not so bullish situation.
We went from 9.7% to 11.3% in the span of 9 days.
I do not believe the balance sheet will finish at these levels, but you can see the concern from the market today.
I think the balance sheet only gets tighter from here, but clearly today's numbers were not friendly.
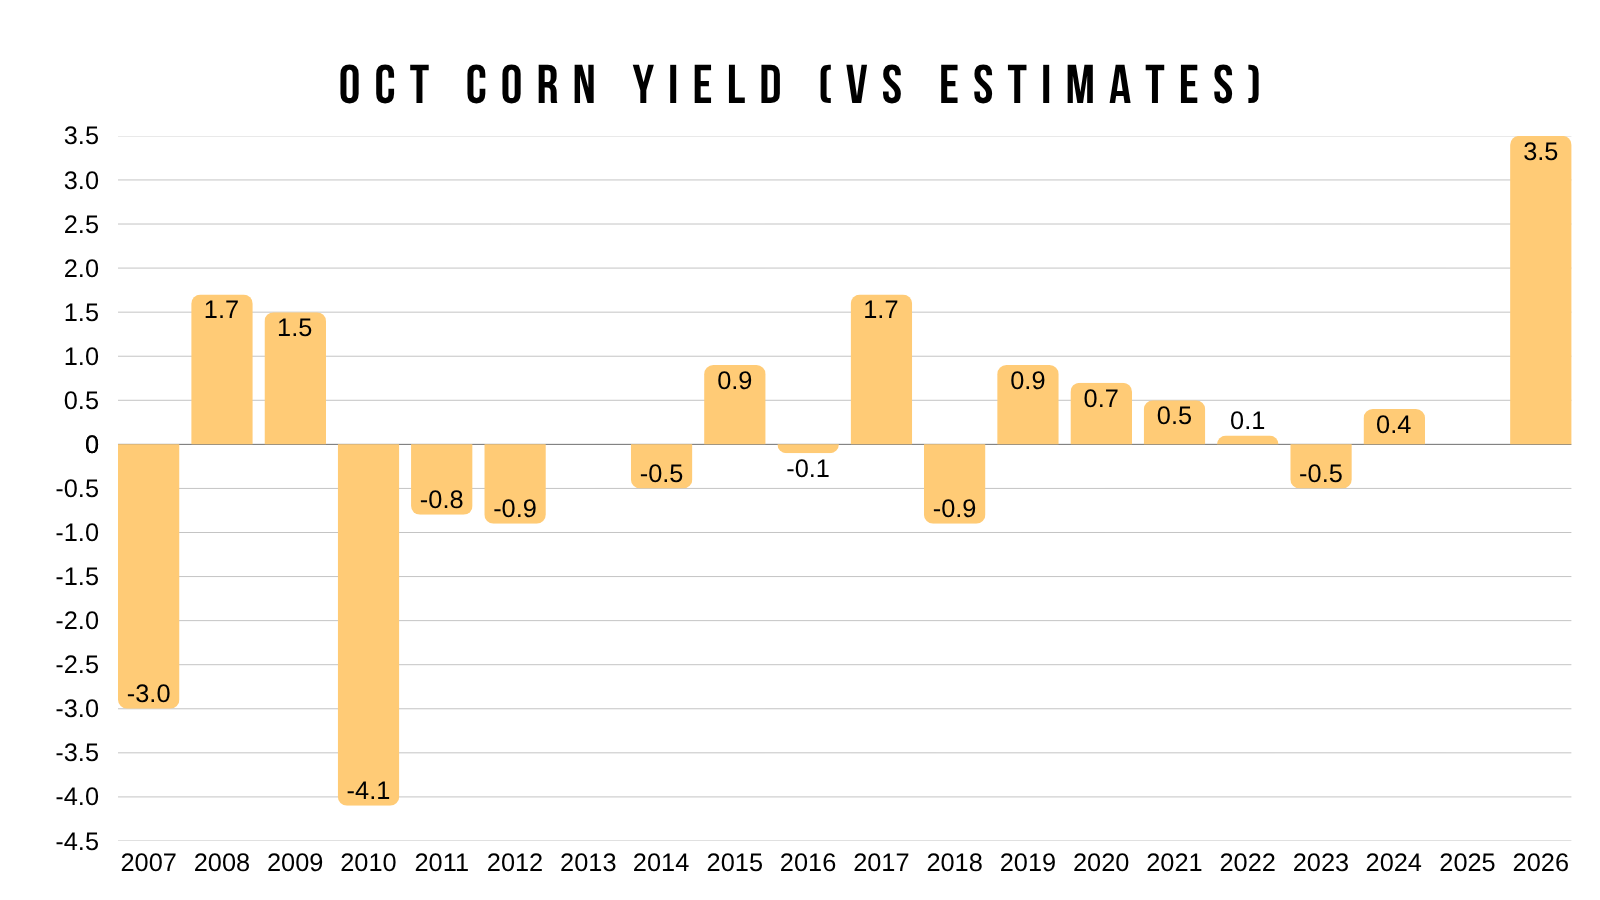
Here is the history of corn yield vs the trade estimates.
This was the largest upside yield miss on RECORD.
This type of miss was unheard of until now.
This was about as bearish of a report you could’ve possibly seen.
Hence why we saw our first limit move in nearly 5 years today.
We thought there was potential for the USDA to offset the extra old stocks with a cut to yield like they did in 2010.
Given that in the Sep stocks the USDA gave us the largest old crop demand miss since 2010.
Almost everyone was expecting some sort of cut to yield to at least partially help offset the Sep stocks report.
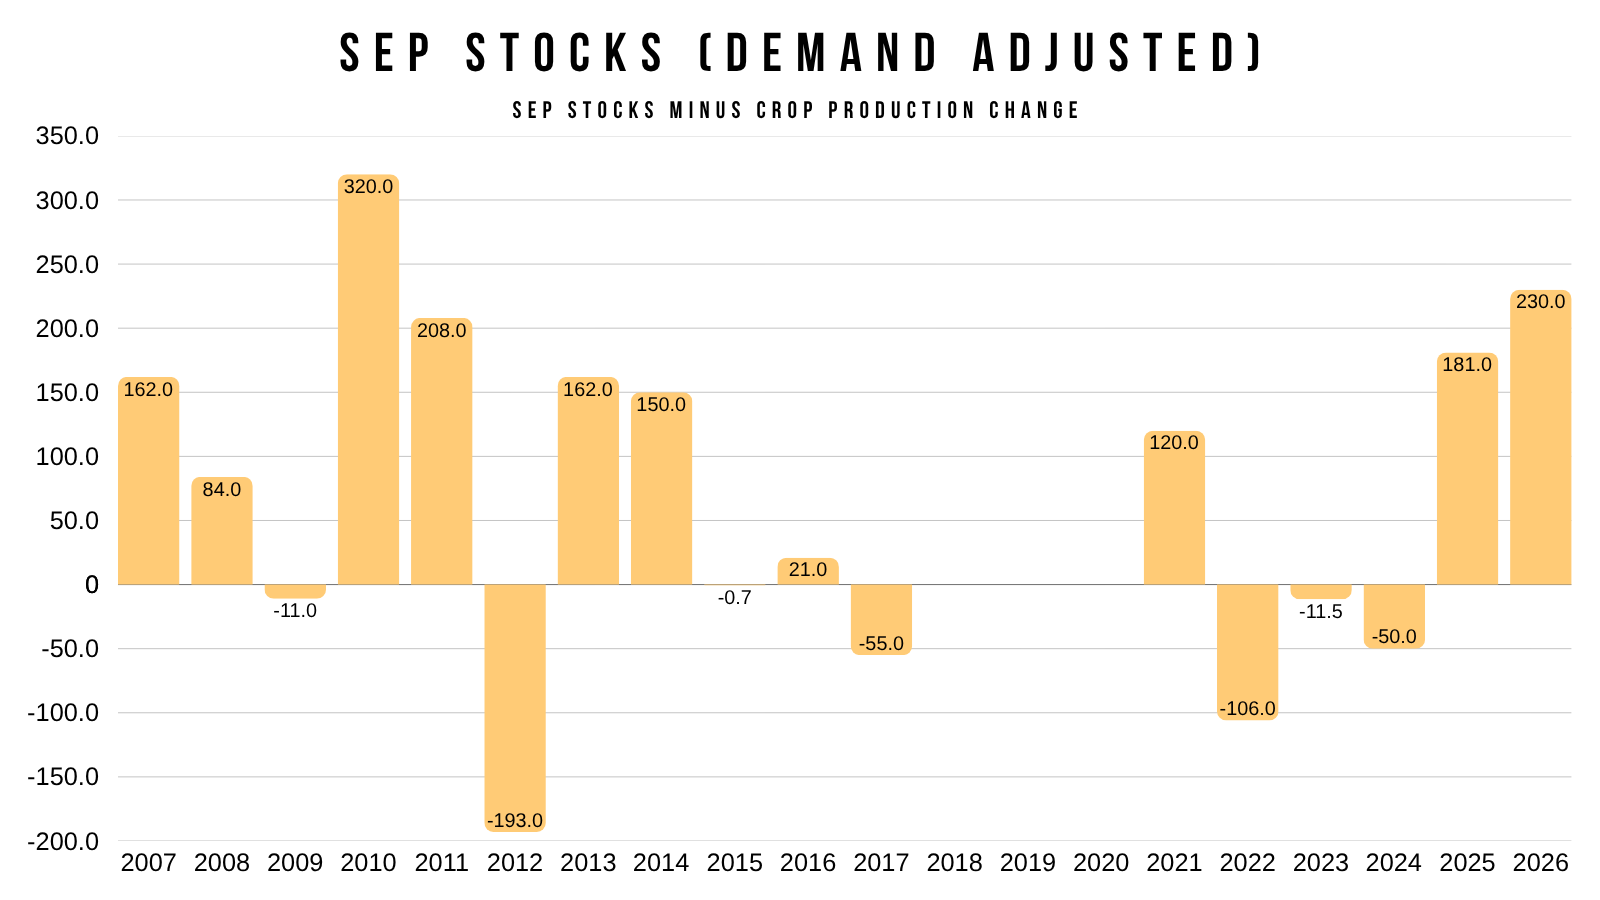
But the complete opposite in fact happened.
Not only did we get the 2nd largest demand cut to old crop ever.
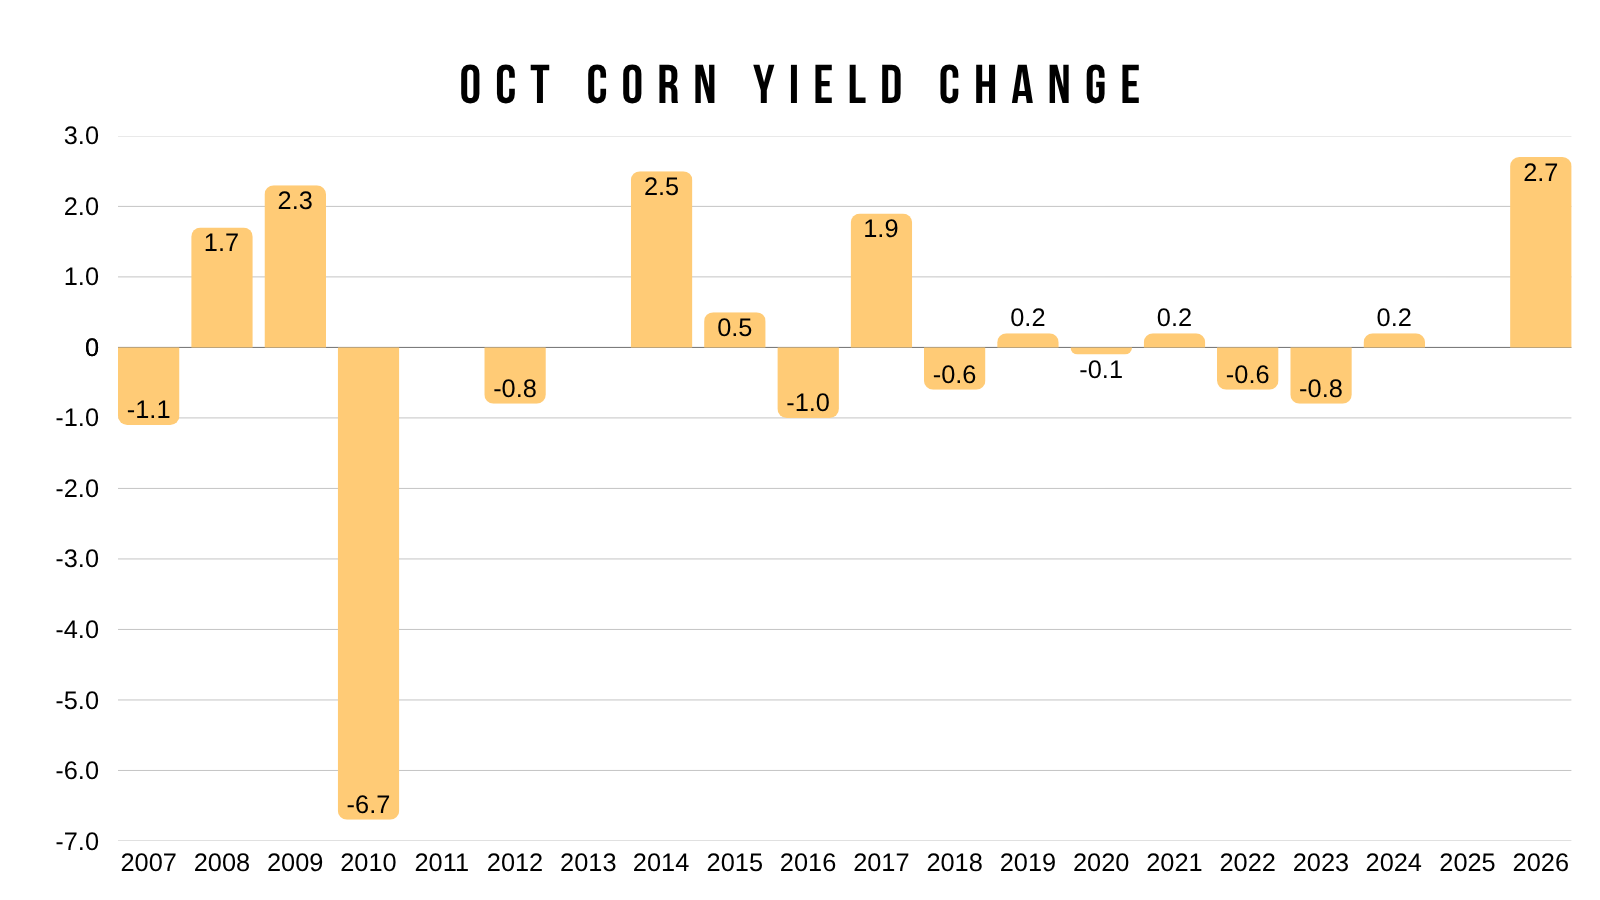
This was the largest bump to yield in the history of the October report.
2010 on the other hand was the largest cut to yield in October history.
Instead of offsetting the extra old crop, they added even more new crop on top of the extra old crop.
A complete double whammy from the USDA.
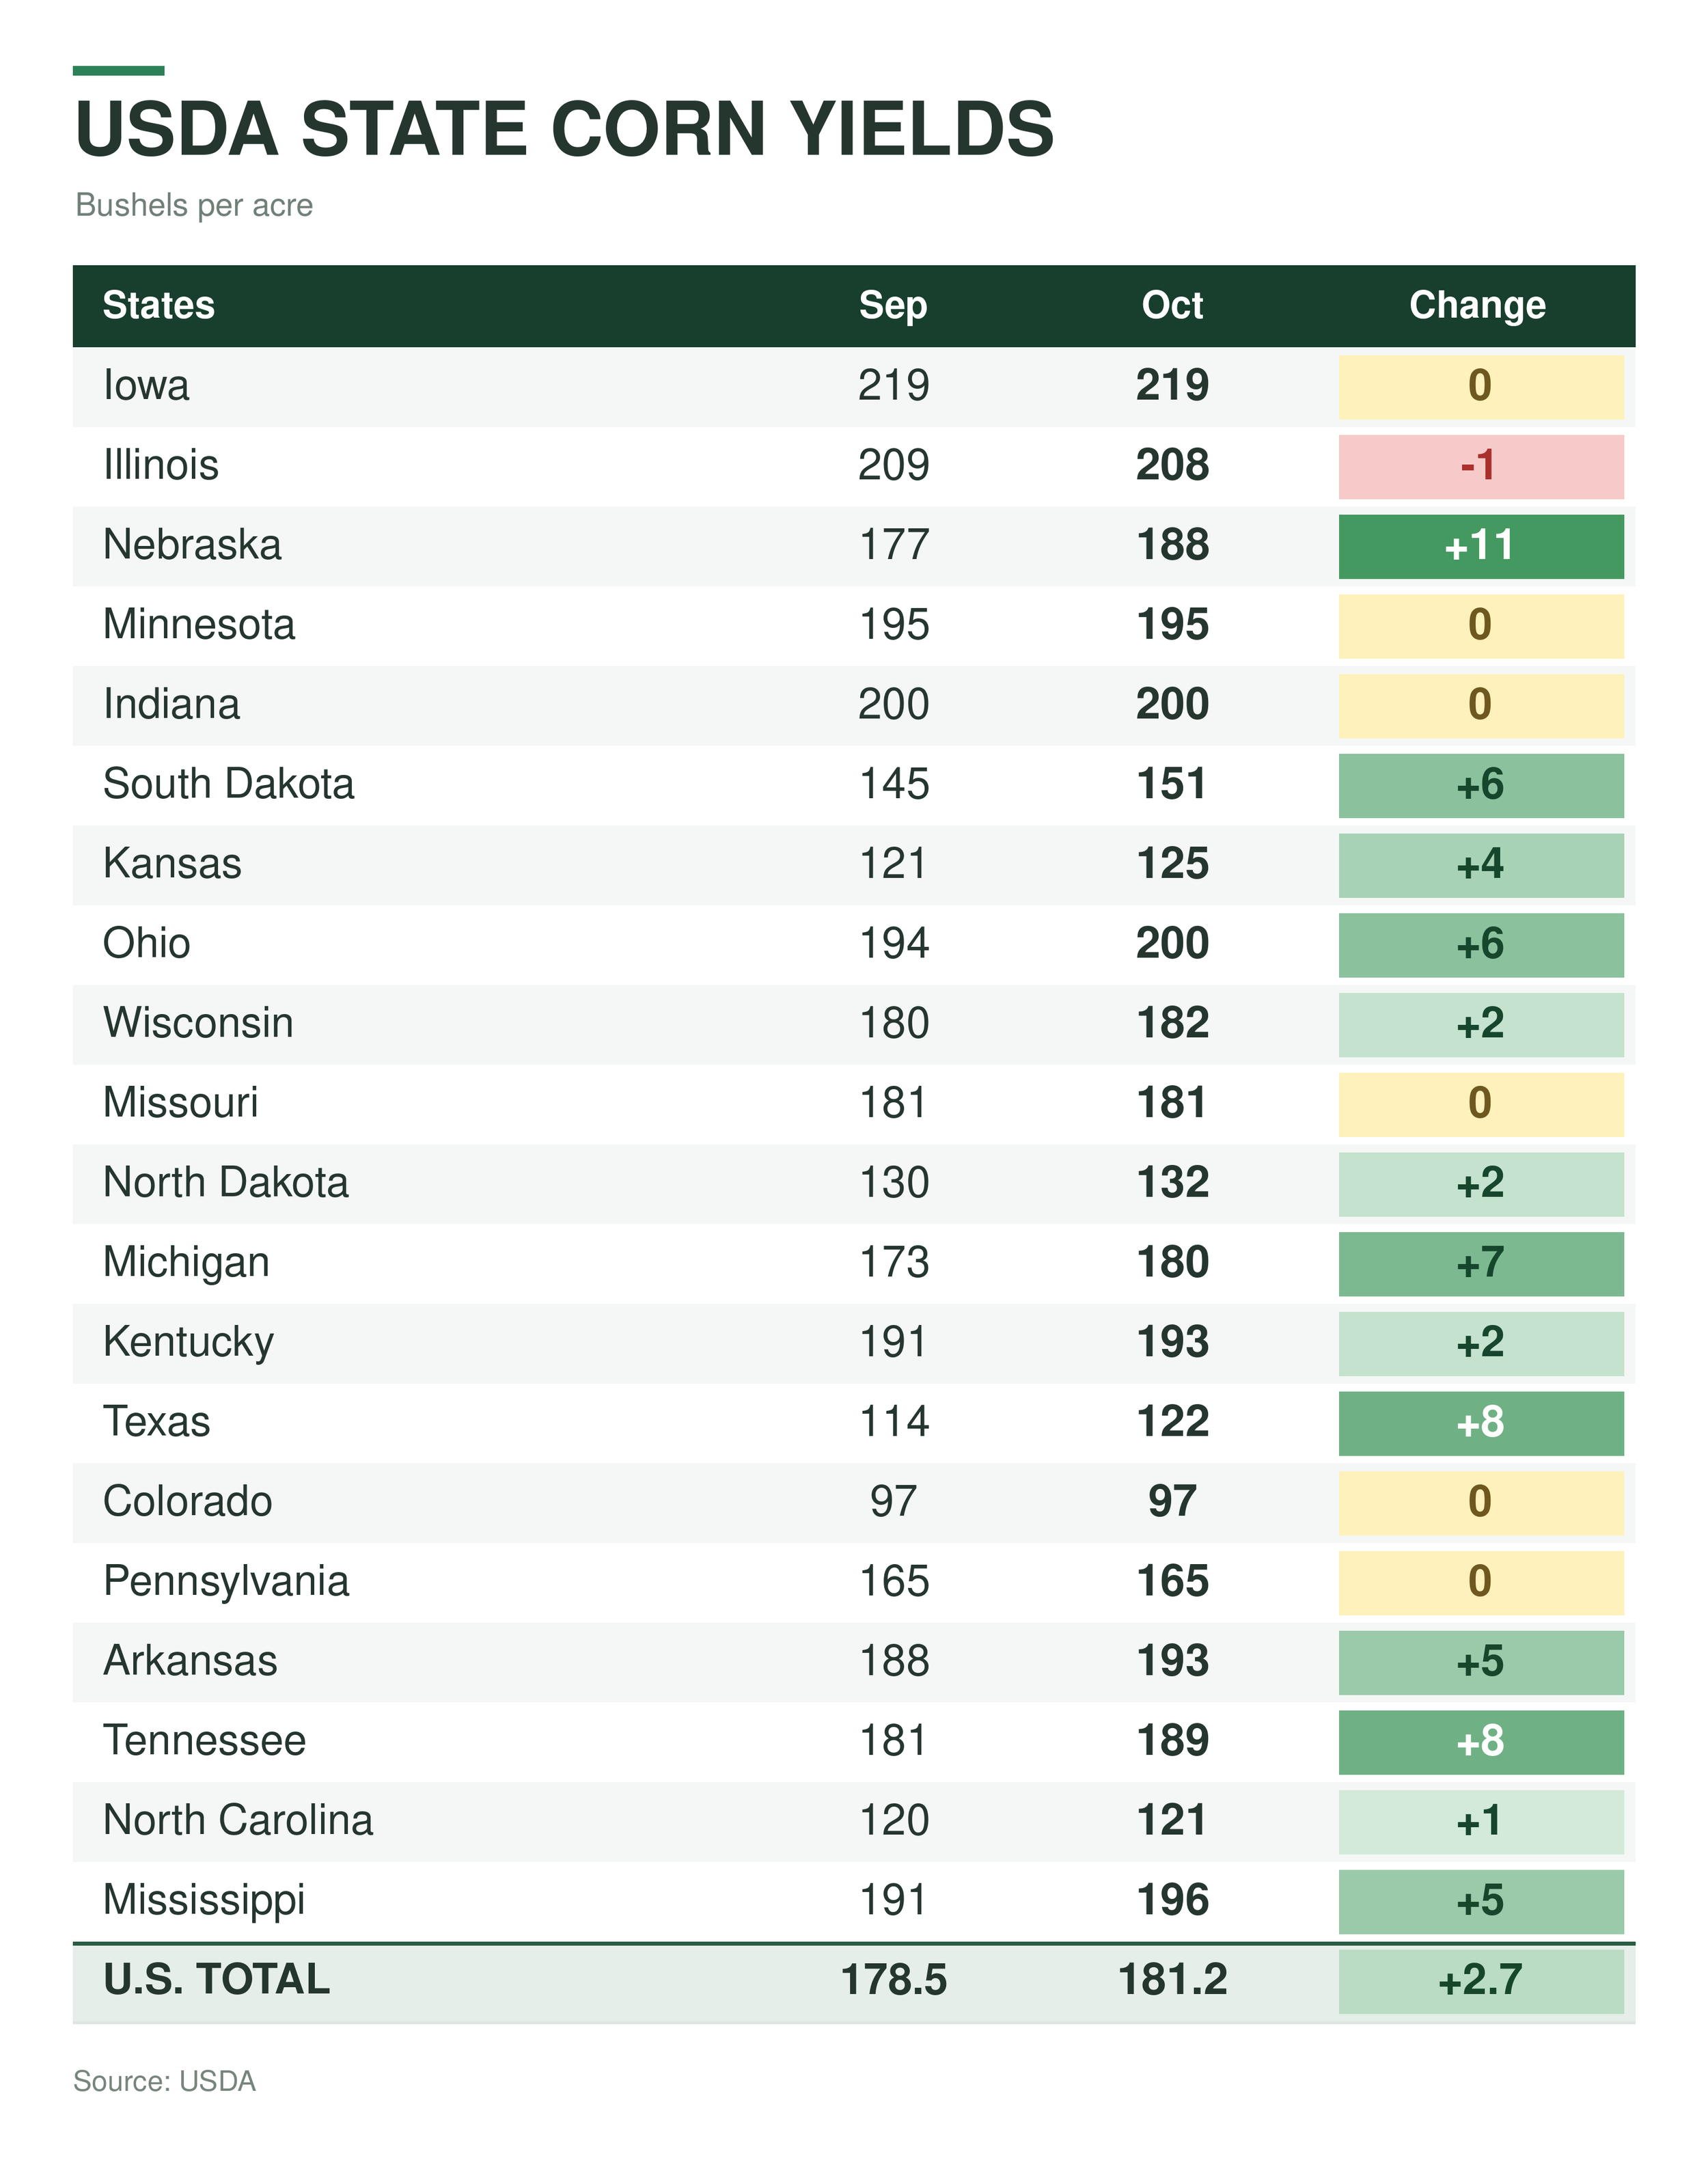
Here is the state by state breakdown.
Huge swing in Nebraska. As the USDA raised their yield by +11 bpa.
Nebraska alone accounted for 1.2 of the 2.7 bpa increase from the USDA.
They alone increased the carryout by a little over +100 million bu.
Which is interesting because Nebraska’s corn ratings sit at just 46% G/E.
It's also hard to think Illinois' crop is as large as the USDA current says.
So no I do not completely believe these numbers.
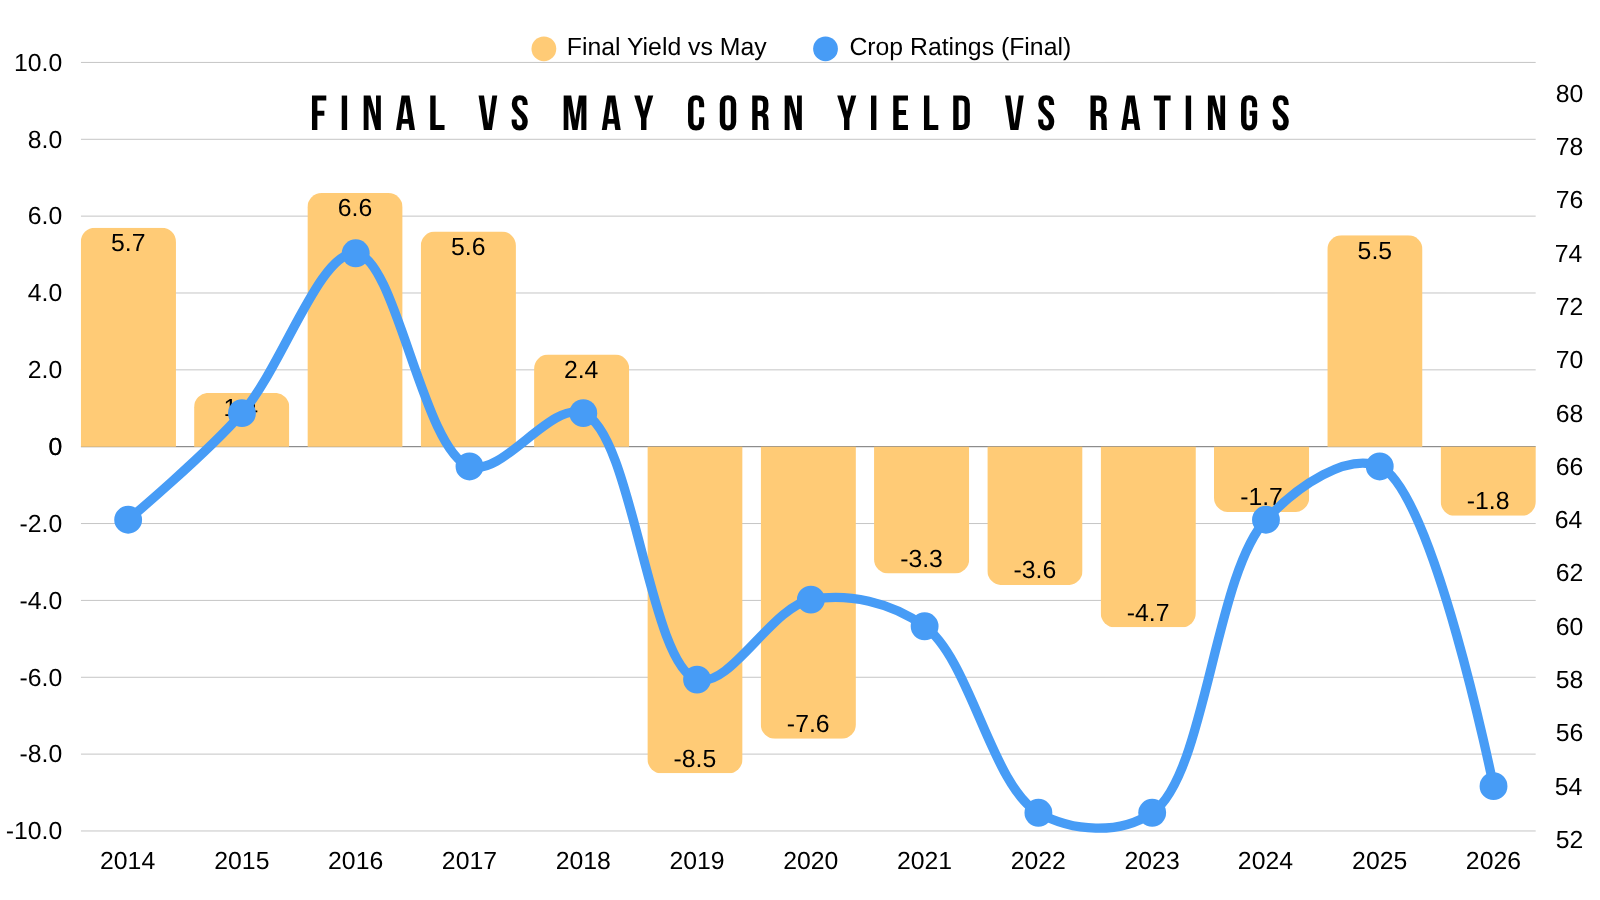
Here is final crop ratings vs how yield deviated from trend.
There is no correlation to yield vs ratings on a surface level.
There is however a correlation to how yield deviates from trend.
Something doesn’t look right here.
We have some of the worst ratings on record.
Yet.. this -1.8 bpa deviation from trend would now be one of the smallest.
So I'd argue the yield should get smaller from here. But I guess we'll see what the USDA does in November and January.
We also just saw crop ratings fall even further this week.
Which is very uncommon for this time of the year.
So it does make you scratch your head.
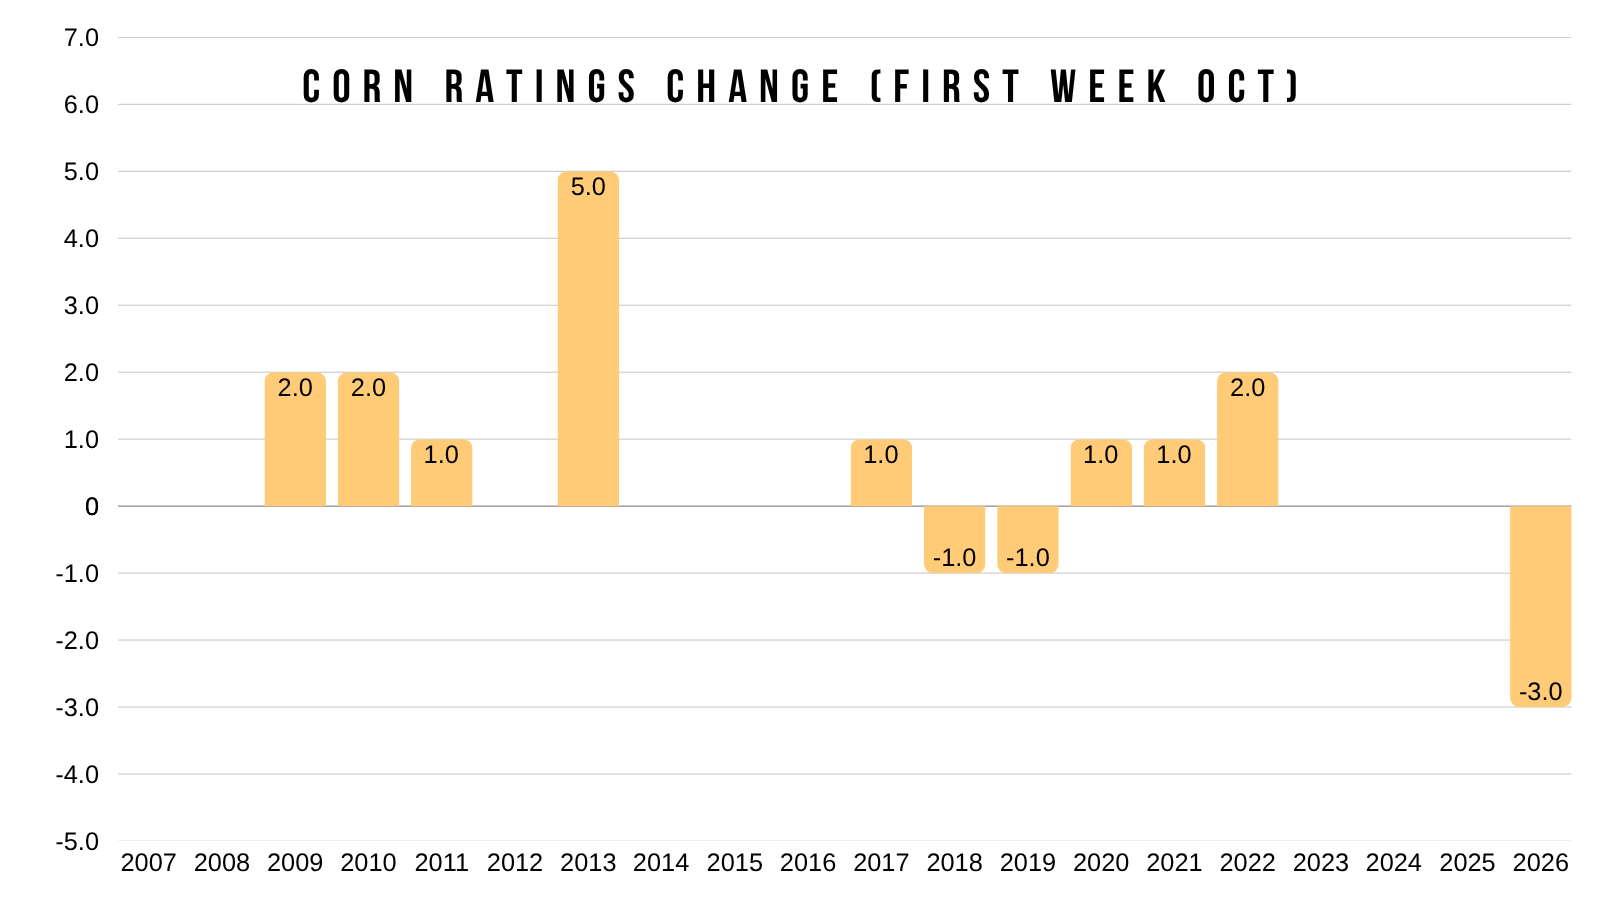
Today's yield wasn’t on my bingo card, and it was a major shock from the USDA.
They just lowered yield last month, but then turned around and raised it by more than they cut it. They cut the old crop demand a week ago but didn’t offset any of it in this report.
The inconsistency is what's frustrating for everyone.
They lowered yield in August. They lowered yield in September.
Now for whatever reason, they raised it today in October higher than where they had it in August before they cut it. Raising it by the most they’ve ever raised it in October.
The USDA probably overstated yield last year. They then used the feed demand as a catch up number. Now they conveniently raised yield during the crop insurance price average period.
We can complain all we want. Whether it makes sense or not, and whether we like it or not, these are the numbers we have to work with regardless.
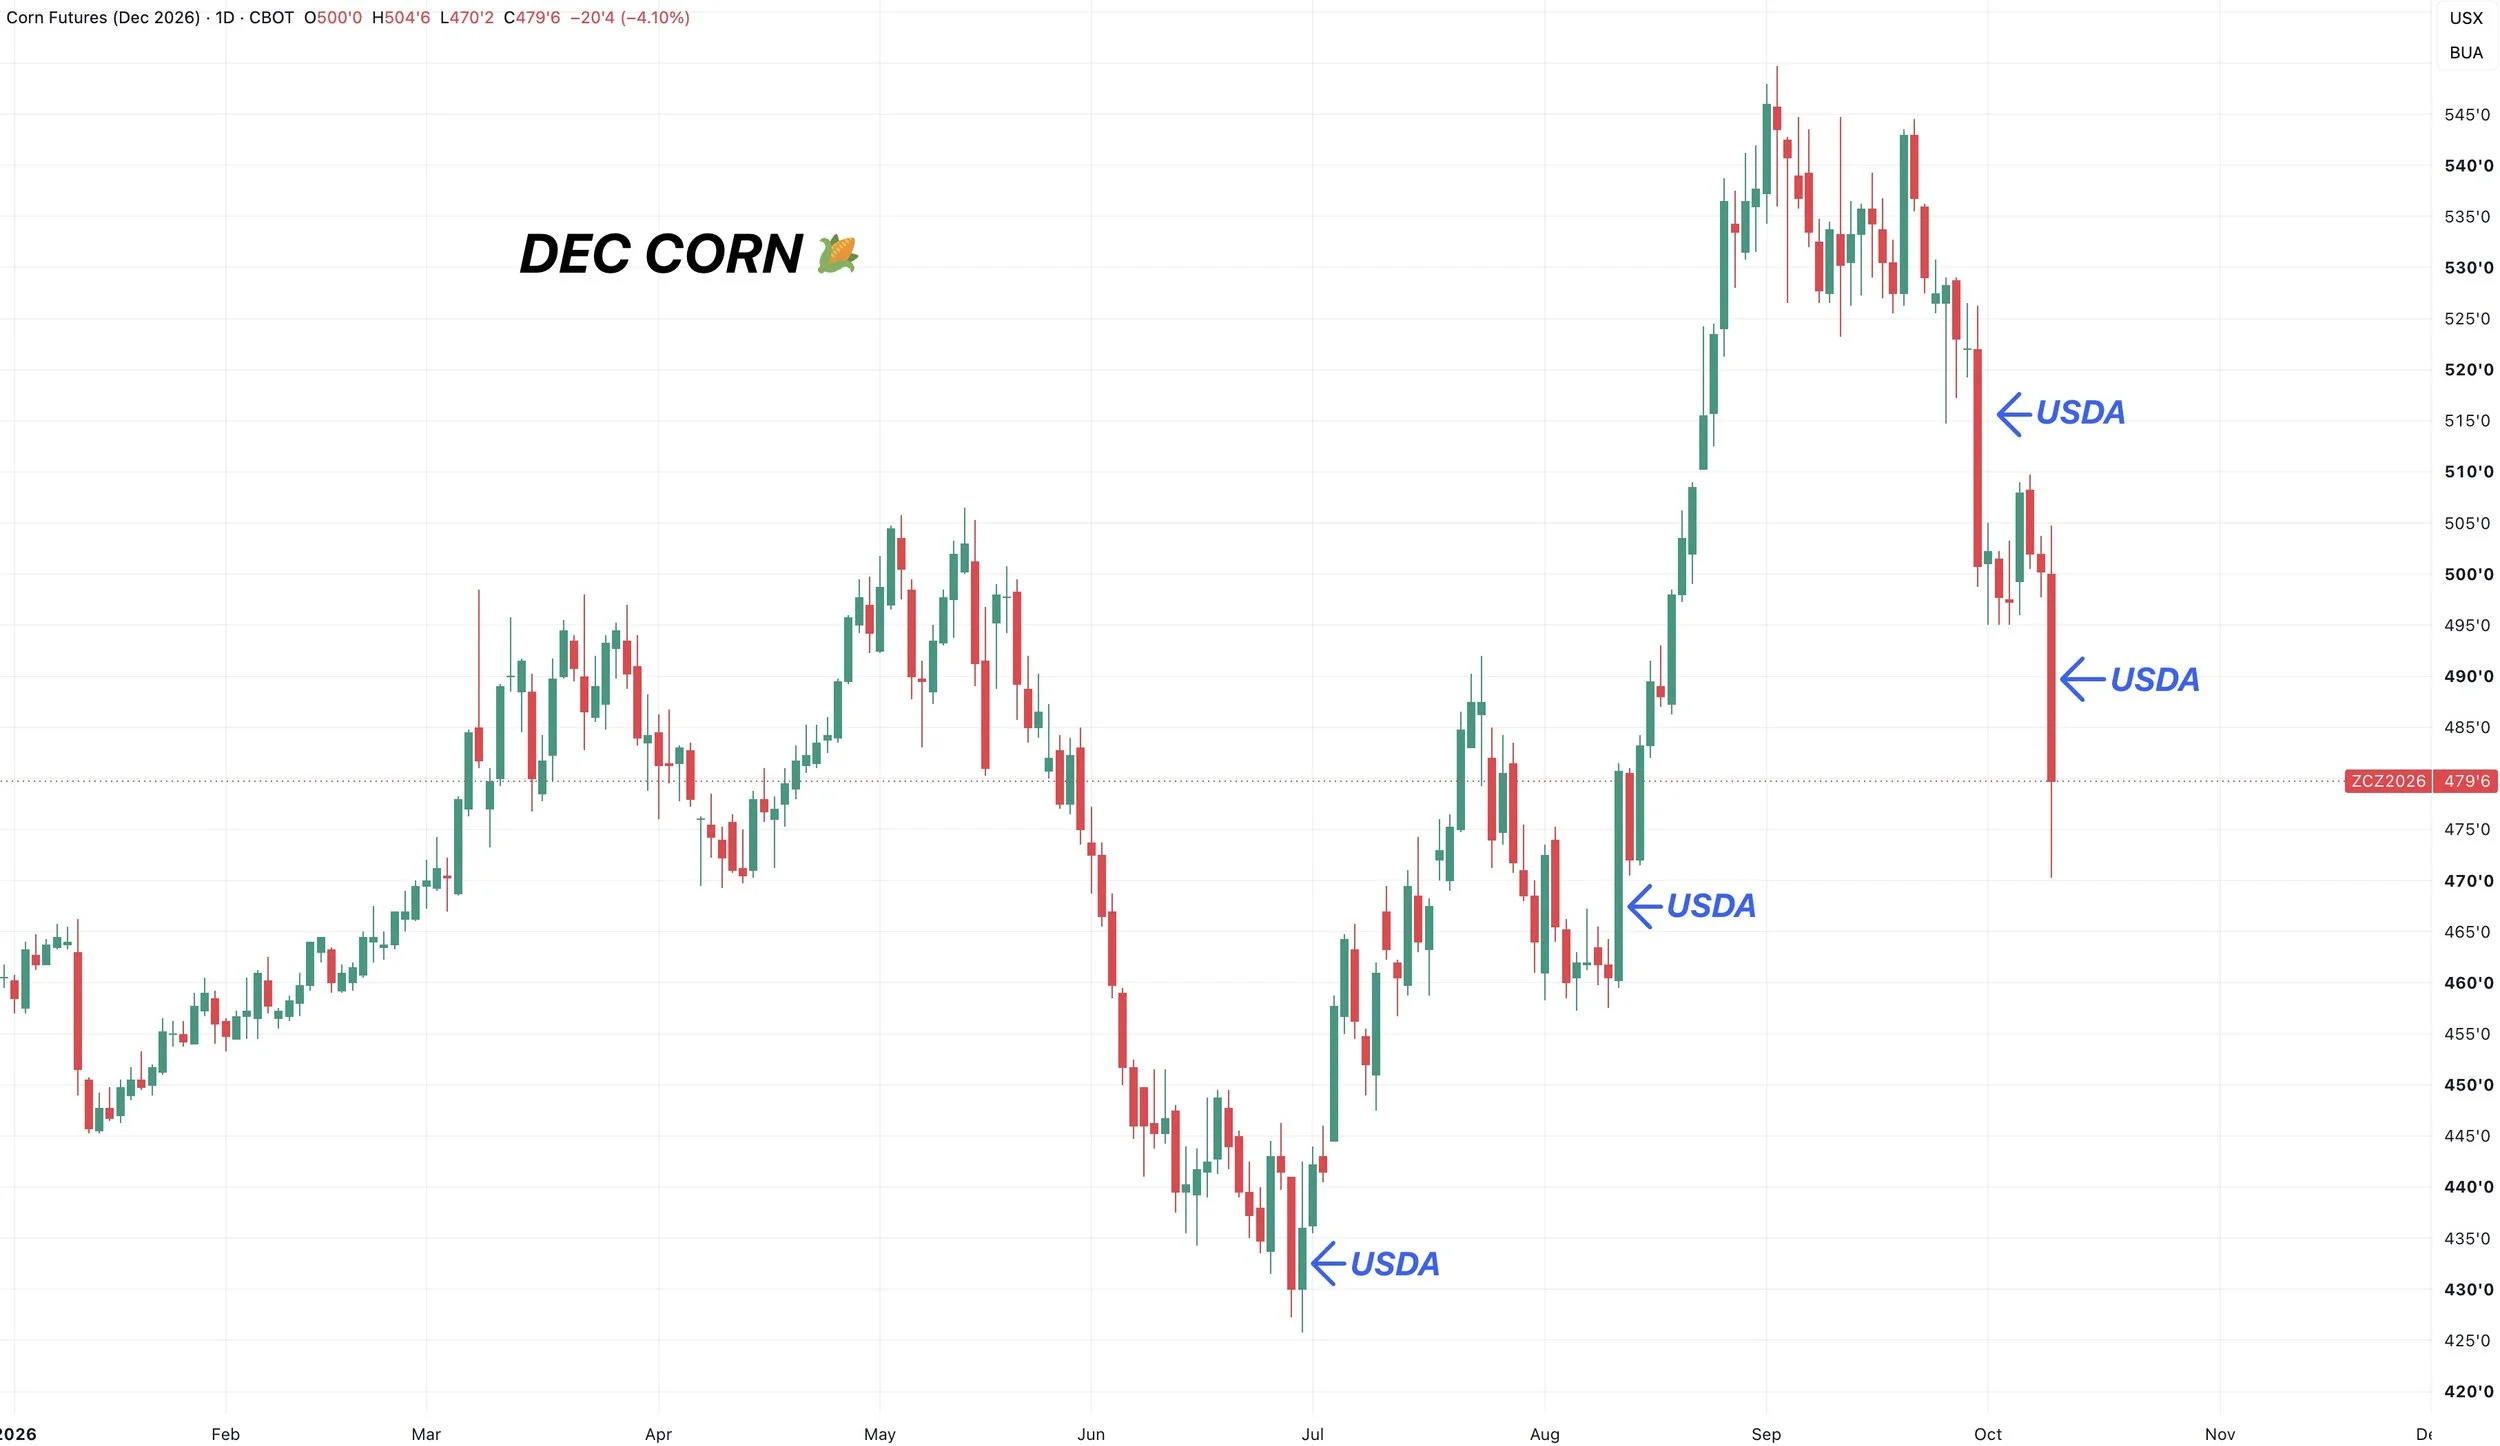
The last two USDA reports gave back most of this entire rally.
1st USDA: -21 cents
2nd USDA: -20 cents
Those two single days accounted for pretty much the entire sell off.
Despite being limit down after the report today, the last report a week and a half ago led to use getting a lower daily close than we saw today.
It's somewhat ironic given the June and August reports sparked a rally as was they said the crop getting smaller. Now we are selling off because they say we have extra old crop and the new crop is apparently getting bigger. The USDA gives and the USDA takes.
The next two wild cards for this market are going to be China business and South America weather.
Then of course what the USDA decides to do in the November report now.
That's all I have for the report today. We'll be getting more into the fundamentals along with other thoughts on what's next, and everything else next week.
So let's dive into the charts and things to watch on them. As we're at some key levels.
Today's Main Takeaways
Corn
Corn Charts
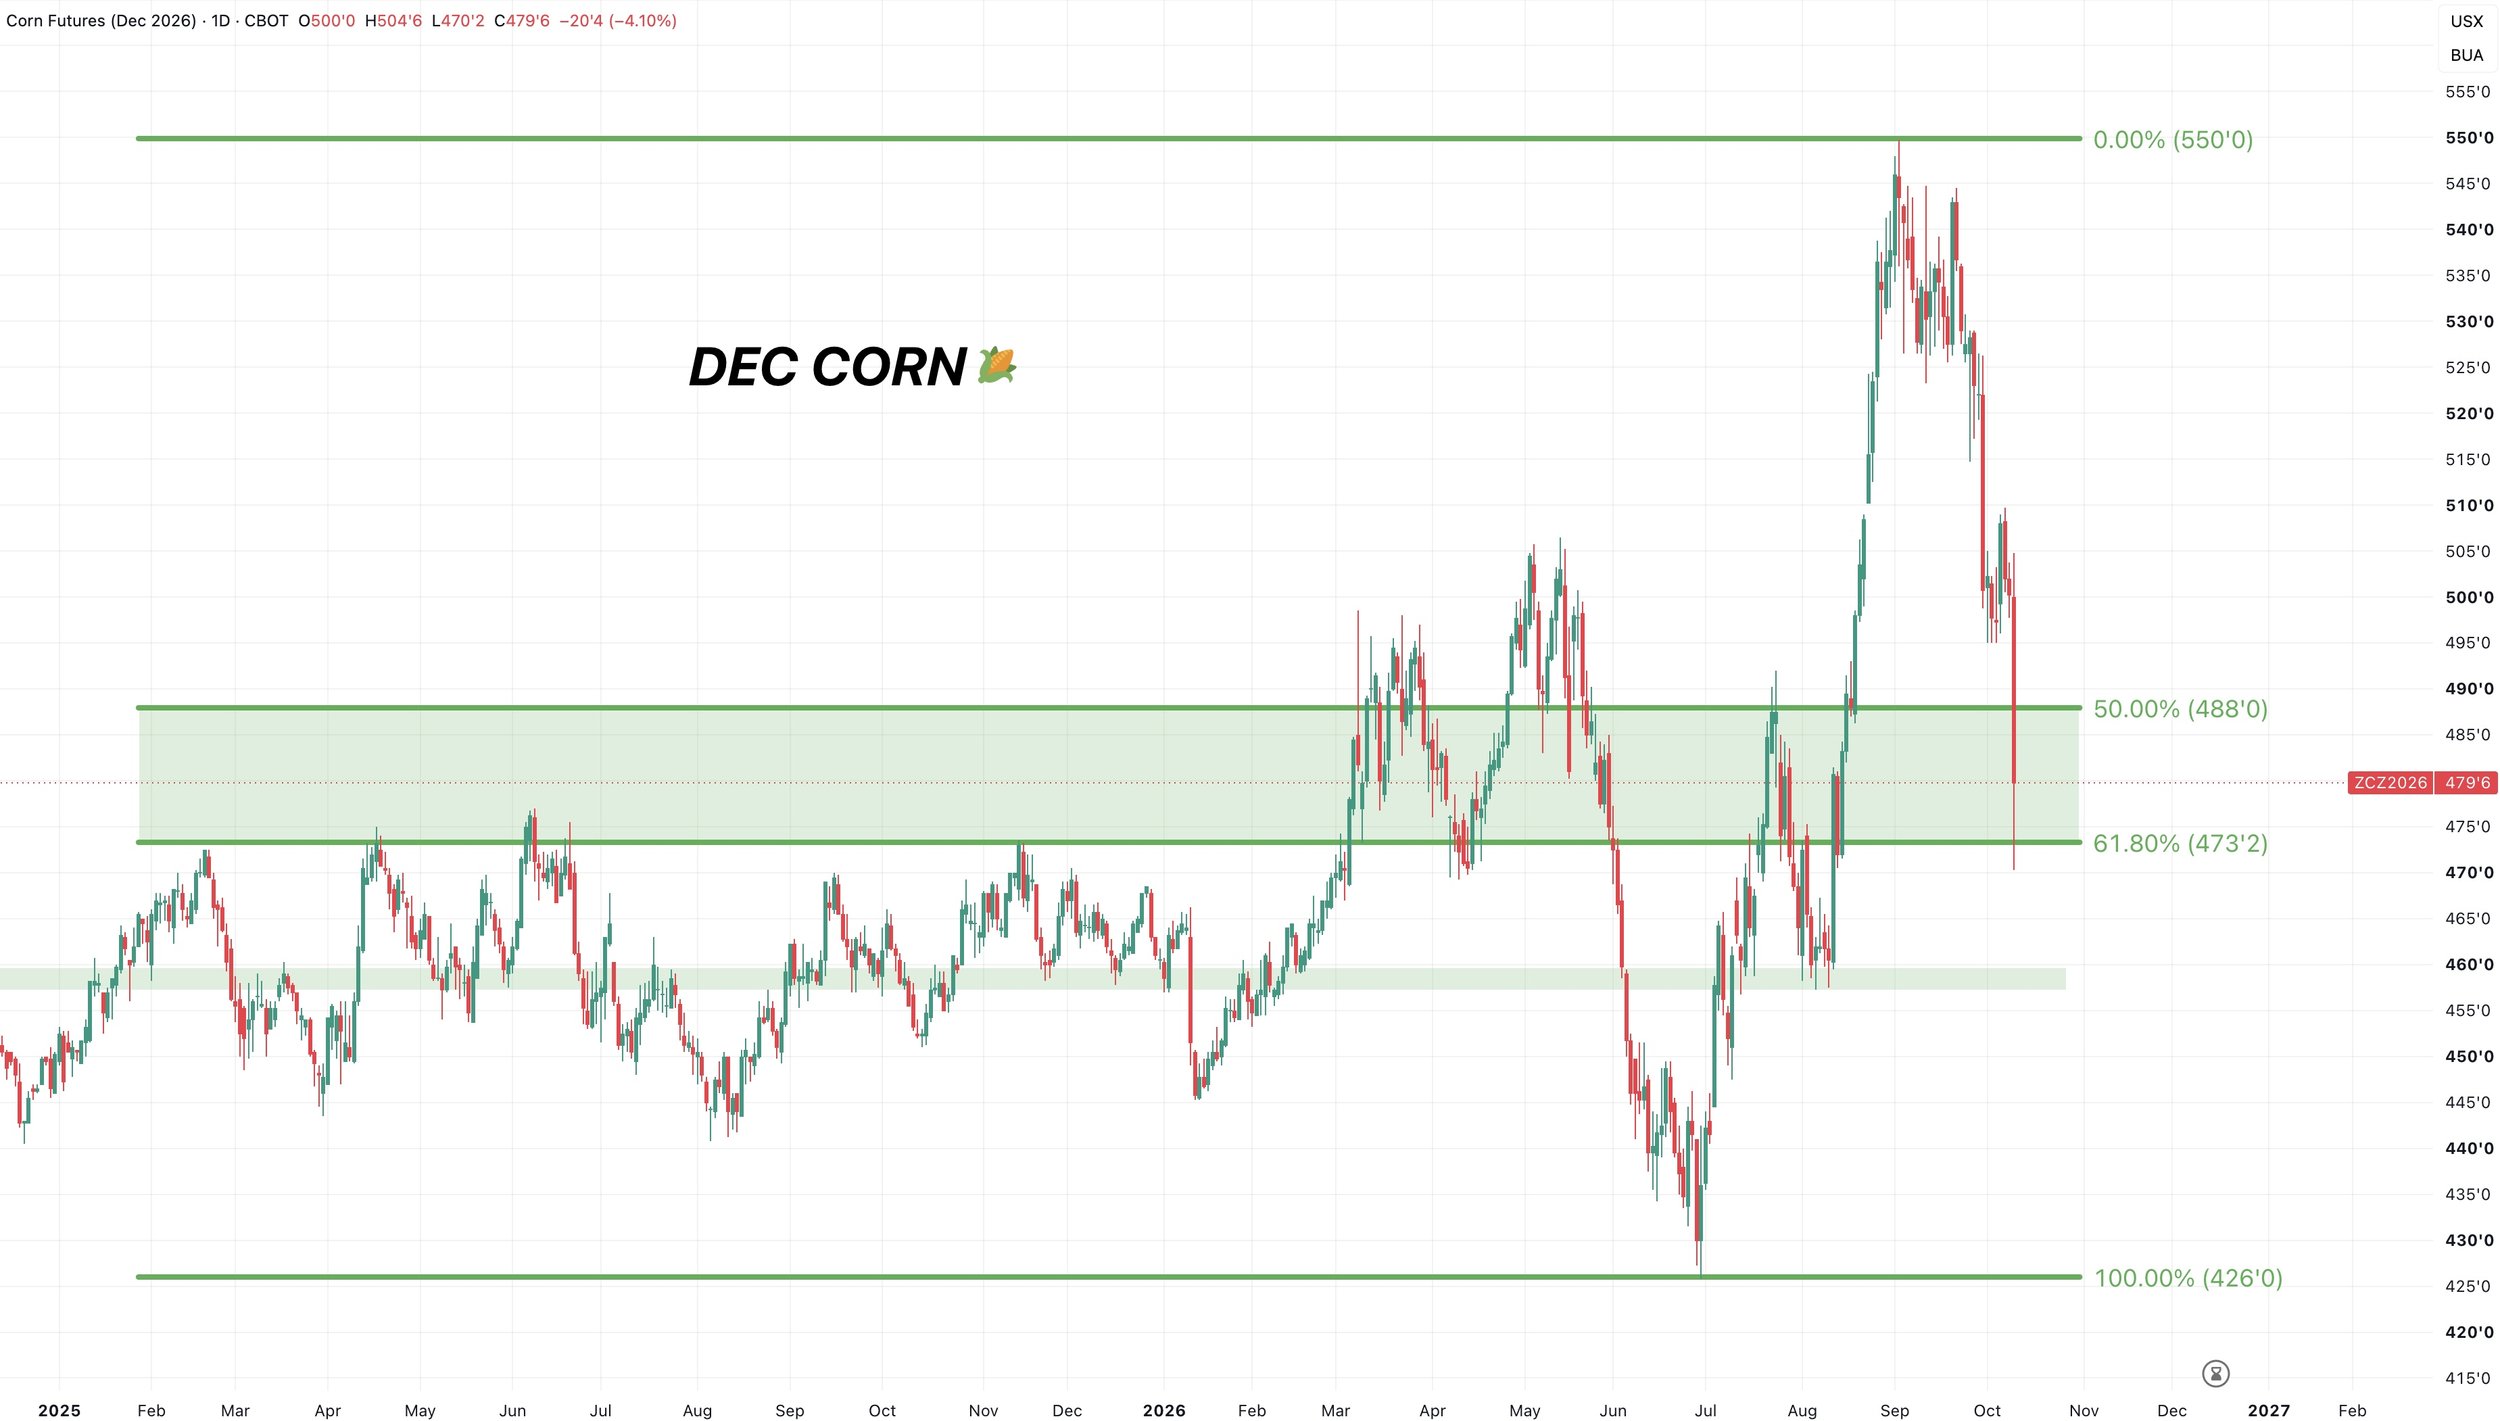
Dec Corn Chart: Where is Support Now?
Well the USDA took the wind out of this market fast.
We will go over more of the fundamentals next week after we see how the market digests the news.
We broke that major support that we would’ve liked to see hold, and where I thought we had a good chance of holding if the USDA didn’t throw a bearish surprise.
Which was the golden zone down to the August lows. That same level also re-tested the May highs.
But here we are. We failed to hold there, so now what?
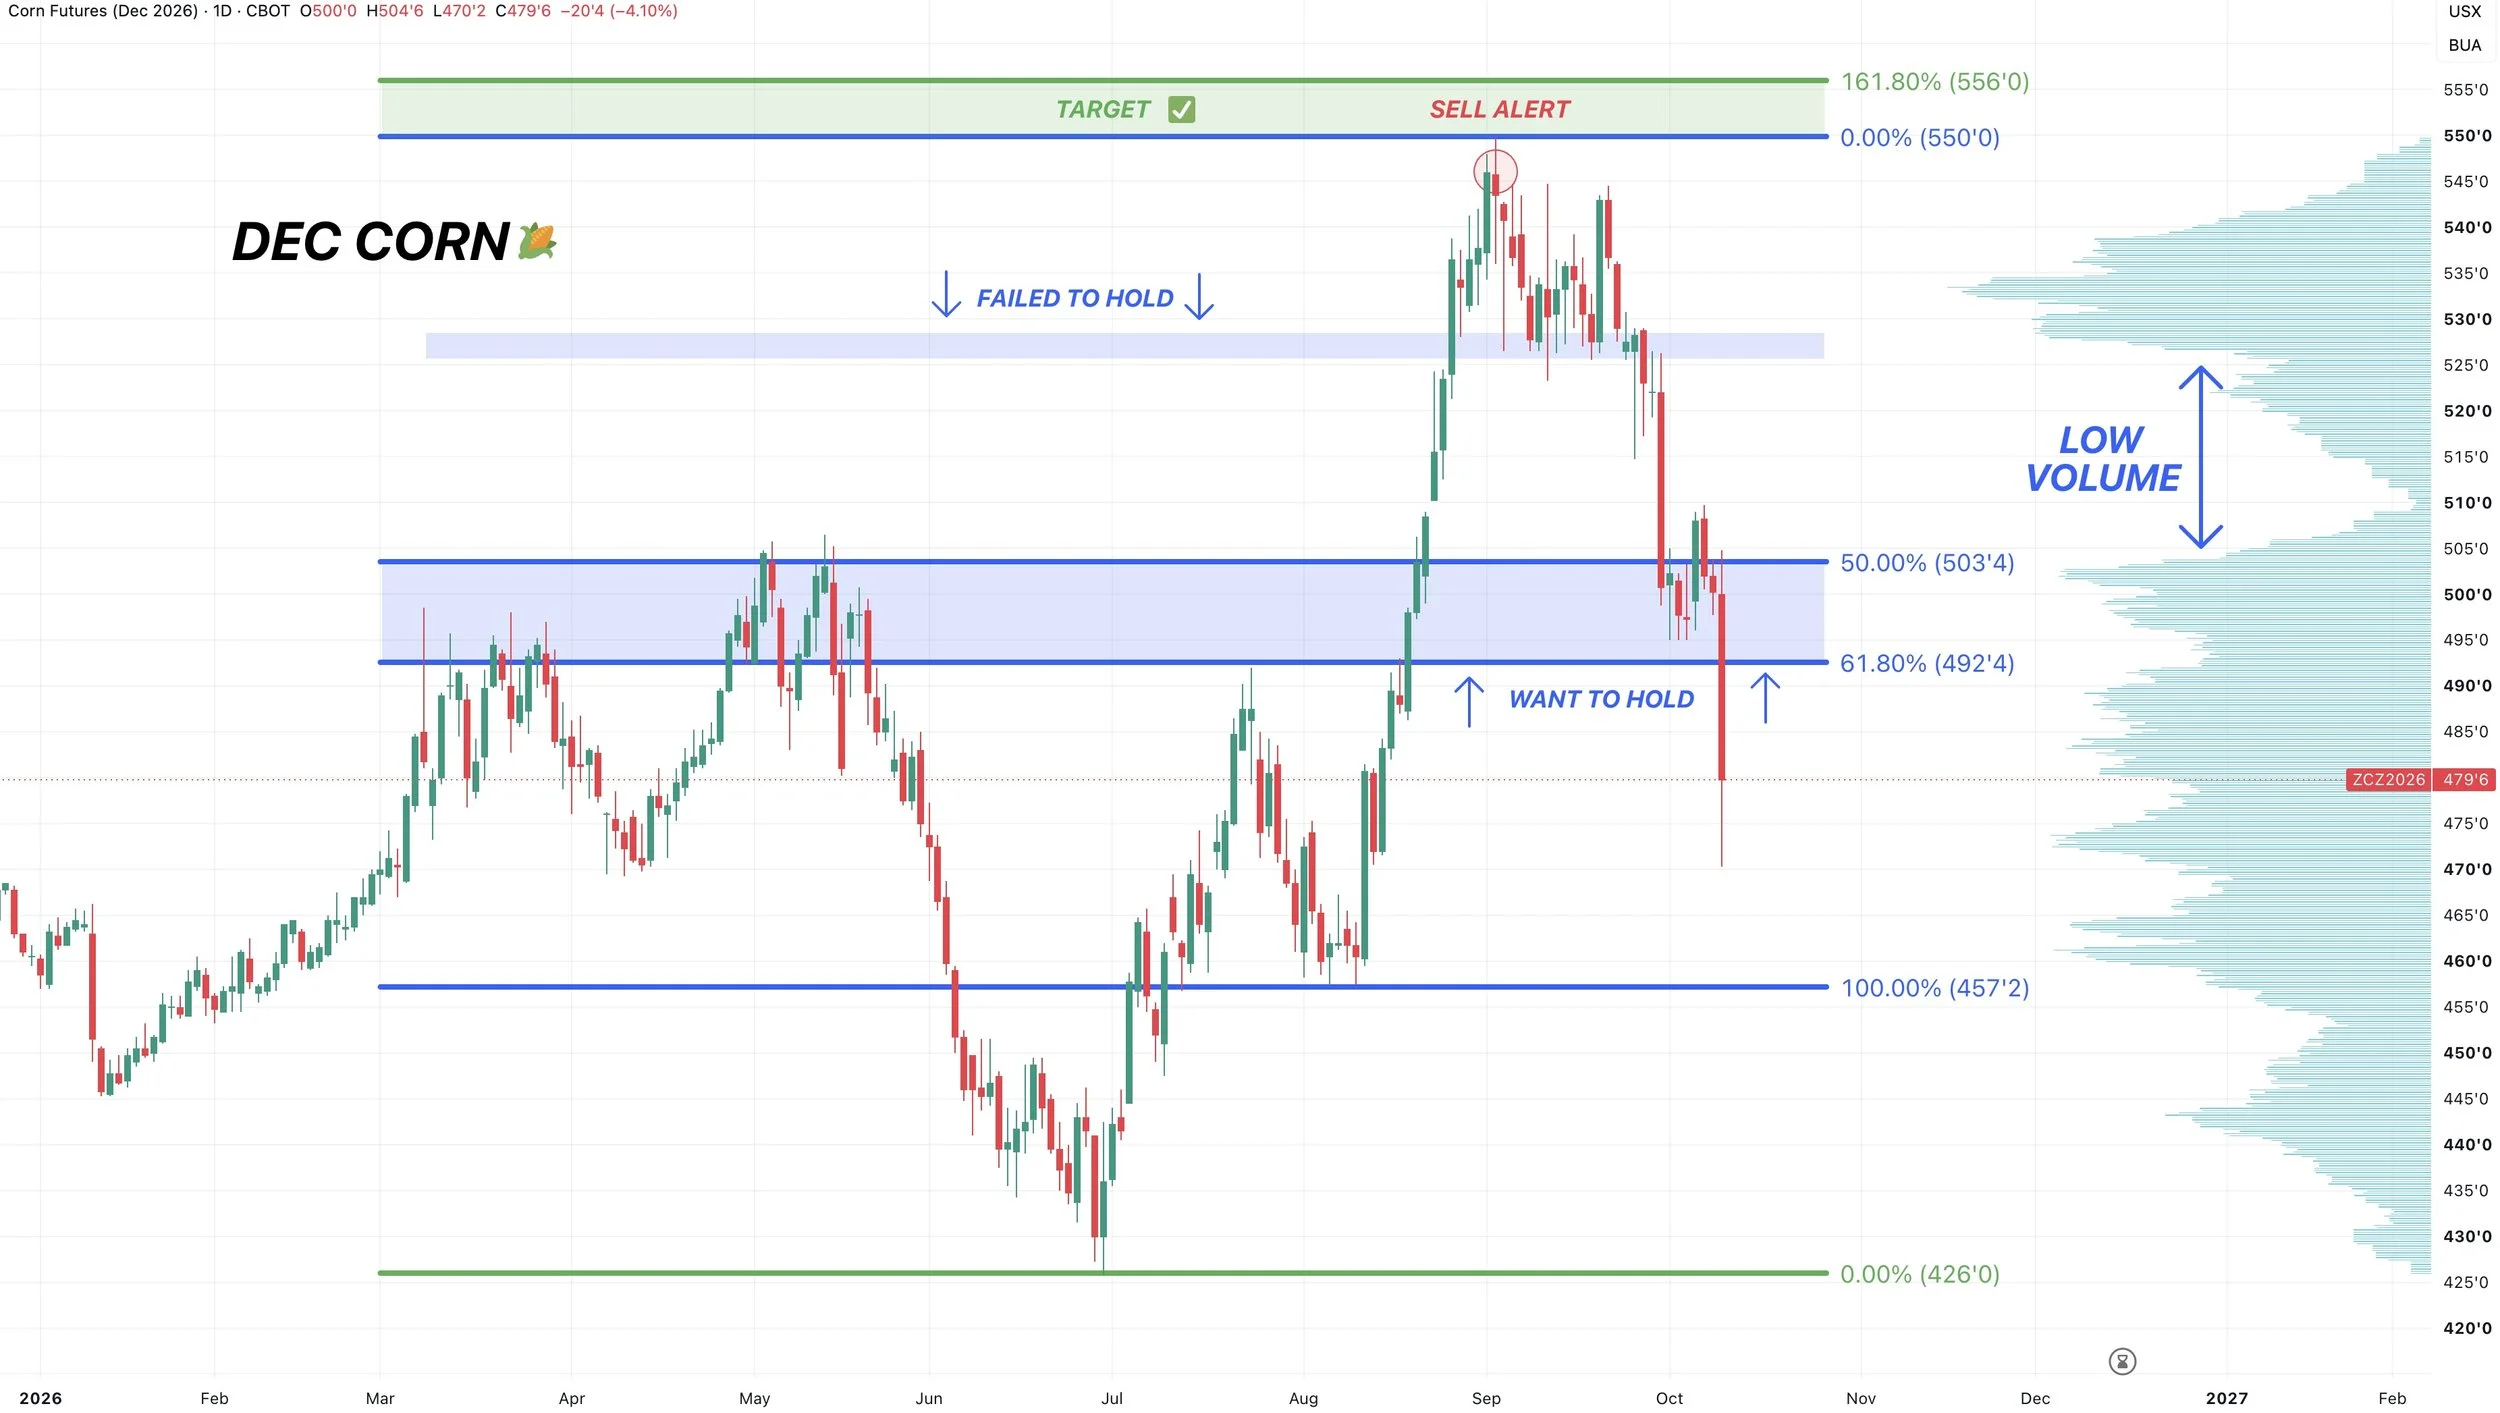
We have now came down to virtually the last level of support in corn.
We have given back 61.8% of the entire rally from contract lows.
This same level is acted a key support and resistance level countless times over the last 2 years.
So bulls would like to hold this level. And this would be the next level we'd expect to find some life if we are going to do so after failing the first level.
If you cannot hold here, then it would potentially open the door to further downside.
But for now, this would be viewed as support.
I said this after the last report. But again, markets can often bottom on bad news and top on good news. The USDA just gave us yet more bad news.
This market just dropped -80 cents. With -50 cents coming over the last 9 days. So the market has clearly priced in a lot of bearishness in a very quick time frame.
We will see how the market reacts at this level. We saw a nice reaction today, as we bounced +10 cents off the lows. So we want to continue to see it hold.
Today sucks. No doubt. I always talked about this market potentially getting a decent sized correction towards $5.00 and had that sell alert around $5.50, but we've now gone lower than I originally thought we would.
But I'm not flipping full-on bearish on corn -80 cents off the highs and at areas of support. Staying patient for now.
Did the USDA just make it that much harder for the corn story? Yes they did.
However, I do not think the corn market is dead.
It might take some time, but long term I do not think the story is over for corn.
Weekly Chart
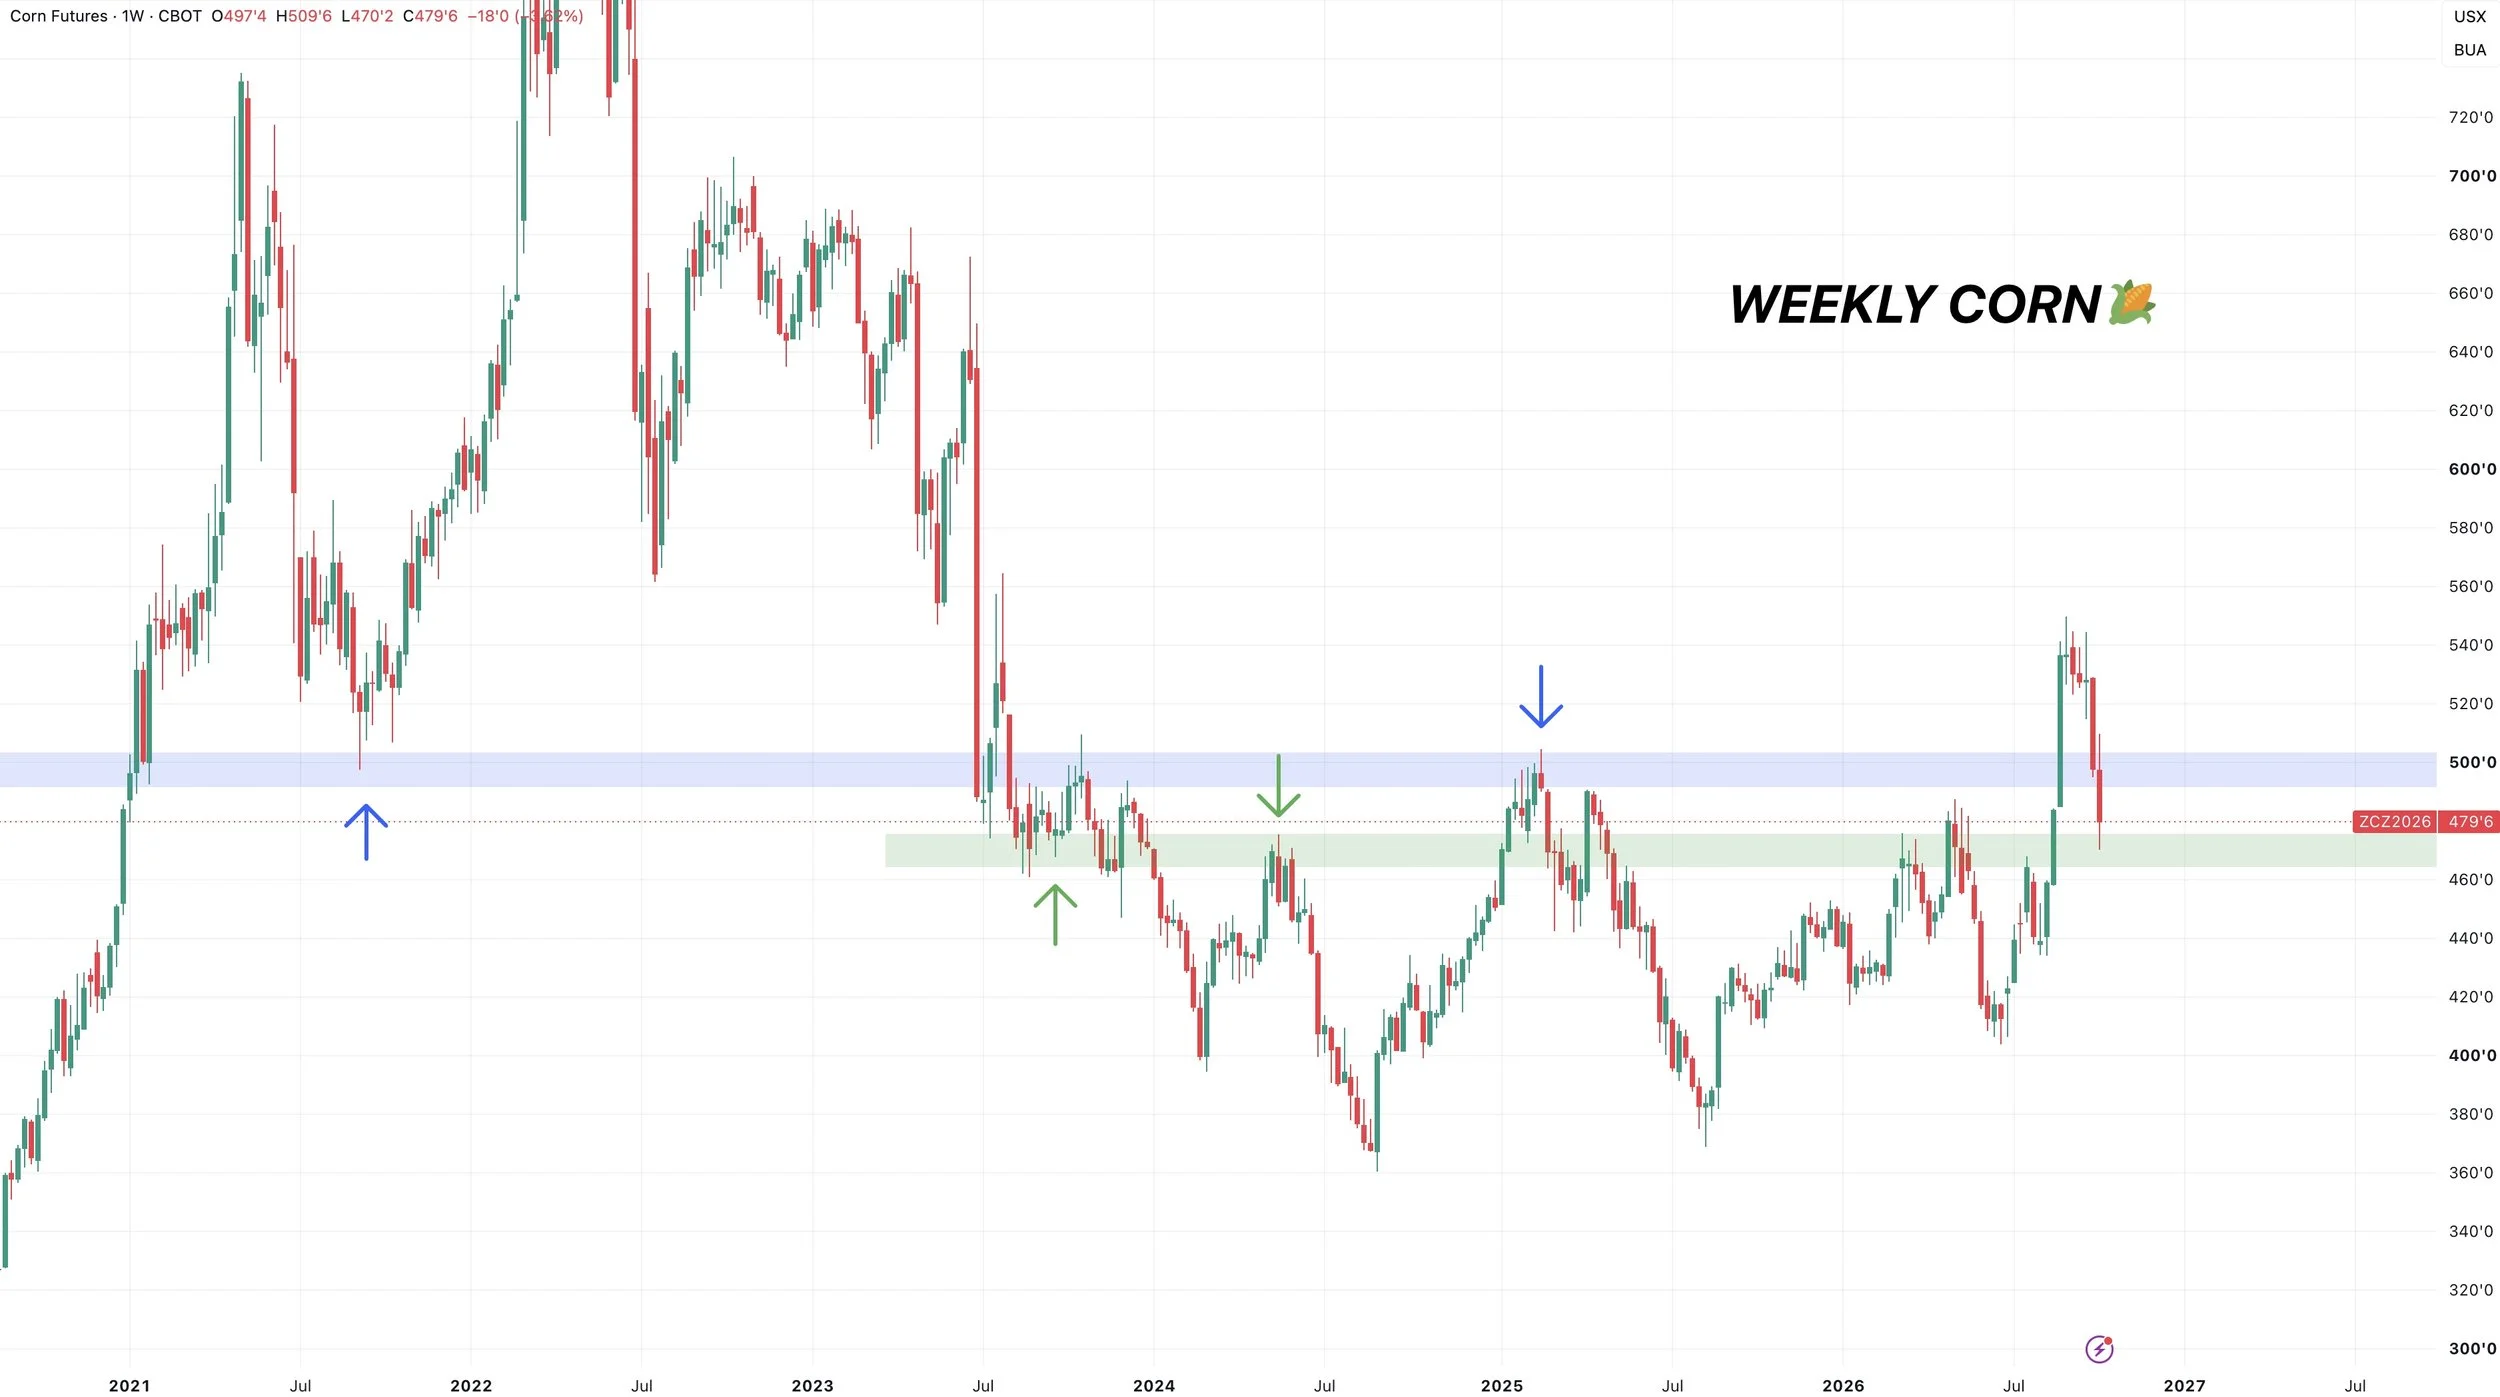
If you zoom out, the corn chart still does not look all that bad.
We failed to turn those 2025 highs into support.
But there are still several levels of support sitting around here.
With the 2023 lows and 2024 highs.
So from a big picture perspective, the trend in corn is not yet "broken".
Corn is still +$1.00 higher than it was at the lows last year. And still over +50 cents off the summer lows.
Corn + Beans + Wheat Weekly Chart:
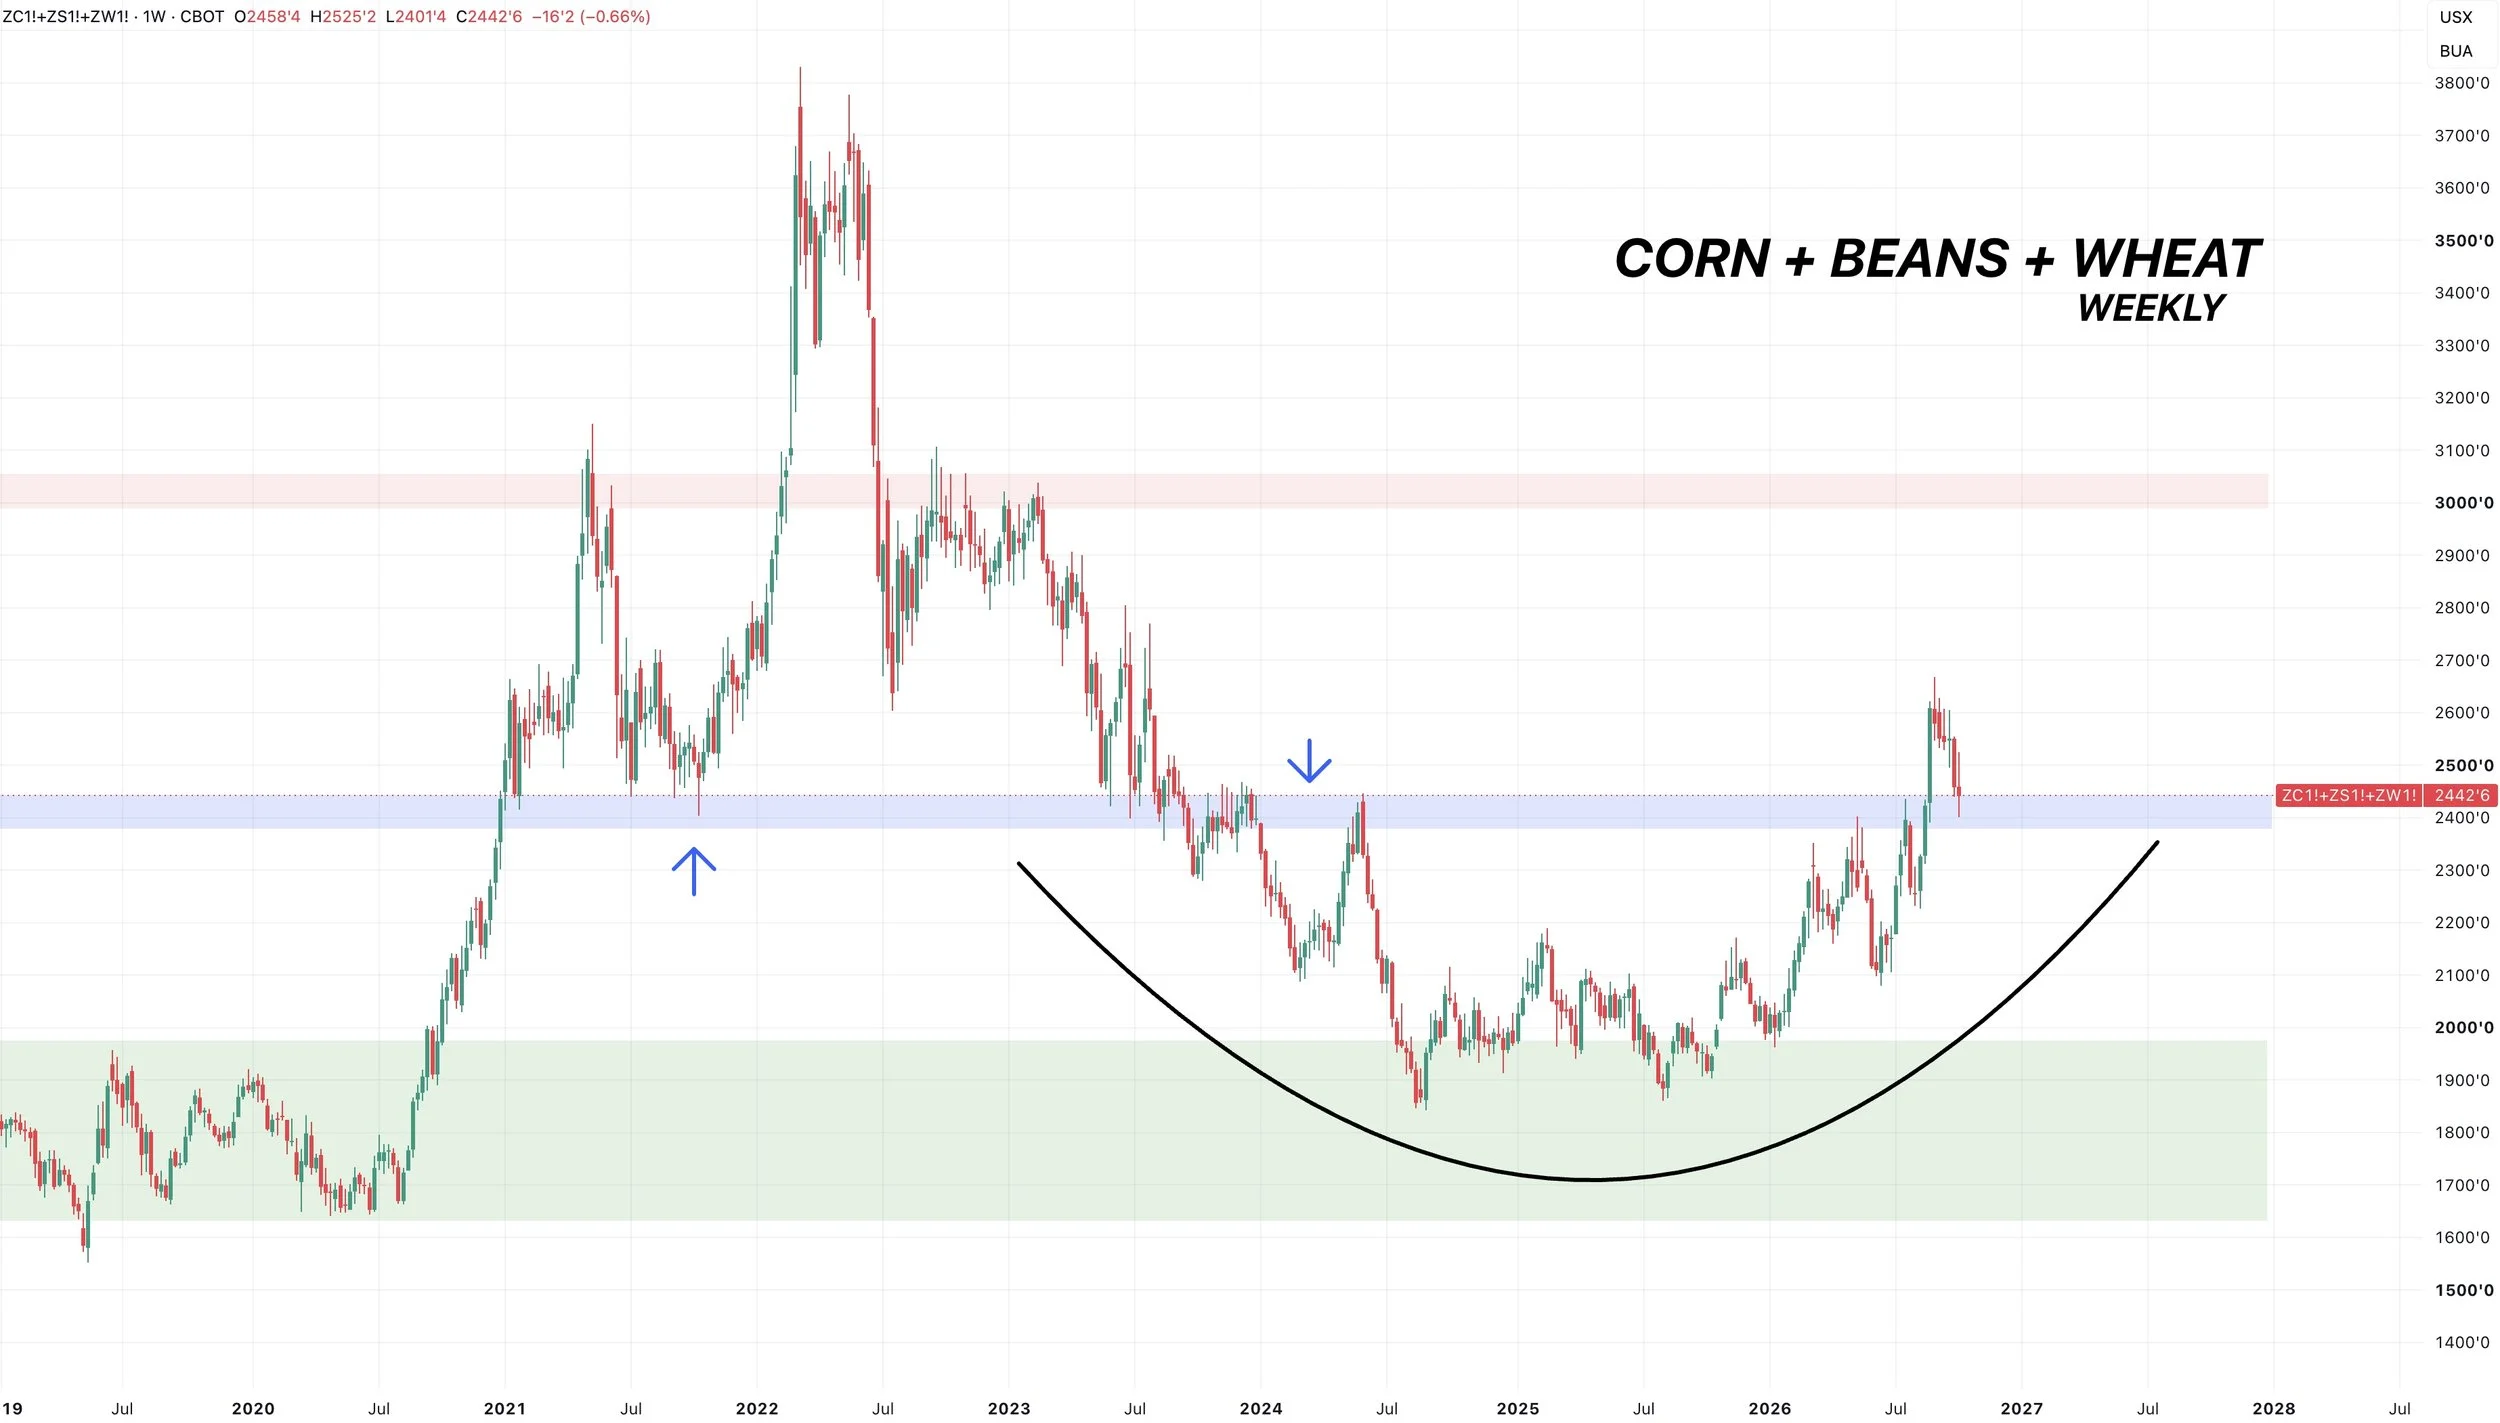
Here is a chart that combines corn, soybean, and wheat prices which I've shown before.
I am a big chart guy. As price action often trumps everything and gives us a story.
I'm sure everyone is all of the sudden super bearish on grains now.
But this chart currently still does not look very bearish on a longer time frame approach.
We are still re-testing those major point of breakout we had earlier this year.
If we start to break below that big support and resistance flip, then you could be concerned. But for now, it's sitting at support.
Soybeans
Friendly Seasonals:
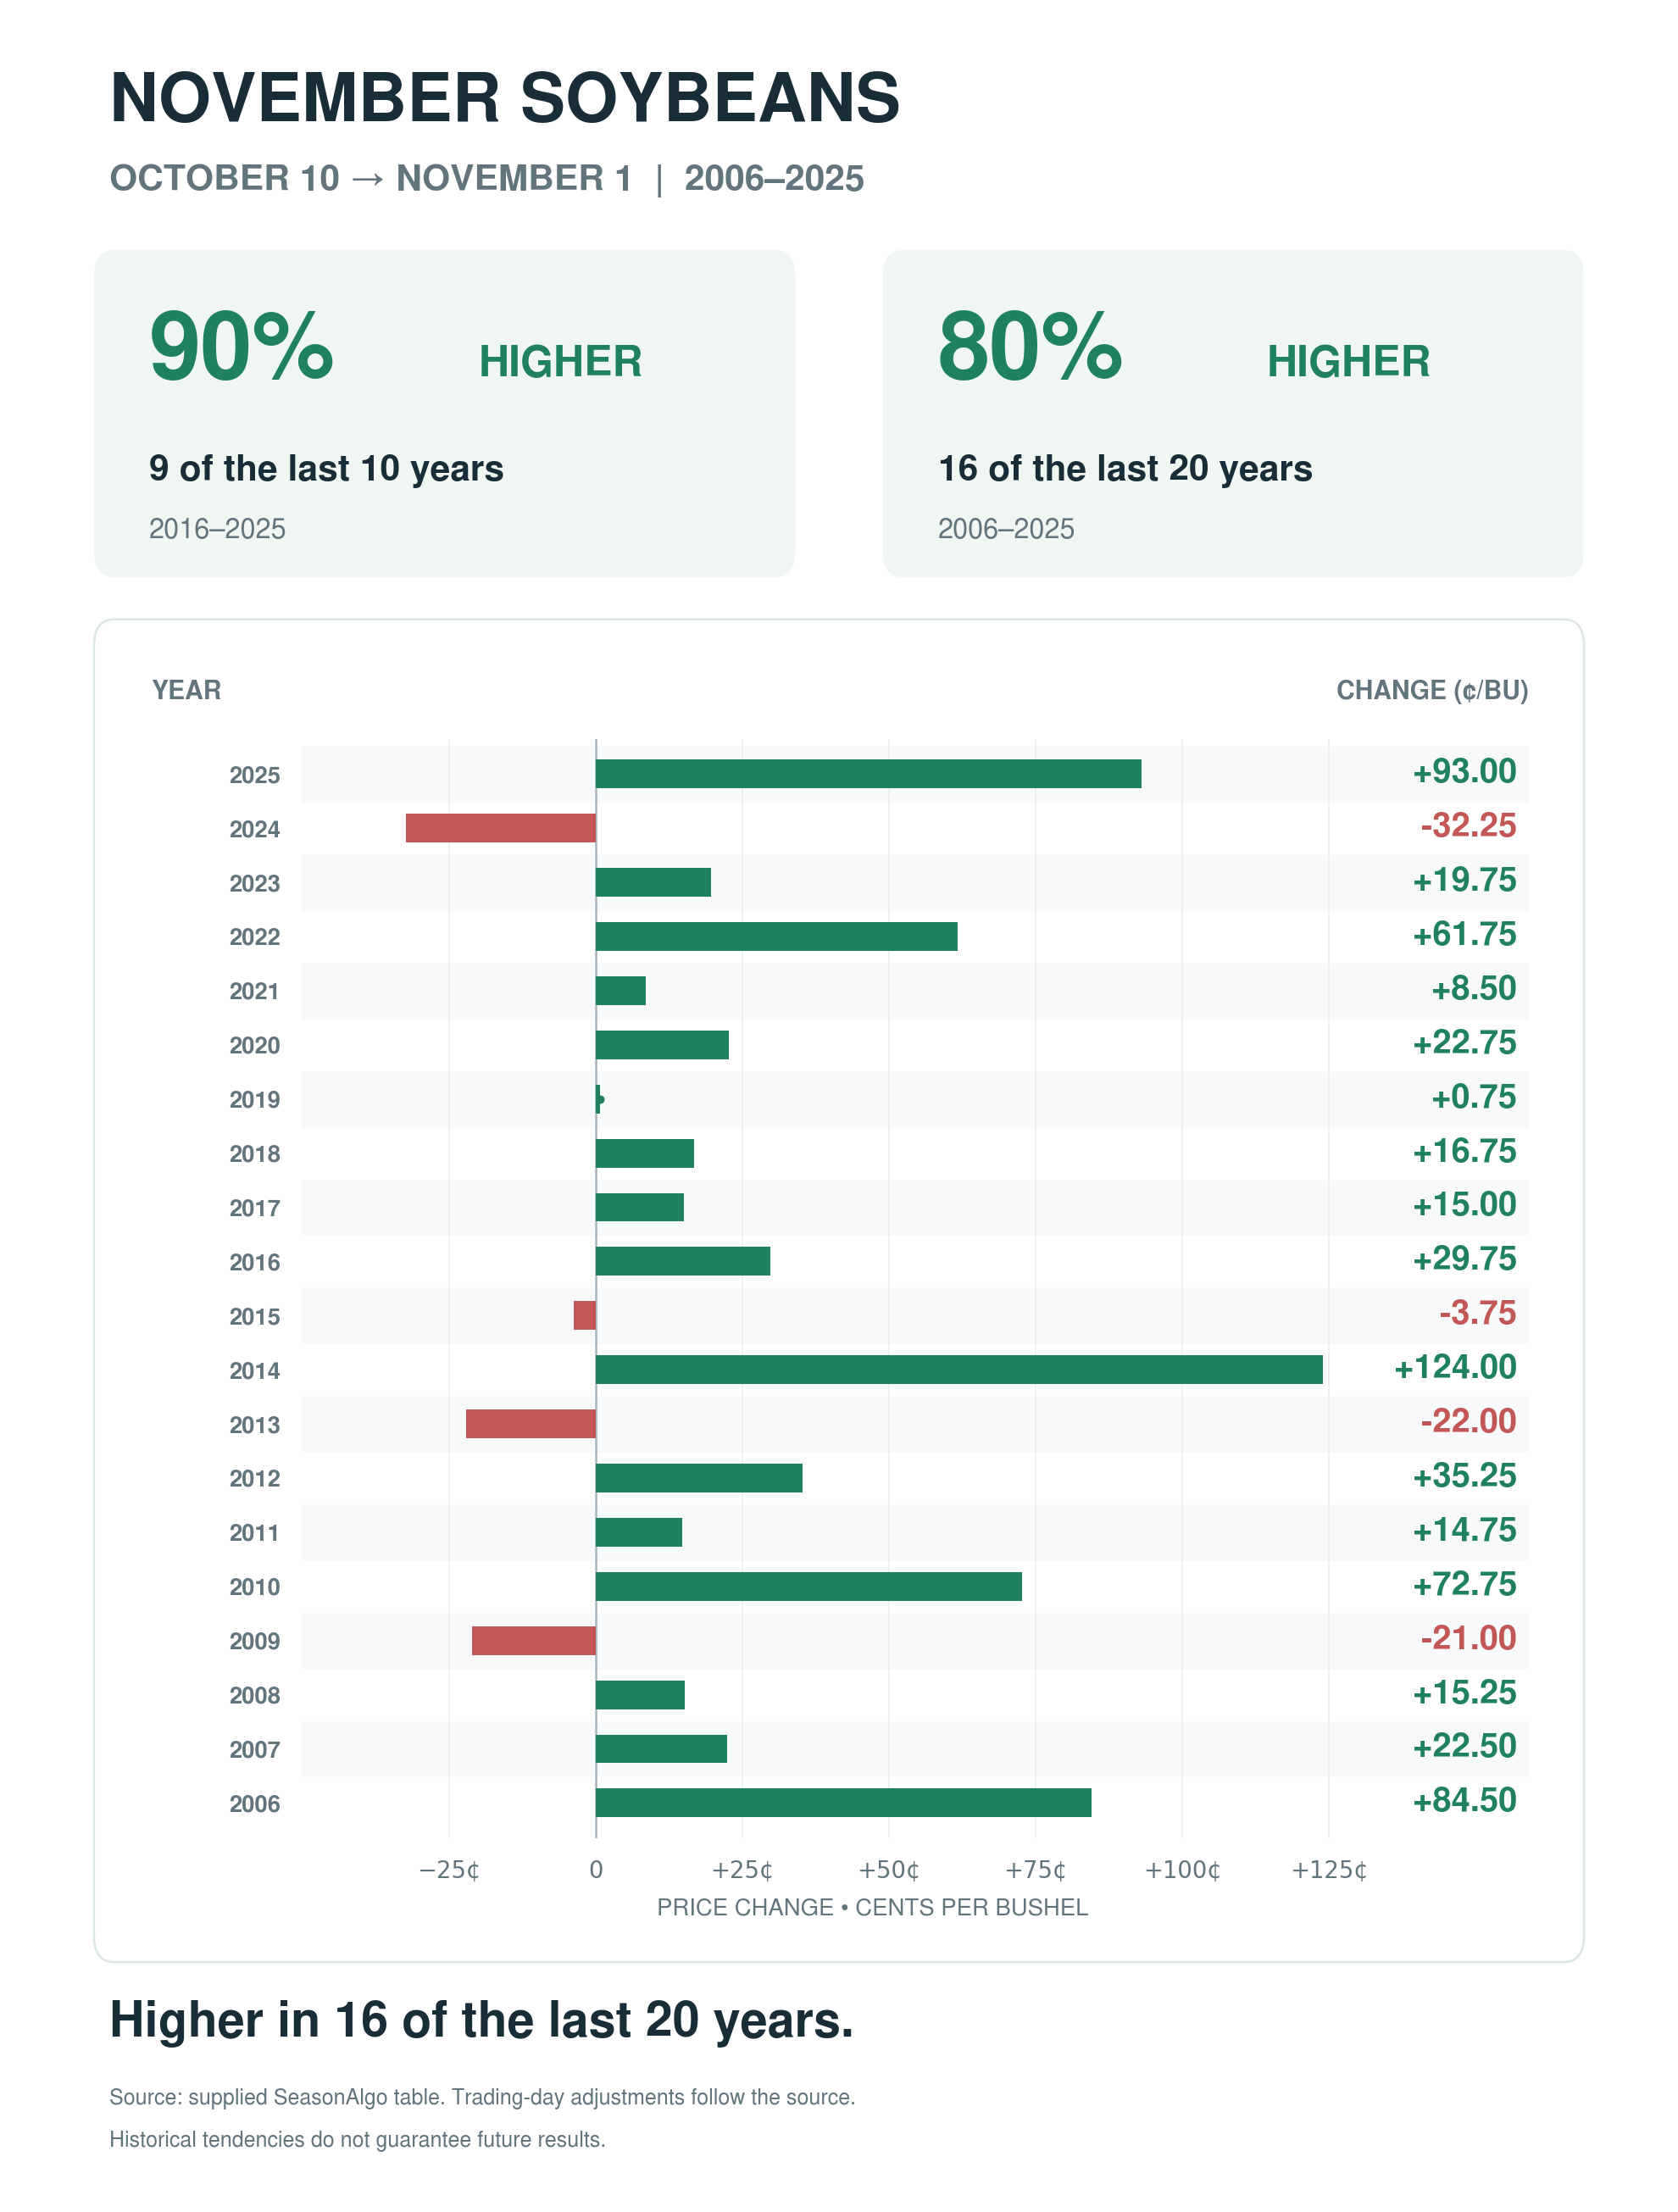
Something I wanted to note is that soybeans are approaching that seasonally friendly time frame.
From October 10th to November 1st soybeans have traded higher the last 9 of 10 years.
Higher the last 16 of 20 years (80% of the time).
Soybean Charts
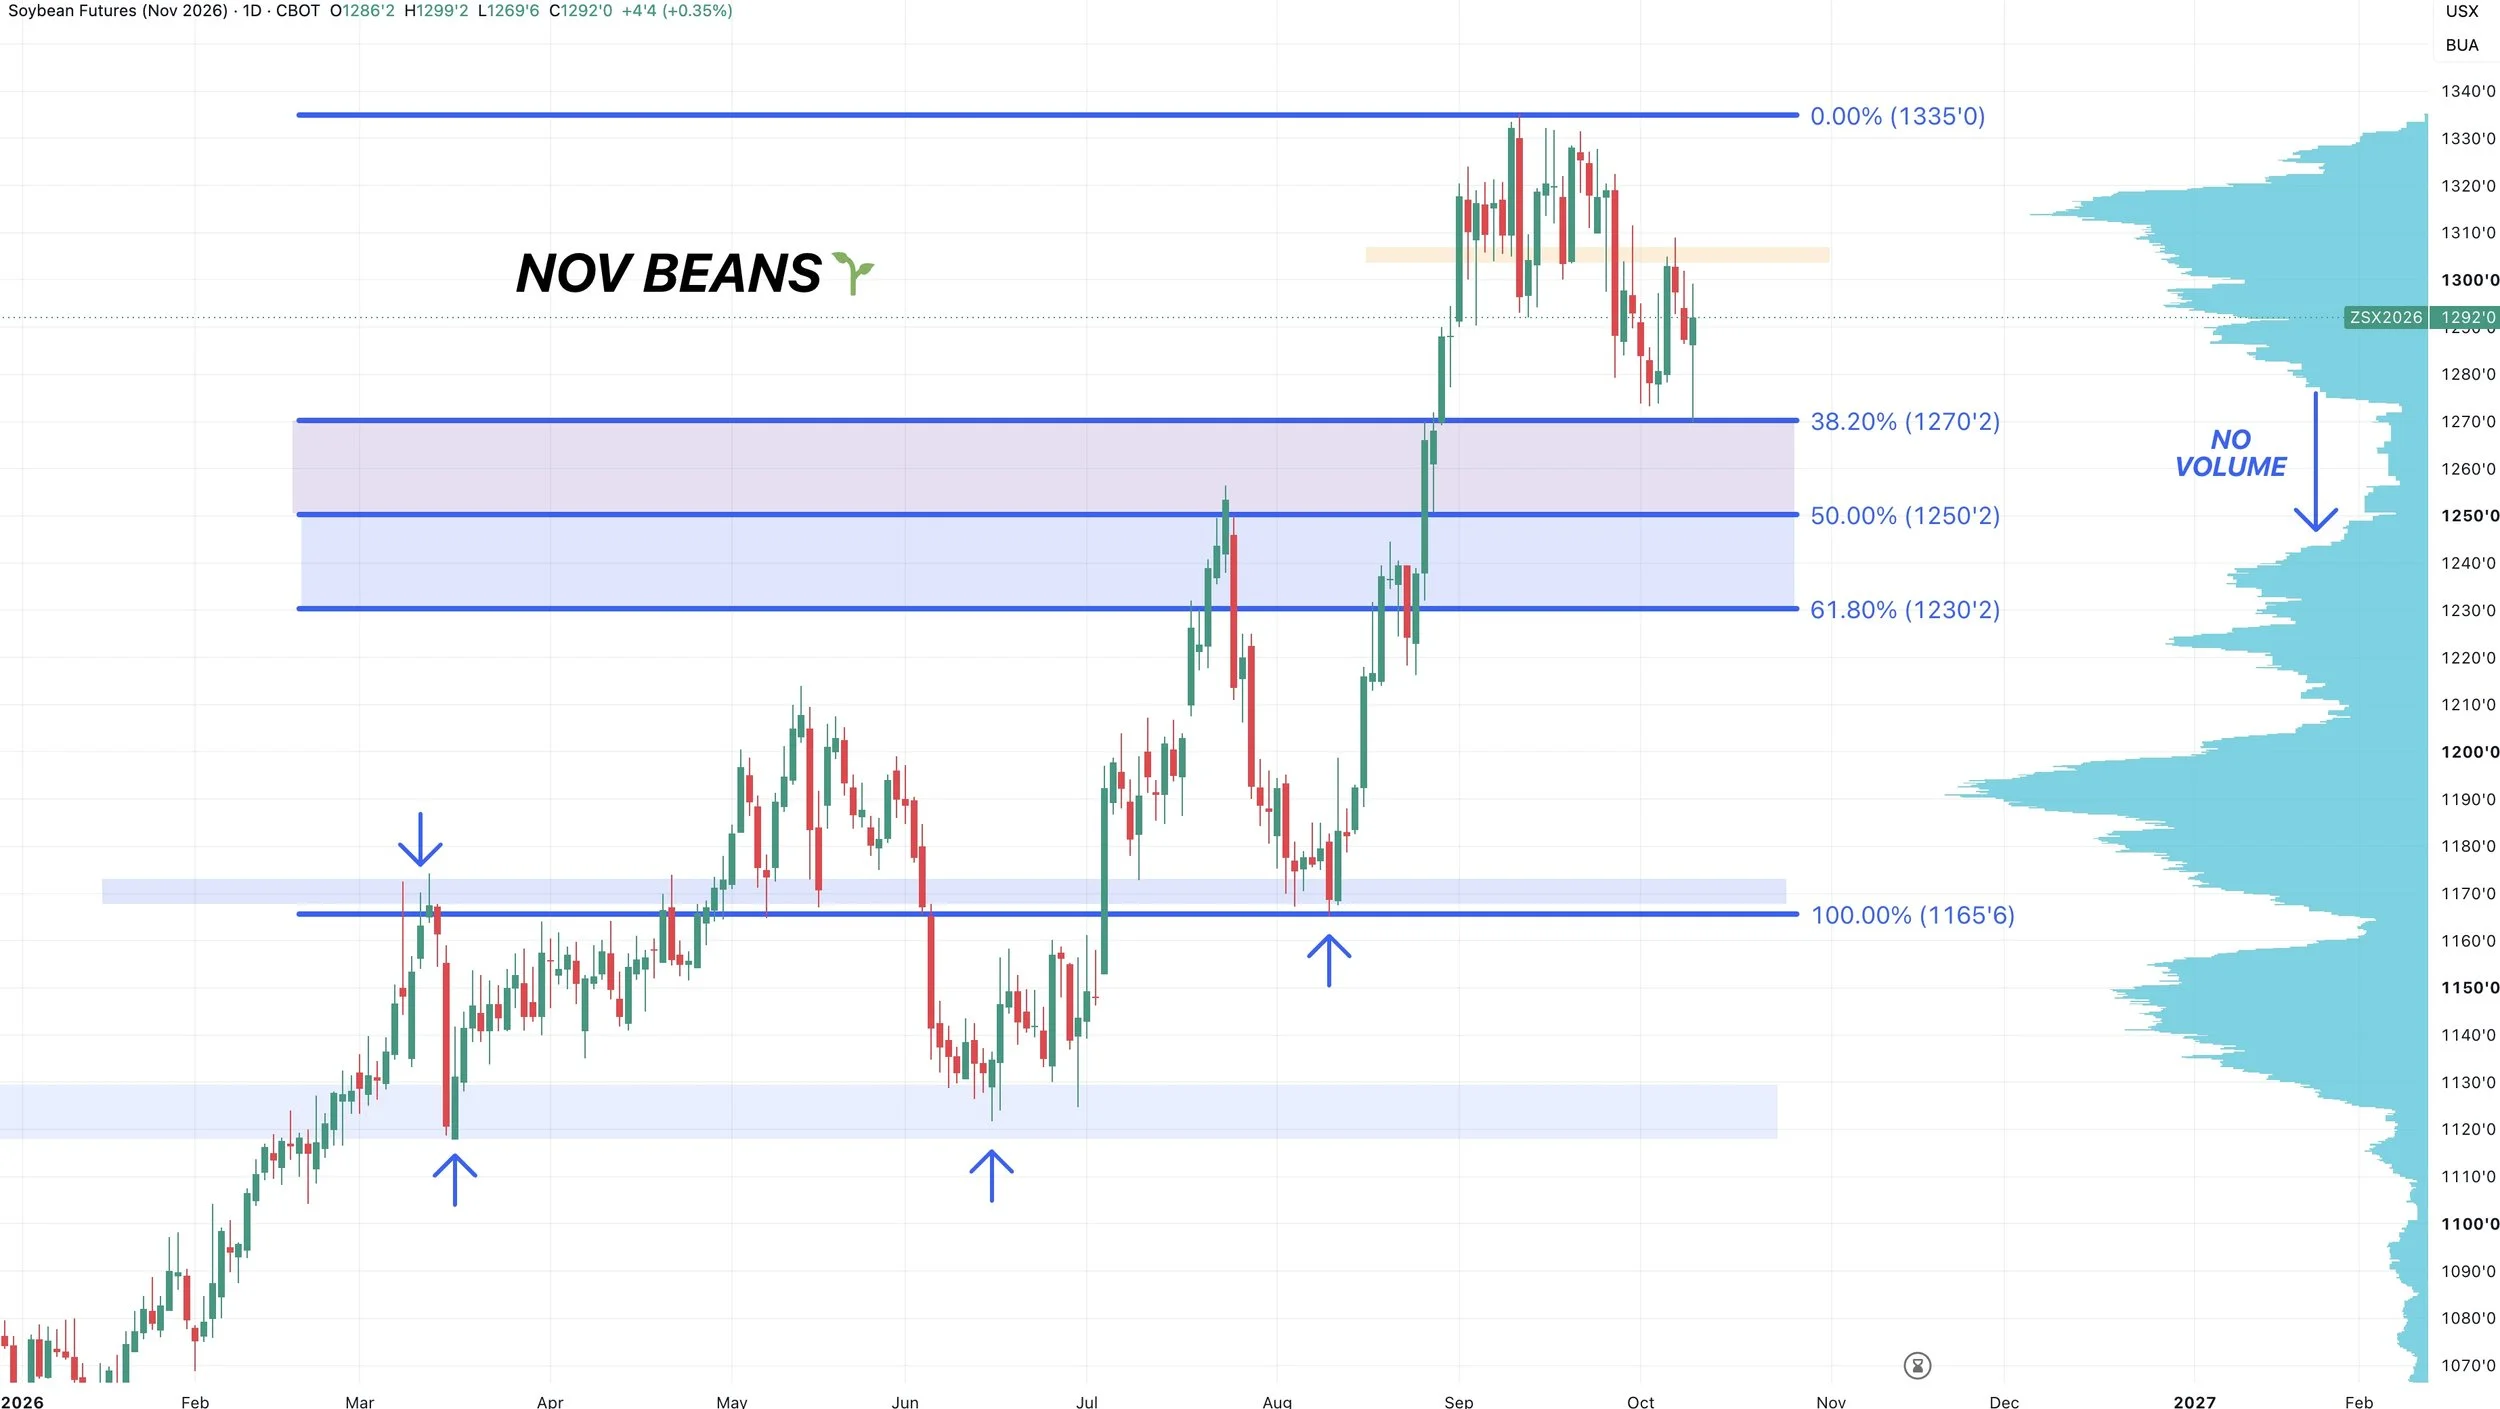
Nov Beans Chart:
You cannot hate the price action in soybeans today.
We were down -18 cents after the report. We then clawed back and finished the day higher.
We finally came down and tagged the first retracement level. Which was the 38.2% level down to the August lows. Which is "technically" deep enough for the correction to end.
However it's still going to be a key level to watch.
If we cannot hold that level, there is zero support or volume below until down to that 50% retracement level at $12.50 where the volume picks back up.
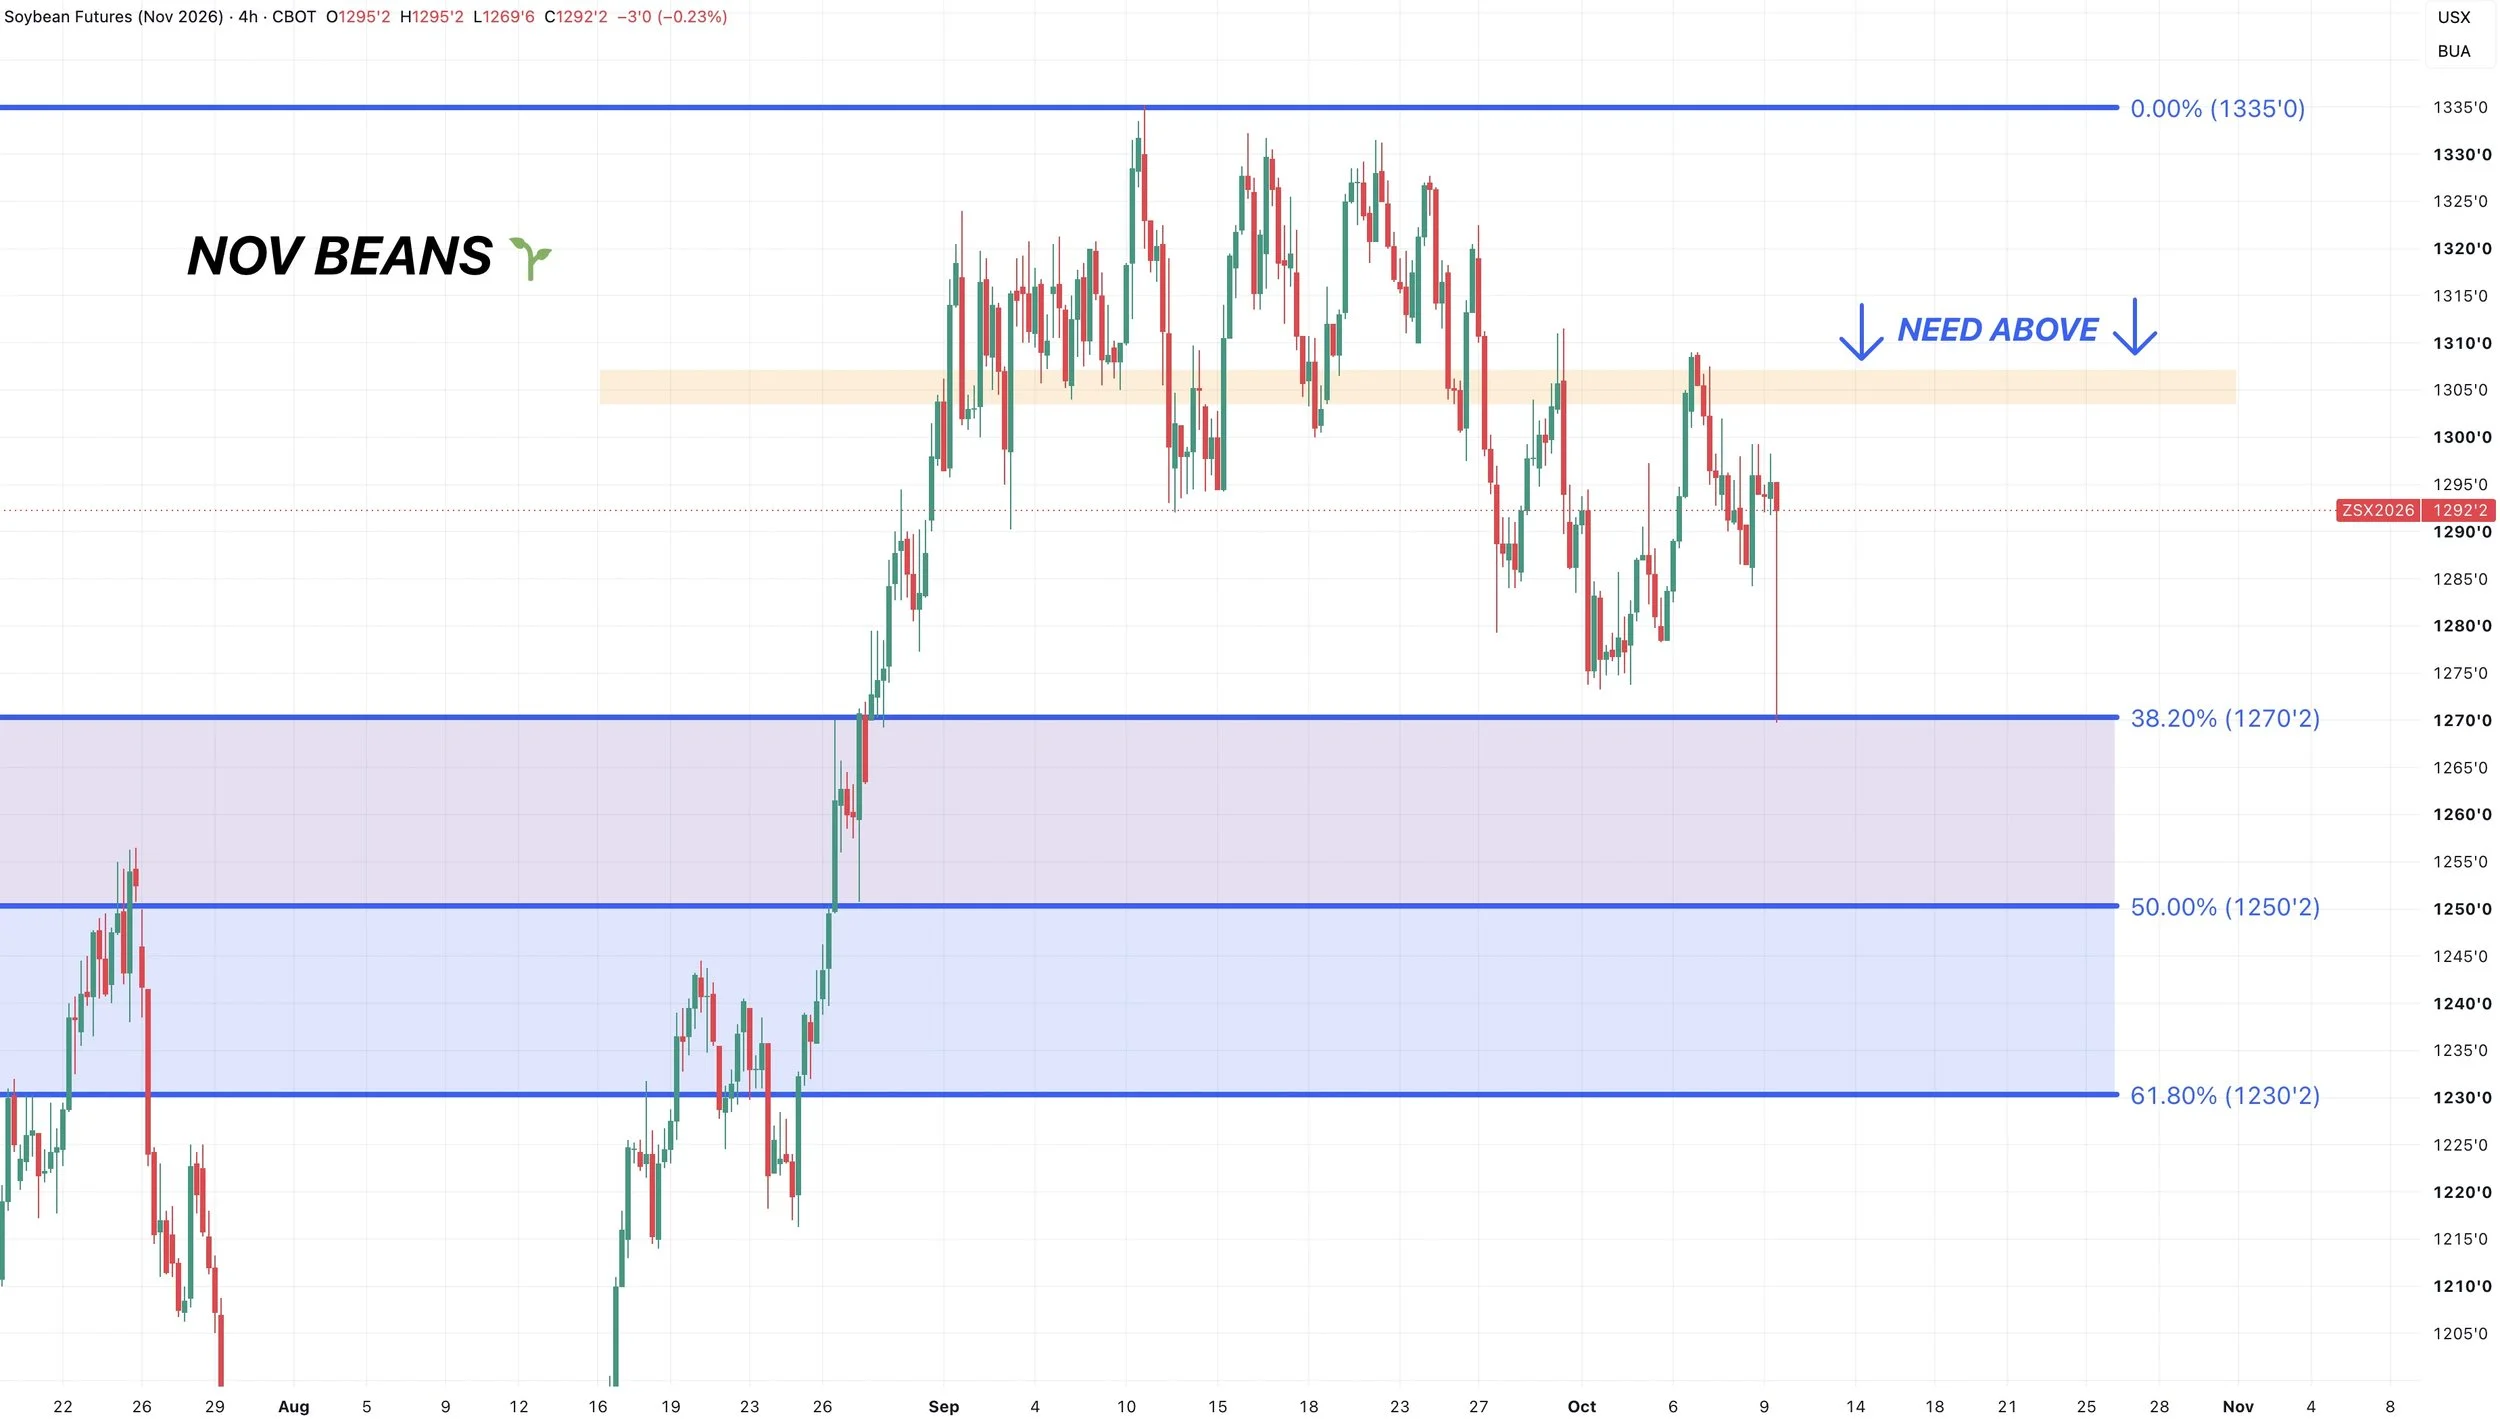
Here is the 4-hour chart.
We still cannot be convinced the bottom is in until we break above that key resistance.
We were trapped in a sideways range for almost a month.
A week or so ago we broke below the bottom of the range and support. We then came back up to re-test that old support before finding resistance and rejecting.
Then this week we also came right back up to that level before once again rejecting right off that old support. So it's clear resistance.
That is the level to watch. If you are able to break above and get into that old range, you can be more confident we've put in some lows and are ready for the next leg.
Until that happens, we are essentially range bound between that old support and today's lows.
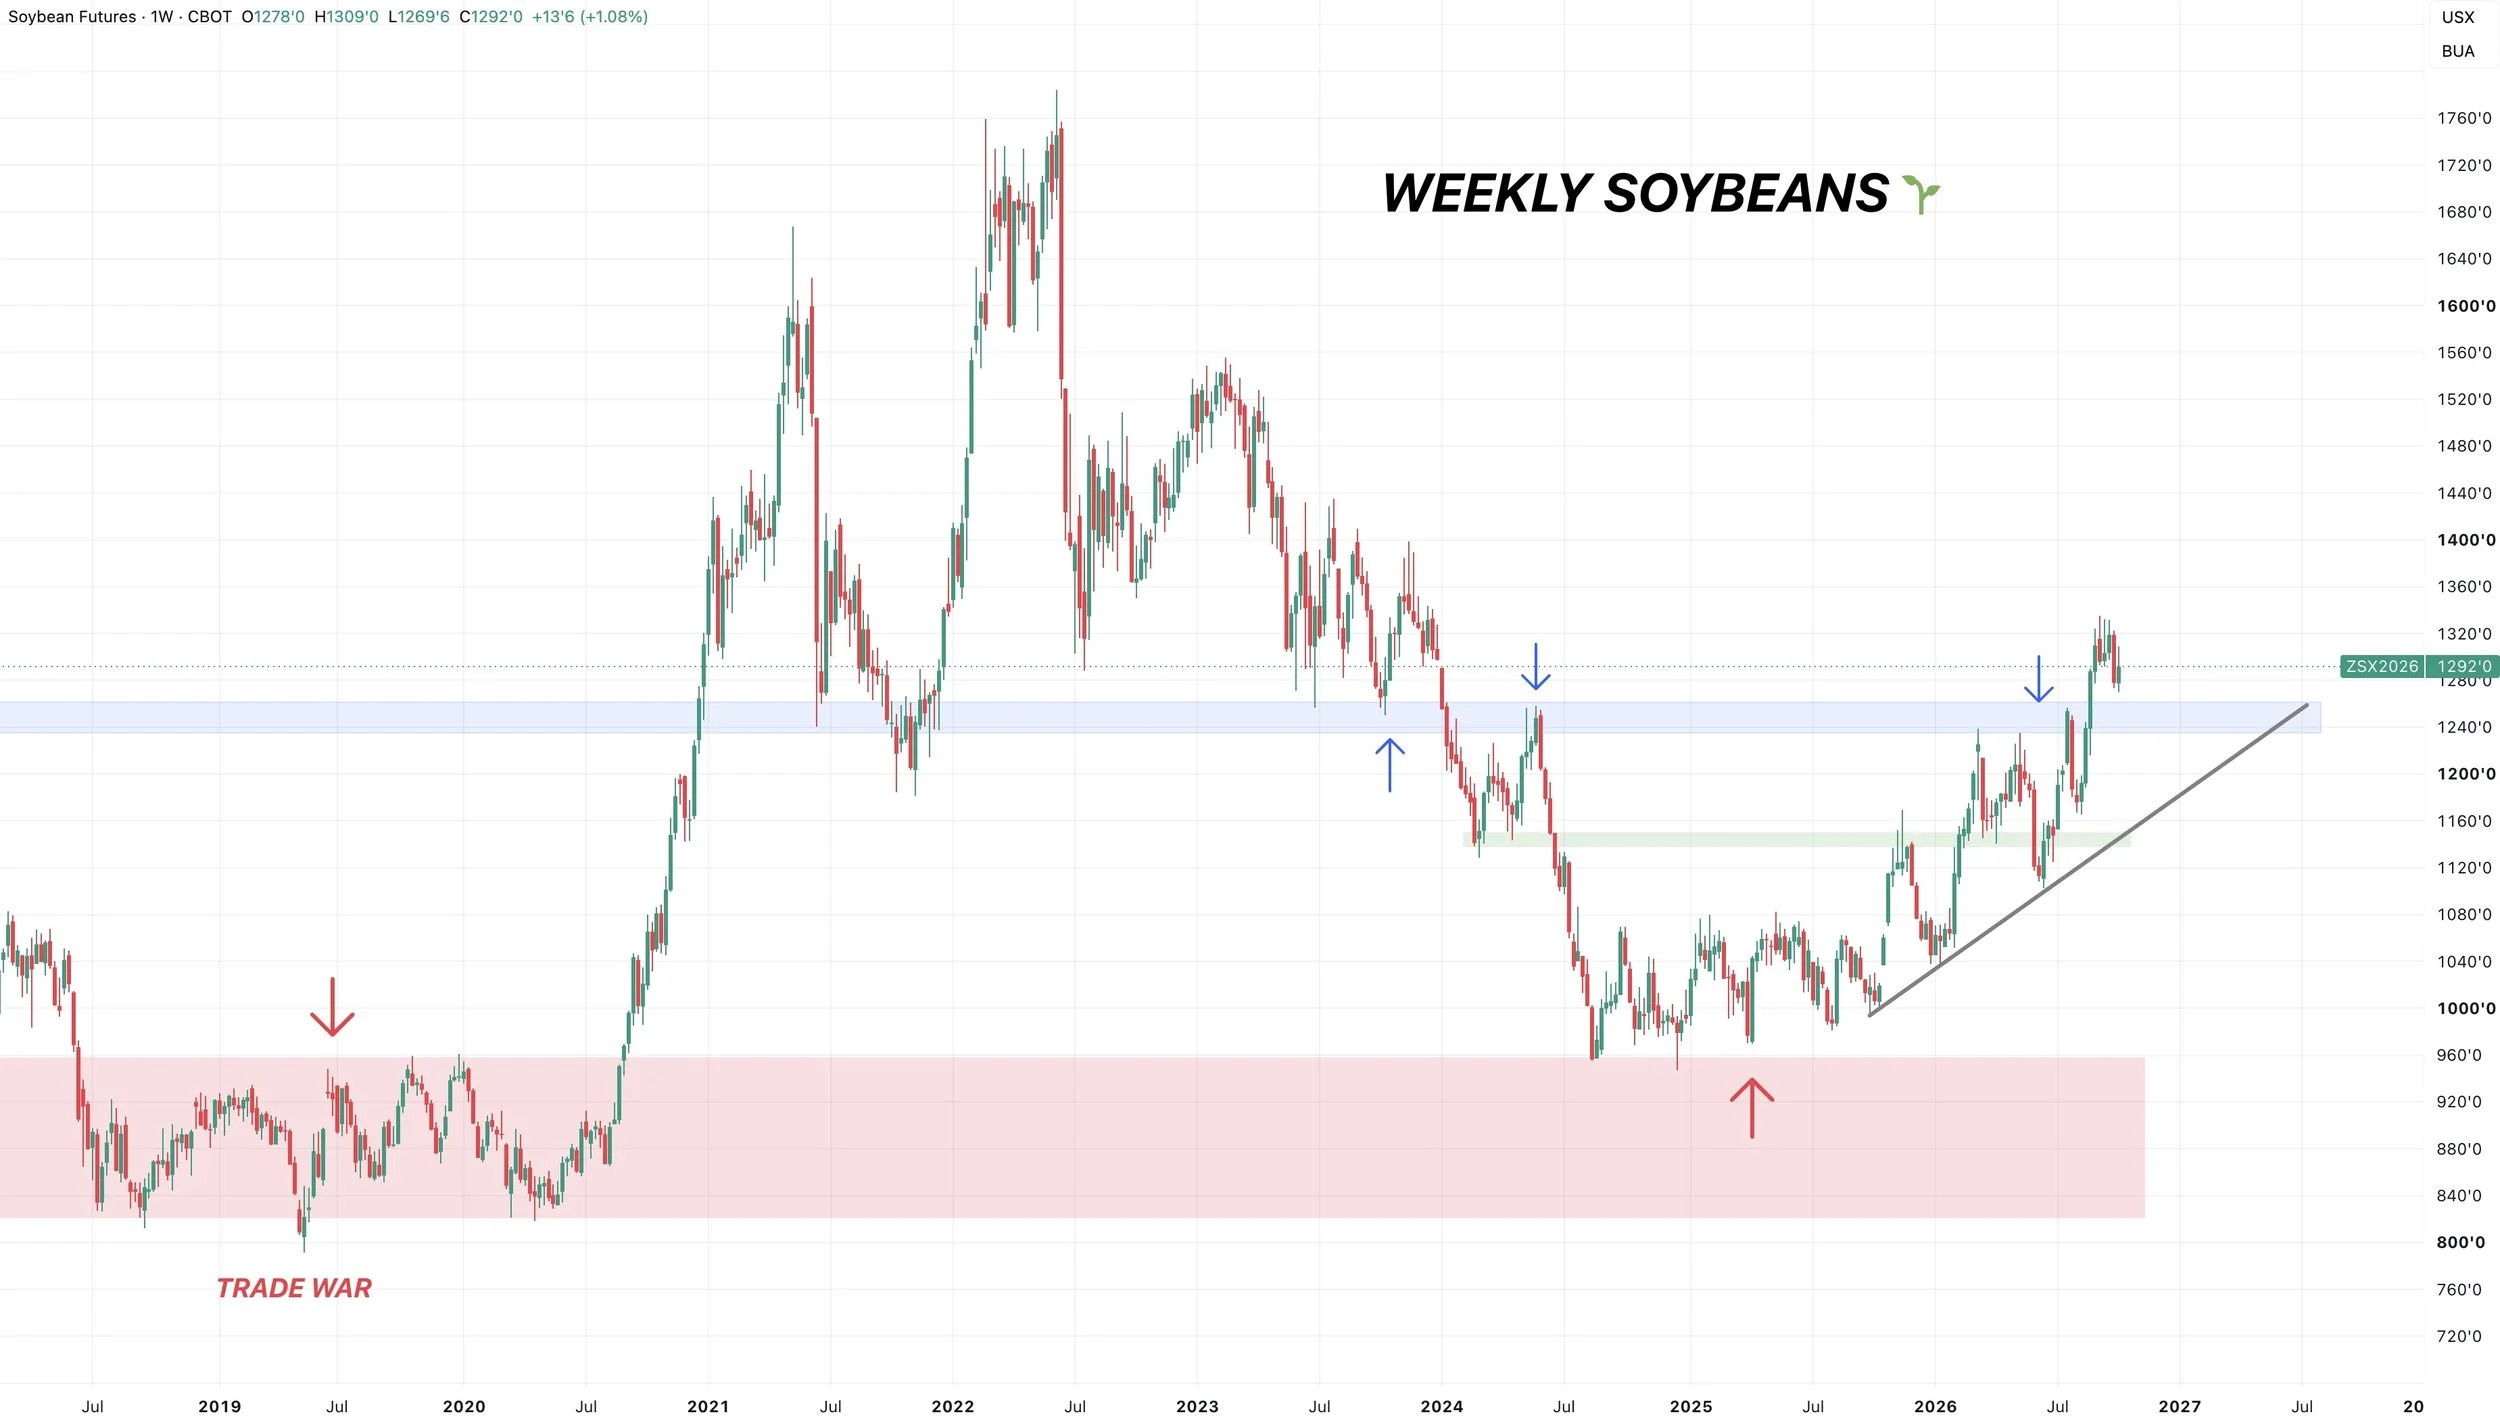
Weekly Chart: No Concerns
If you zoom out, there are still zero concerns with soybeans.
We have clear trend that is higher.
We broke key resistance.
We could drop all the way down to $12.30 and it would still be viewed as a simple re-test.
Wheat
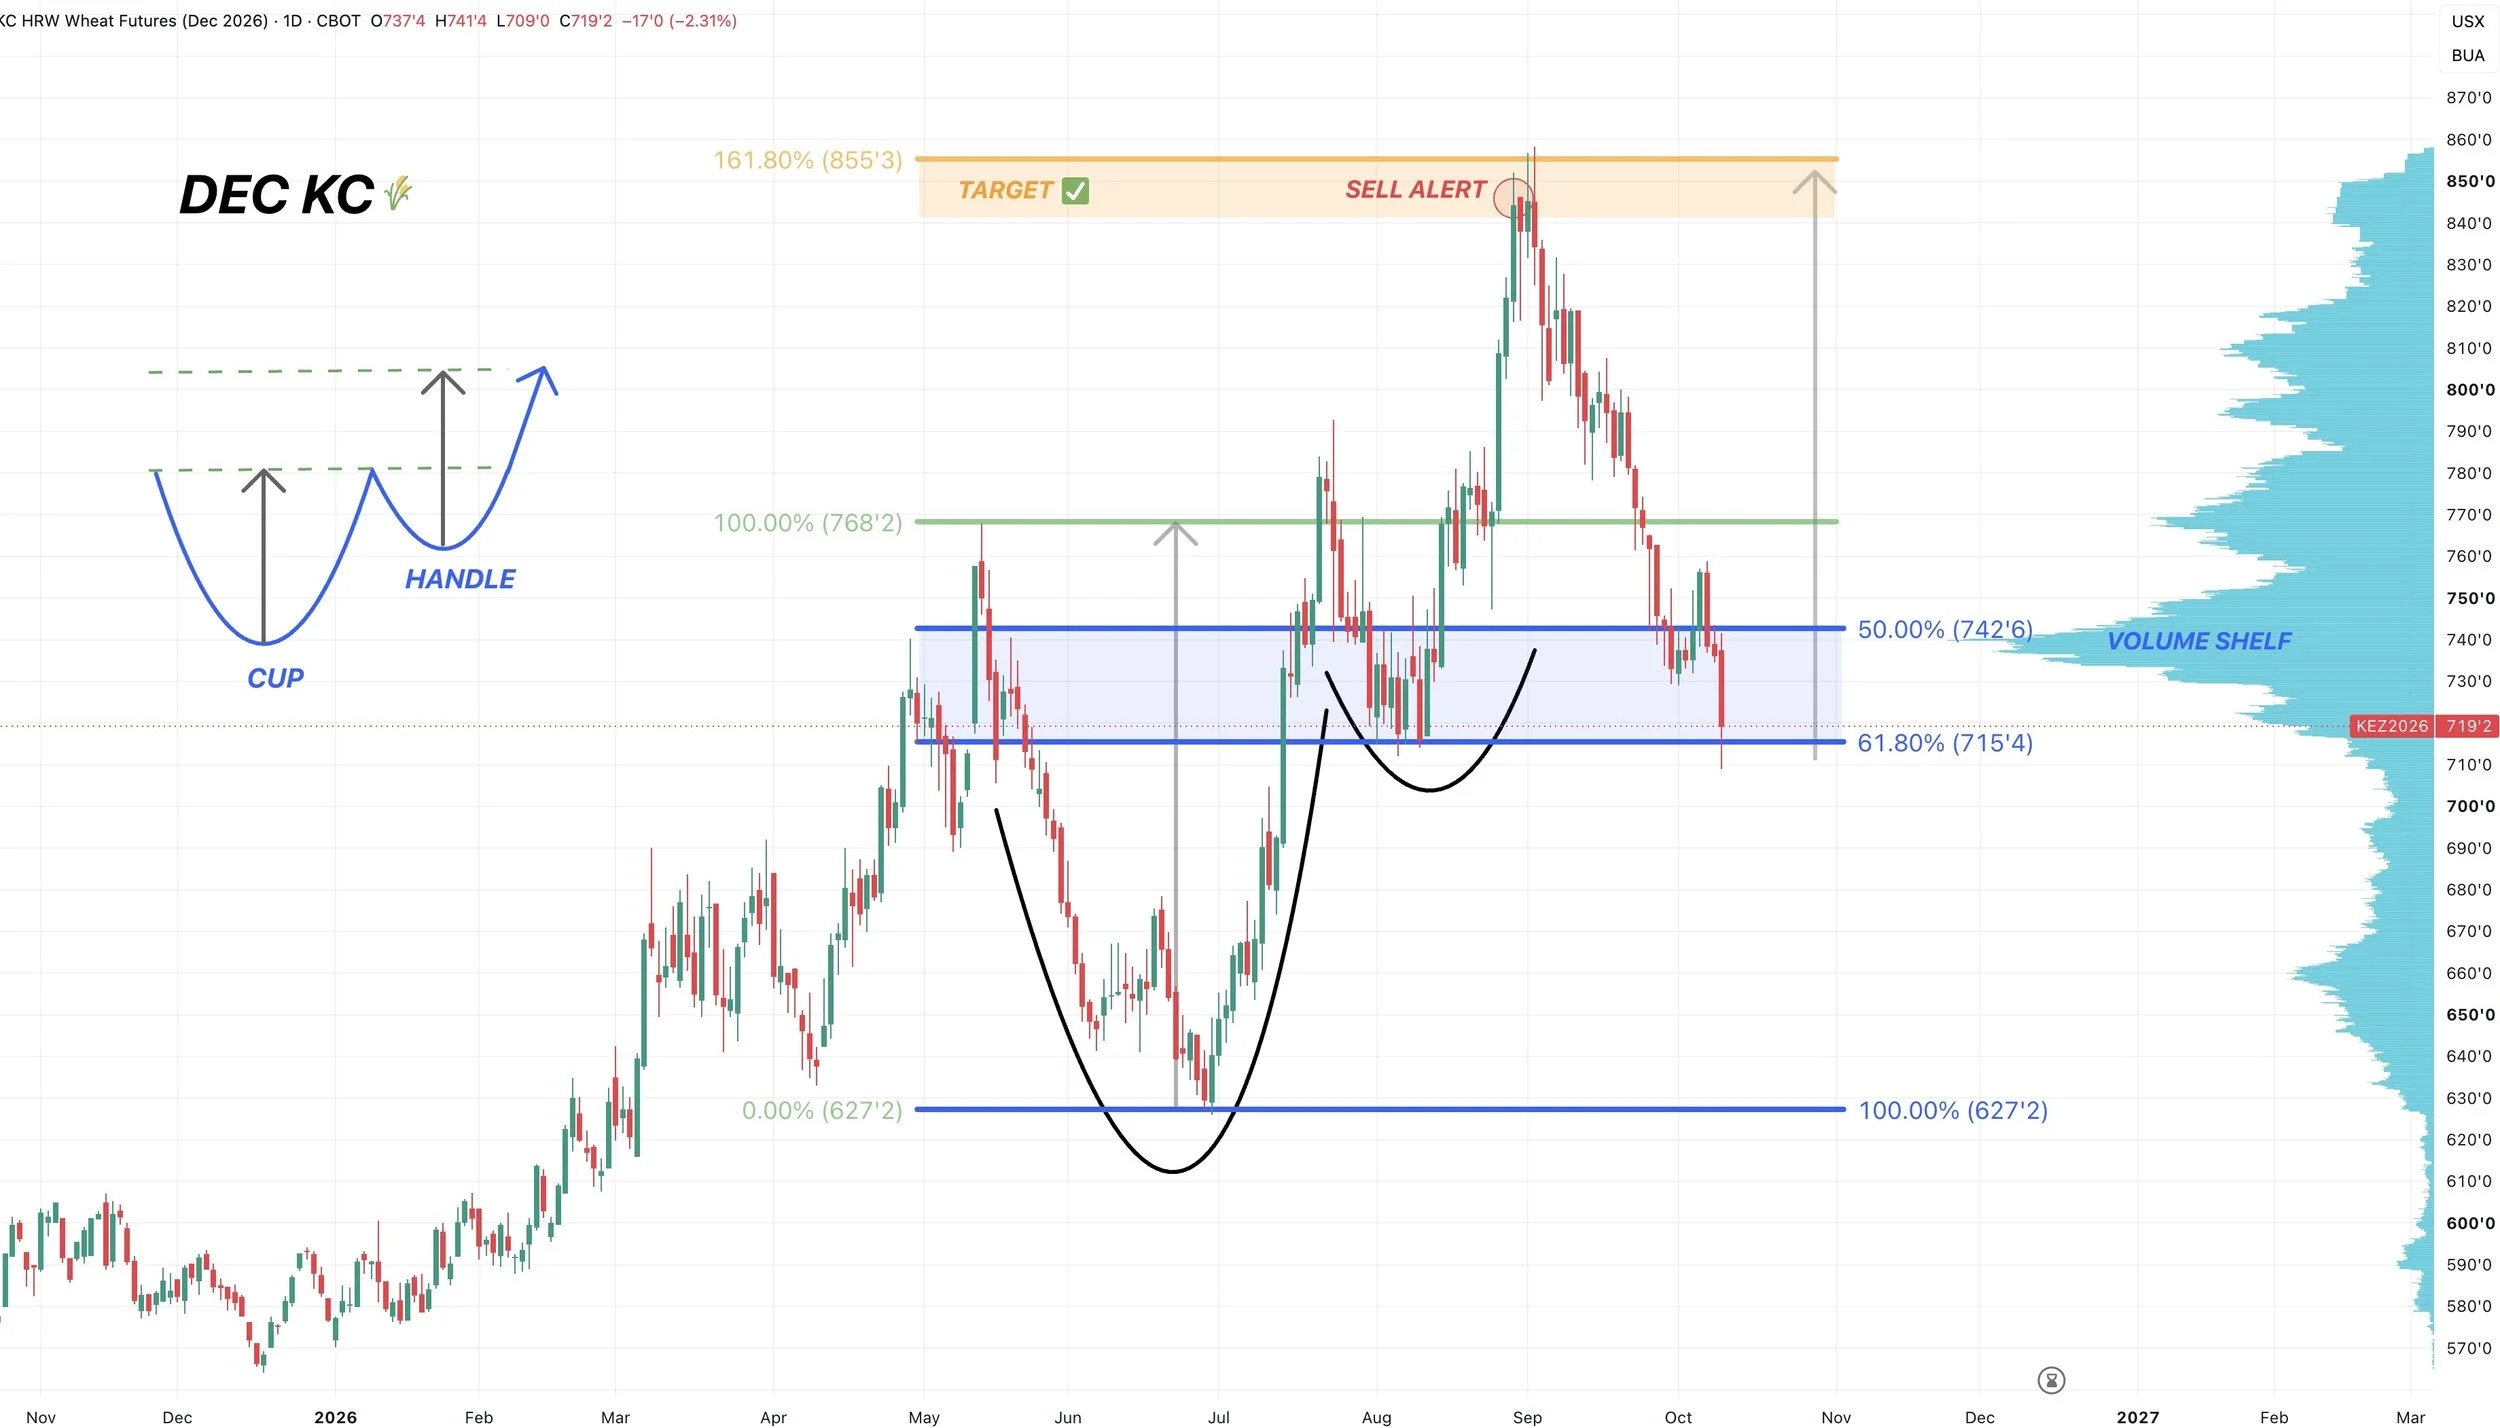
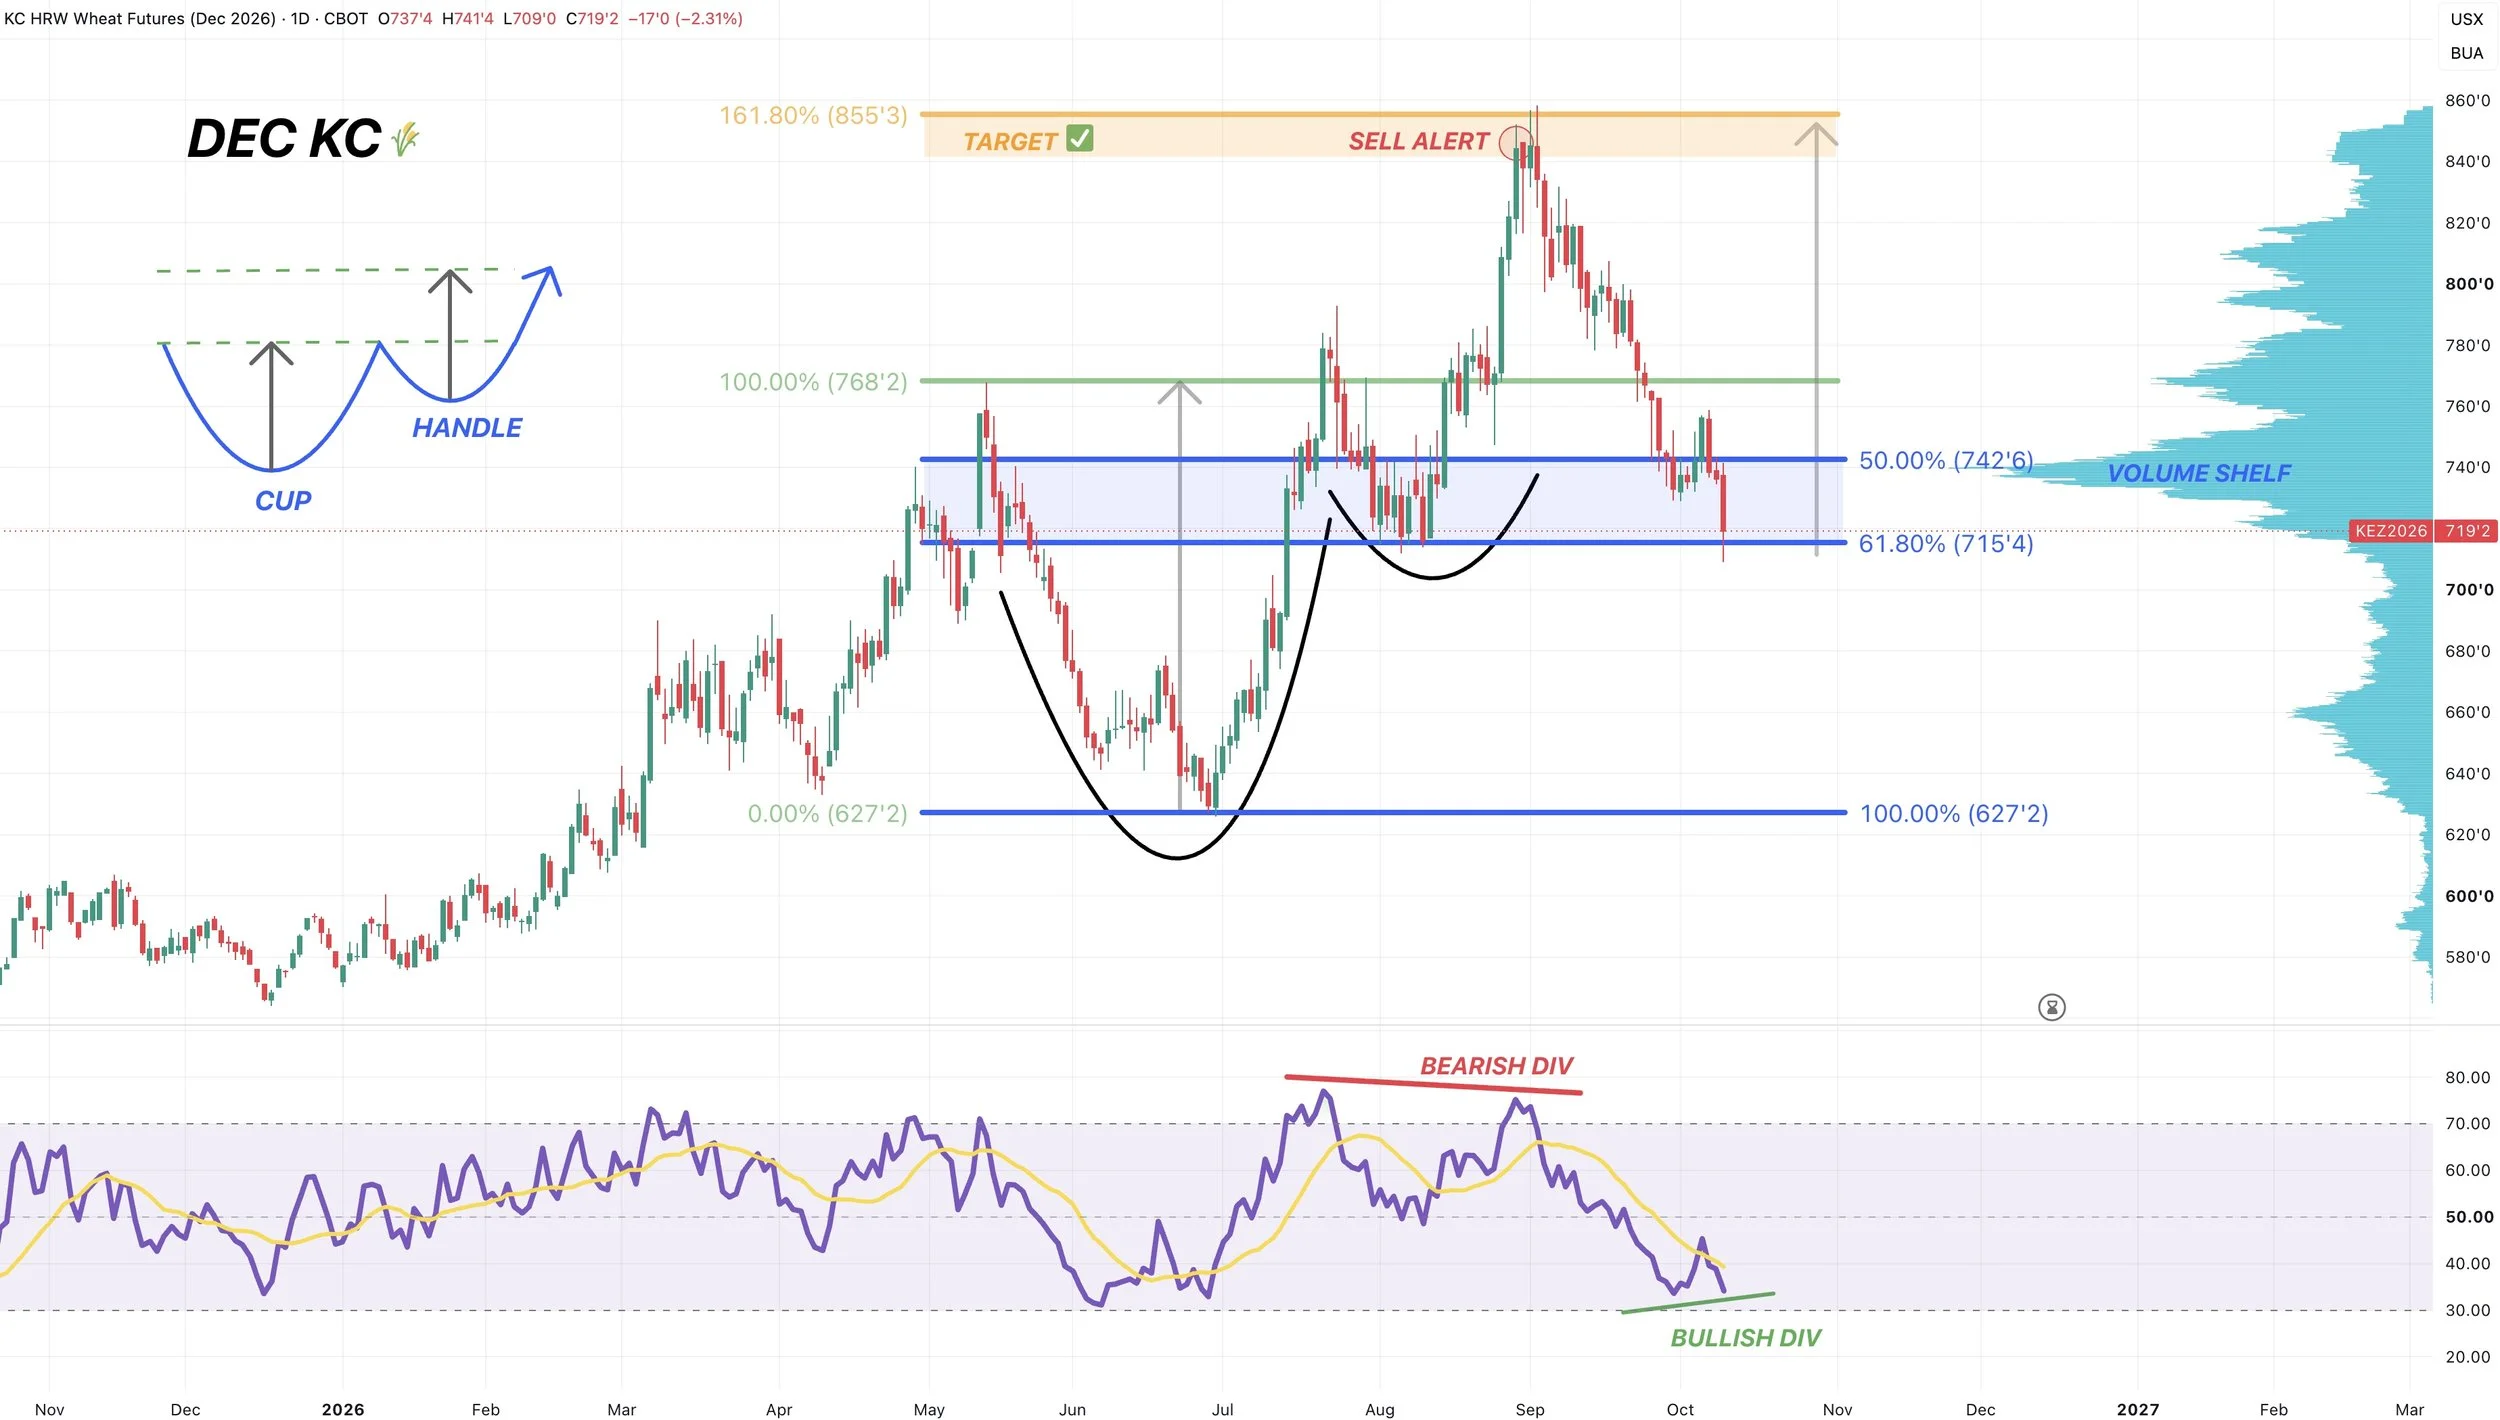
Dec KC Chart: Major Level
Wheat is still sitting at support despite the pullback the last few days.
We are still sitting in the golden zone down to the June lows.
We hit the 61.8% retracement today before closing nicely off the lows.
This level is peak volume.
So this is still where we would expect wheat to find some life if it's going to do so.
However.. if we cannot hold this level, it would not be a good sign at all. As there is virtually zero support or volume beneath here. So a break below would offer plenty of downside risk from here.
But for now, it's still viewed as support. If we are going to bounce, we want it to be right about now.
RSI: Bullish Divergence
KC wheat also has some potential bullish divergence on the RSI.
Prices posted new lows.
The RSI has not yet.
We need the RSI to bounce here and post a higher low, if it can do so it's considered bullish divergence and a sign that the downside is potentially getting exhausted.
Which is another possible friendly sign, but we need confirmation first.
Bearish divergence marked the highs and was a reason behind the late August sell alert.
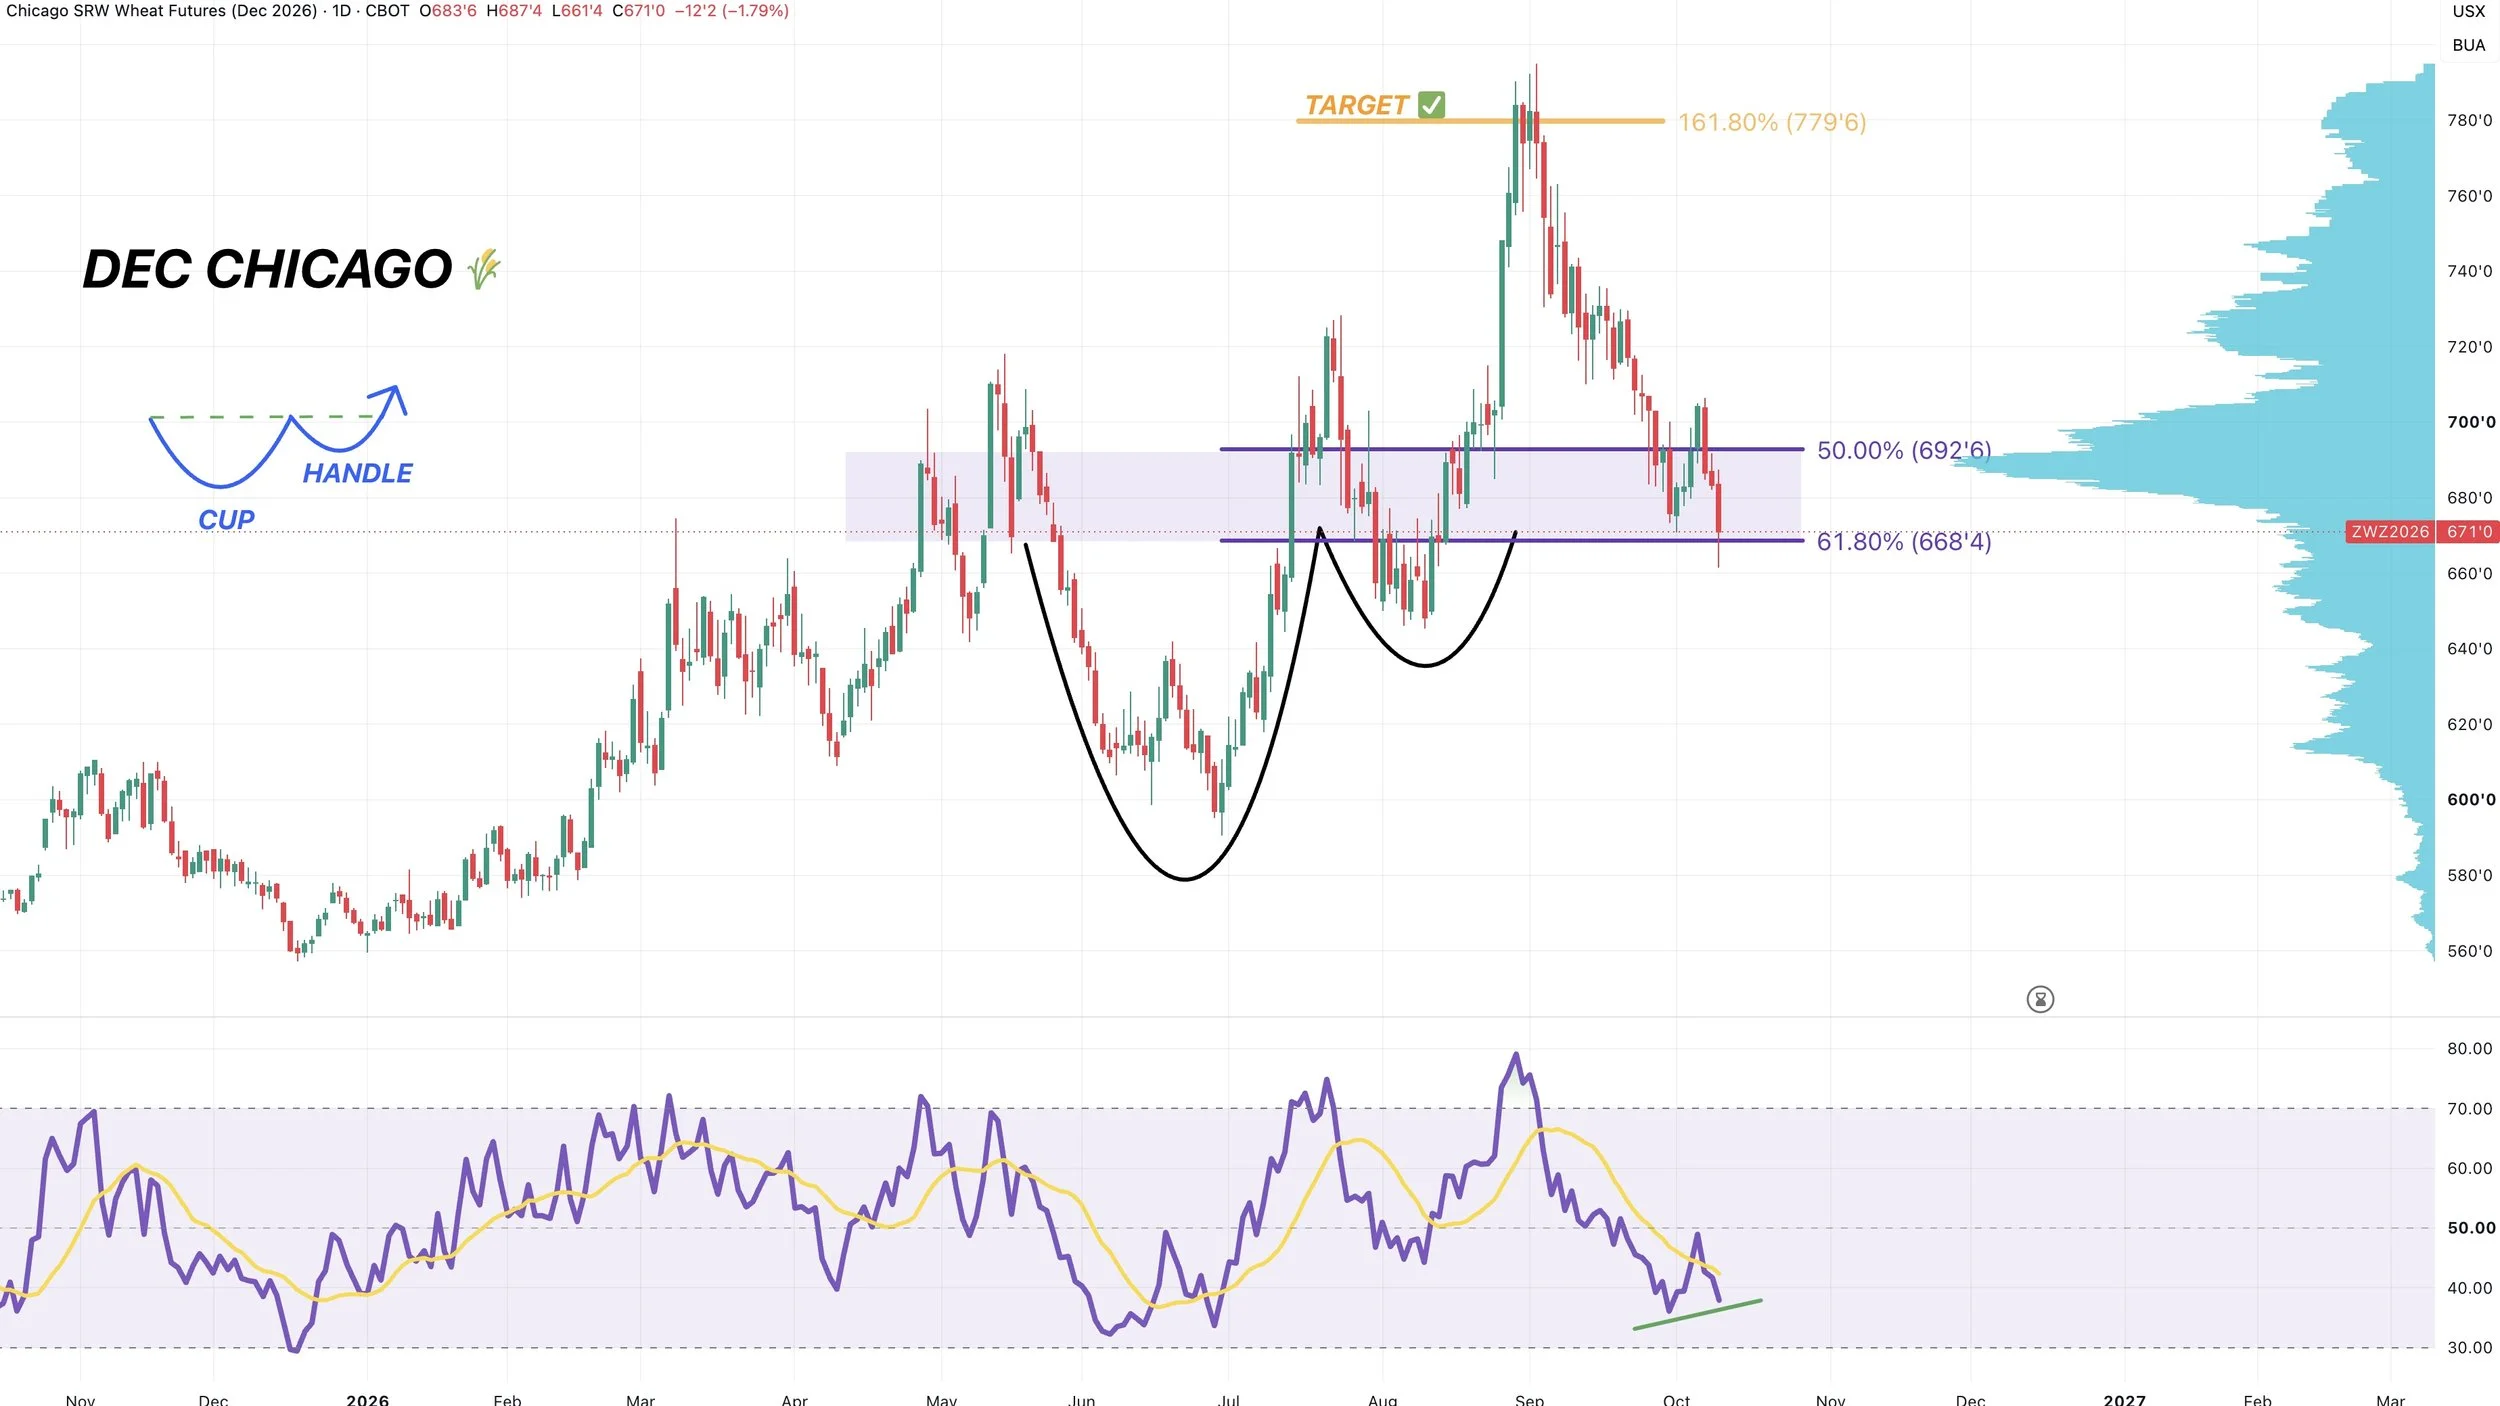
Dec Chicago Wheat Chart: Support & Divergence
Also sitting right at the 61.8% level and peak volume.
An area where we would often expect a correction to end.
We also have bullish divergence on the RSI.
So seeing some potentially good signs in the wheat market, but want to see us hold these big levels here pretty much right now.
Cattle
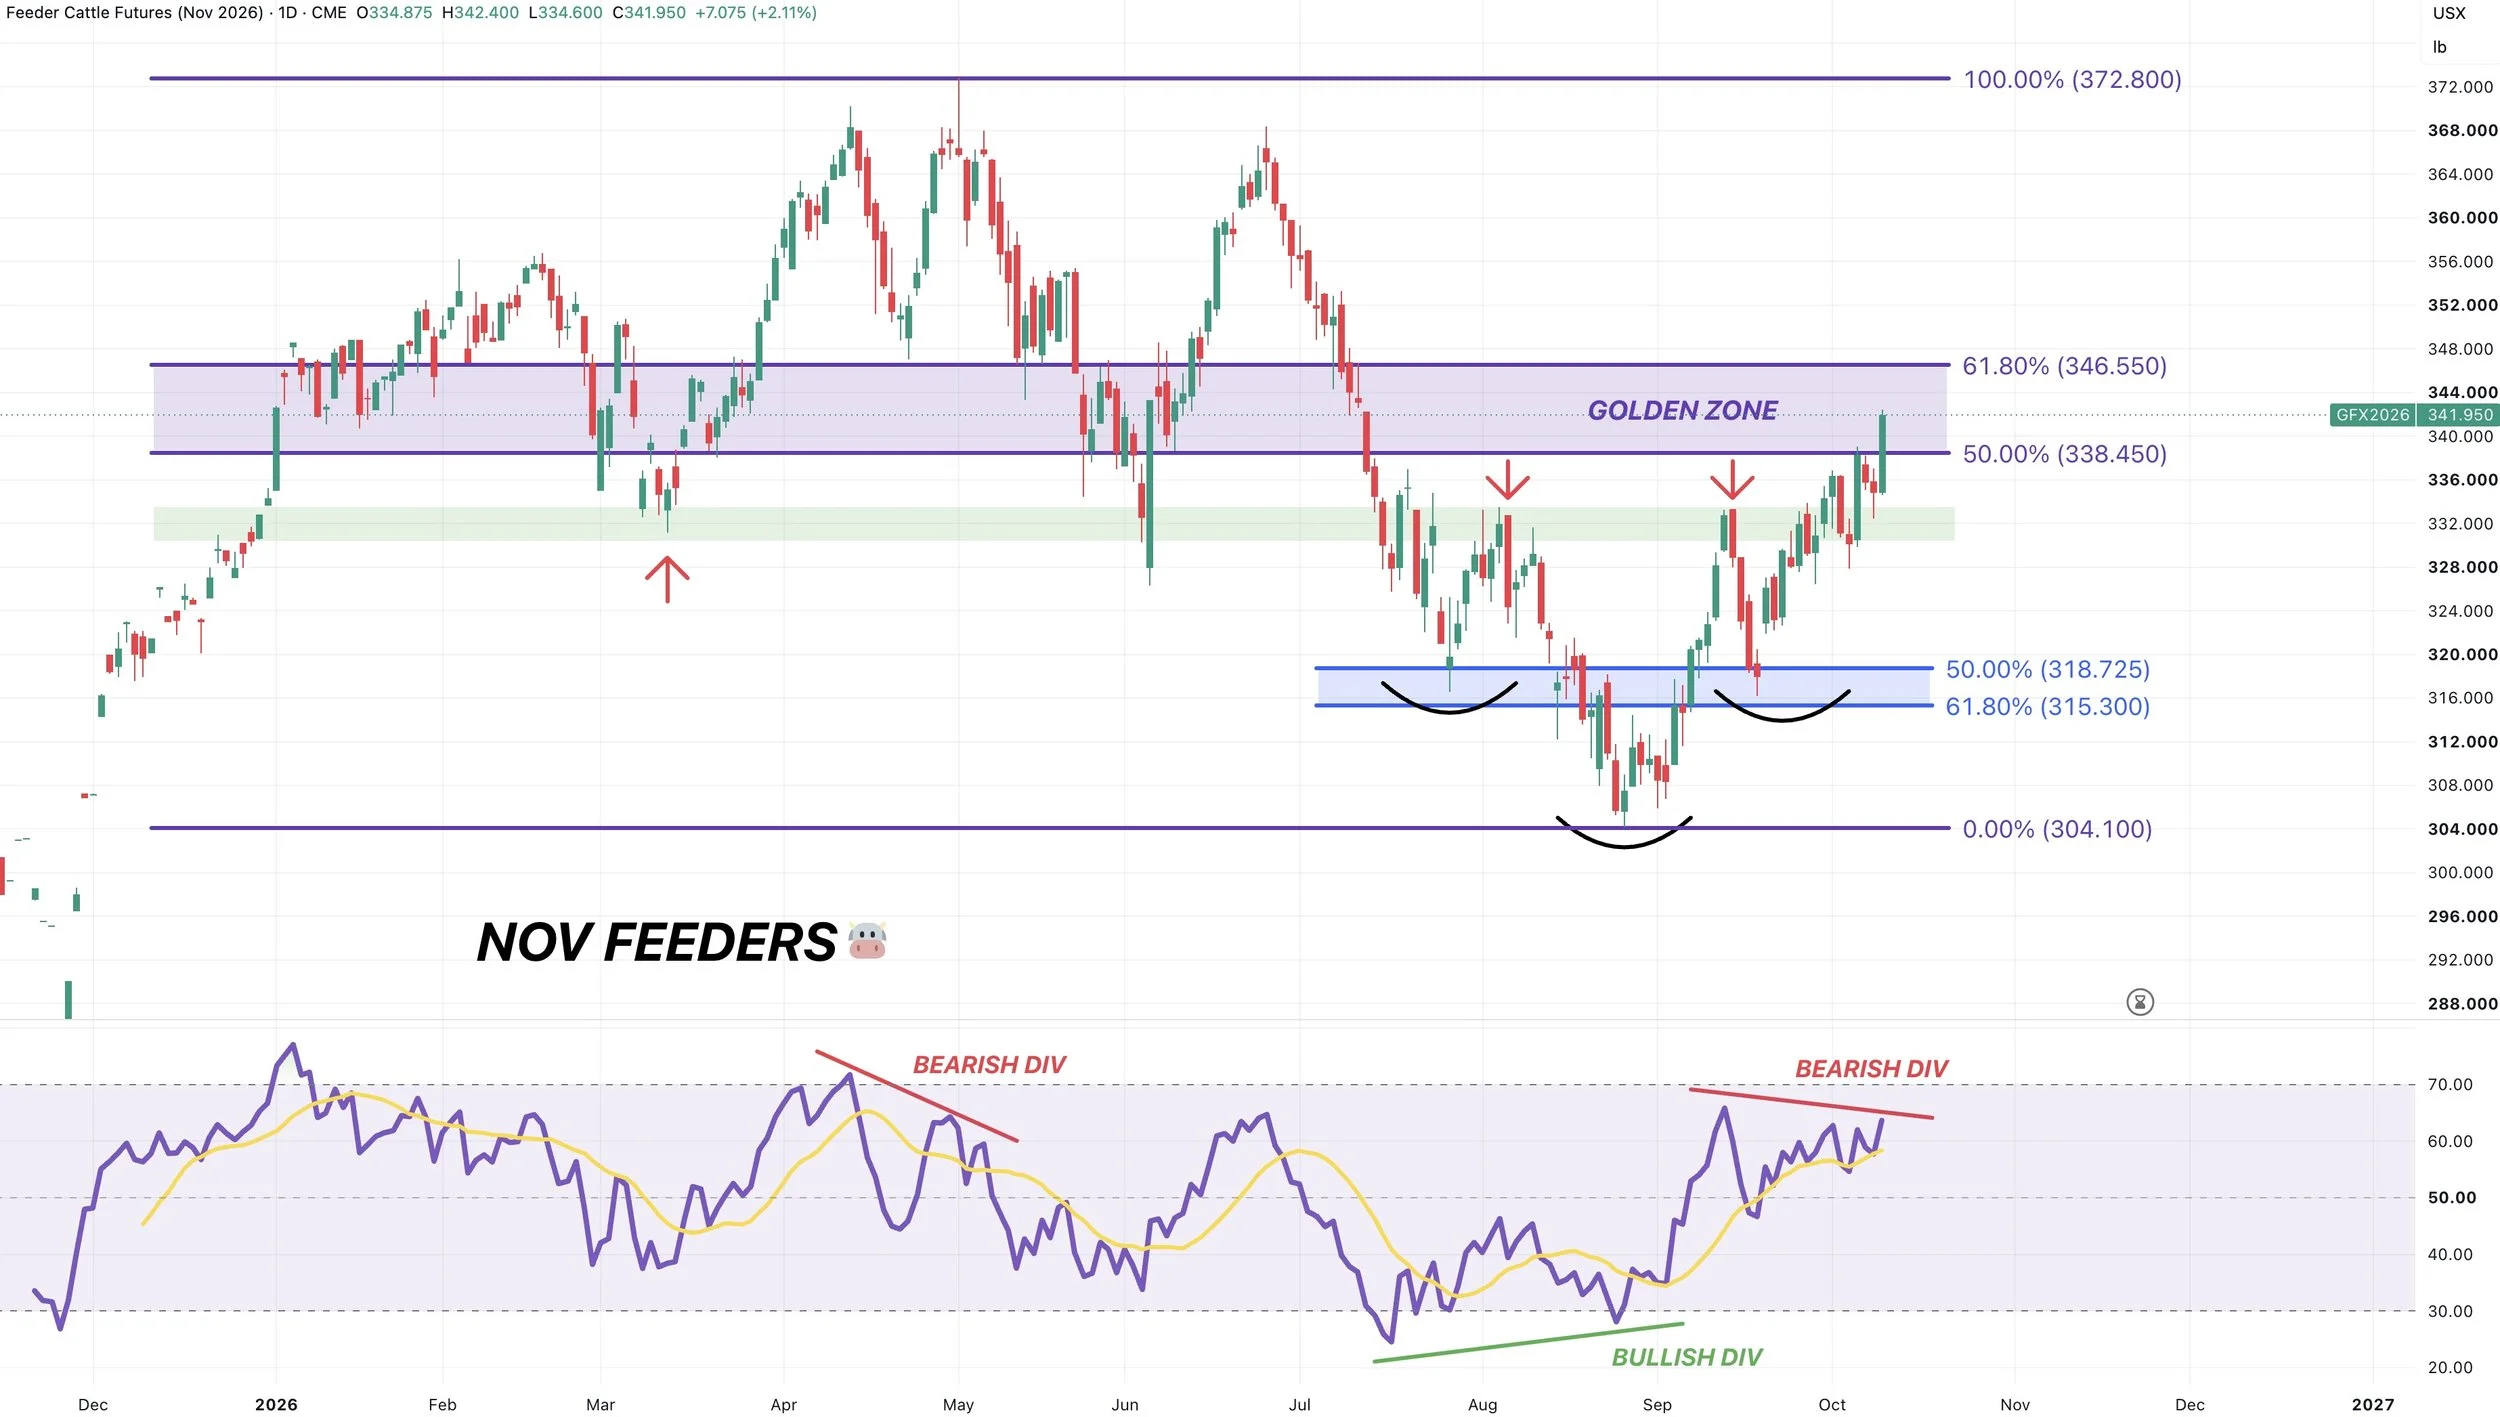
Nov Feeders Chart:
We have that inverse head and shoulders pattern we've been talking about that continues to play out.
Cattle continues to catch a bid, probably partly in due to weak corn. As cattle ran after the USDA report.
Cattle is getting very close to an area where we want to be looking to manage some risk. And we will likely be sending out a hedge alert here soon.
We are right inside this golden zone up to the May highs and target box we've been talking about.
If this is simply just your usual relief bounce inside a broader downtrend, this can be a common area to see some resistance. So I do like considering managing some risk up here soon.
We are also showing bearish divergence on the RSI I mentioned potentially forming earlier this week, which can be an early warning sign.
Prices are posting new highs. Yet the RSI is not. This doesn’t mean we have to top here. But it's another reason to consider using some caution here soon.
Bearish divergence marked the May highs. Bullish divergence marked the August lows.
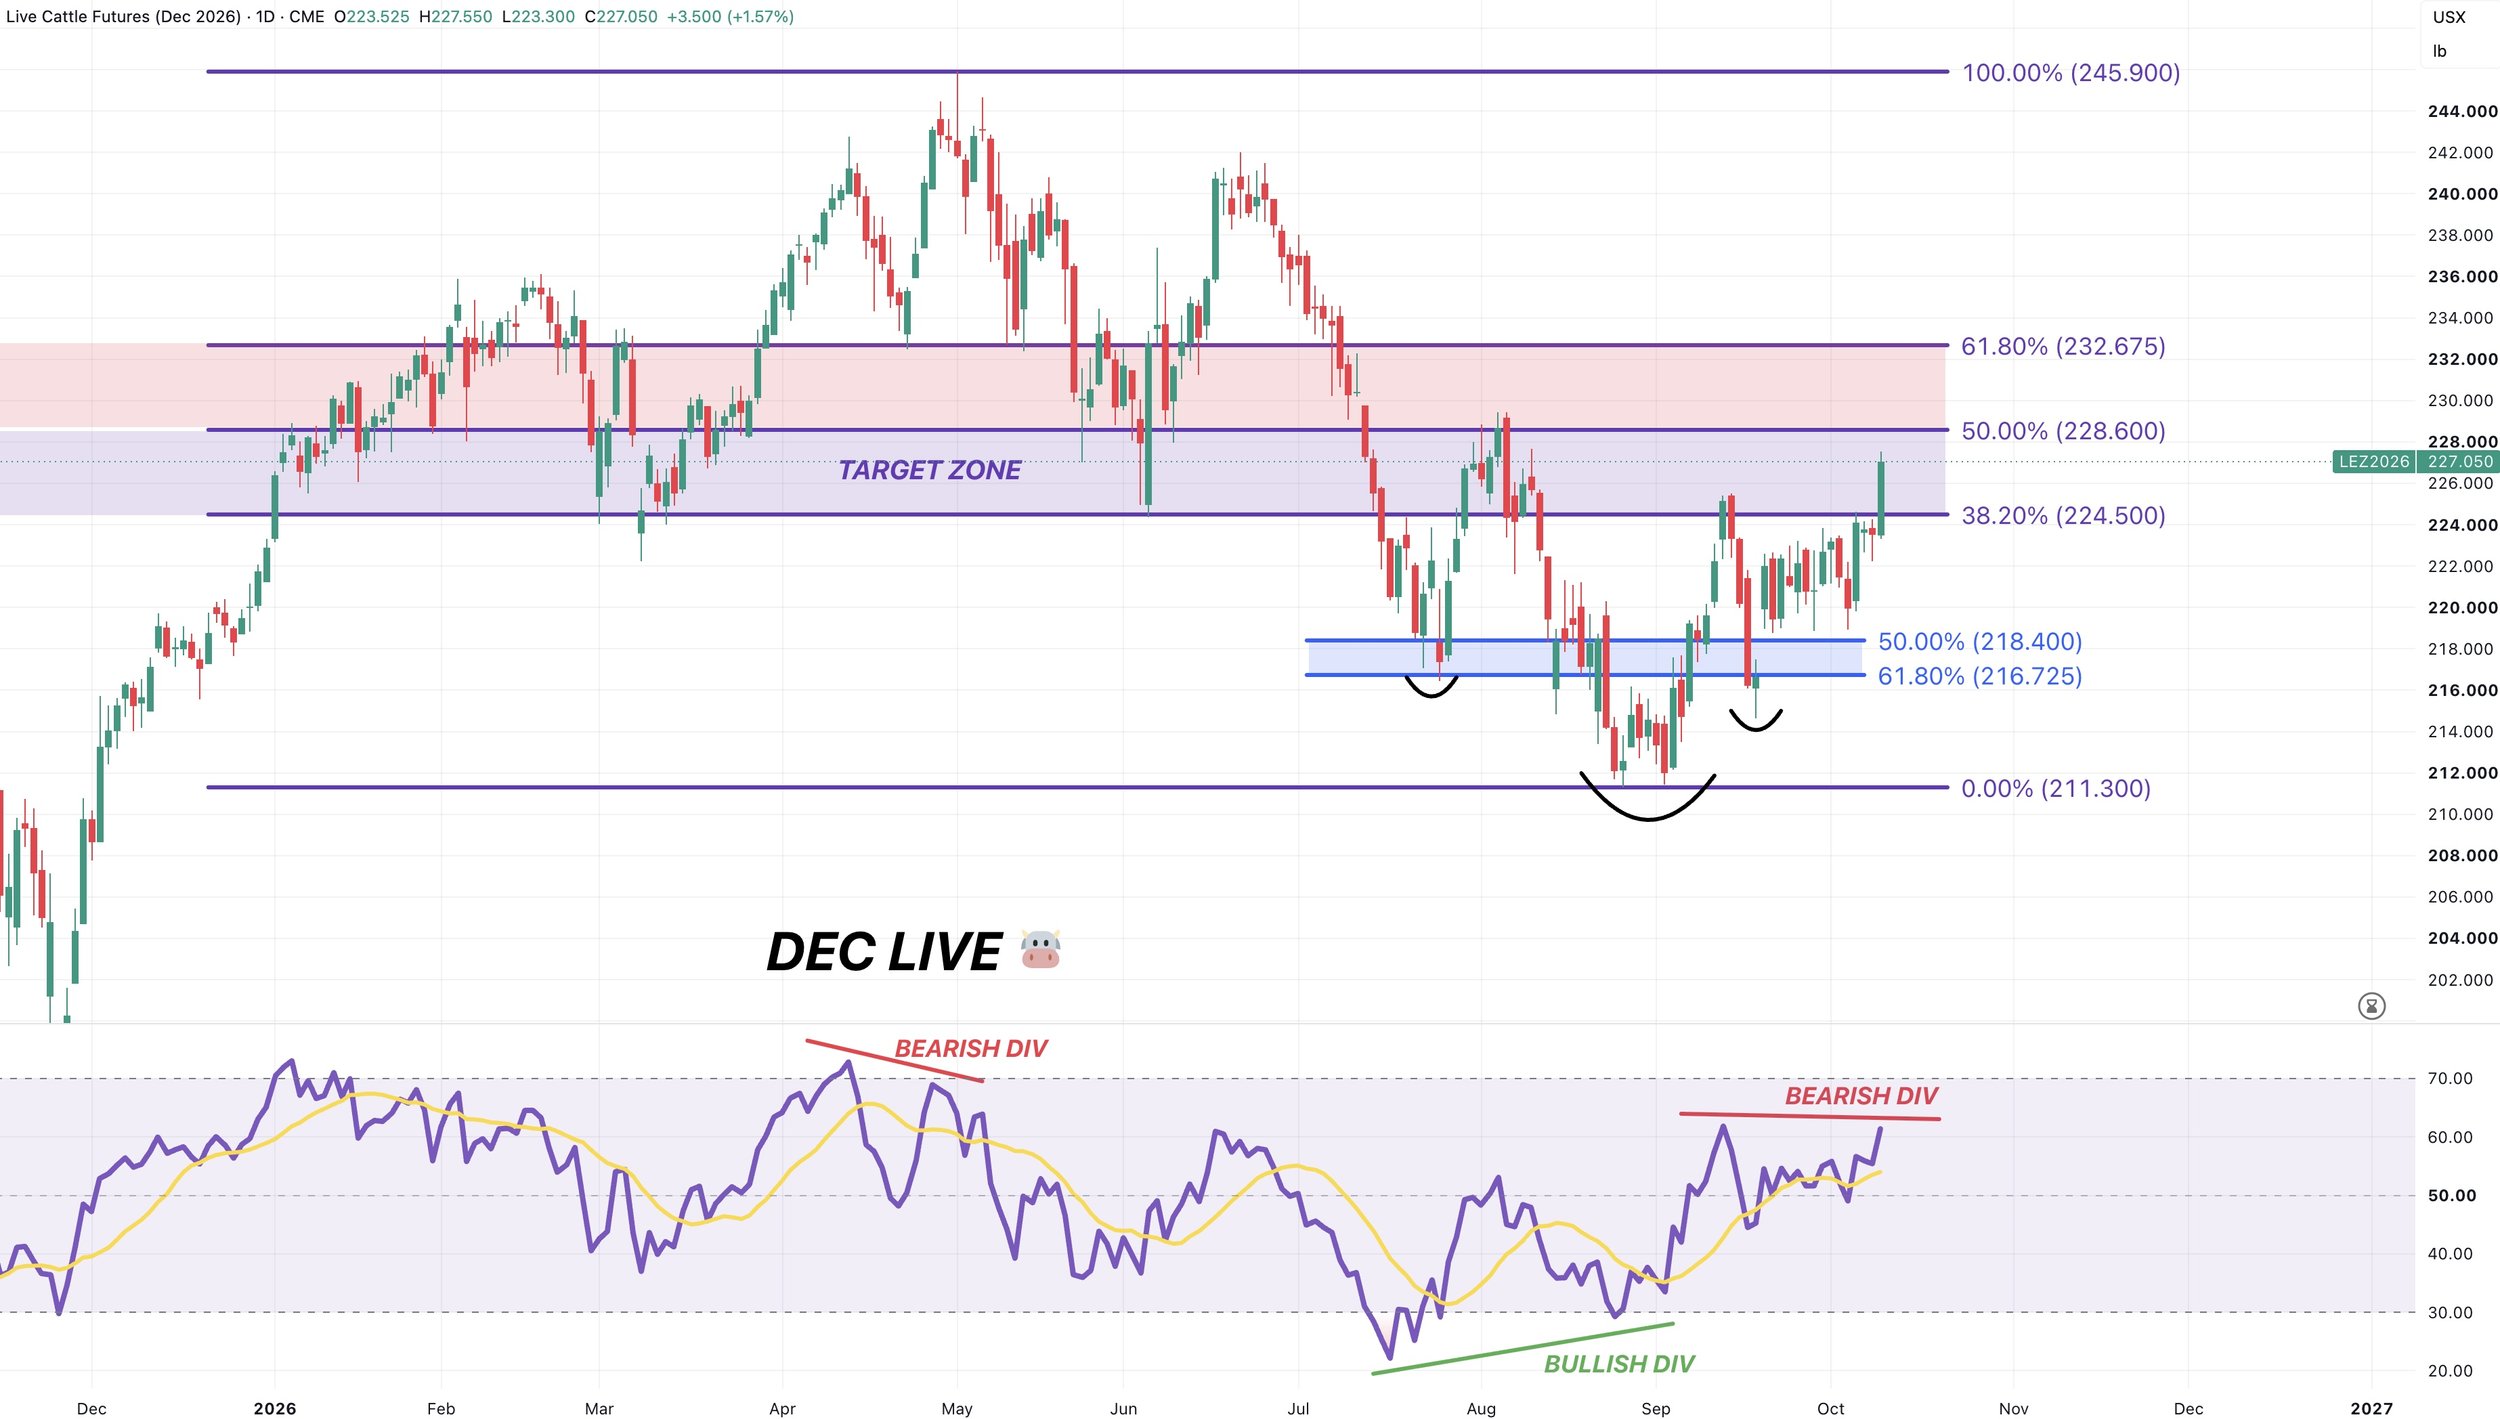
Dec Live Chart:
Also entering that target zone, which is a set of fibs lower than it is in feeders due to the relative weakness.
As we are nearly hitting that 50% retracement up to the May highs.
So we want to be doing some due diligence in our risk management soon.
Like in feeders, we are also showing bearish divergence on the RSI.
Bearish divergence once again marked the May highs while bullish divergence marked the August lows. Just a reason for caution soon.
Want to Talk?
Our phones are open 24/7 for you guys if you ever need anything or want to discuss your operation.
Jeremey & Office: (806)484-1214
Sebastian: (605)280-1186
Email: sfrost@dailymarketminute.com
Hedge Account
Interested in a hedge account? Use the link below to set up an account or give us a call.