
CORN, SOYBEANS & WHEAT
Disclaimer: there is risk of loss trading futures and options. Past performance does not necessarily indicate future results. This is our opinion and should be treated as such.
This is not a recommendation to blindly buy futures.
However, if you made sales higher than we are today or on our sell alerts this year, we feel like this is a good spot to consider some re-ownership opportunities for those who want to keep upside exposure following the massive break.
There is nothing wrong with walking away from a good sale. But for those who want to keep your upside open, we are at levels we like doing so.
Call options have become very cheap. As implied volatility has been crushed. So we do like considering calls as a way to keep our potential upside open for some of you.
If you decide to use futures, make sure you have a clear risk to reward in place with a stop loss below support levels. As we are sitting at important levels.
Scroll to view the charts, support levels, and a few trade examples.
If you would like to discuss what routes might make sense for you, if you should be considering any sort of re-ownership strategies, or to get a live quote please feel free to reach out to us.
Office: (806)484-1214
Why the alert?
Grains are all at pretty massive spots here. I would call them make or break levels on most of the charts where you can define your risk.
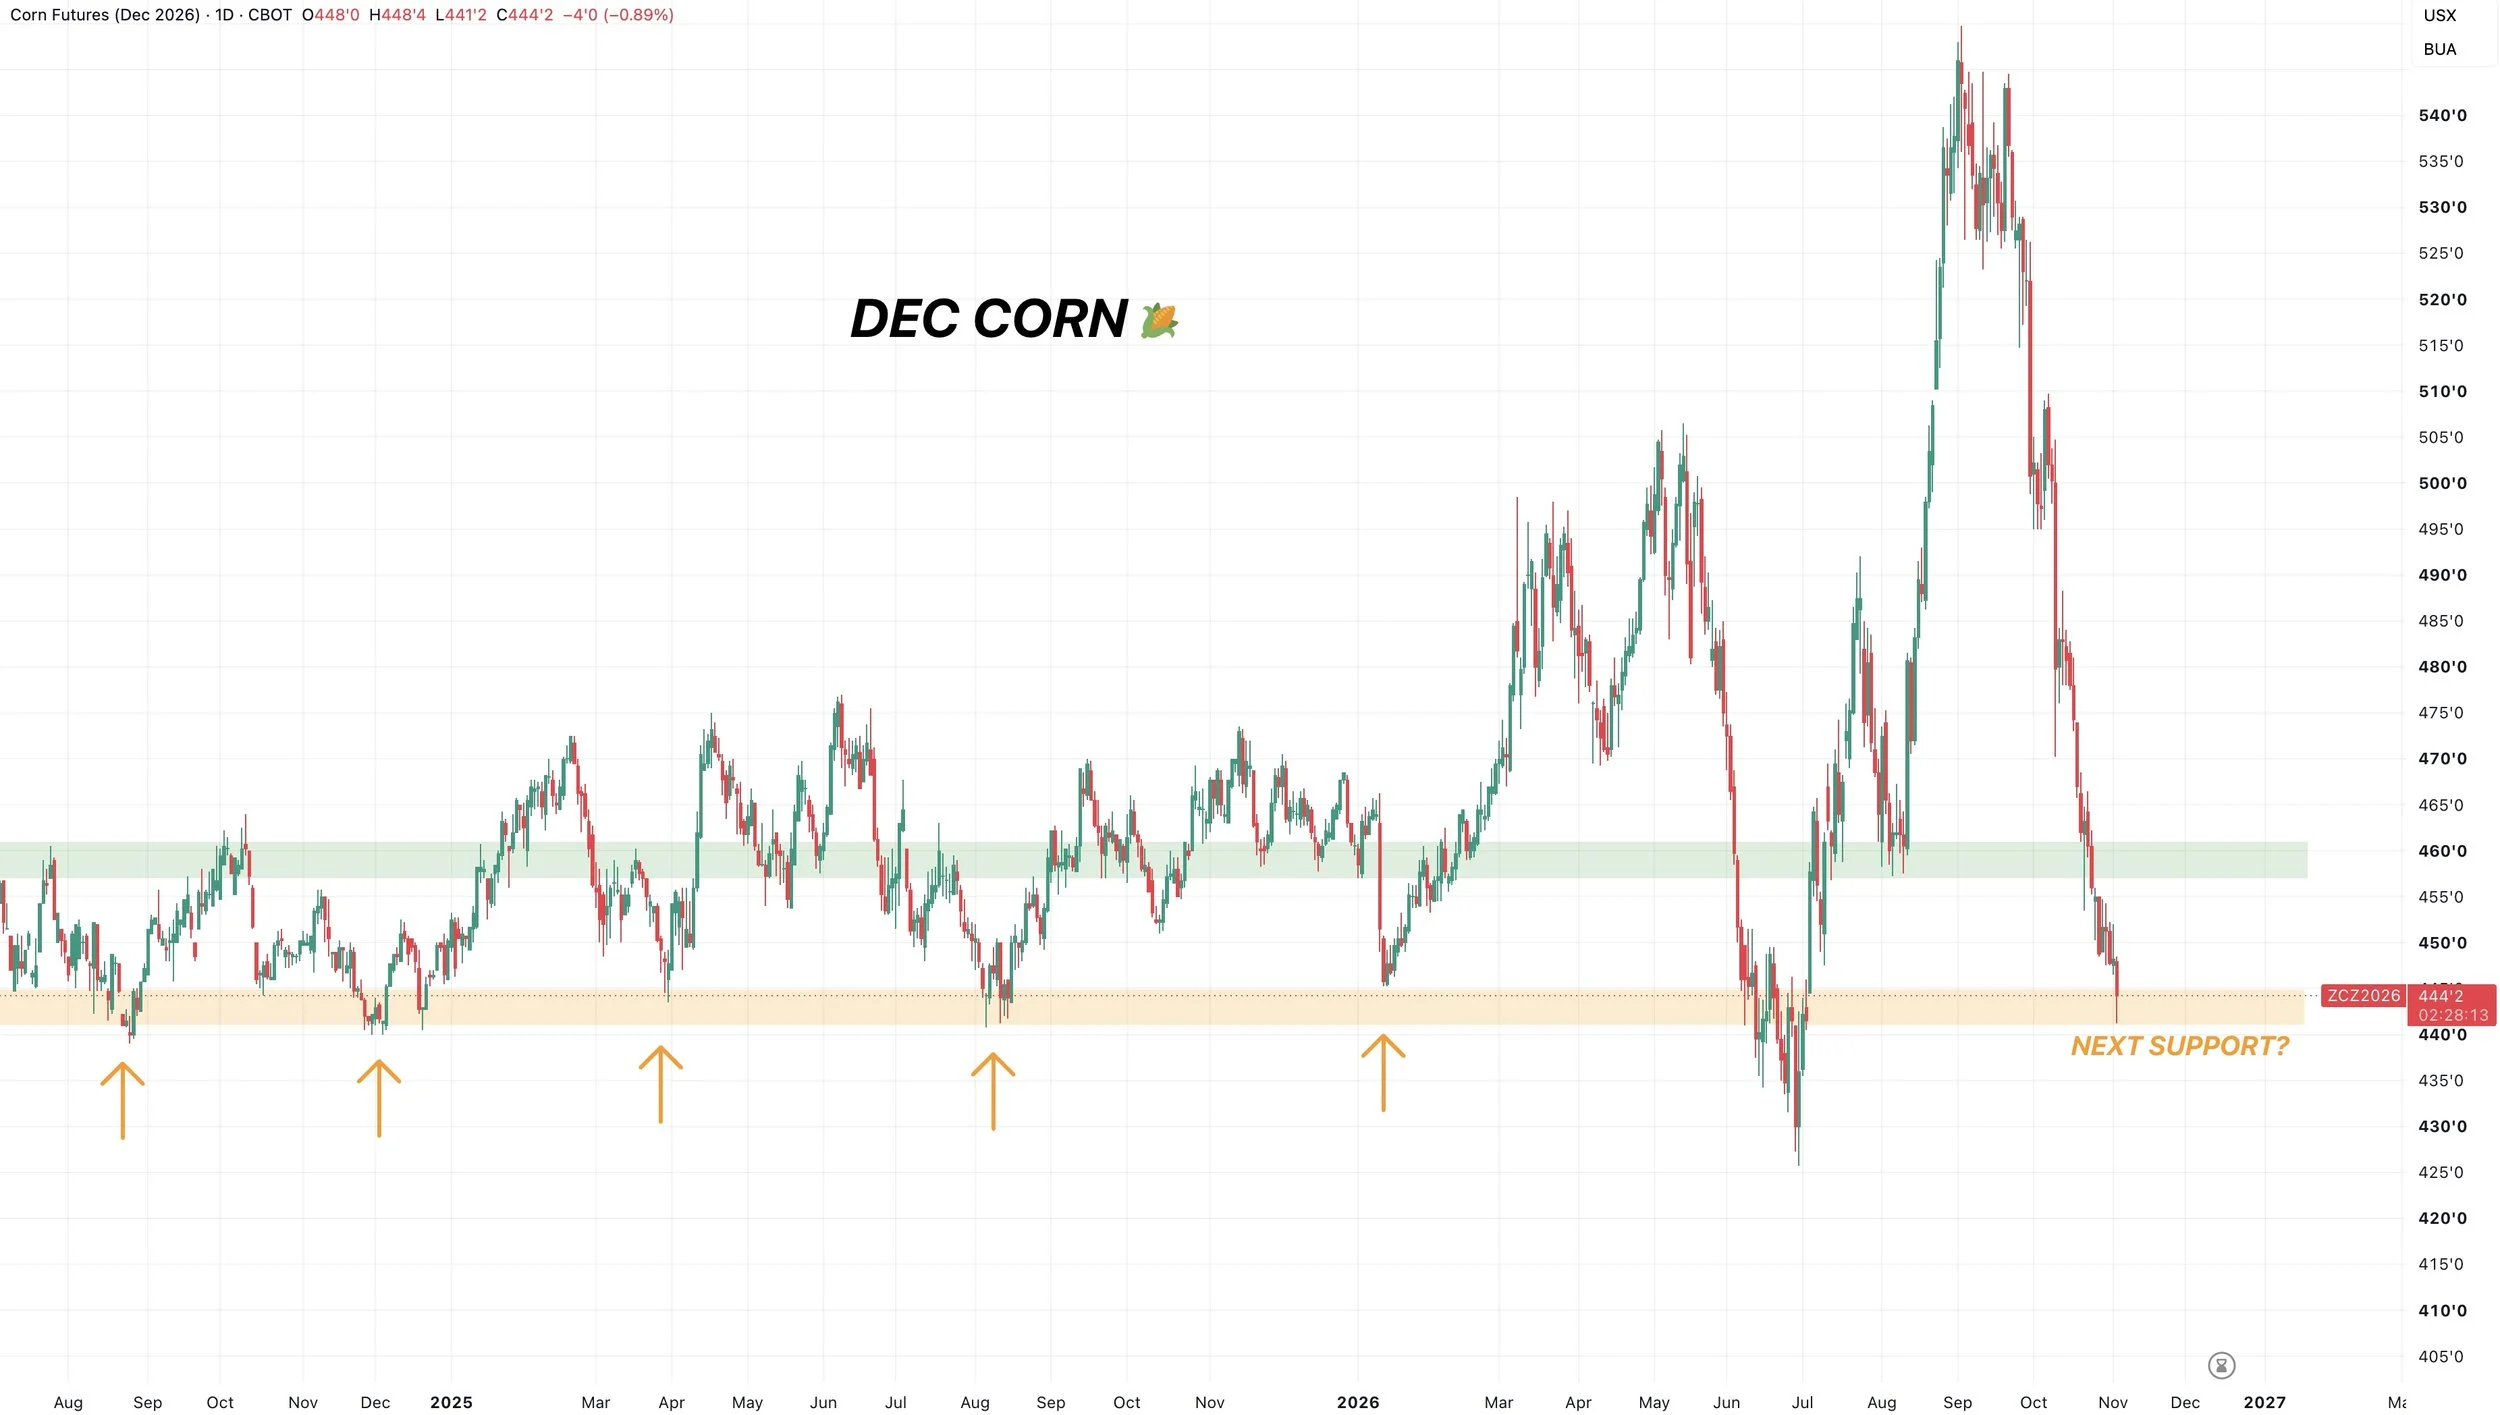
Dec Corn 🌽
This $4.40 to $4.45 level has marked a bottom for this market 5 separate times.
The only time we broke below was those June contract lows.
So this is your last support before contract lows.
Failure to hold here opens the door to contract lows. So that’s your risk.
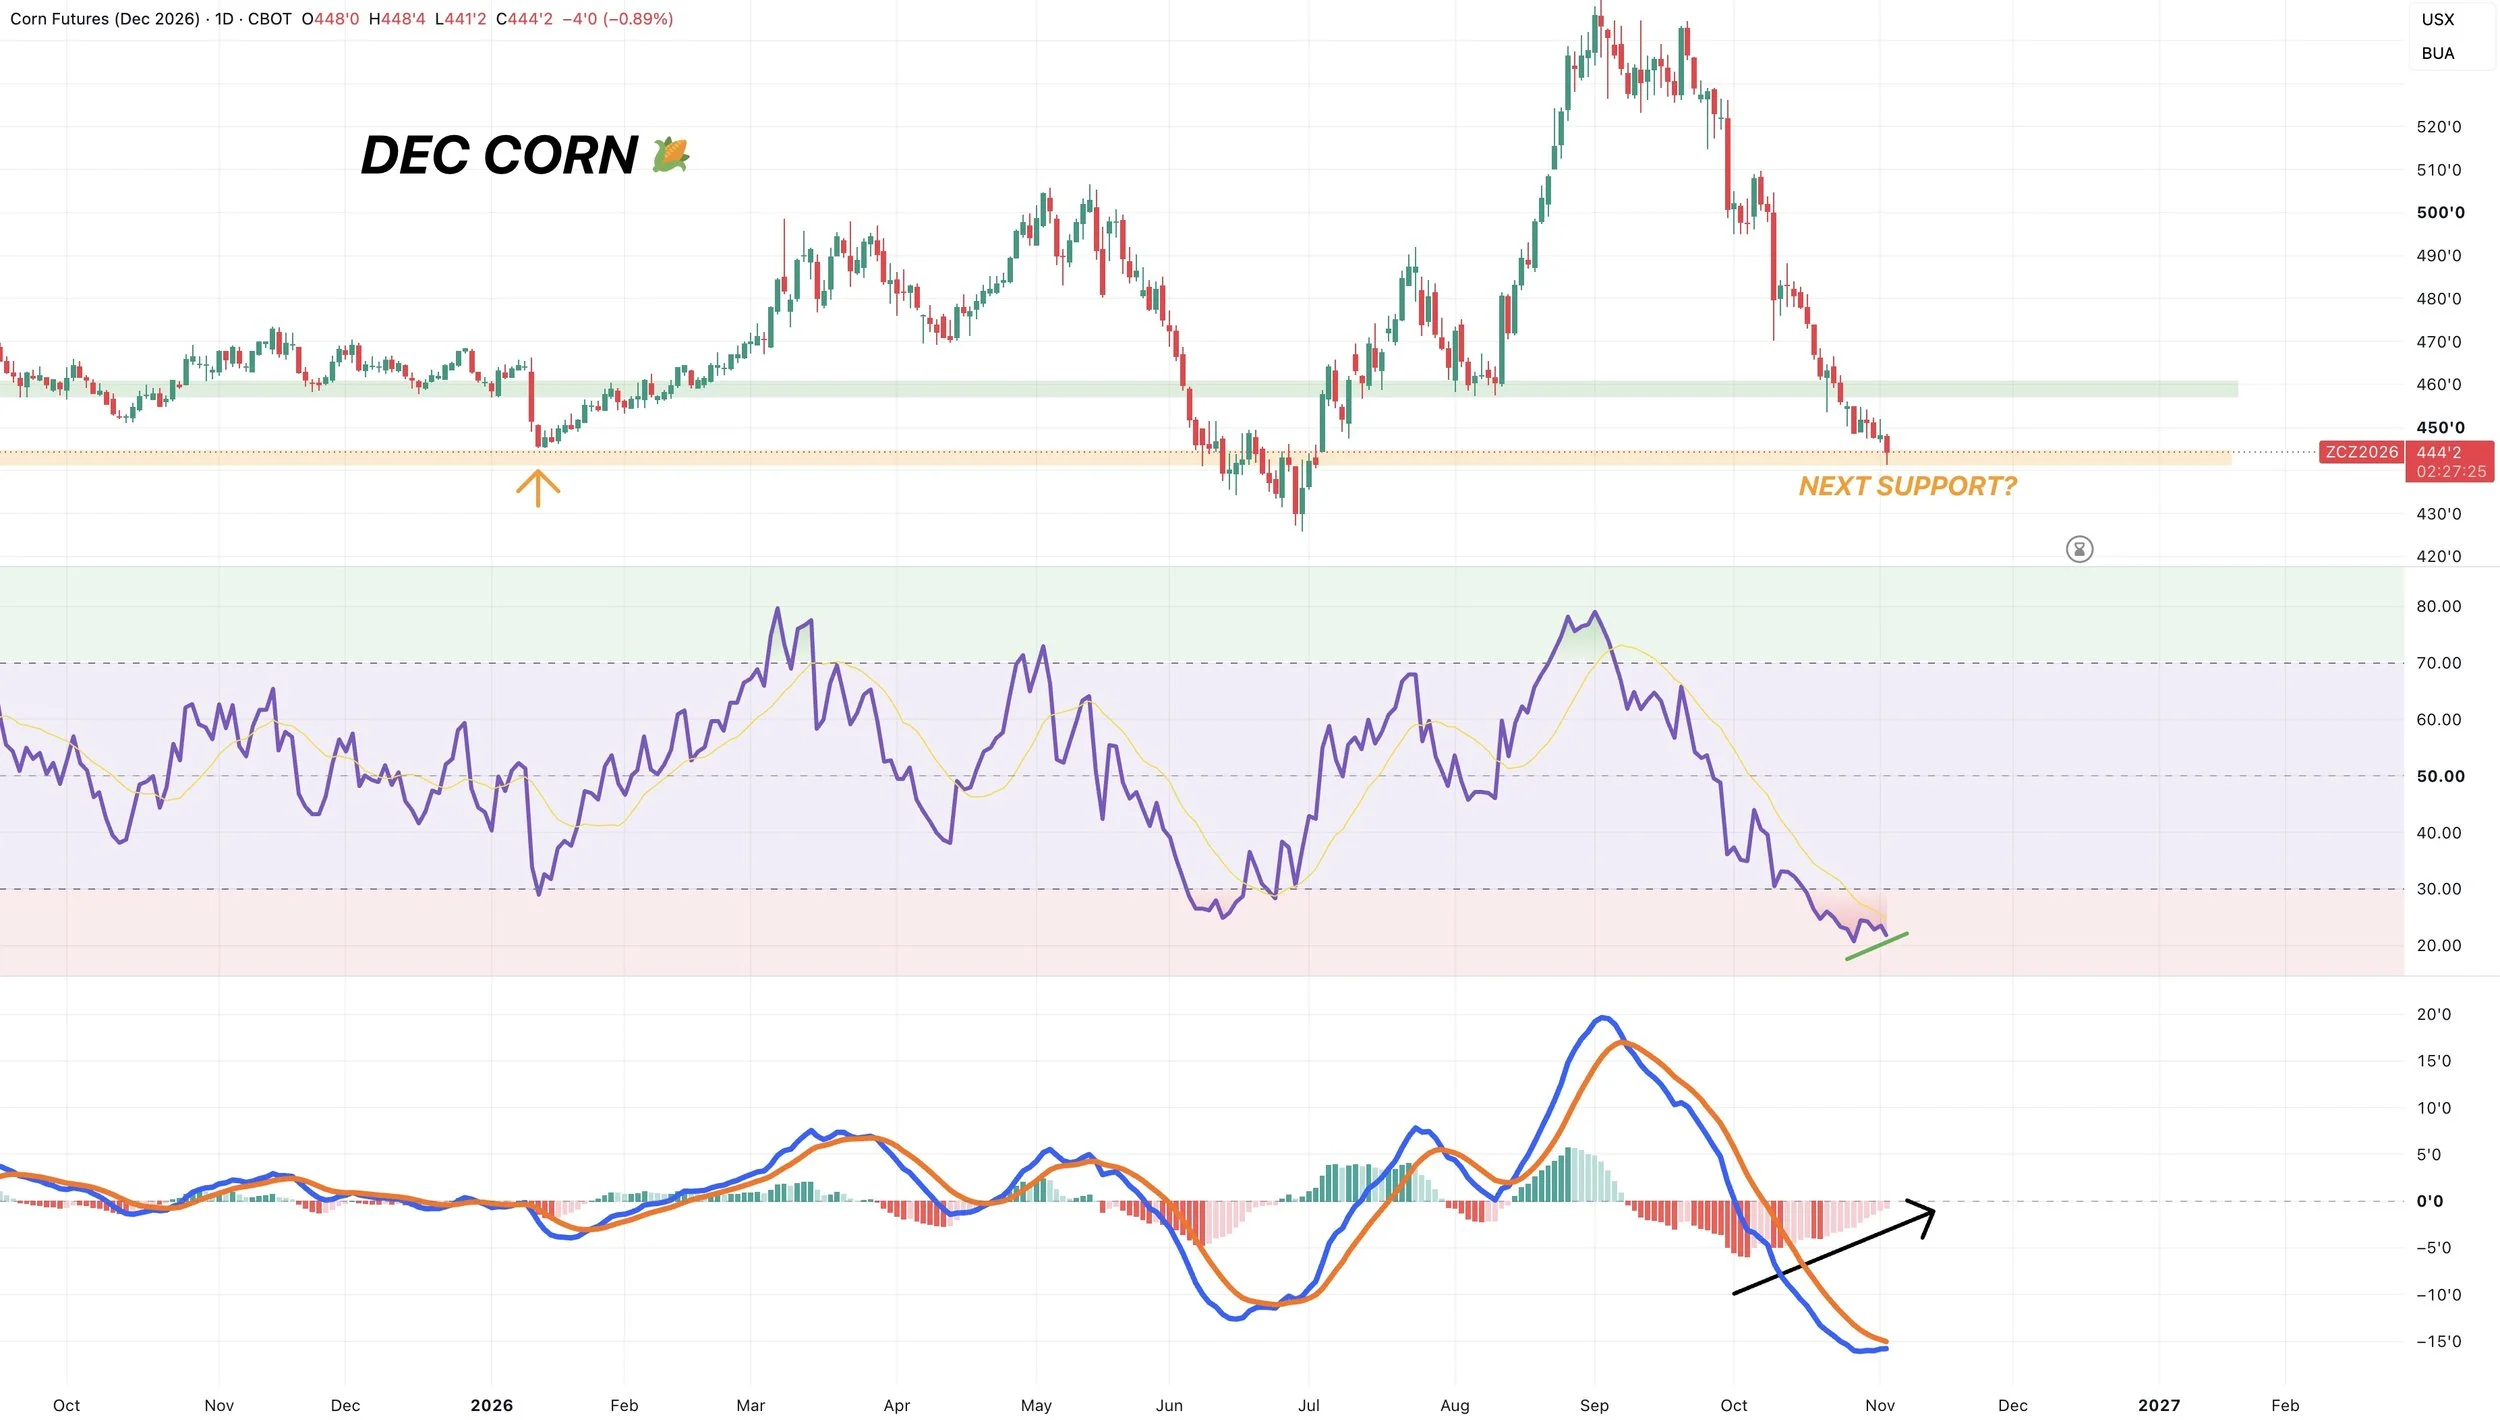
At the same time, we are still very oversold. This alone does not confirm a bottom.
We do not have confirmed bullish divergence, however we have some potential bullish divergence developing.
Prices made new lows. Yet the RSI has not.
For this to be confirmed, we need to see the RSI post a higher low.
This is something we are watching for when hunting for a possible bottom.
We also have the MACD curling higher.
It has not yet crossed bullish.
But the last few times it has crossed bullish, a bottom has closely followed.
Corn Trade Example:
Feb $4.60 corn calls vs paying storage in town for about 15 cents.
They expire in 80 days.
Feb $5.00 corn calls are about 4-4.5 cents.
Jan Soybeans 🌱
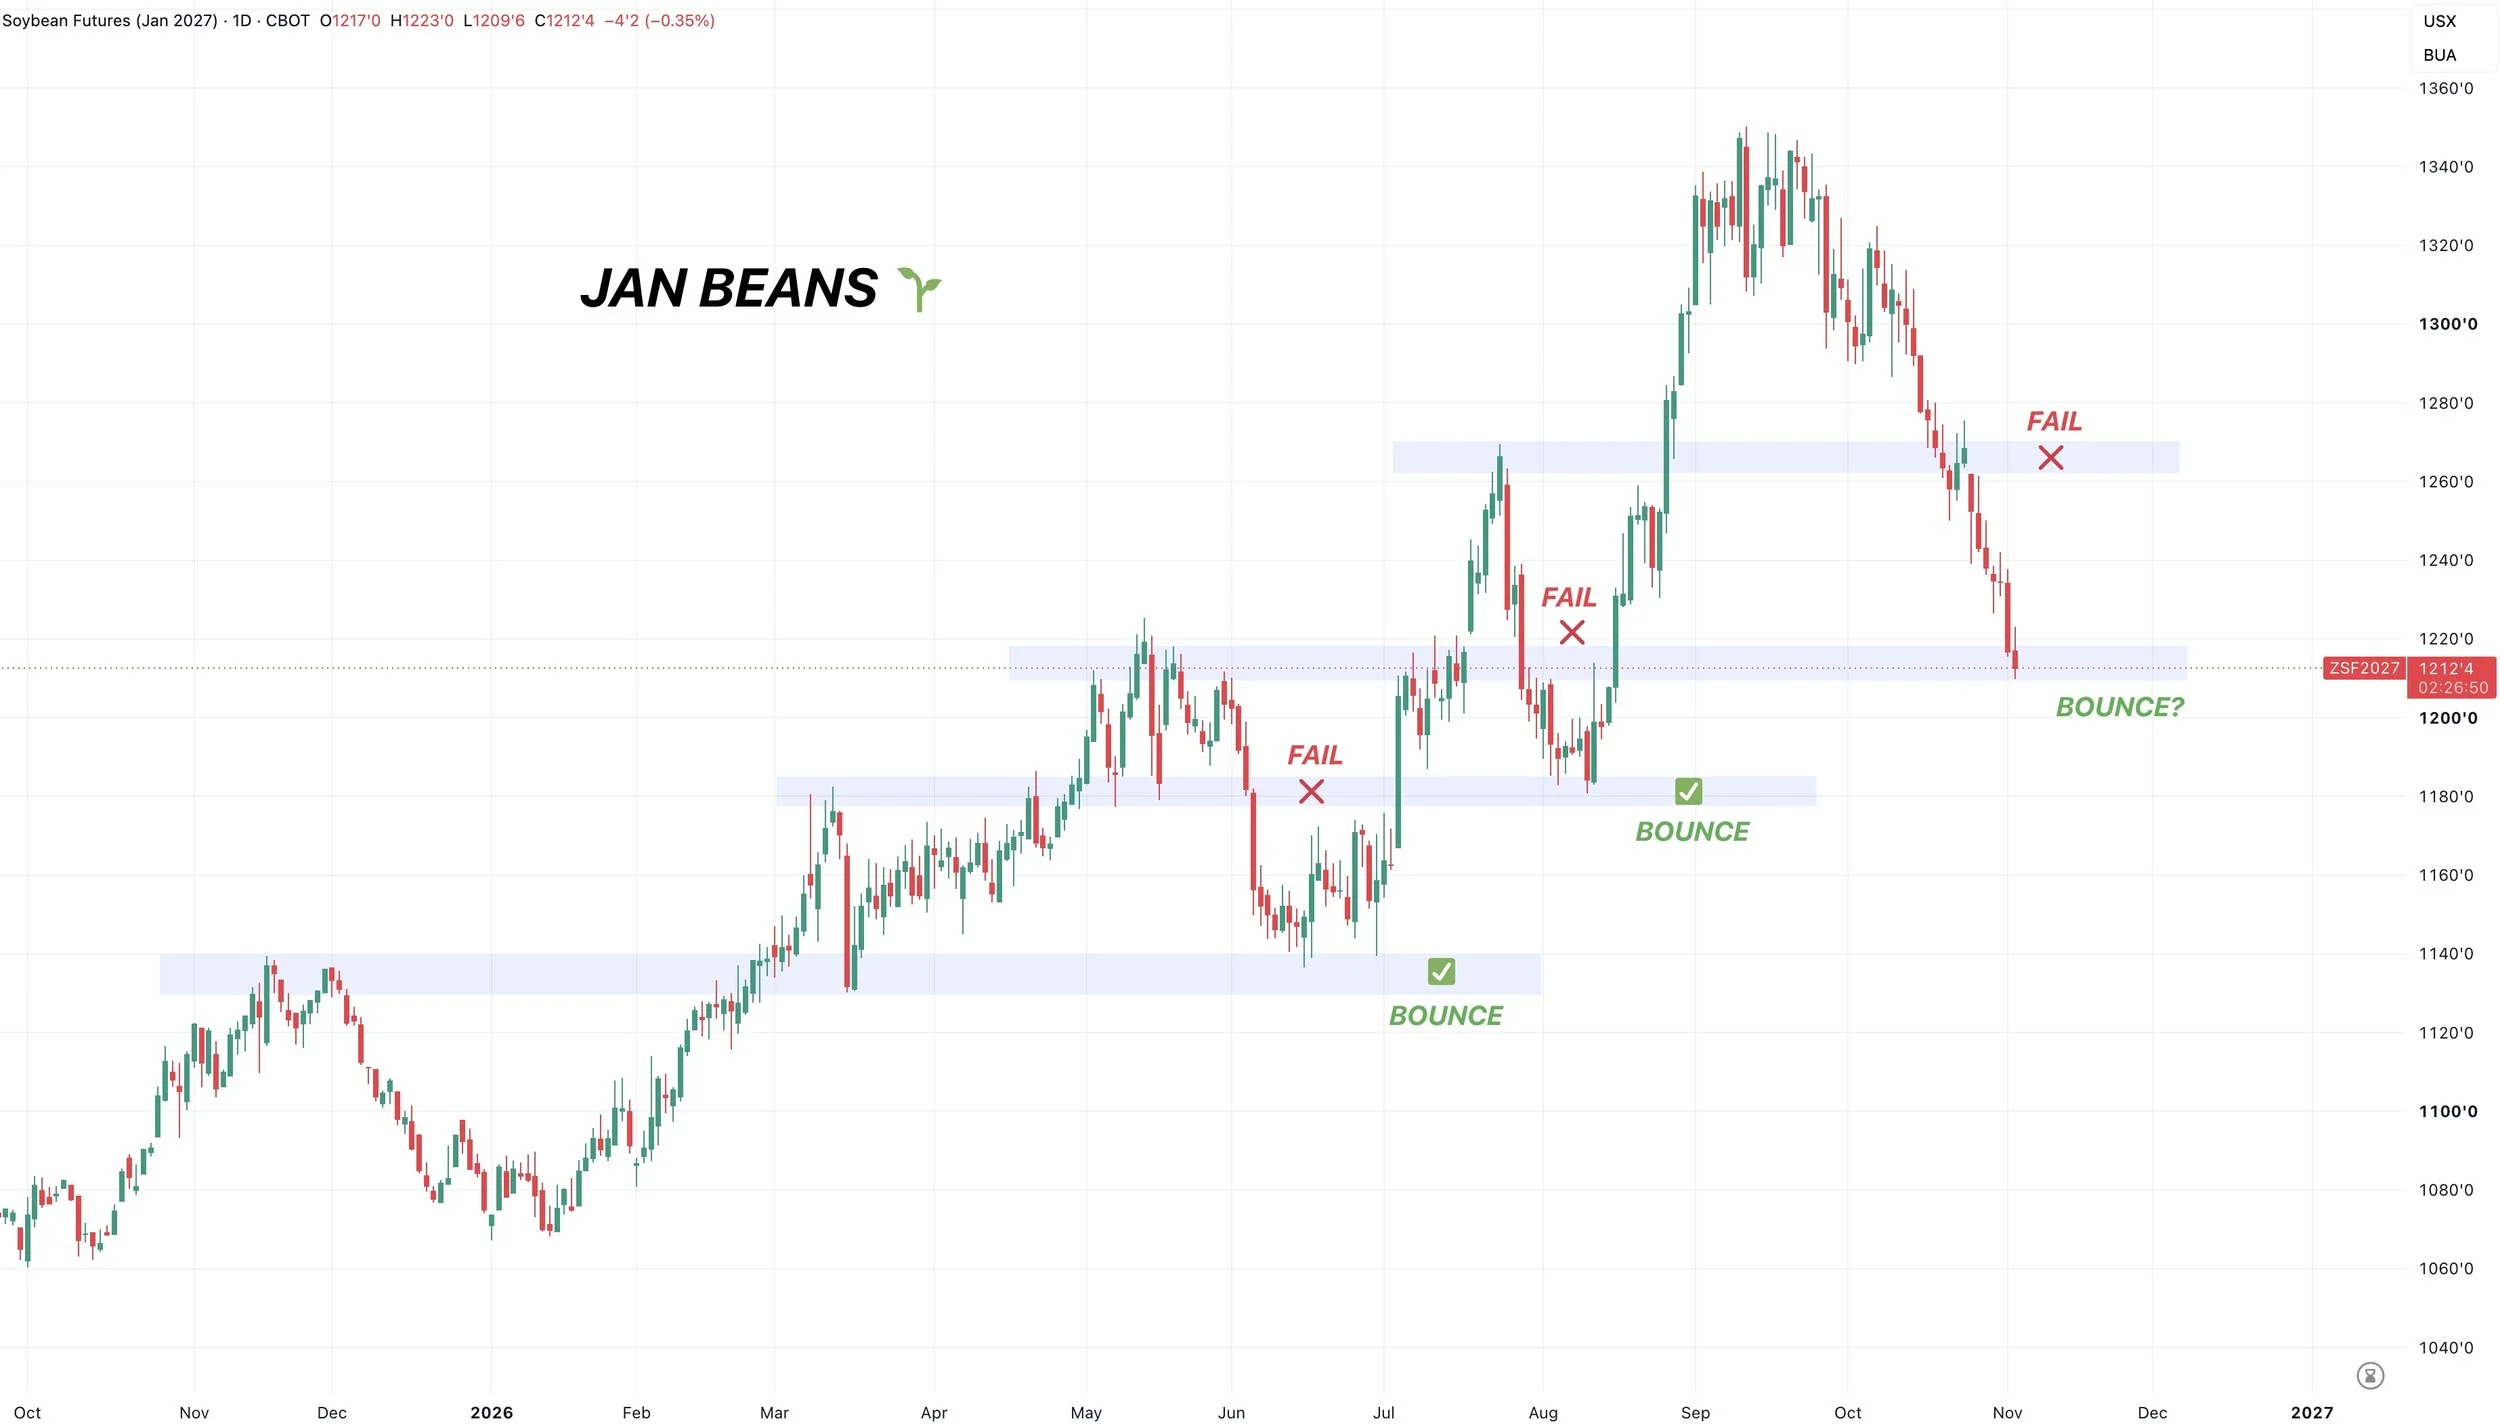
Soybeans have turned prior highs into new lows all year long.
But there is a catch.
We have continued to fail to hold the most recent prior high. Instead we have bounced off the high before it.
In June we failed to hold the March highs. Then bottomed at the November highs.
In August we faileld to hold the May highs. Then bottomed at the March highs.
Now we failed to hold the July highs.
Could we now bottom at the May highs? We have yet to turn it into support.
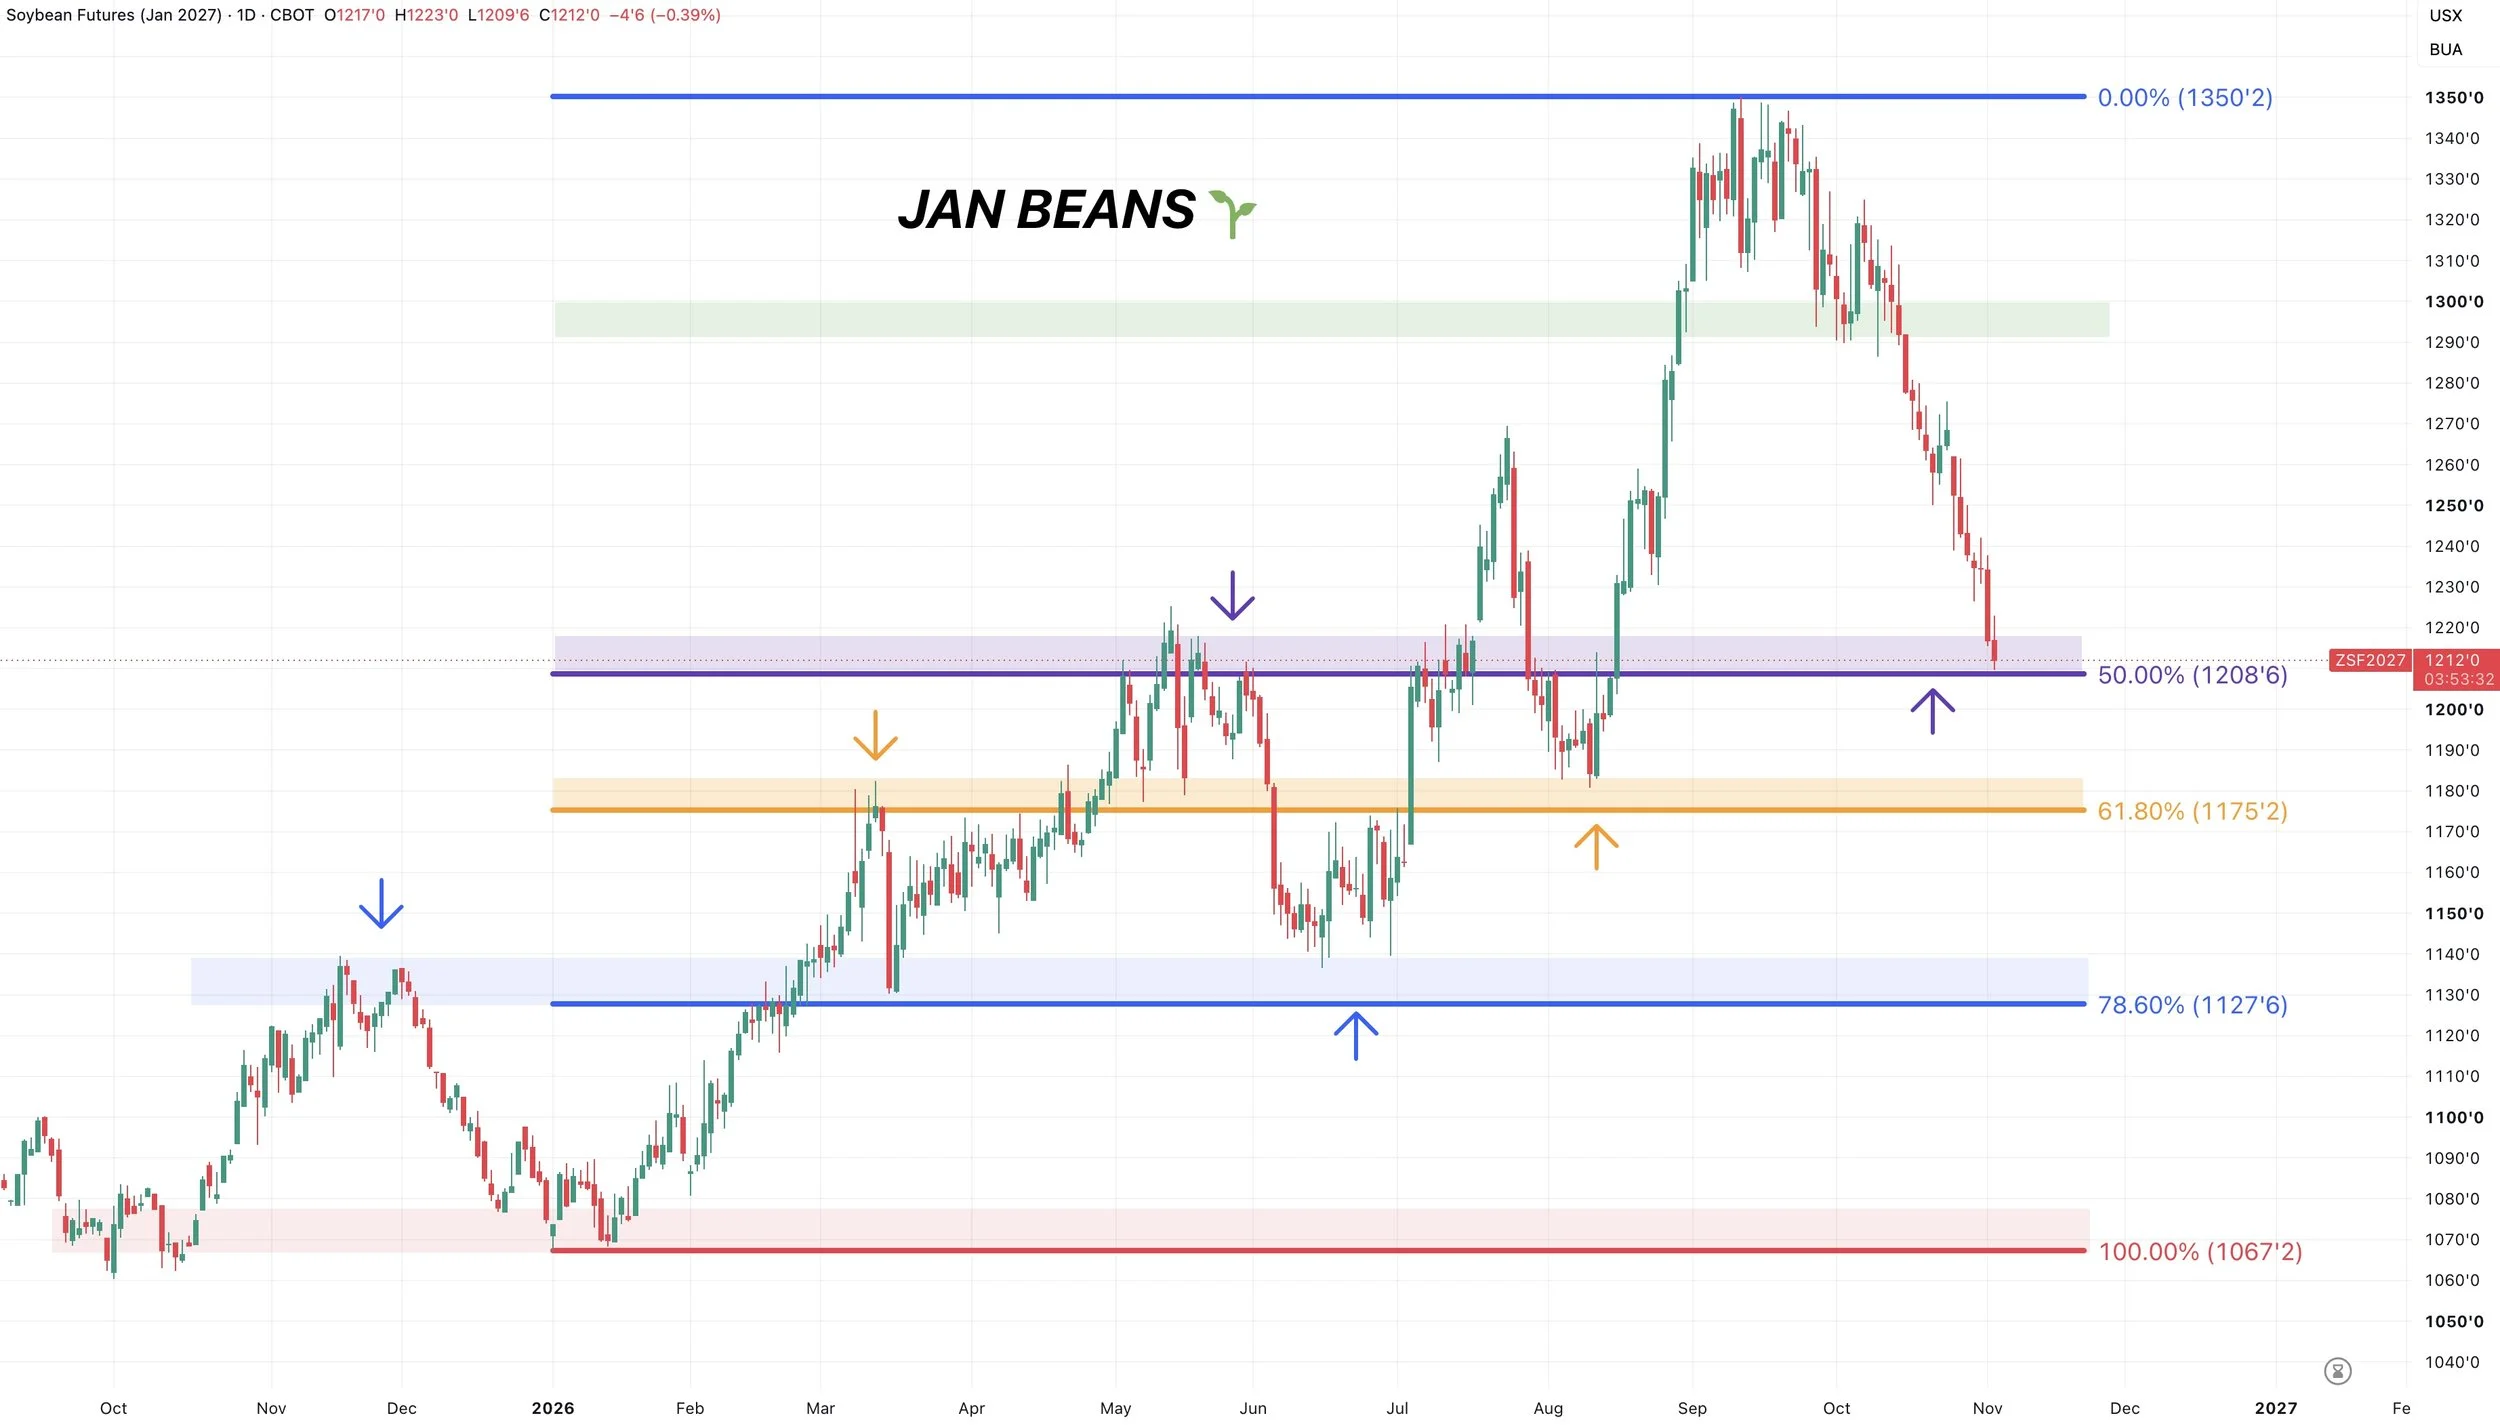
At the same time, we are testing the 50% retracement down to the November lows.
Which also re-tests the highs from May.
Keep in mind, if we fail to hold this level it opens the door to further downside.
As failure to hold here could result in a 30 cent drop towards that $11.80 area and those August lows.
So this is clearly an important level. And that is your risk below this level.
Soybean Trade Example:
Buy Jan soybeans at $12.12
Stop Loss: $12.02
Upside Target: $12.70-80
Risk 10 cents for 55-65 cents of upside.
Dec KC and Chicago Wheat 🌾
Pretty simple look here for both.
Both are sitting at their last supports before contract lows.
As both are sitting right at those June lows.
Failure to hold these levels opens the door to contract lows. So important levels here.
Your risk is a break below those summer lows.
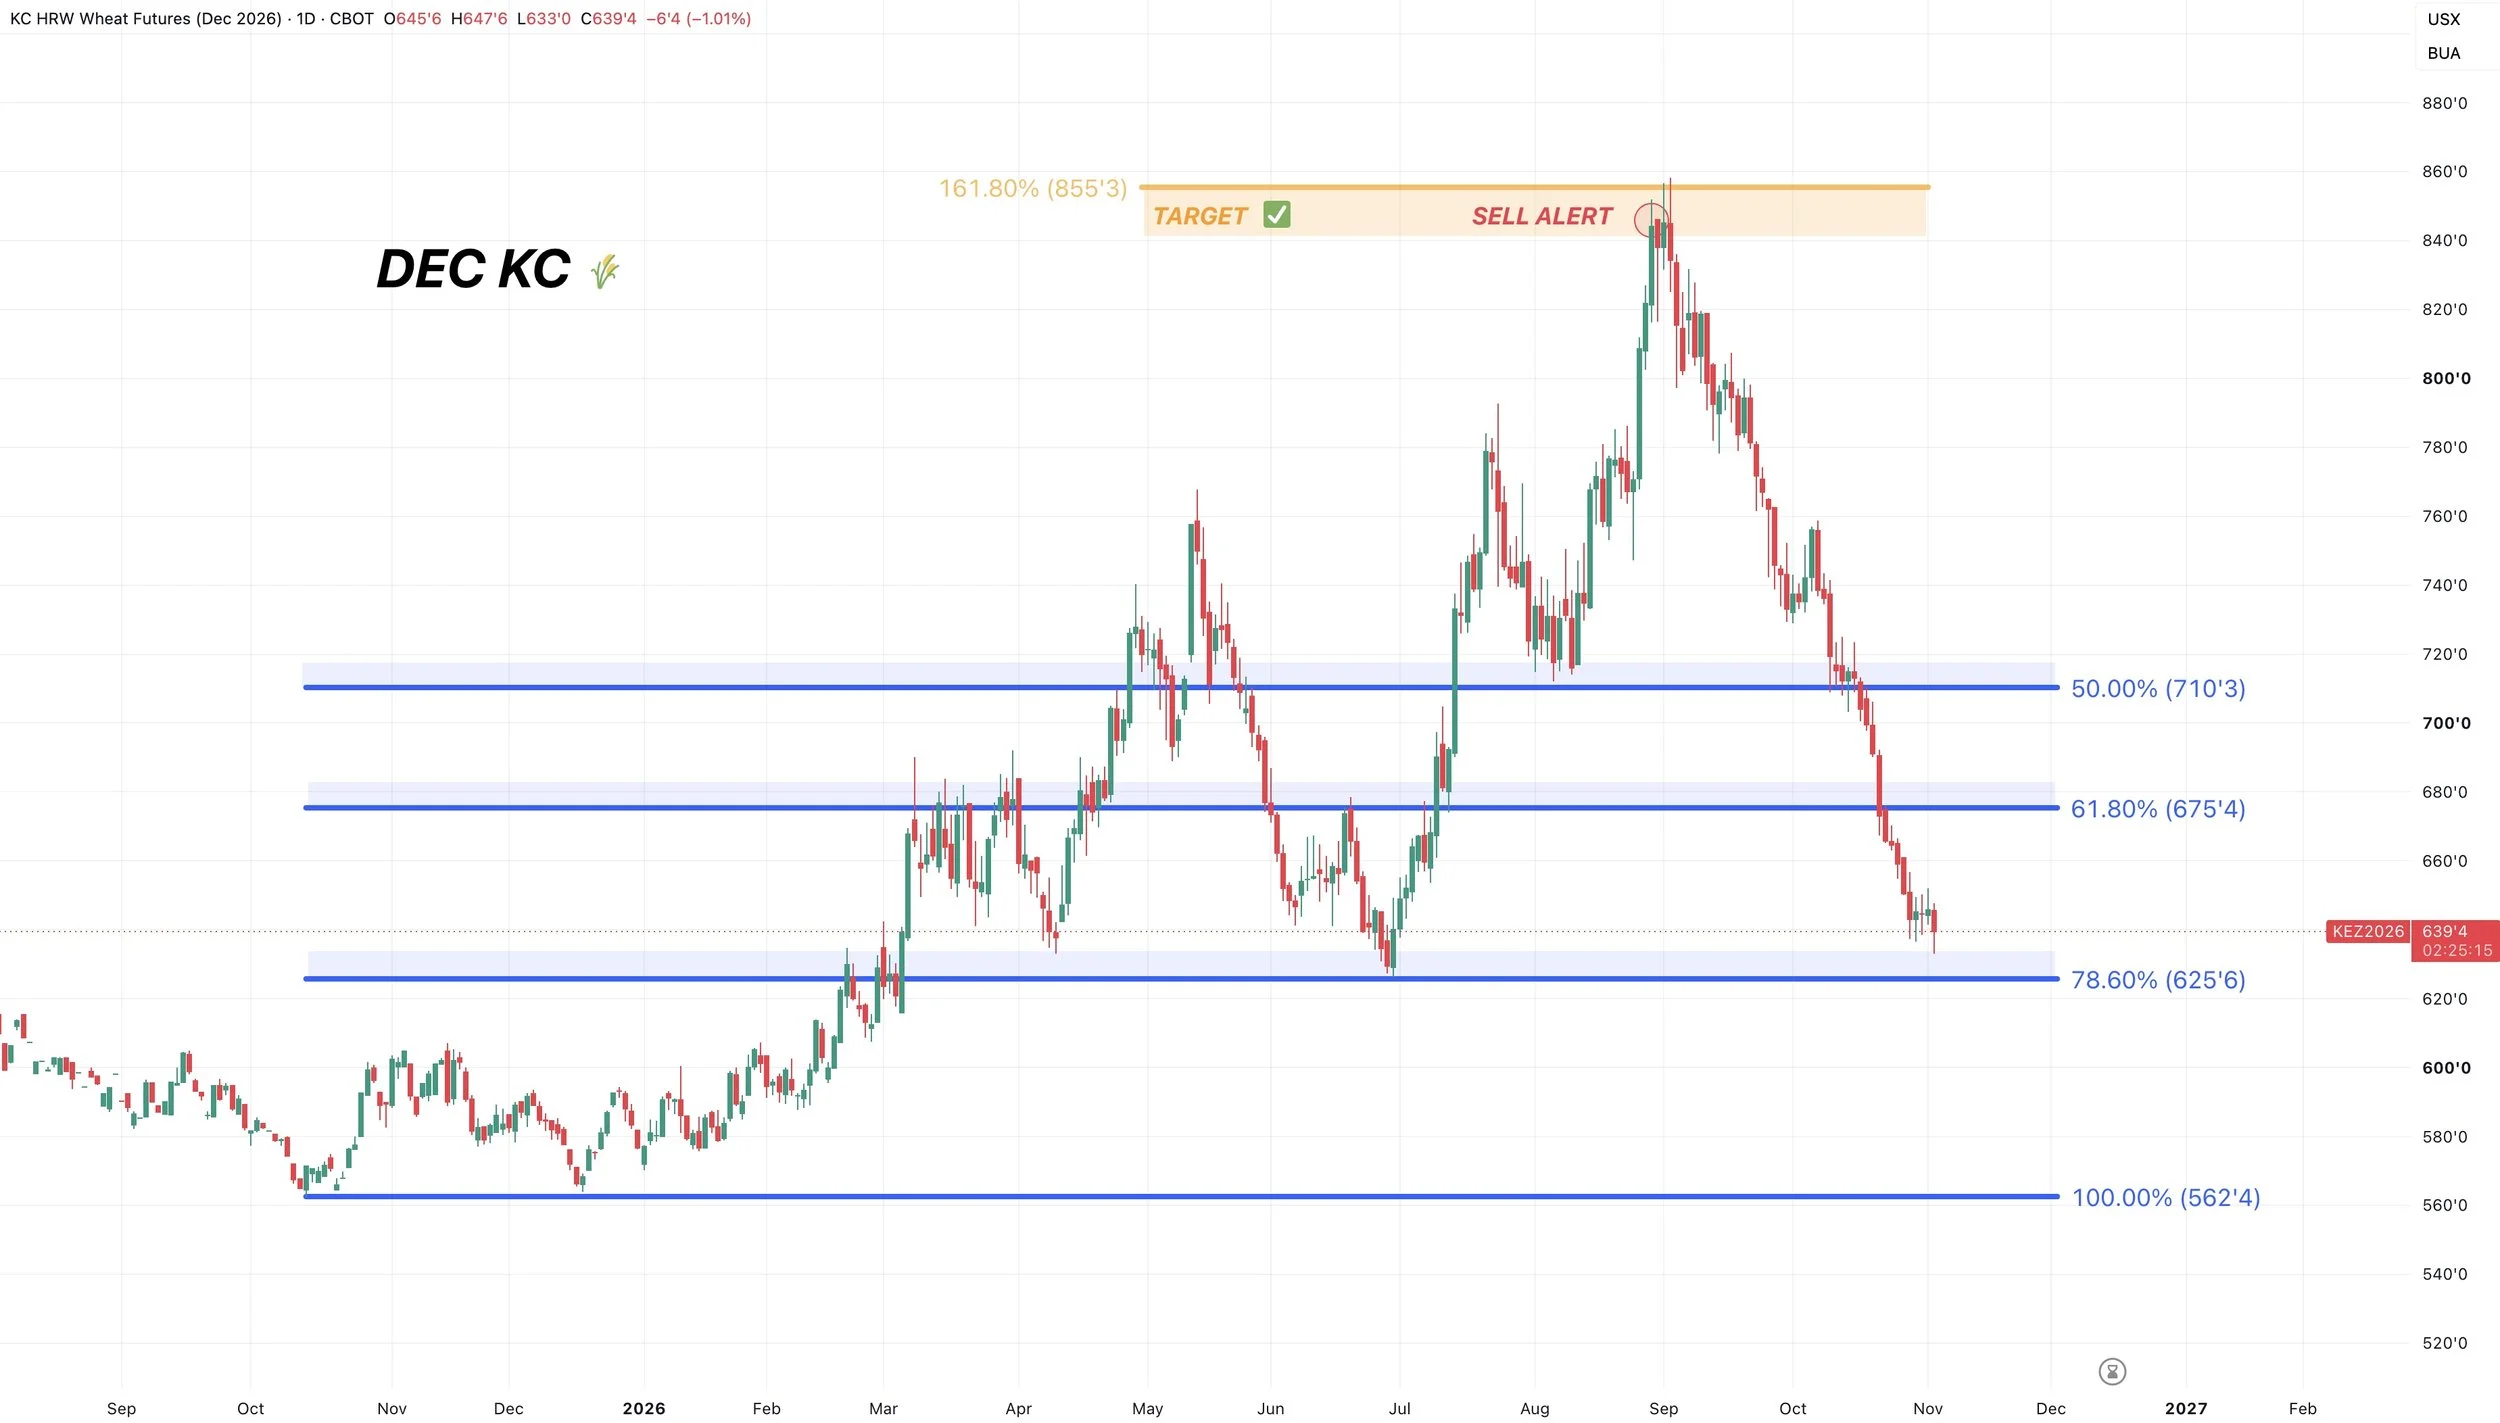
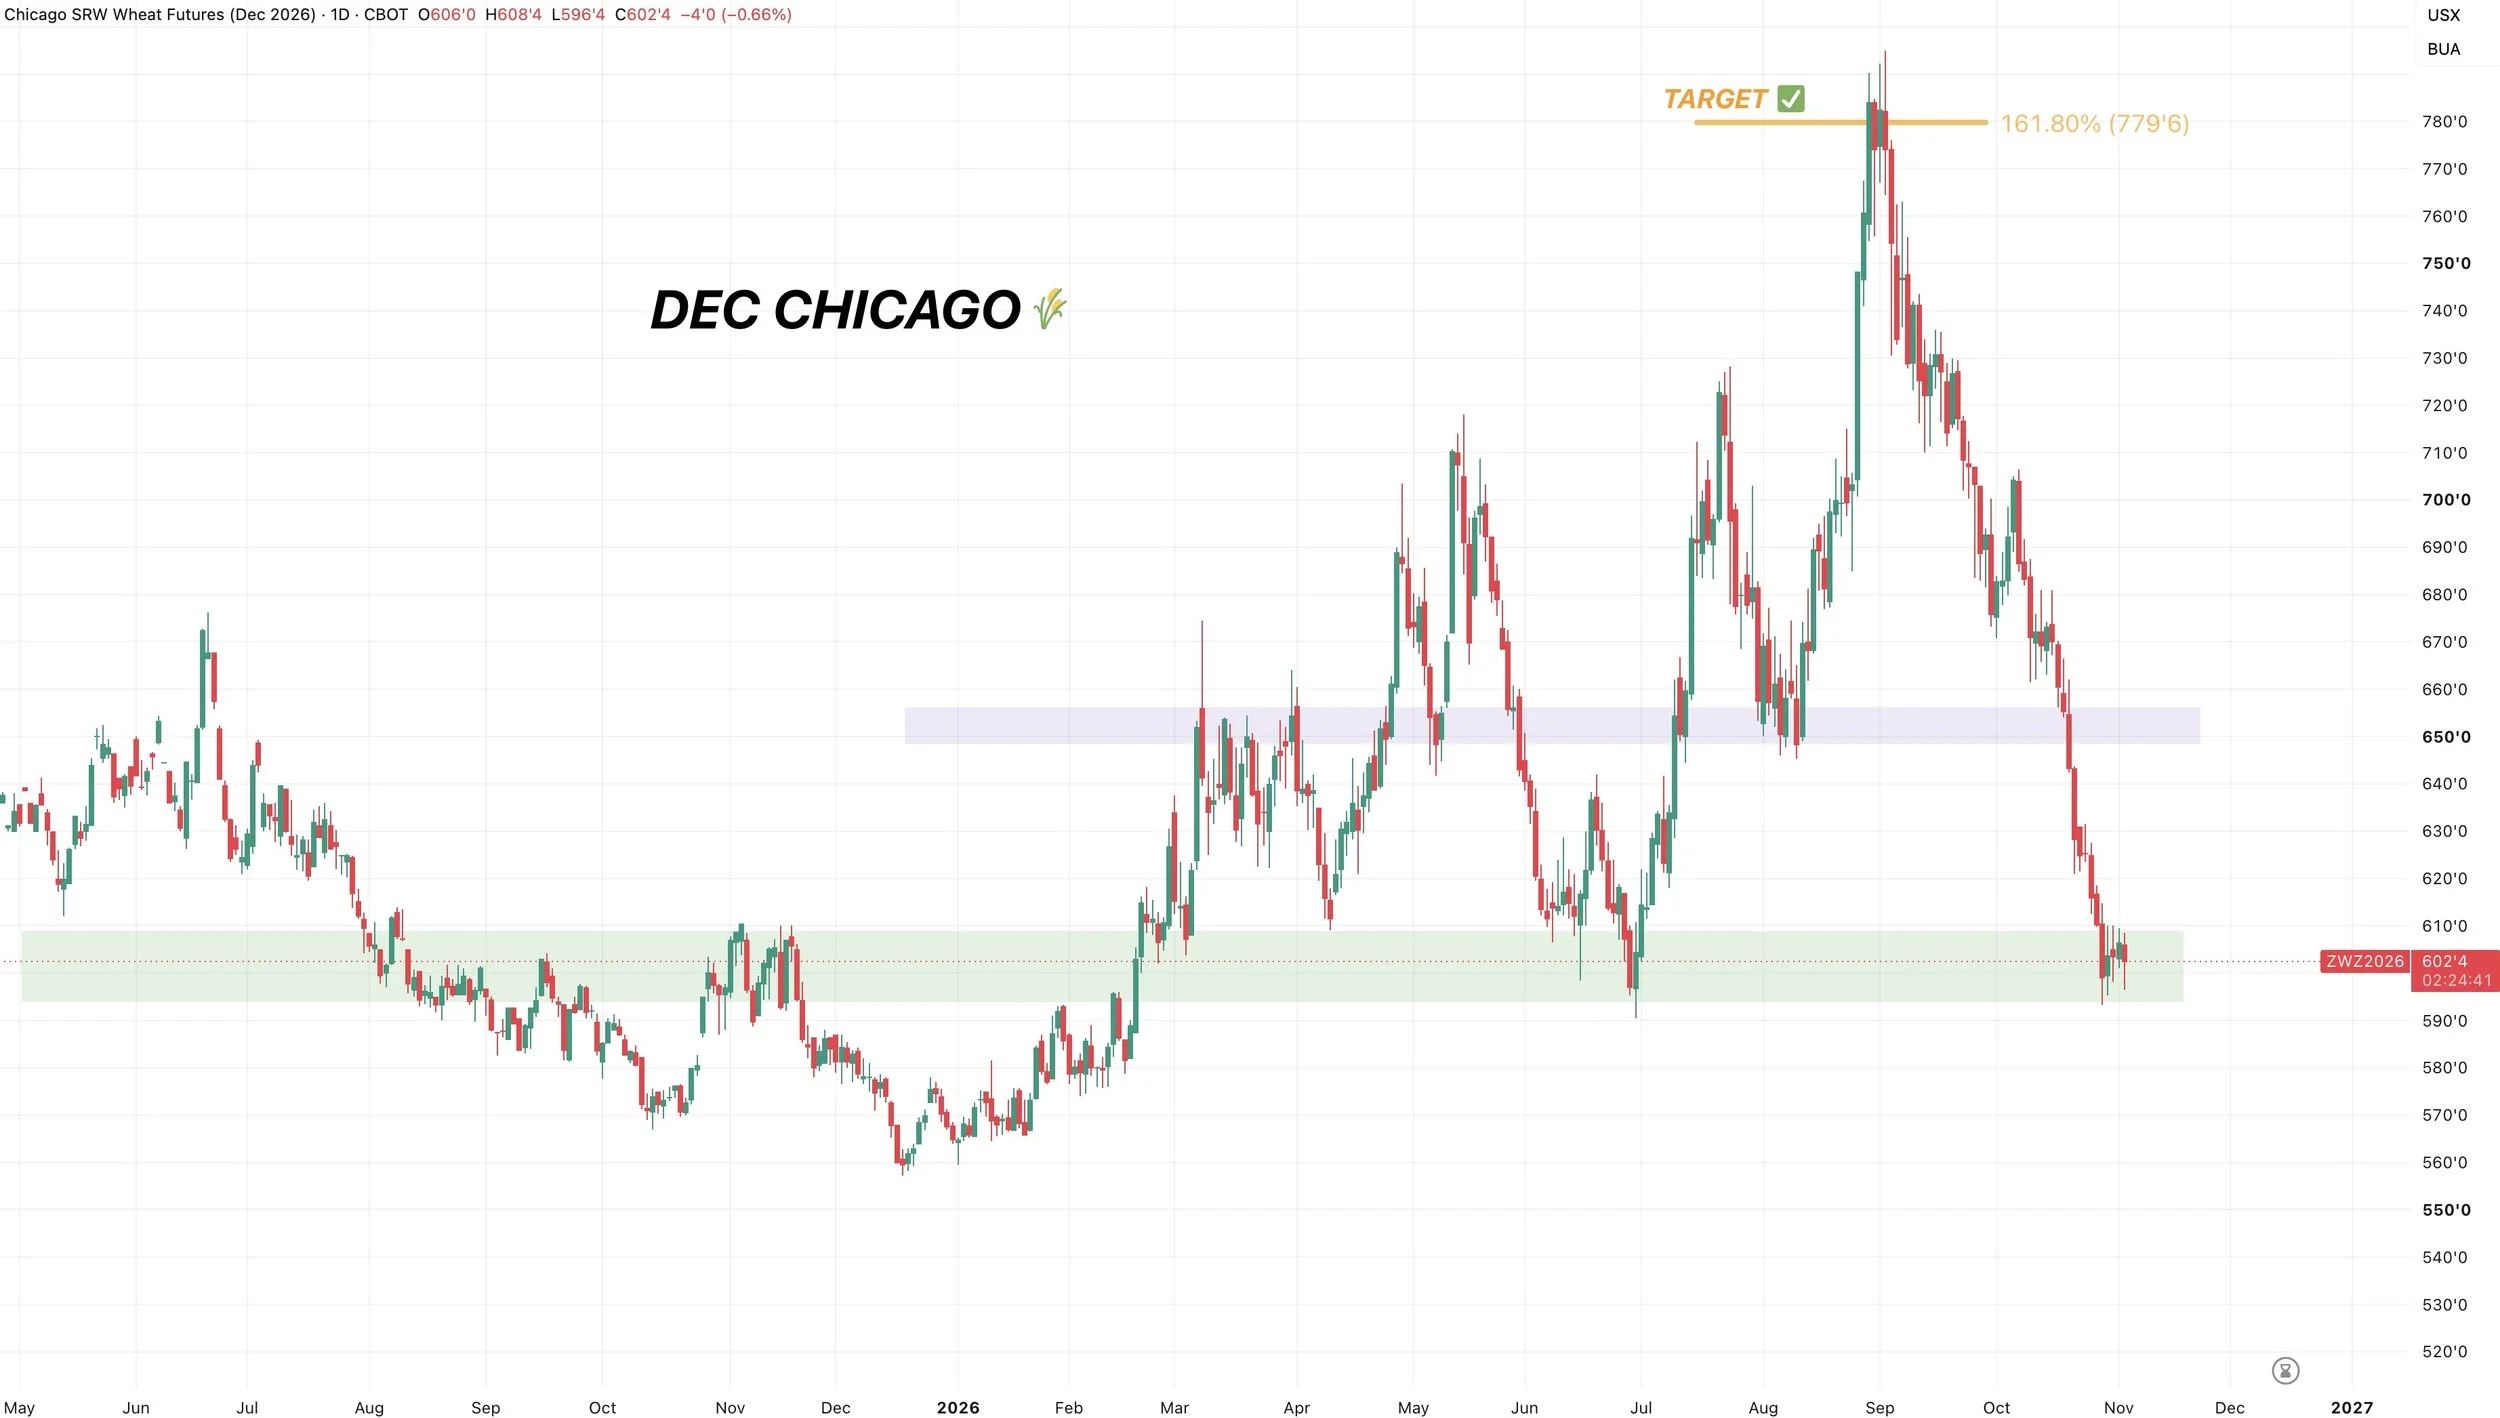
Both are also incredibly oversold.
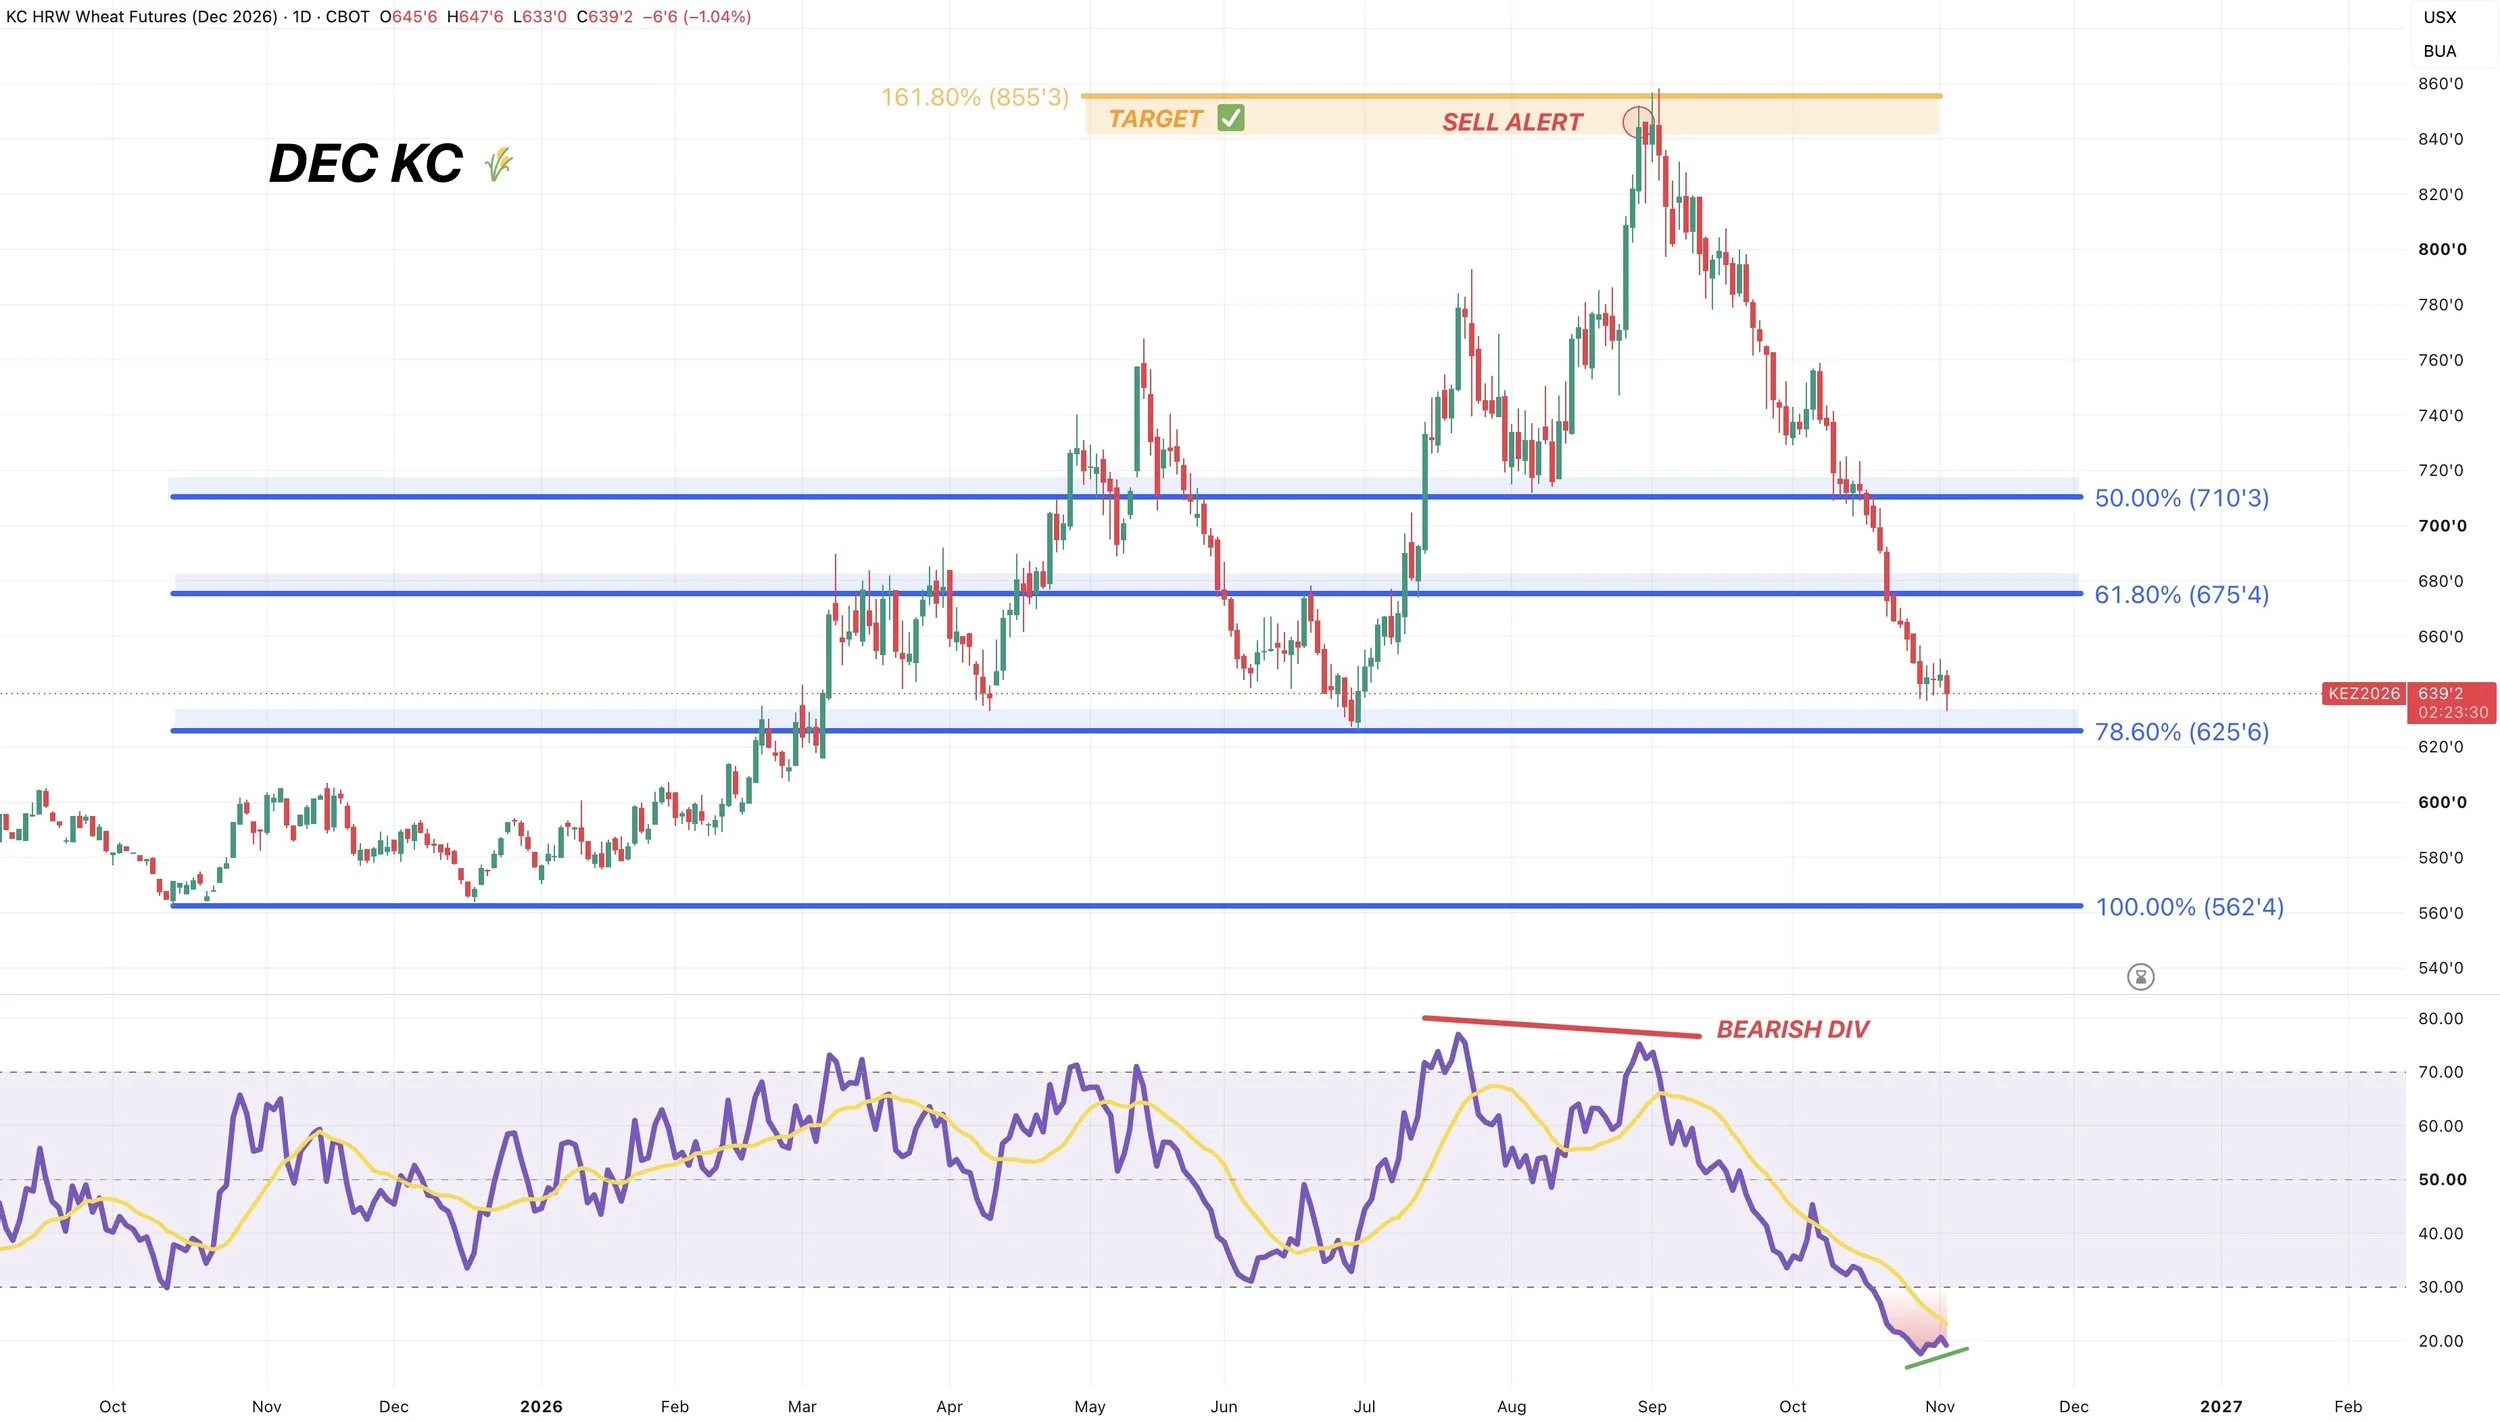
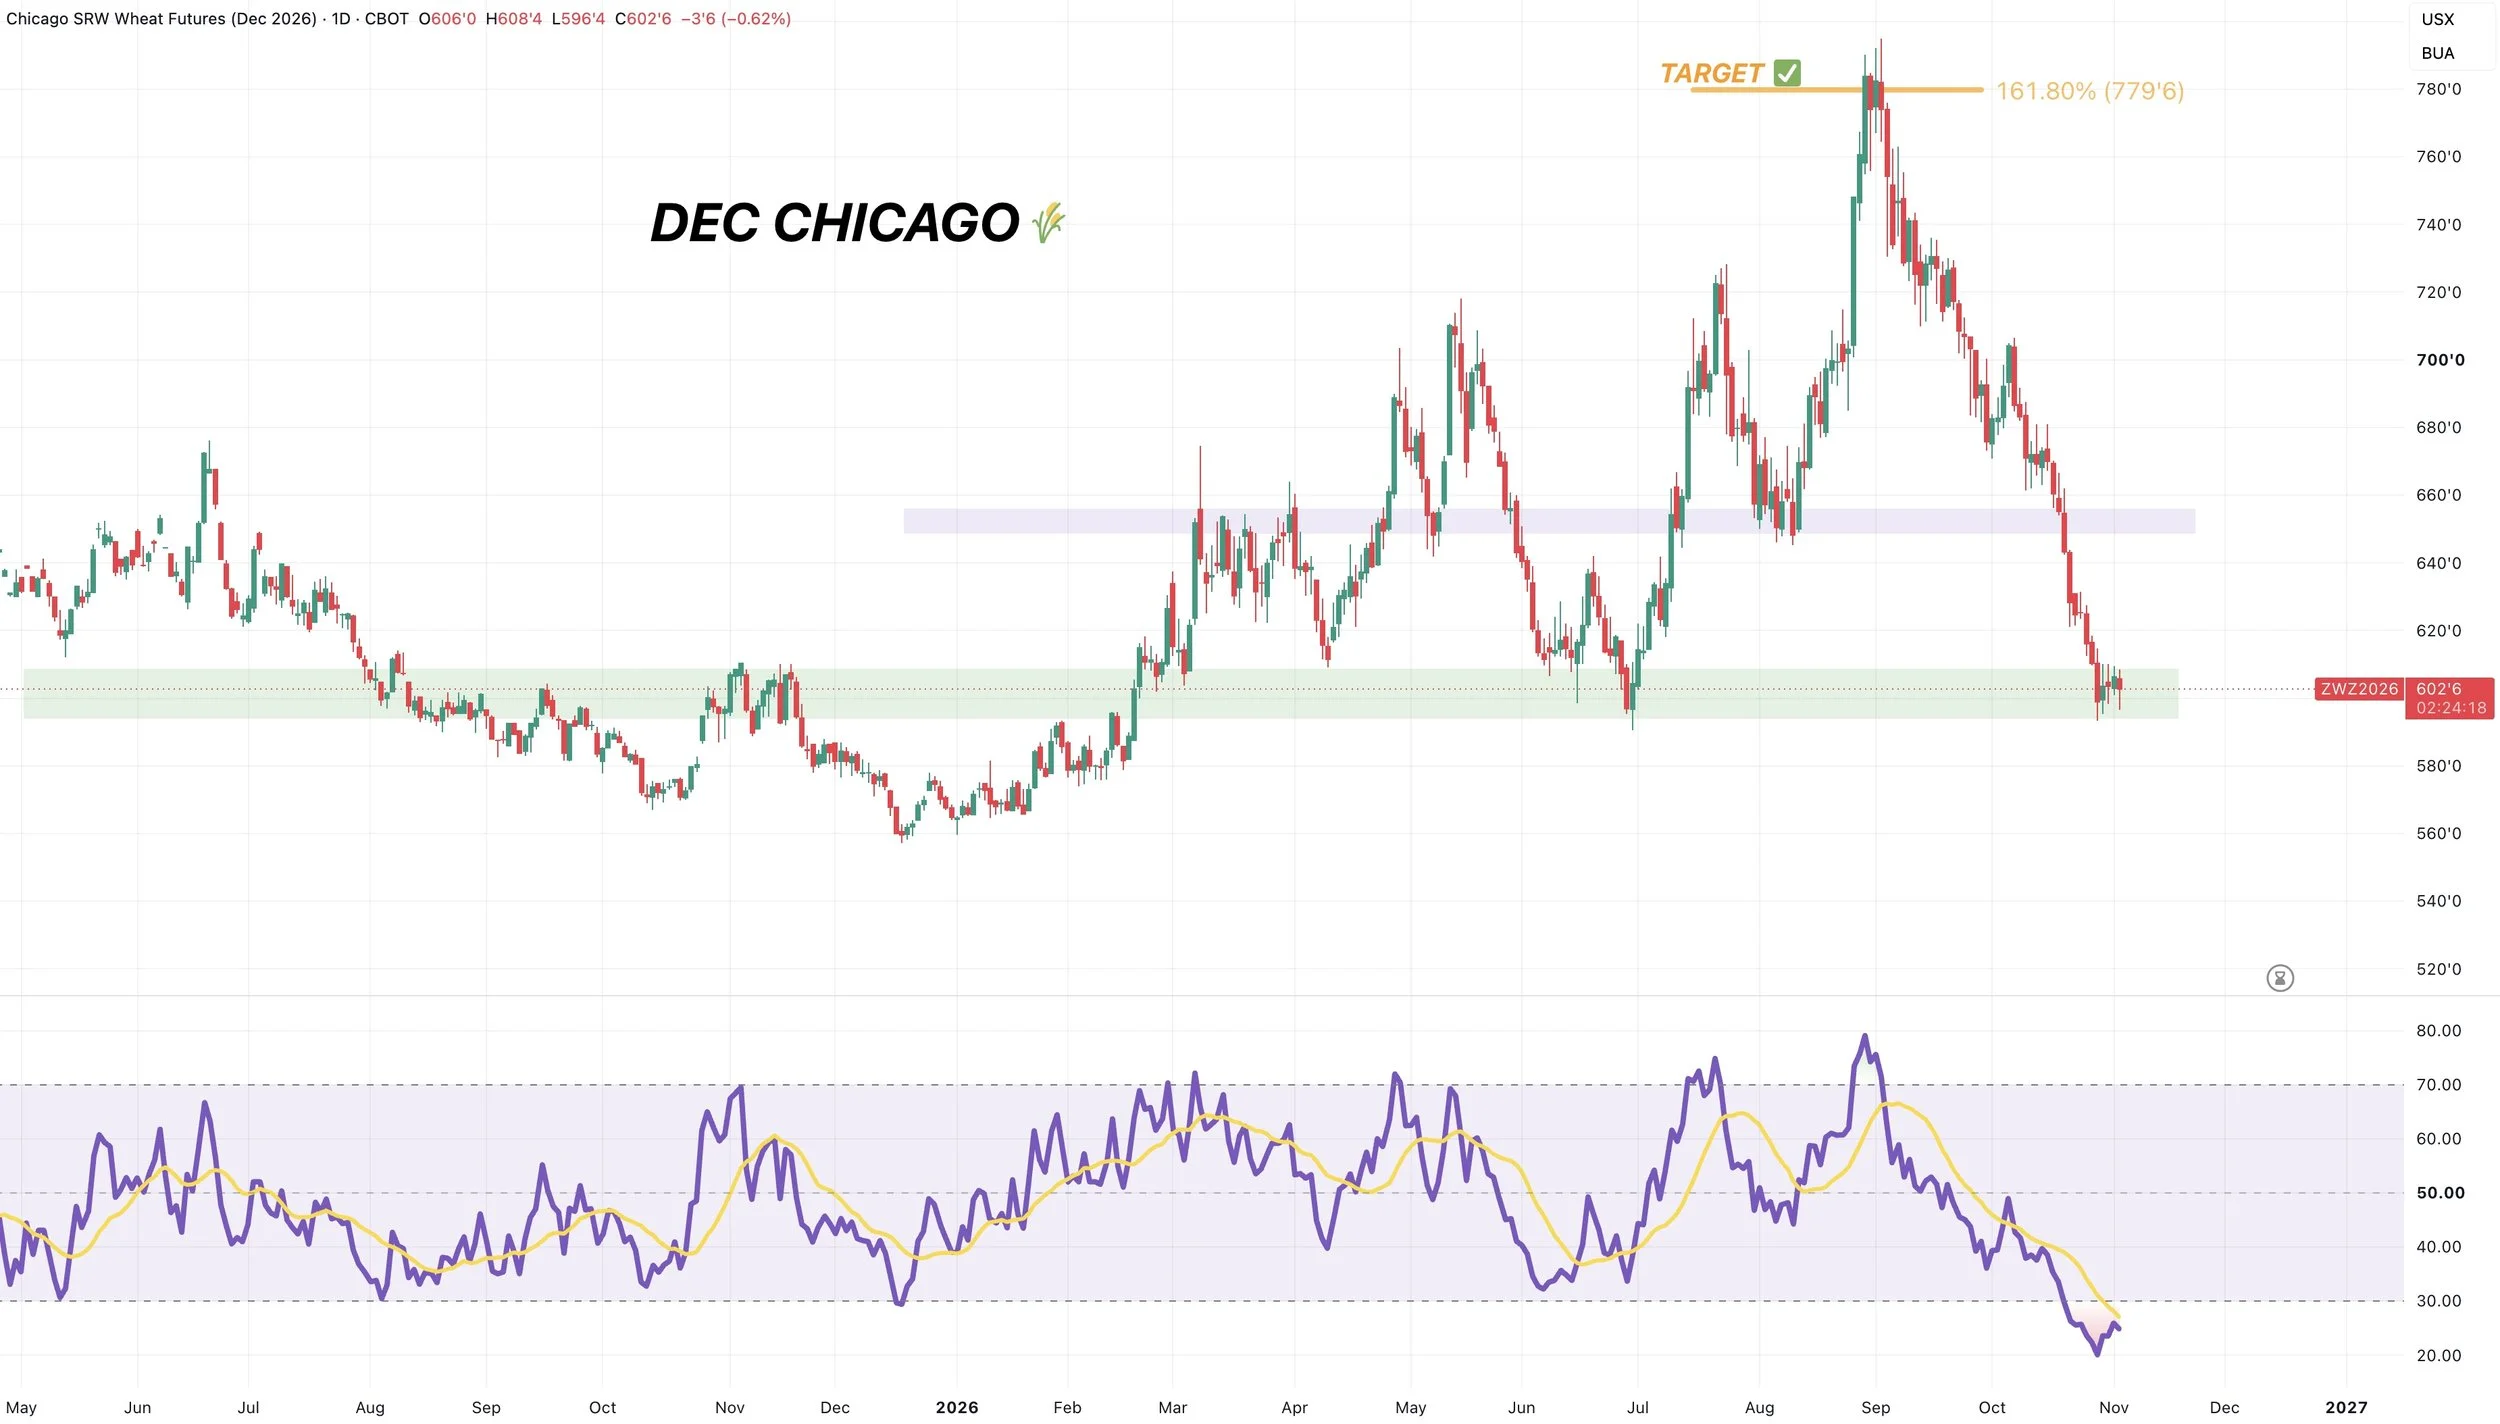
Again, being oversold in itself does not tell us the bottom is in. Markets can stay oversold.
But one thing I am watching for is bullish divergence.
KC wheat specifically did post new lows. Yet the RSI has not yet.
This is potential bullish divergence. Not confirmed divergence.
For this to be confirmed, we need to see the RSI post a higher low. If it can do so, it would be a positive sign and be considered bullish divergence.
Wheat Trade Example:
You could consider layering into some wheat calls with the cheaper implied volatility.
Want to Talk?
Our phones are open 24/7 for you guys if you ever need anything or want to discuss your operation.
Jeremey & Office: (806)484-1214
Sebastian: (605)280-1186
Email: sfrost@dailymarketminute.com
Hedge Account
Interested in a hedge account? Use the link below to set up an account or give us a call.