
WILL USDA GIVE OPPORTUNITY OR CLOSE THE DOOR?
AUDIO COMMENTARY
Cattle charts look a little nervous
Great action yesterday, disappointing today
This USDA report isn’t yield or demand. It is stocks & acres
Last year USDA changed acres several times
This report tends to have a wide range
What could happen for a bullish reaction?
The way the USDA adjusted acres last year opens the door for this report to be one thing now and something different months from now
Corn & wheat been negative 4 years in a row
Biggest thing in 2010 was the stocks
Some think feed demand is overstated. Why?
What surprises could we see in USDA?
How big of impact do acres have to carryout?
We don’t want bigger acres total
Naturally the market prices in more acres from March to June
Lower stocks makes weather more important
Weather is looking hot soon
Europe weather, big deal or not?
Crop looks somewhat behind
Rain makes grain until it doesn’t
If we get a rally.. get yourself prepared
Grain marketing is not one size fits all
Indicators suggest friendly (charts below)*
Bean oil is still holding support (chart below)*
Wheat needs to hold here (chart below)*
Chart breakdowns below audio*
Listen to today’s audio below
Want to talk?
Office: (806)484-1214
CHART BREAKDOWNS
Dec Corn 🌽
Yesterday we had a key reversal off contract lows.
We are also showing bullish divergence on the RSI.
Prices made new lows. The RSI did not. Often tells us downside momentum could be getting weak and its a sign of a possible reversal.
So if we were looking for a sign of a local bottom, this is one of the best ones we’ve had the entire sell off.
However, we need to break above $4.50 to confirm we have put in a local bottom.
That’s last week highs, and we have some resistance from the Jan lows.
If we can do that, we have a volume gap and could run.
$4.60 to $4.70 claws back 38.2% to 50% of the entire sell off. That’s where I’d be looking to reward.
That 50% level at $4.70 specifically is prior support from April, and resistance from last year.

The MACD momentum indicator also flipped bullish for the first time since April.
Another positive sign.
Do we have to put in some short term lows here? No we do not.
But we do have some possible signs of one.
The ball is in the USDA’s court of course.

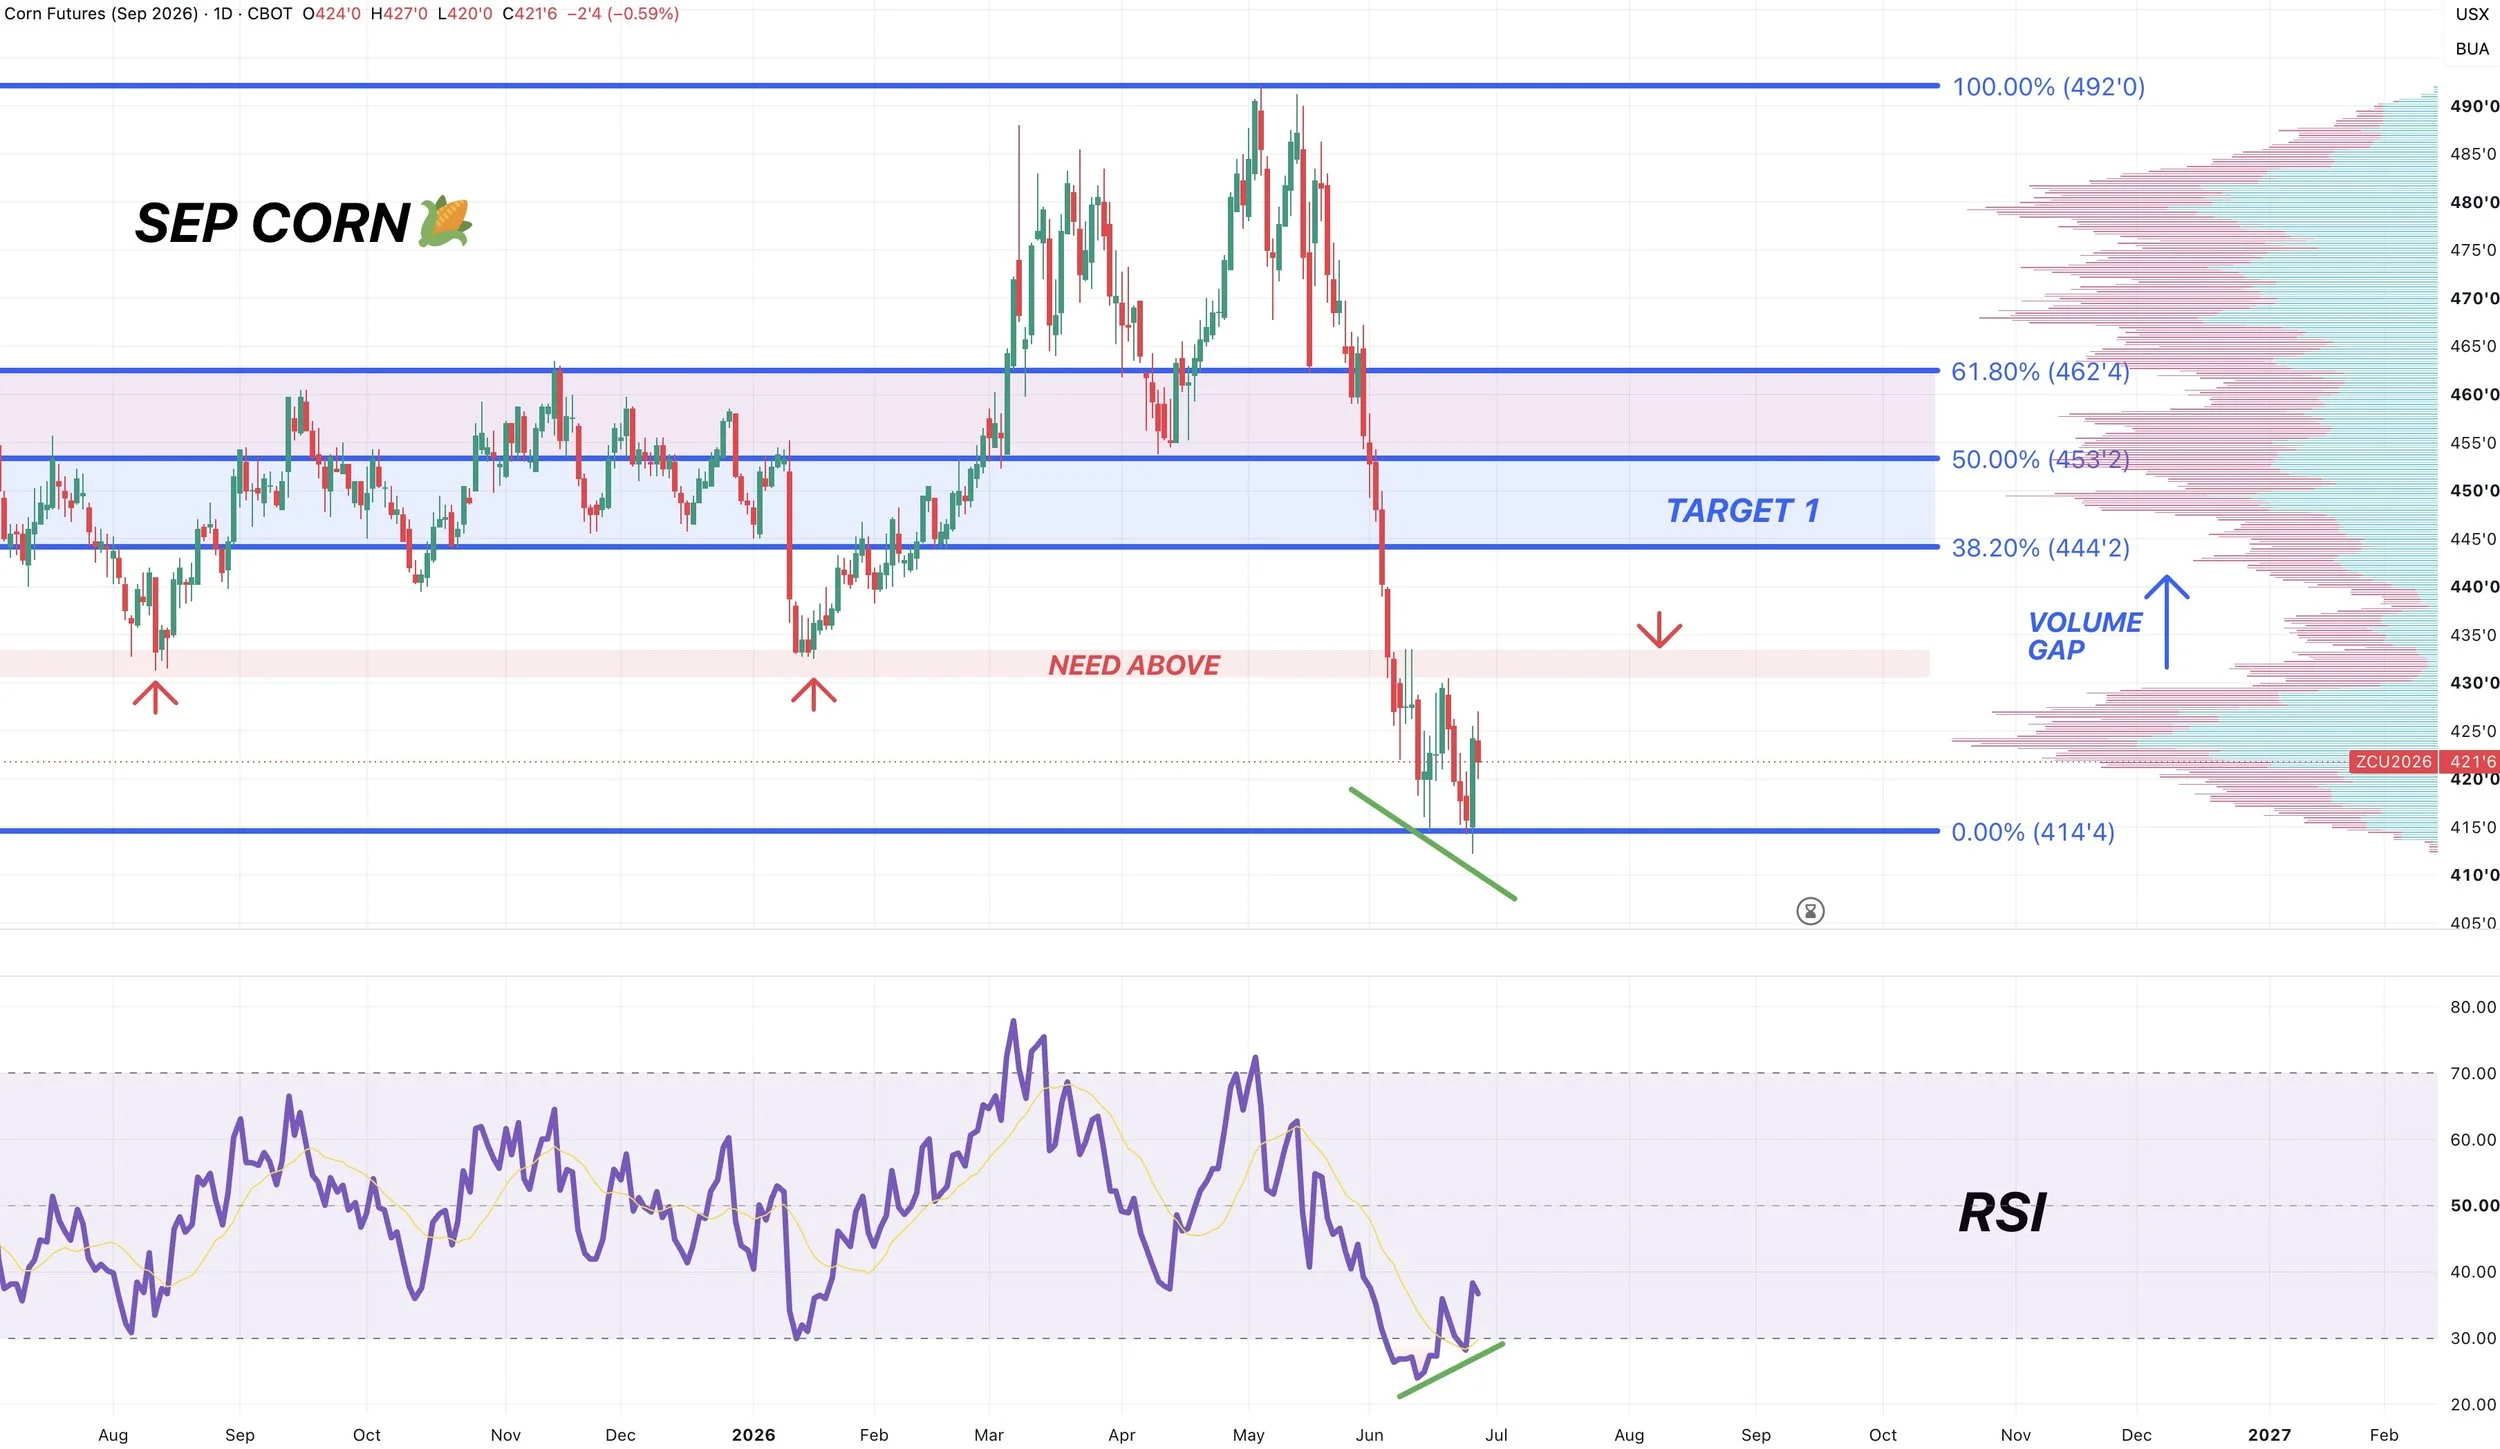
Sep Corn 🌽
Very similar set up to Dec.
We have bullish divergence. We had the key reversal yesterday.
That’s all positive stuff. But we need to break above that $4.30 area to confirm some lows here.
If we can do that, we have a volume gap to the upside. Meaning no resistance, so prices can move through there fast.
If we get a rally into $4.45 to $4.55 that’s where I would want to defend.
Aug Beans 🌱
Two spots to watch.
The recent highs. And the recent lows.
Which ever direction we break, gives us our next leg.
If we break above the recent highs, we could have some room to run. As there is a pretty wide volume gap. I would look to defend that old range if we can get there.
The same thing can be said to the downside. If we break the recent lows, we have a volume gap lower. And could ultimately fall to $10.85 which is the 61.8% retracement of the rally from contract highs to lows.
One thing to note is that the MACD flipped bullish for the first time since April. The last two times it flipped, resulted in at least a small rally. So my bias does lean higher here. But need above last week’s highs.

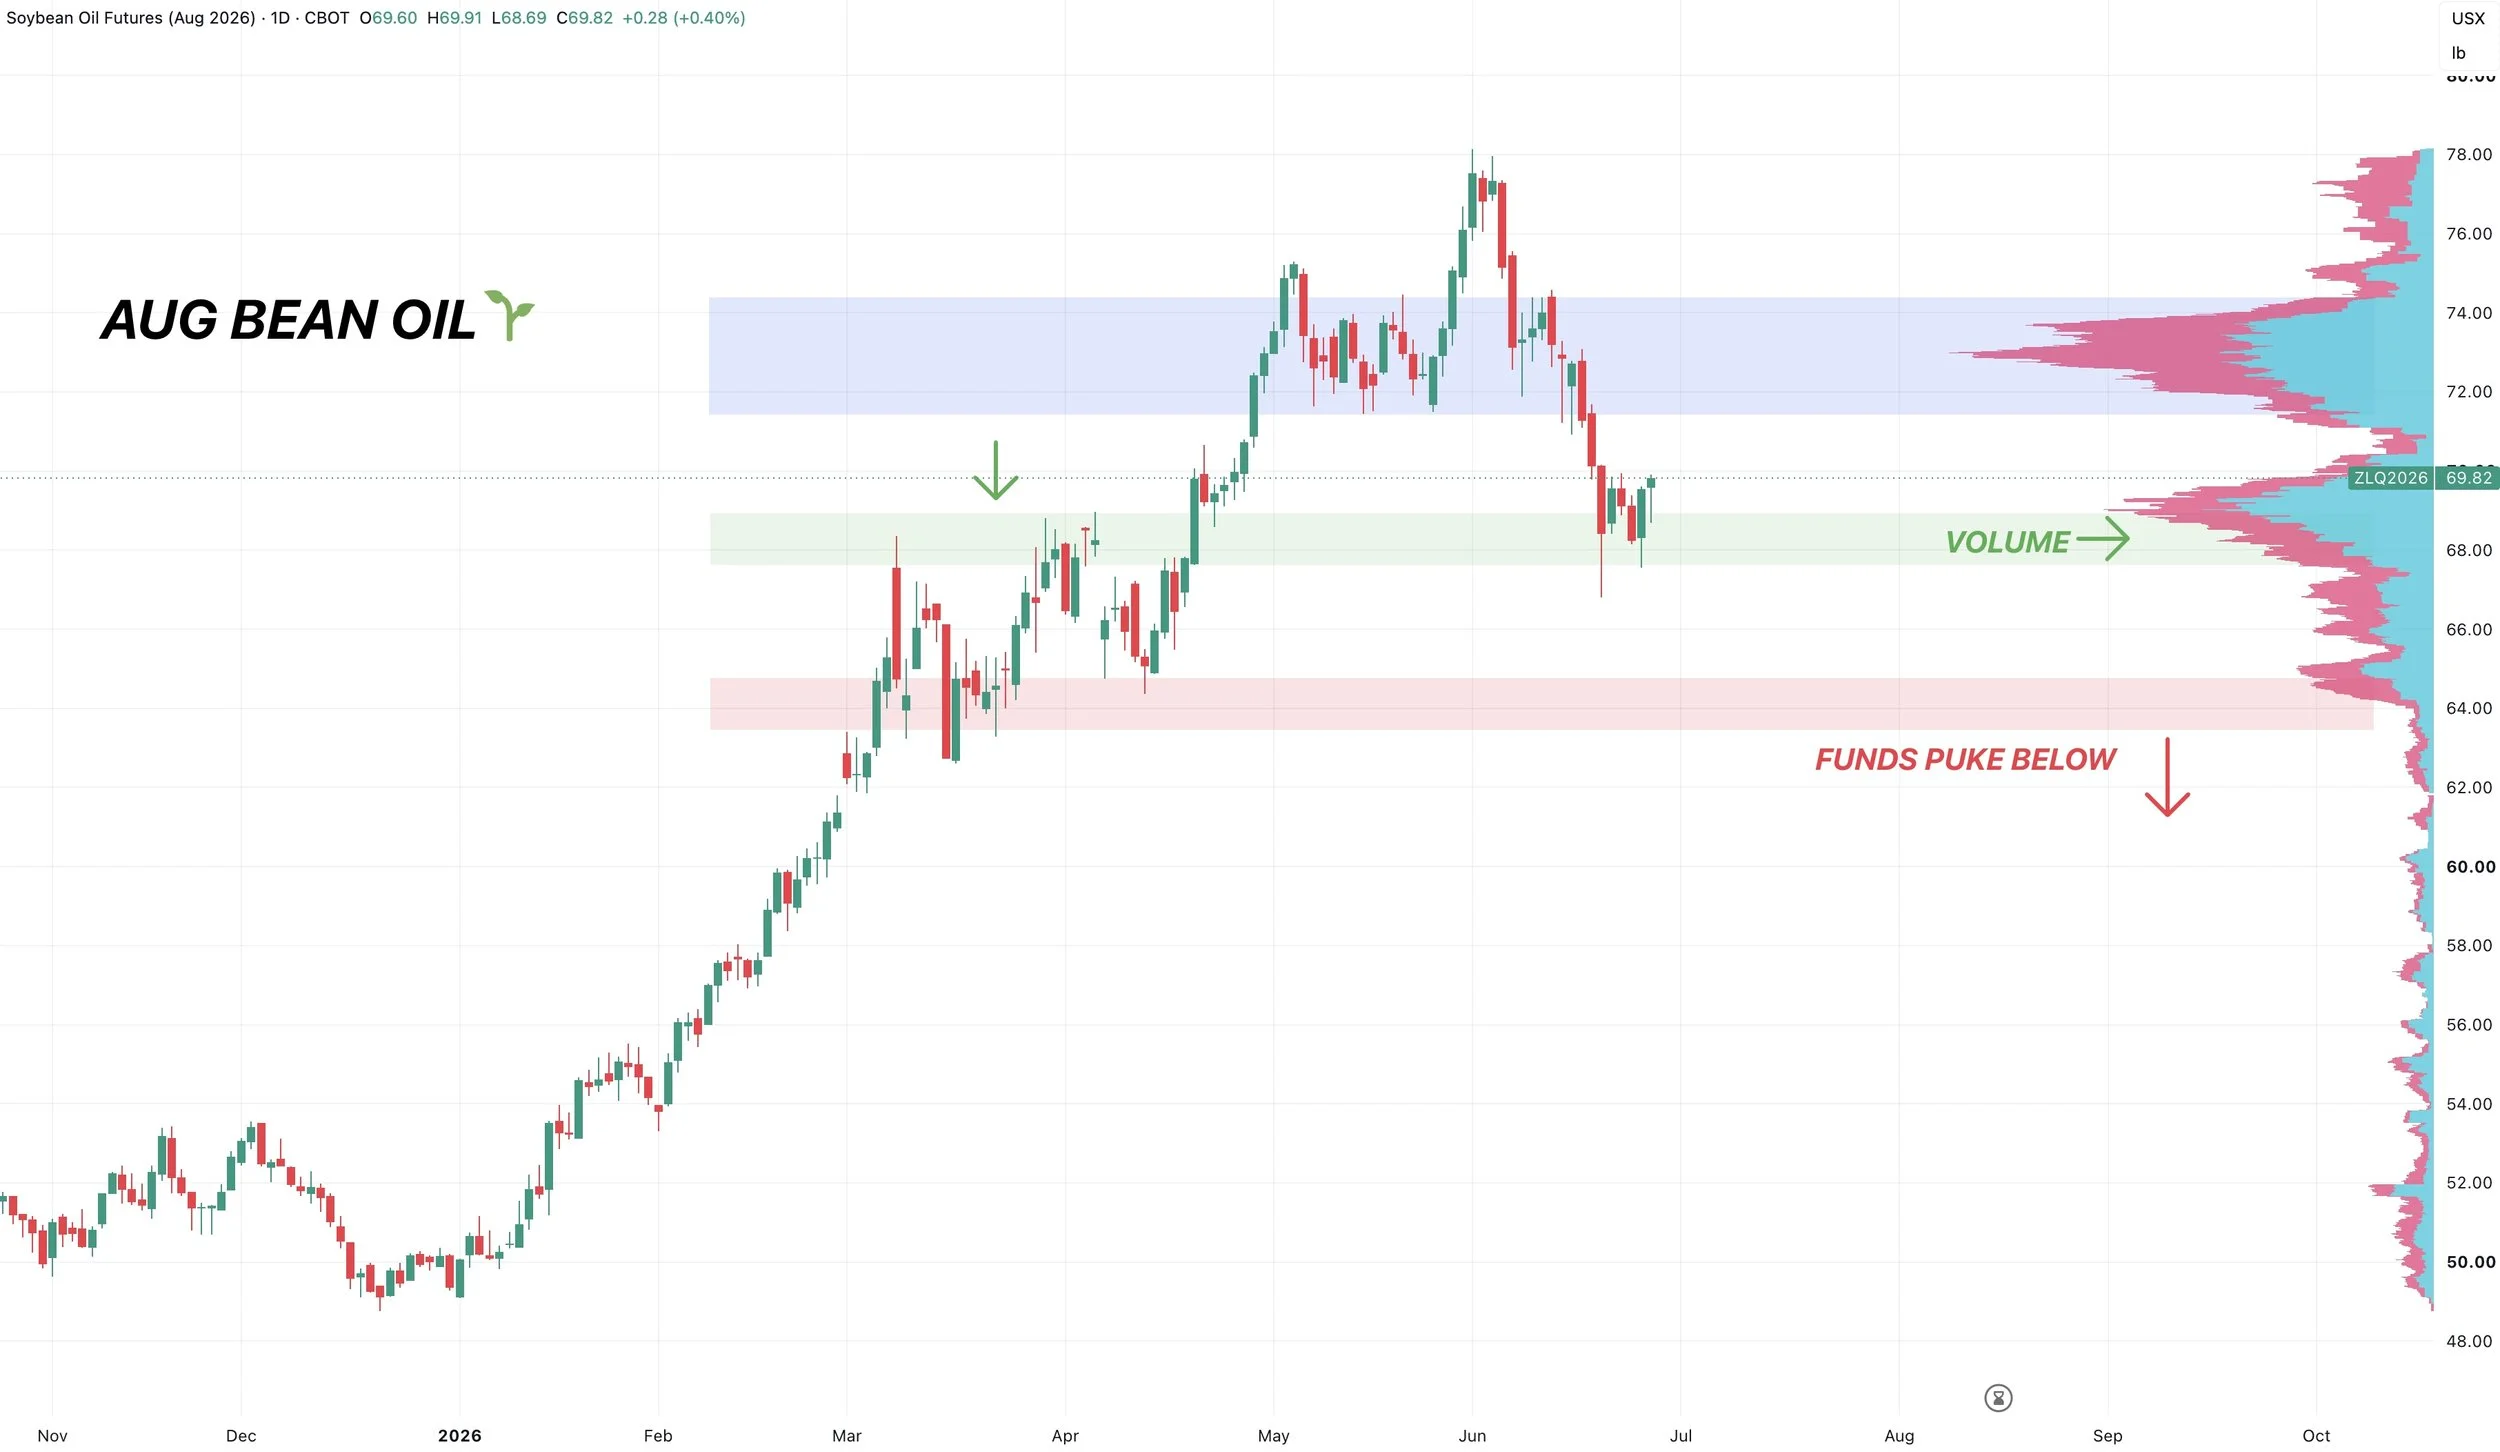
Aug Bean Oil 🌱
I’m showing bean oil because the funds are heavily invested in this.
Currently bean oil is holding support right at those prior highs. This is also an area of high volume.
We want to see us continue to hold here.
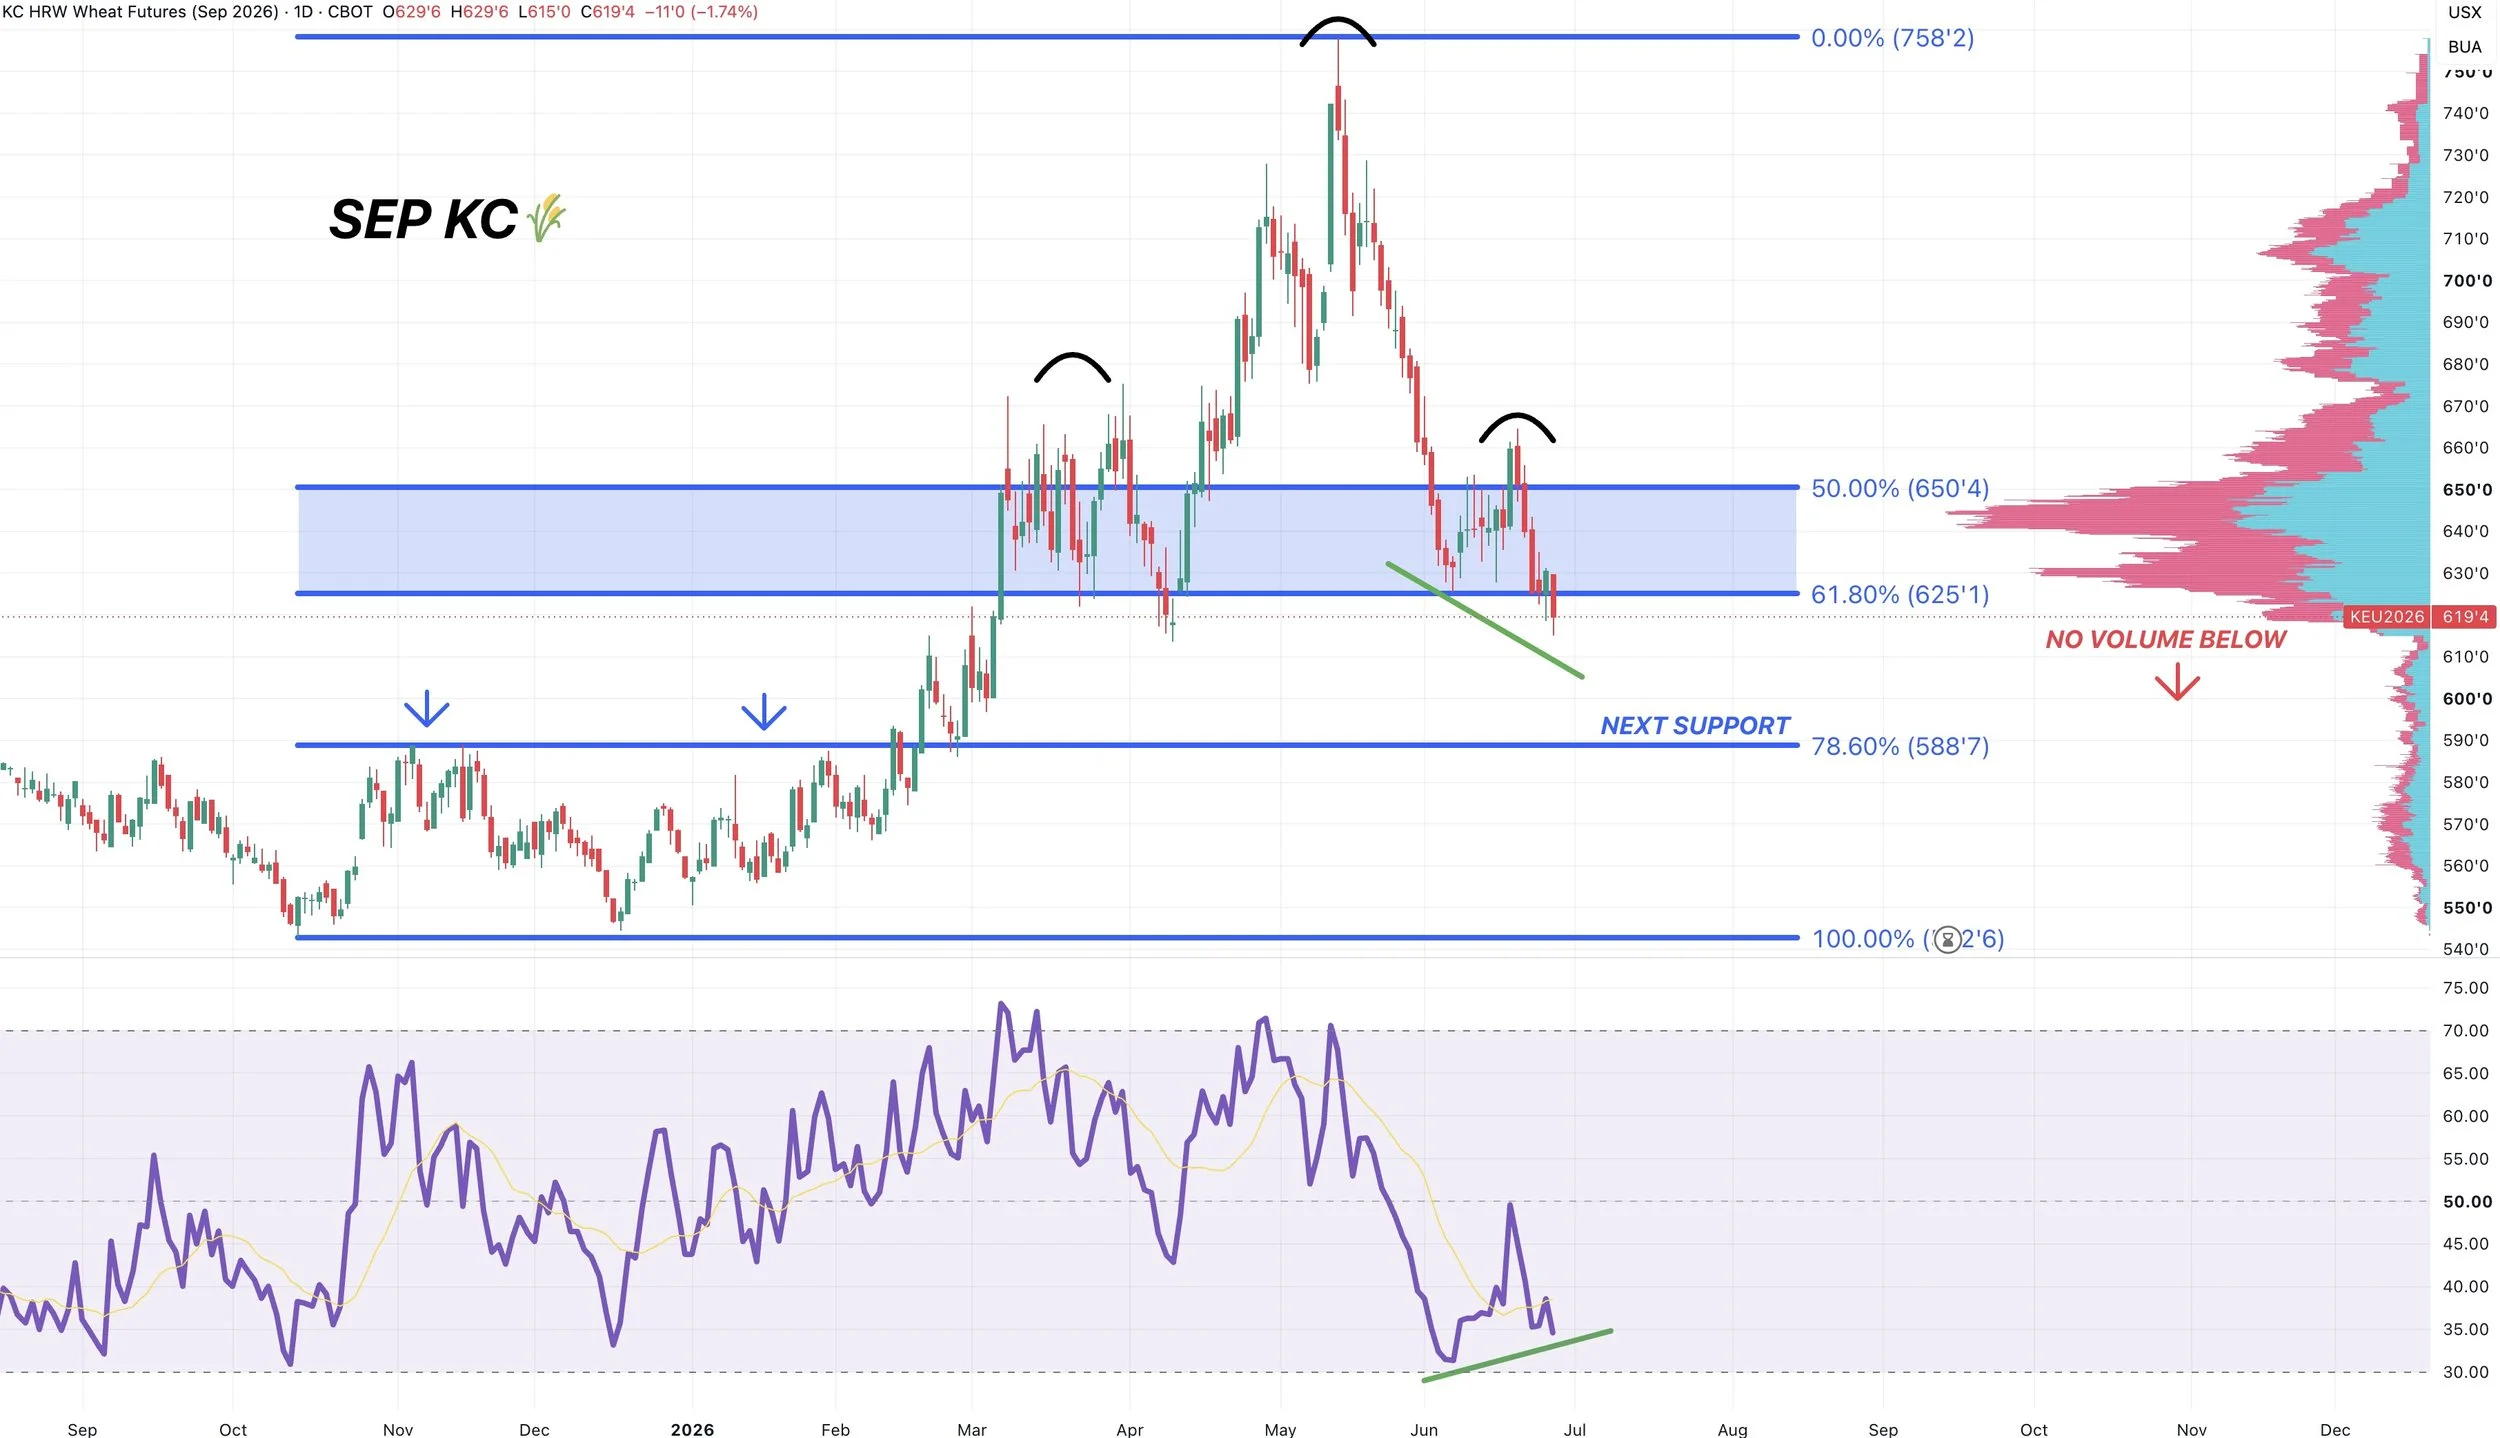
Sep KC Wheat 🌾
Wheat looks the most nervous here.
We closed below the 61.8% retracement from contract highs to contract lows. As we posted new lows for the move.
We still have a tiny amoutn of support at those lows from April.
We need to bounce ASAP or there is a gap of air to the downside.
The next support would be $5.88
One positive thing to note is we are showing bullish divergence on the RSI, similar to corn.
But we need to bounce right now, as there is no support below this level. Along with that head and shoulders pattern.
Want to Talk?
Our phones are open 24/7 for you guys if you ever need anything or want to discuss your operation.
Jeremey & Office: (806)484-1214
Sebastian: (605)280-1186
Email: sfrost@dailymarketminute.com
Hedge Account
Interested in a hedge account? Use the link below to set up an account or give us a call.