
MARKET UPDATE
You can scroll to read the usual update as well. As the written version is the exact same as the video.
Timestamps for video:
Overview: 0:00min
Ever Top in Sep?: 3:00min
Corn Charts: 7:10min
Bean Charts: 11:20min
Wheat Charts: 15:55min
Cattle Charts: 17:20min
Want to talk?
Office: (806)484-1214
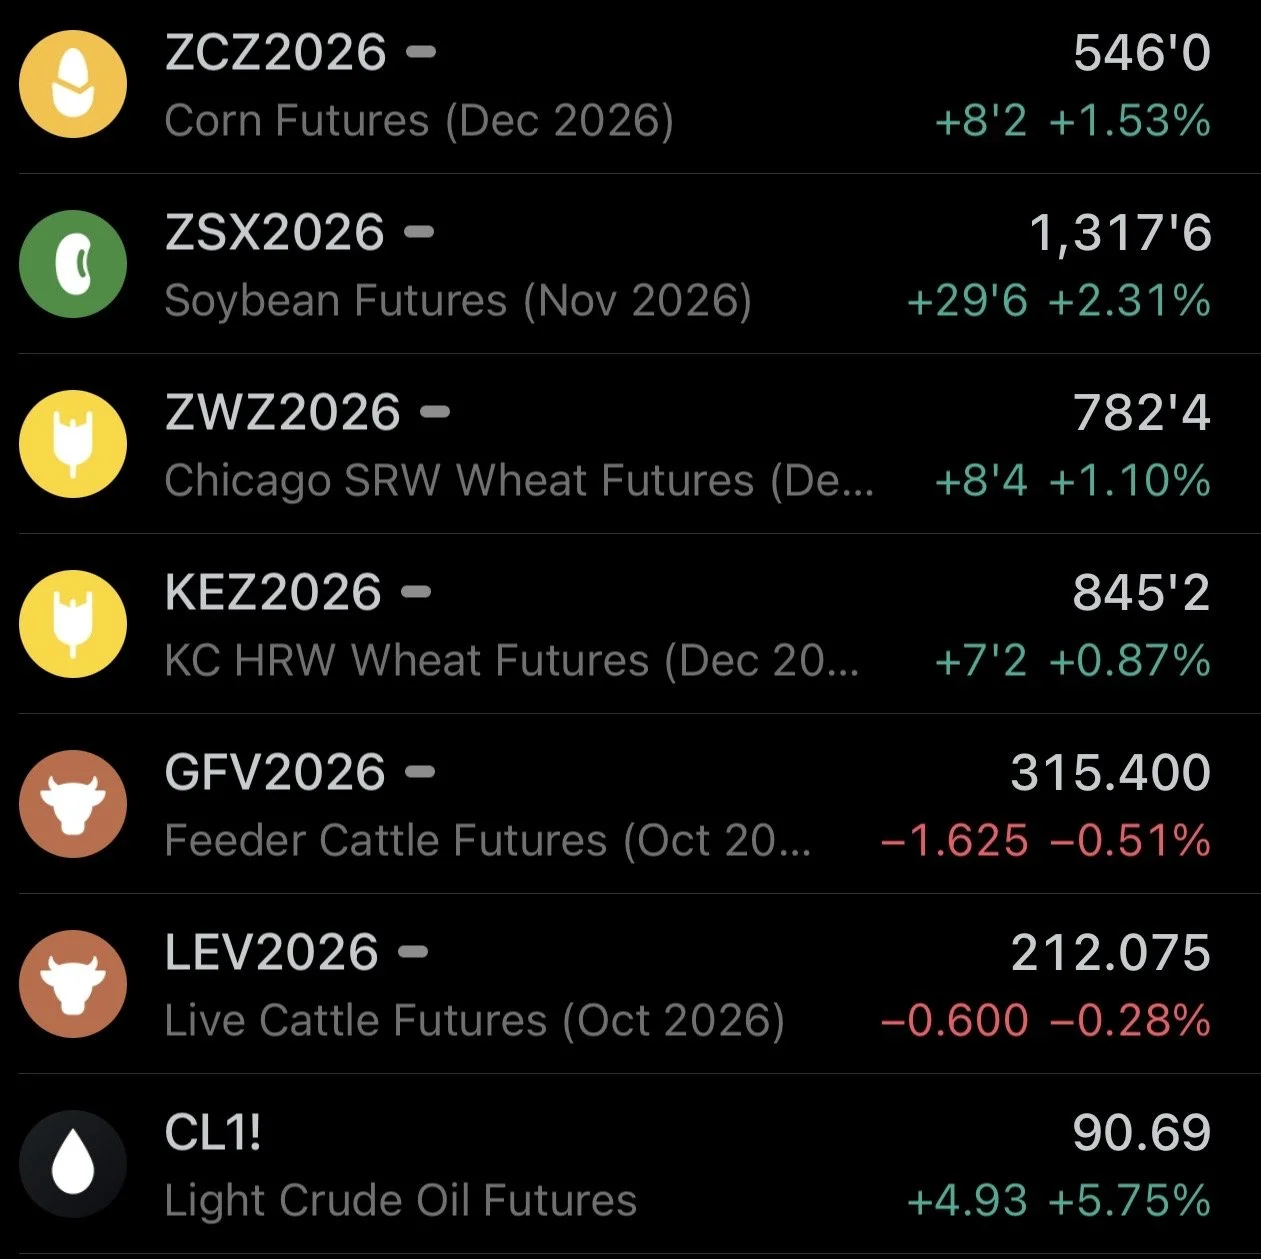
Futures Prices Close
Overview
Great day across the grains today, with soybeans leading the way higher this time.
Crude oil is back above $90 with escalations in the Middle East.
Wheat got a boost from further headlines over in the Black Sea, as the situation continues to be sporadic and all over the board.
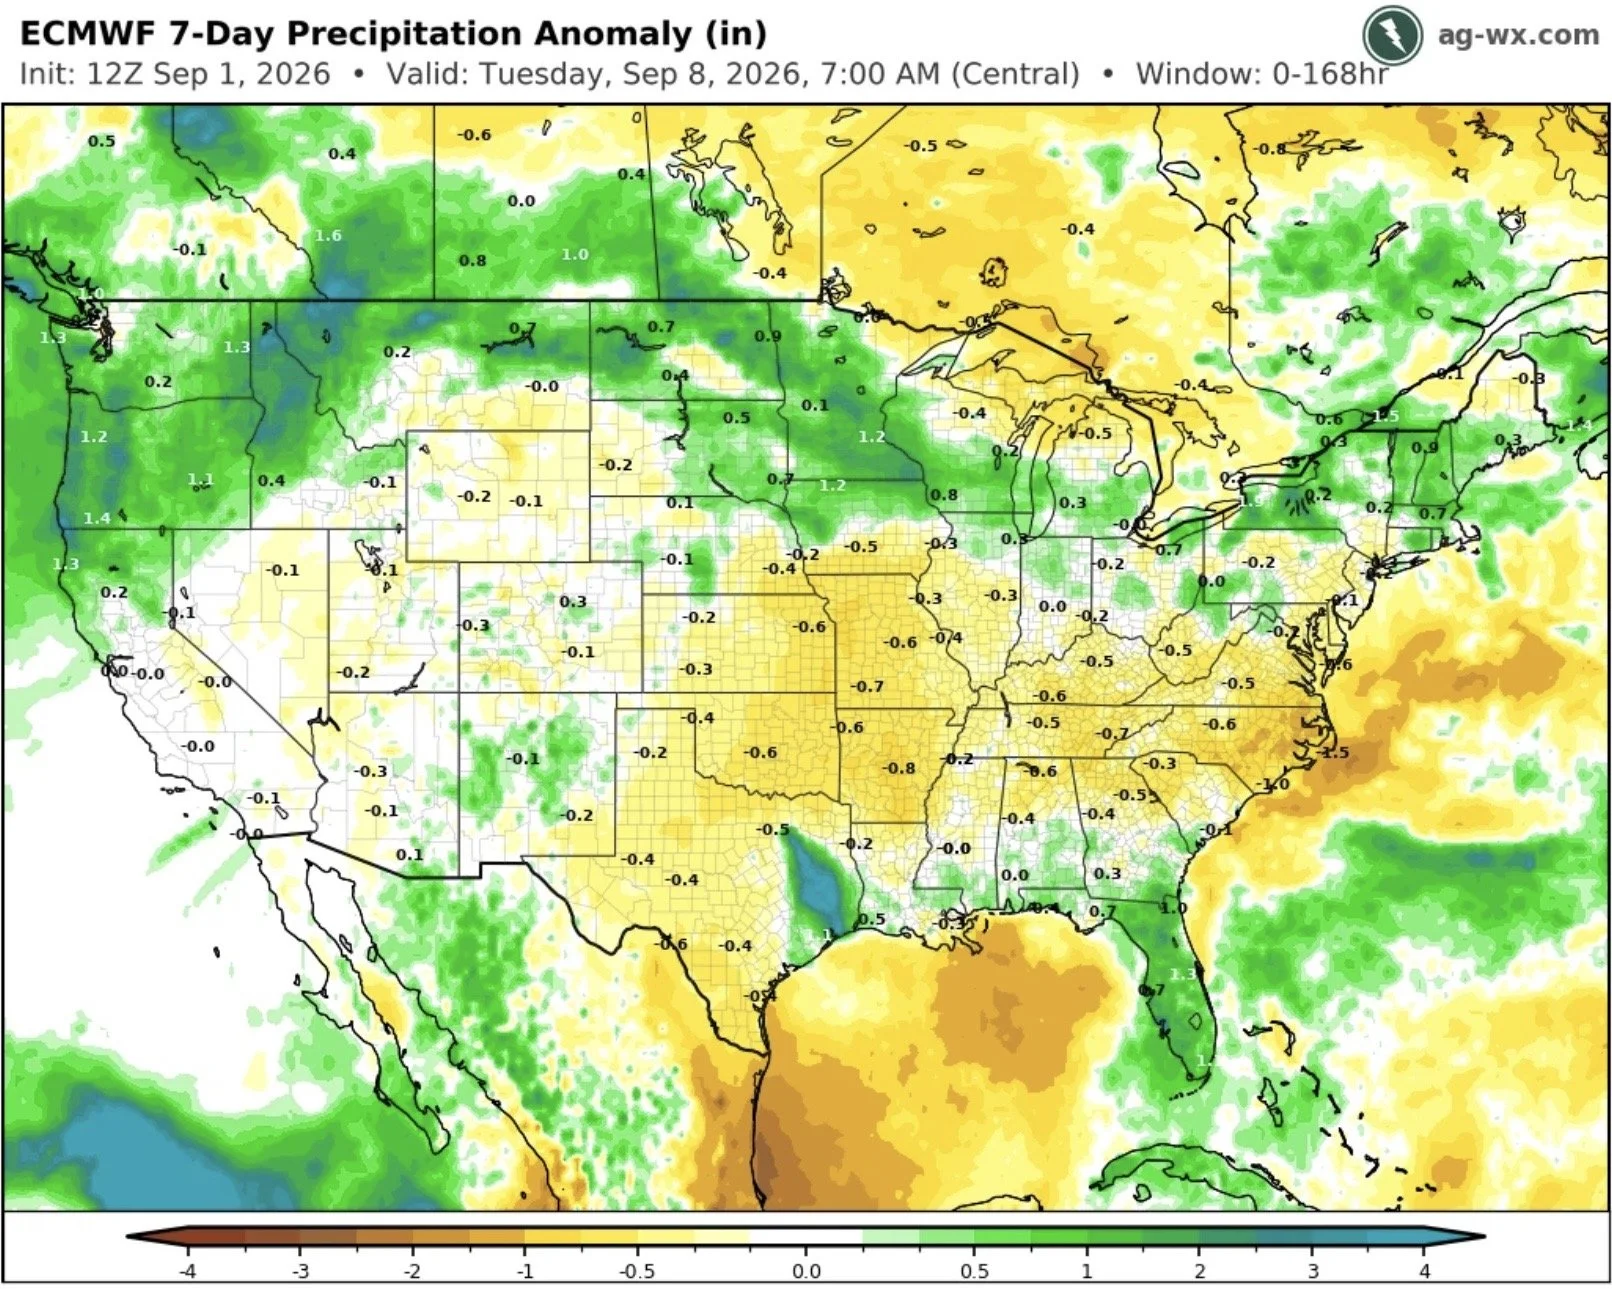
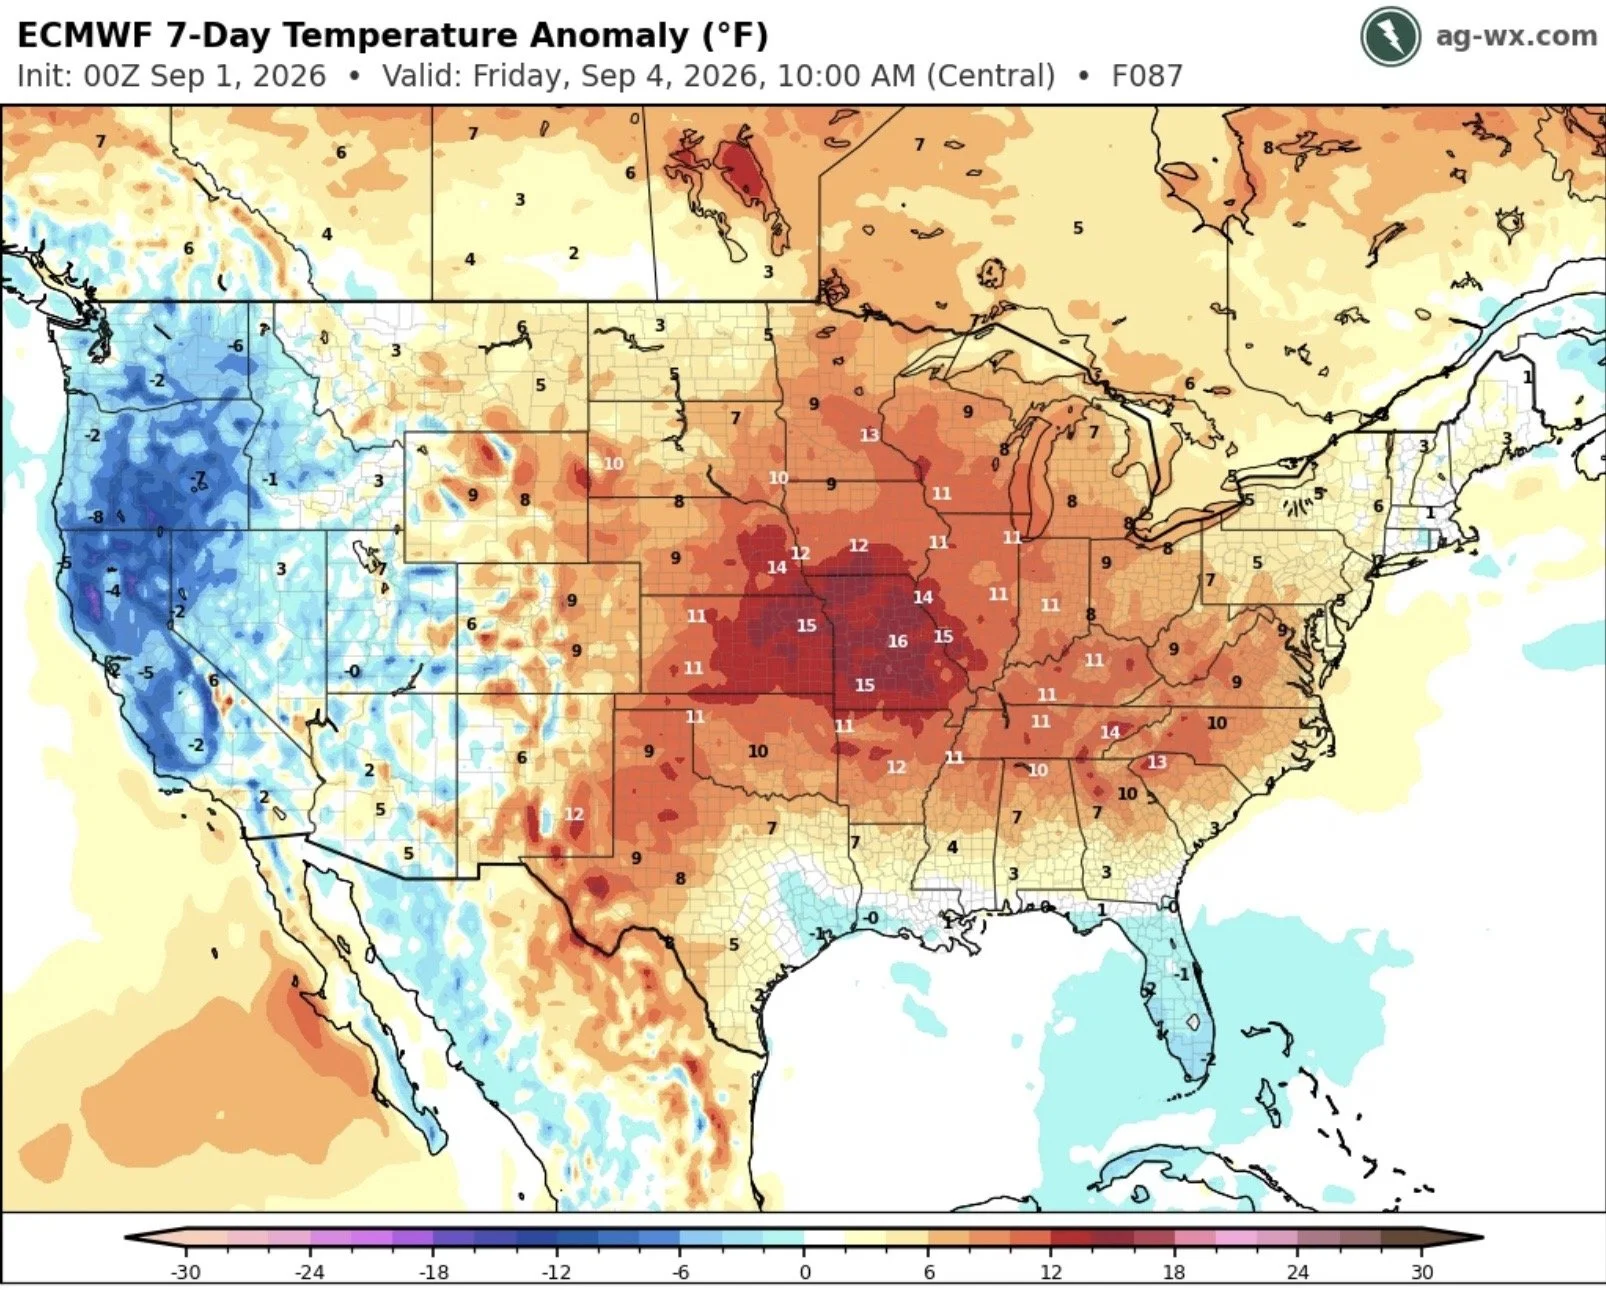
Soybeans are rallying following the surprise drop in crop ratings yesterday, along with some somewhat dry and very hot forecasts ahead.
Soybeans hit $13.00 for the first time since 2023 today.
Here are the forecasts for the next week.
Crop Ratings: How Poor?
The trade was expecting both corn and soybean ratings to be down -1% this week.
Corn came in unchanged at 57%.
Soybeans came in down -2% at 58%.
The market was well aware that the corn crop isn’t great, but now they are starting to question how the bean crop looks as well.
How do these ratings stack up vs history?
First for corn.
Since 2013, the only years that had a lower rating for today's date were 2022 and 2023.
Historically, ratings this poor have led to well below trend line yields.
The current -2.3 bpa deviation from trend the USDA currently has would be the smallest deviation we've seen when ratings were this low.
So it would favor yield coming in lower than it currently is.
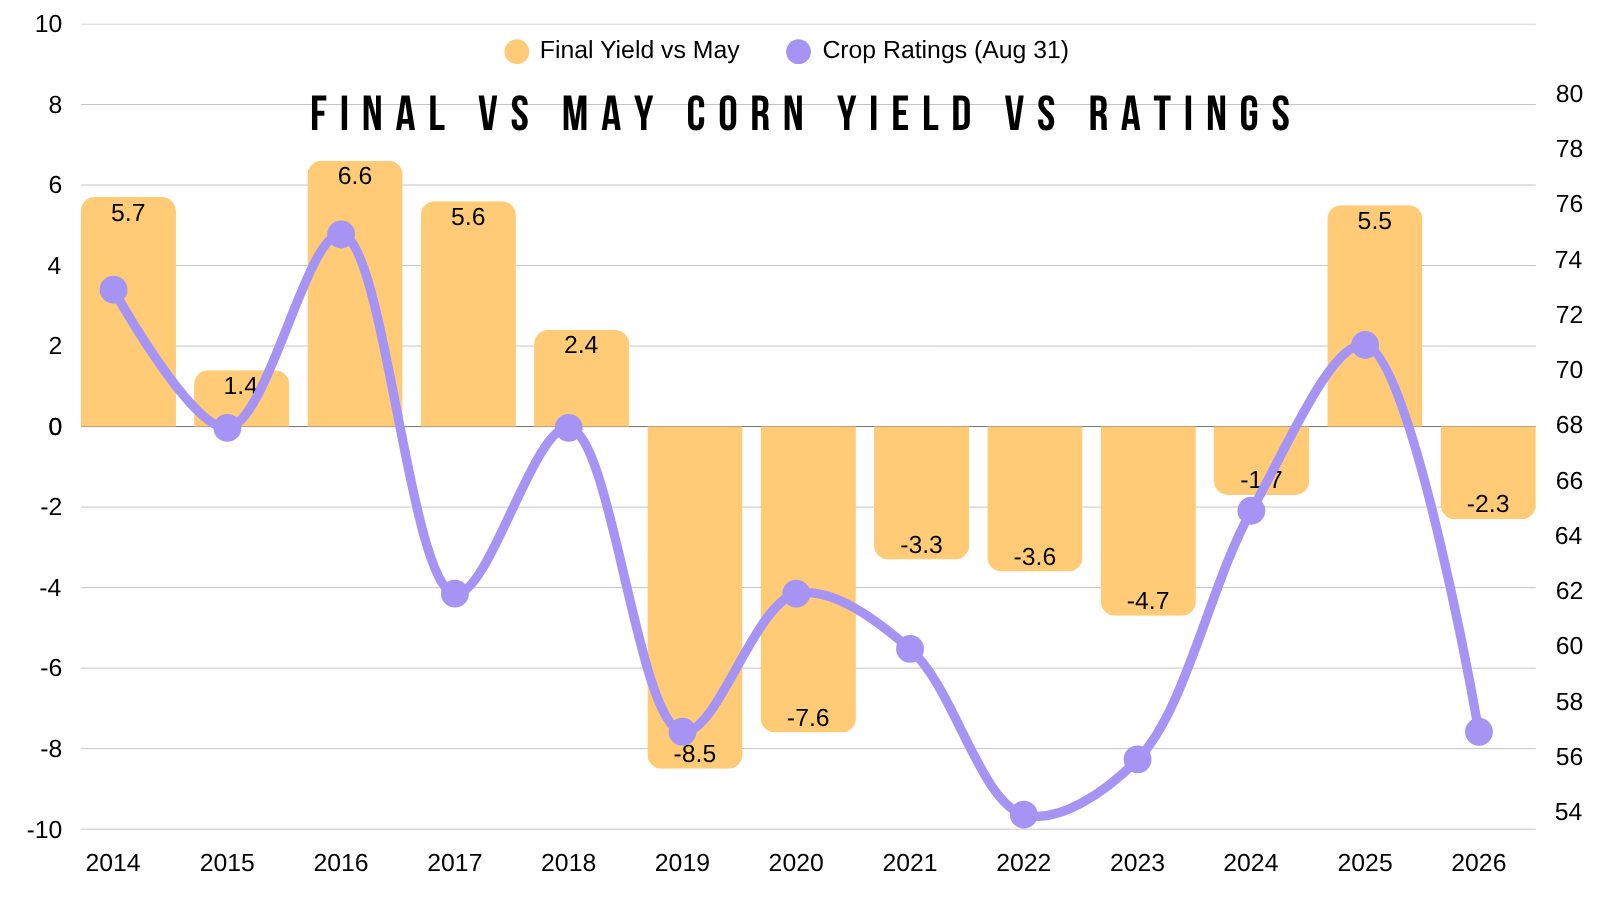
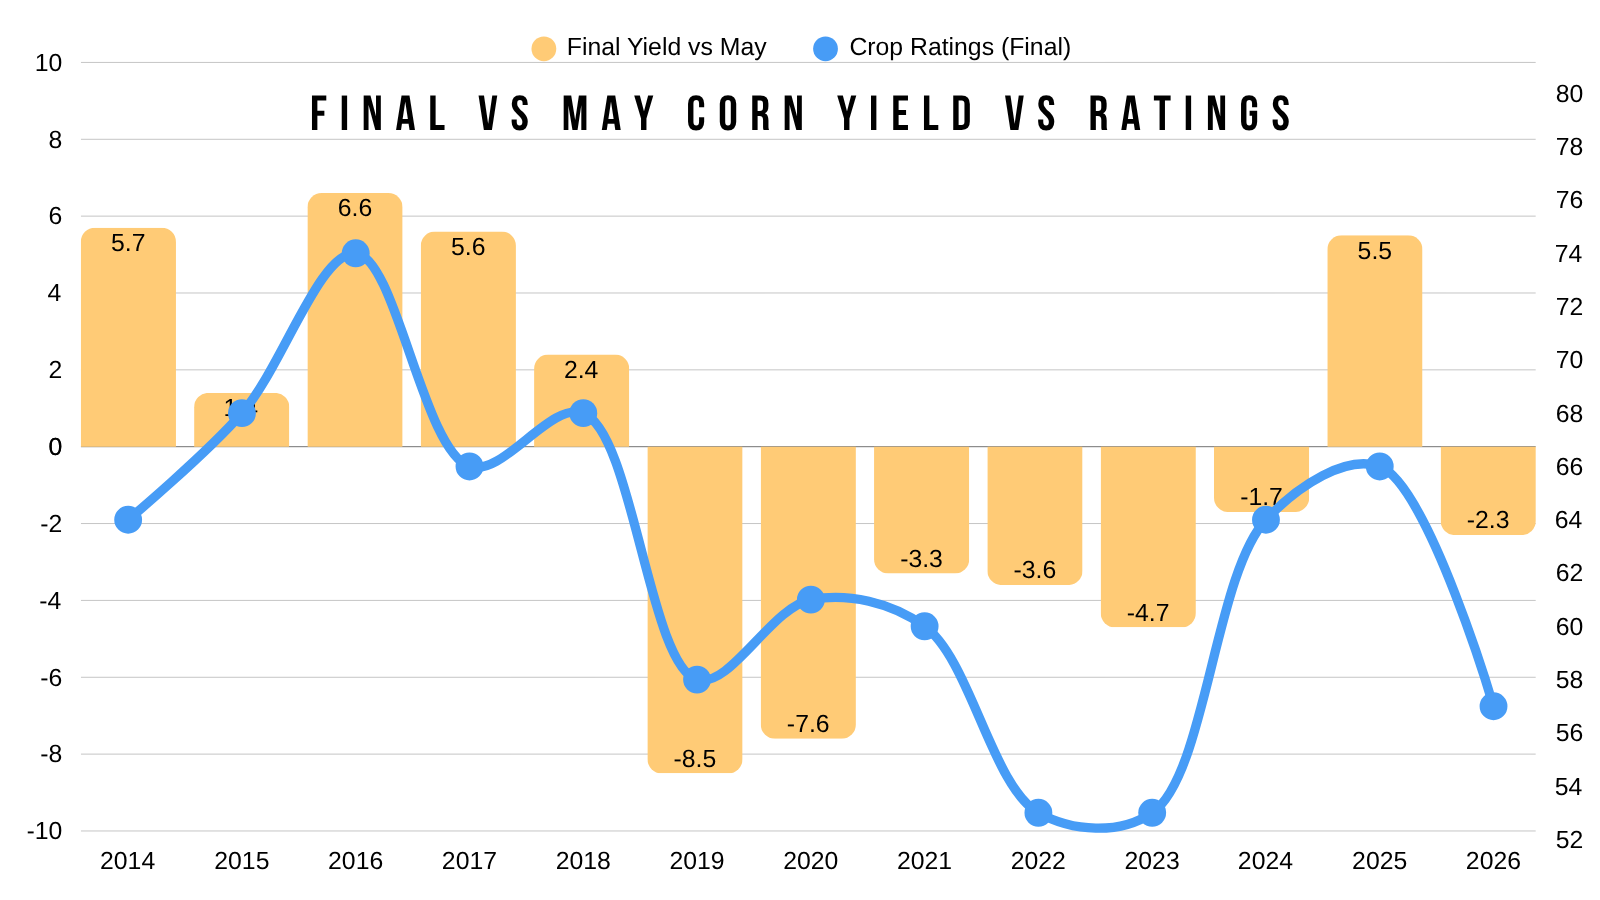
Here is that same chart but with the final ratings instead for some more reference.
Again, this would be one of the lowest ratings in at least the last decade.
Historically, it has led to some sizeable deviations below trend as we've been talking about for the last few months.
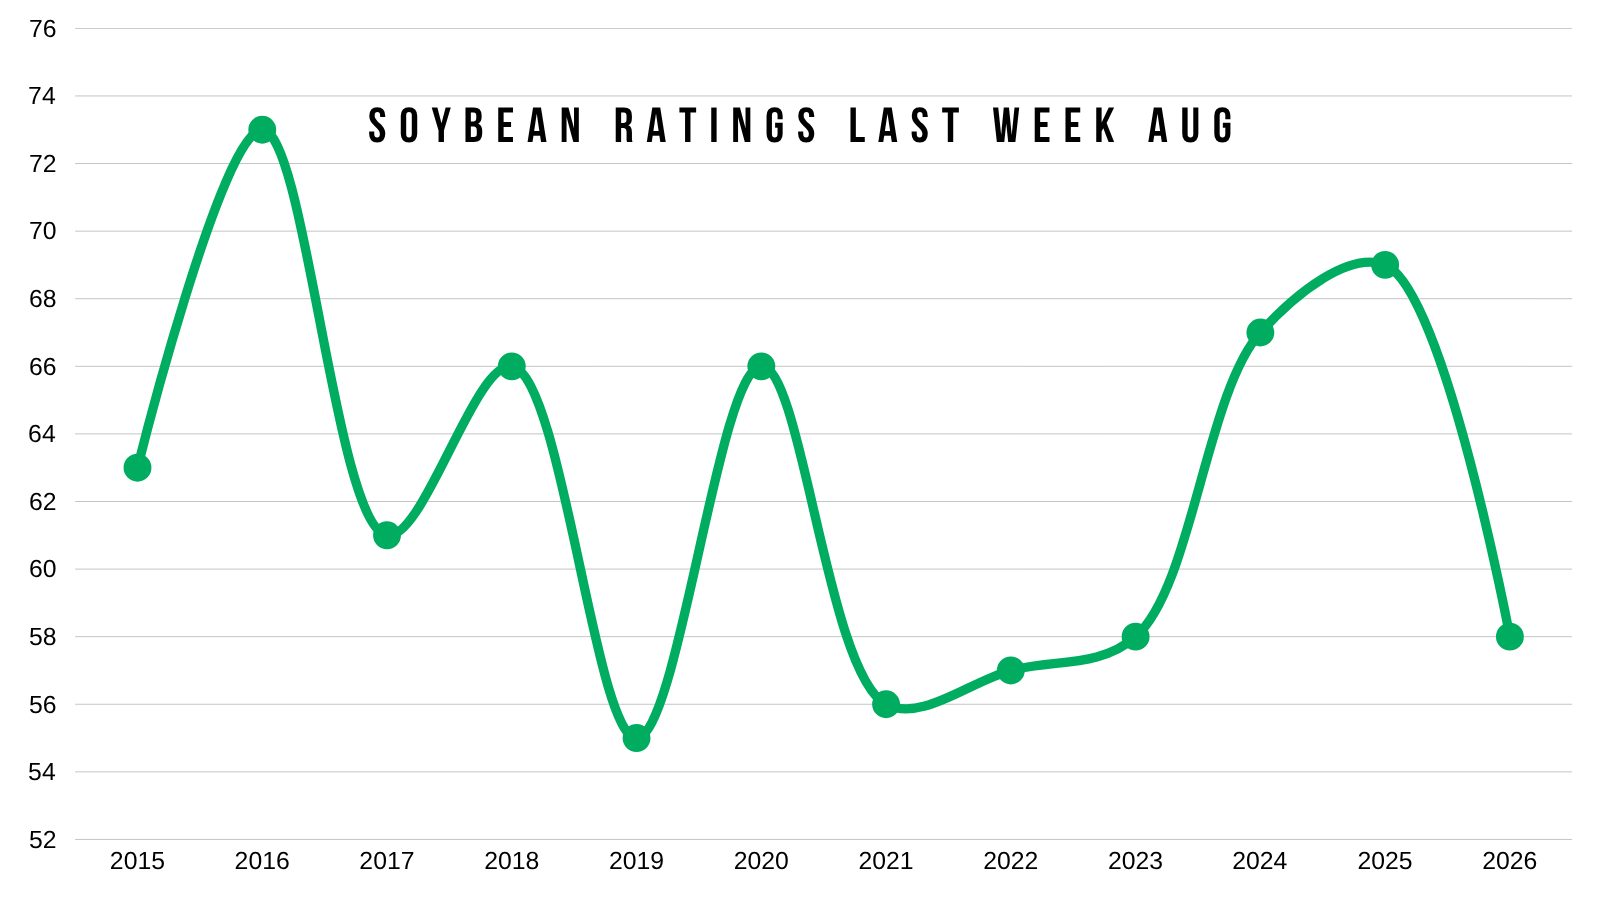
Next for soybeans.
This would be the lowest rating since 2023.
Sitting right about on par with 2021, 2022, and 2023. All within 2% of this year.
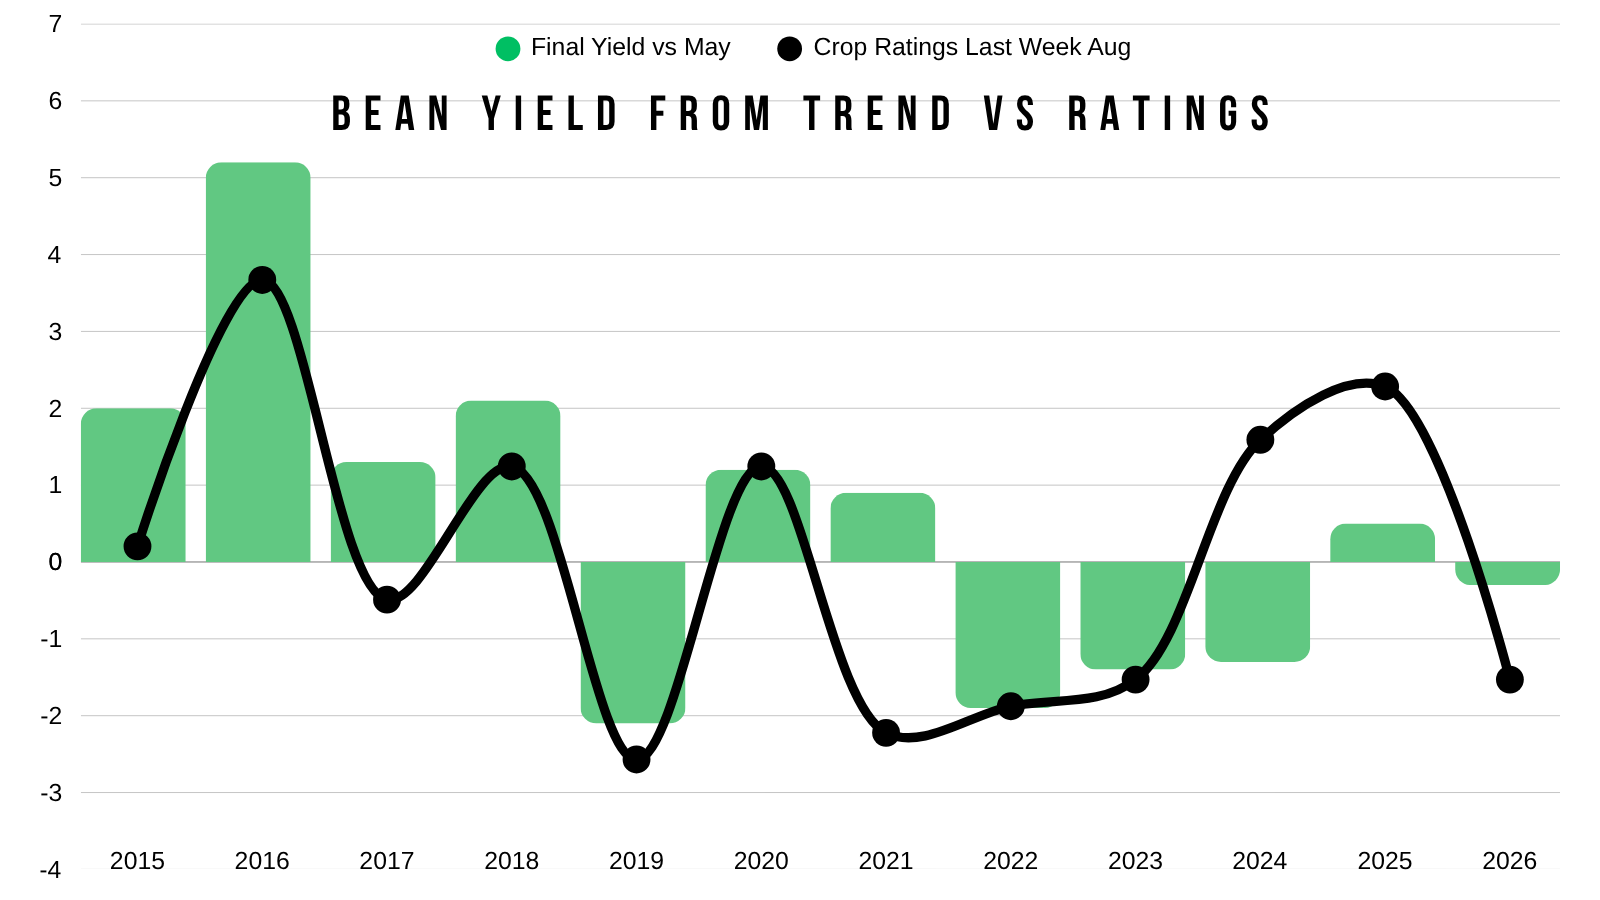
For those wondering, here is soybean ratings vs the yield deviation from trend.
No there is not a very clear correlation here like there is in corn.
However, ratings are -11% lower than last year.
58% today vs 69% last year.
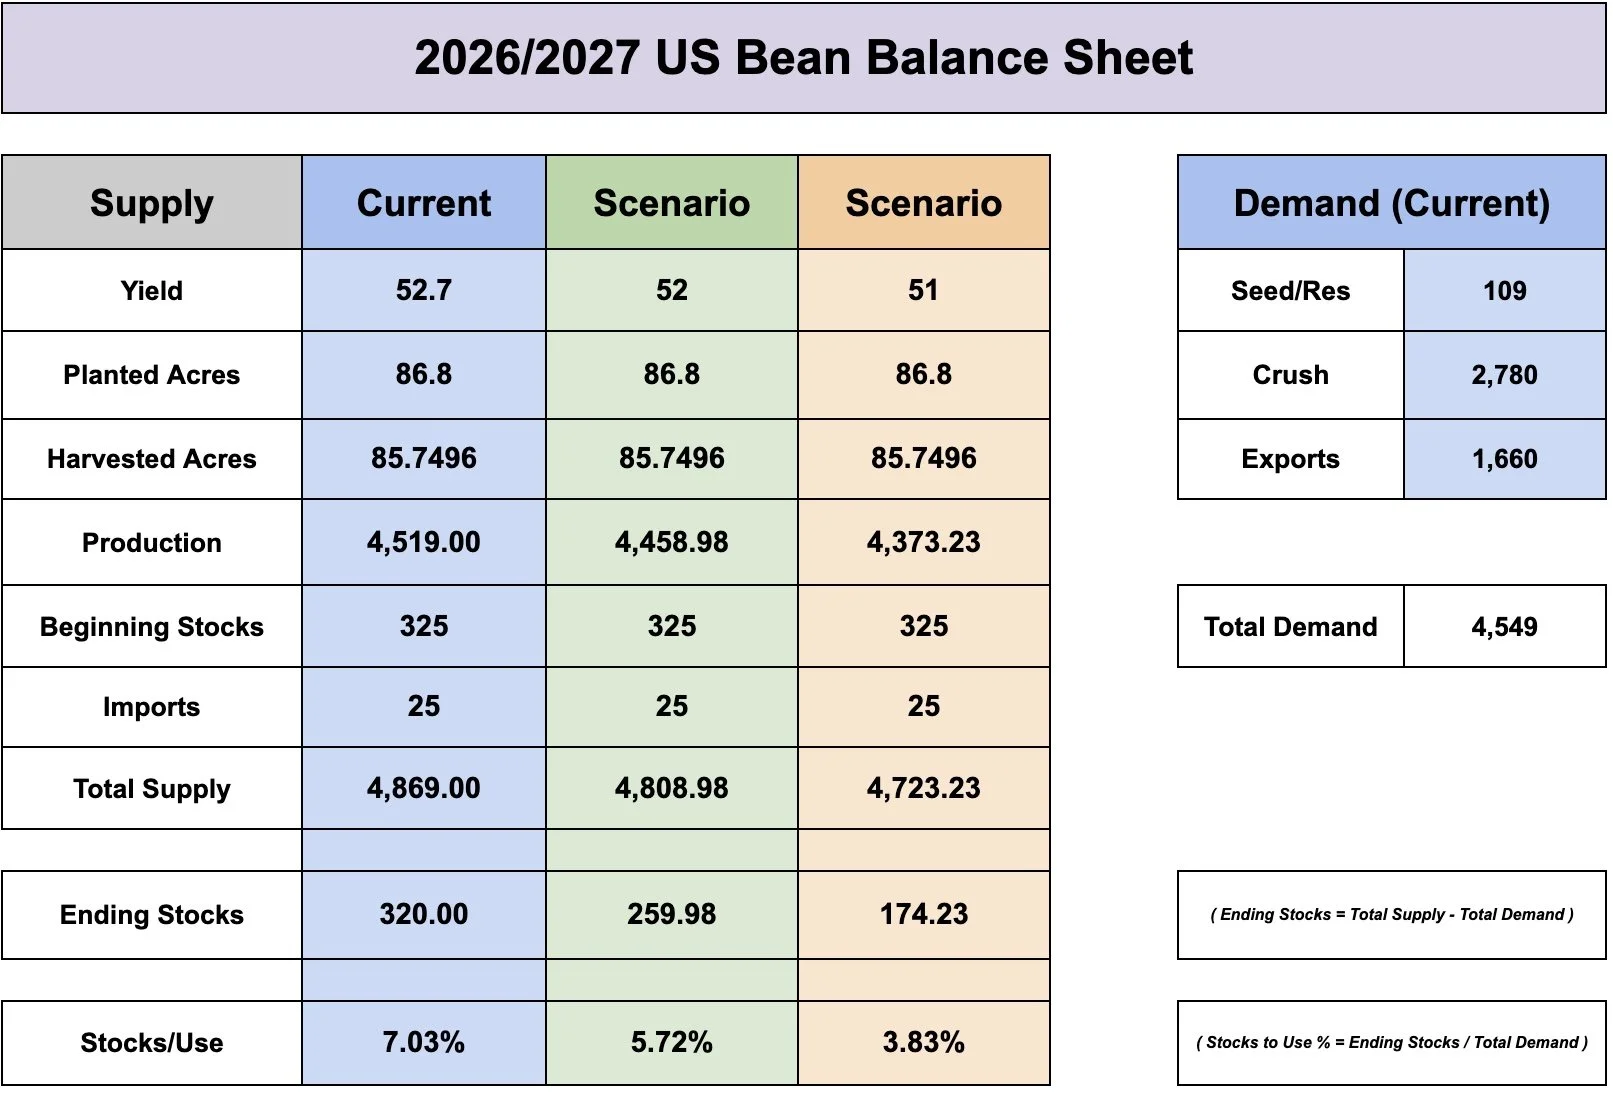
We are way below last year's ratings. So that does have to make you question if this crop really is almost on par with last year's 53 bpa yield. Given the USDA currently has a 52.7
This is important because the room for error on the soybean balance sheet is still thin as paper.
Not to mention the phenomenal crush demand or China demand which we aren’t going to get into today as we've done so plenty in the past.
Today we aren’t going to be diving too heavily into the fundamental topics we've already covered either.
If you'd like more in depth fundamentals, check out some of my past videos where we talk about the upside potential and bull cases etc.
Do We Ever Top in September?
Grains just posted new highs for the year across the board.
Now that it's offically September.. We have to ask:
Do we ever post our highs in September?
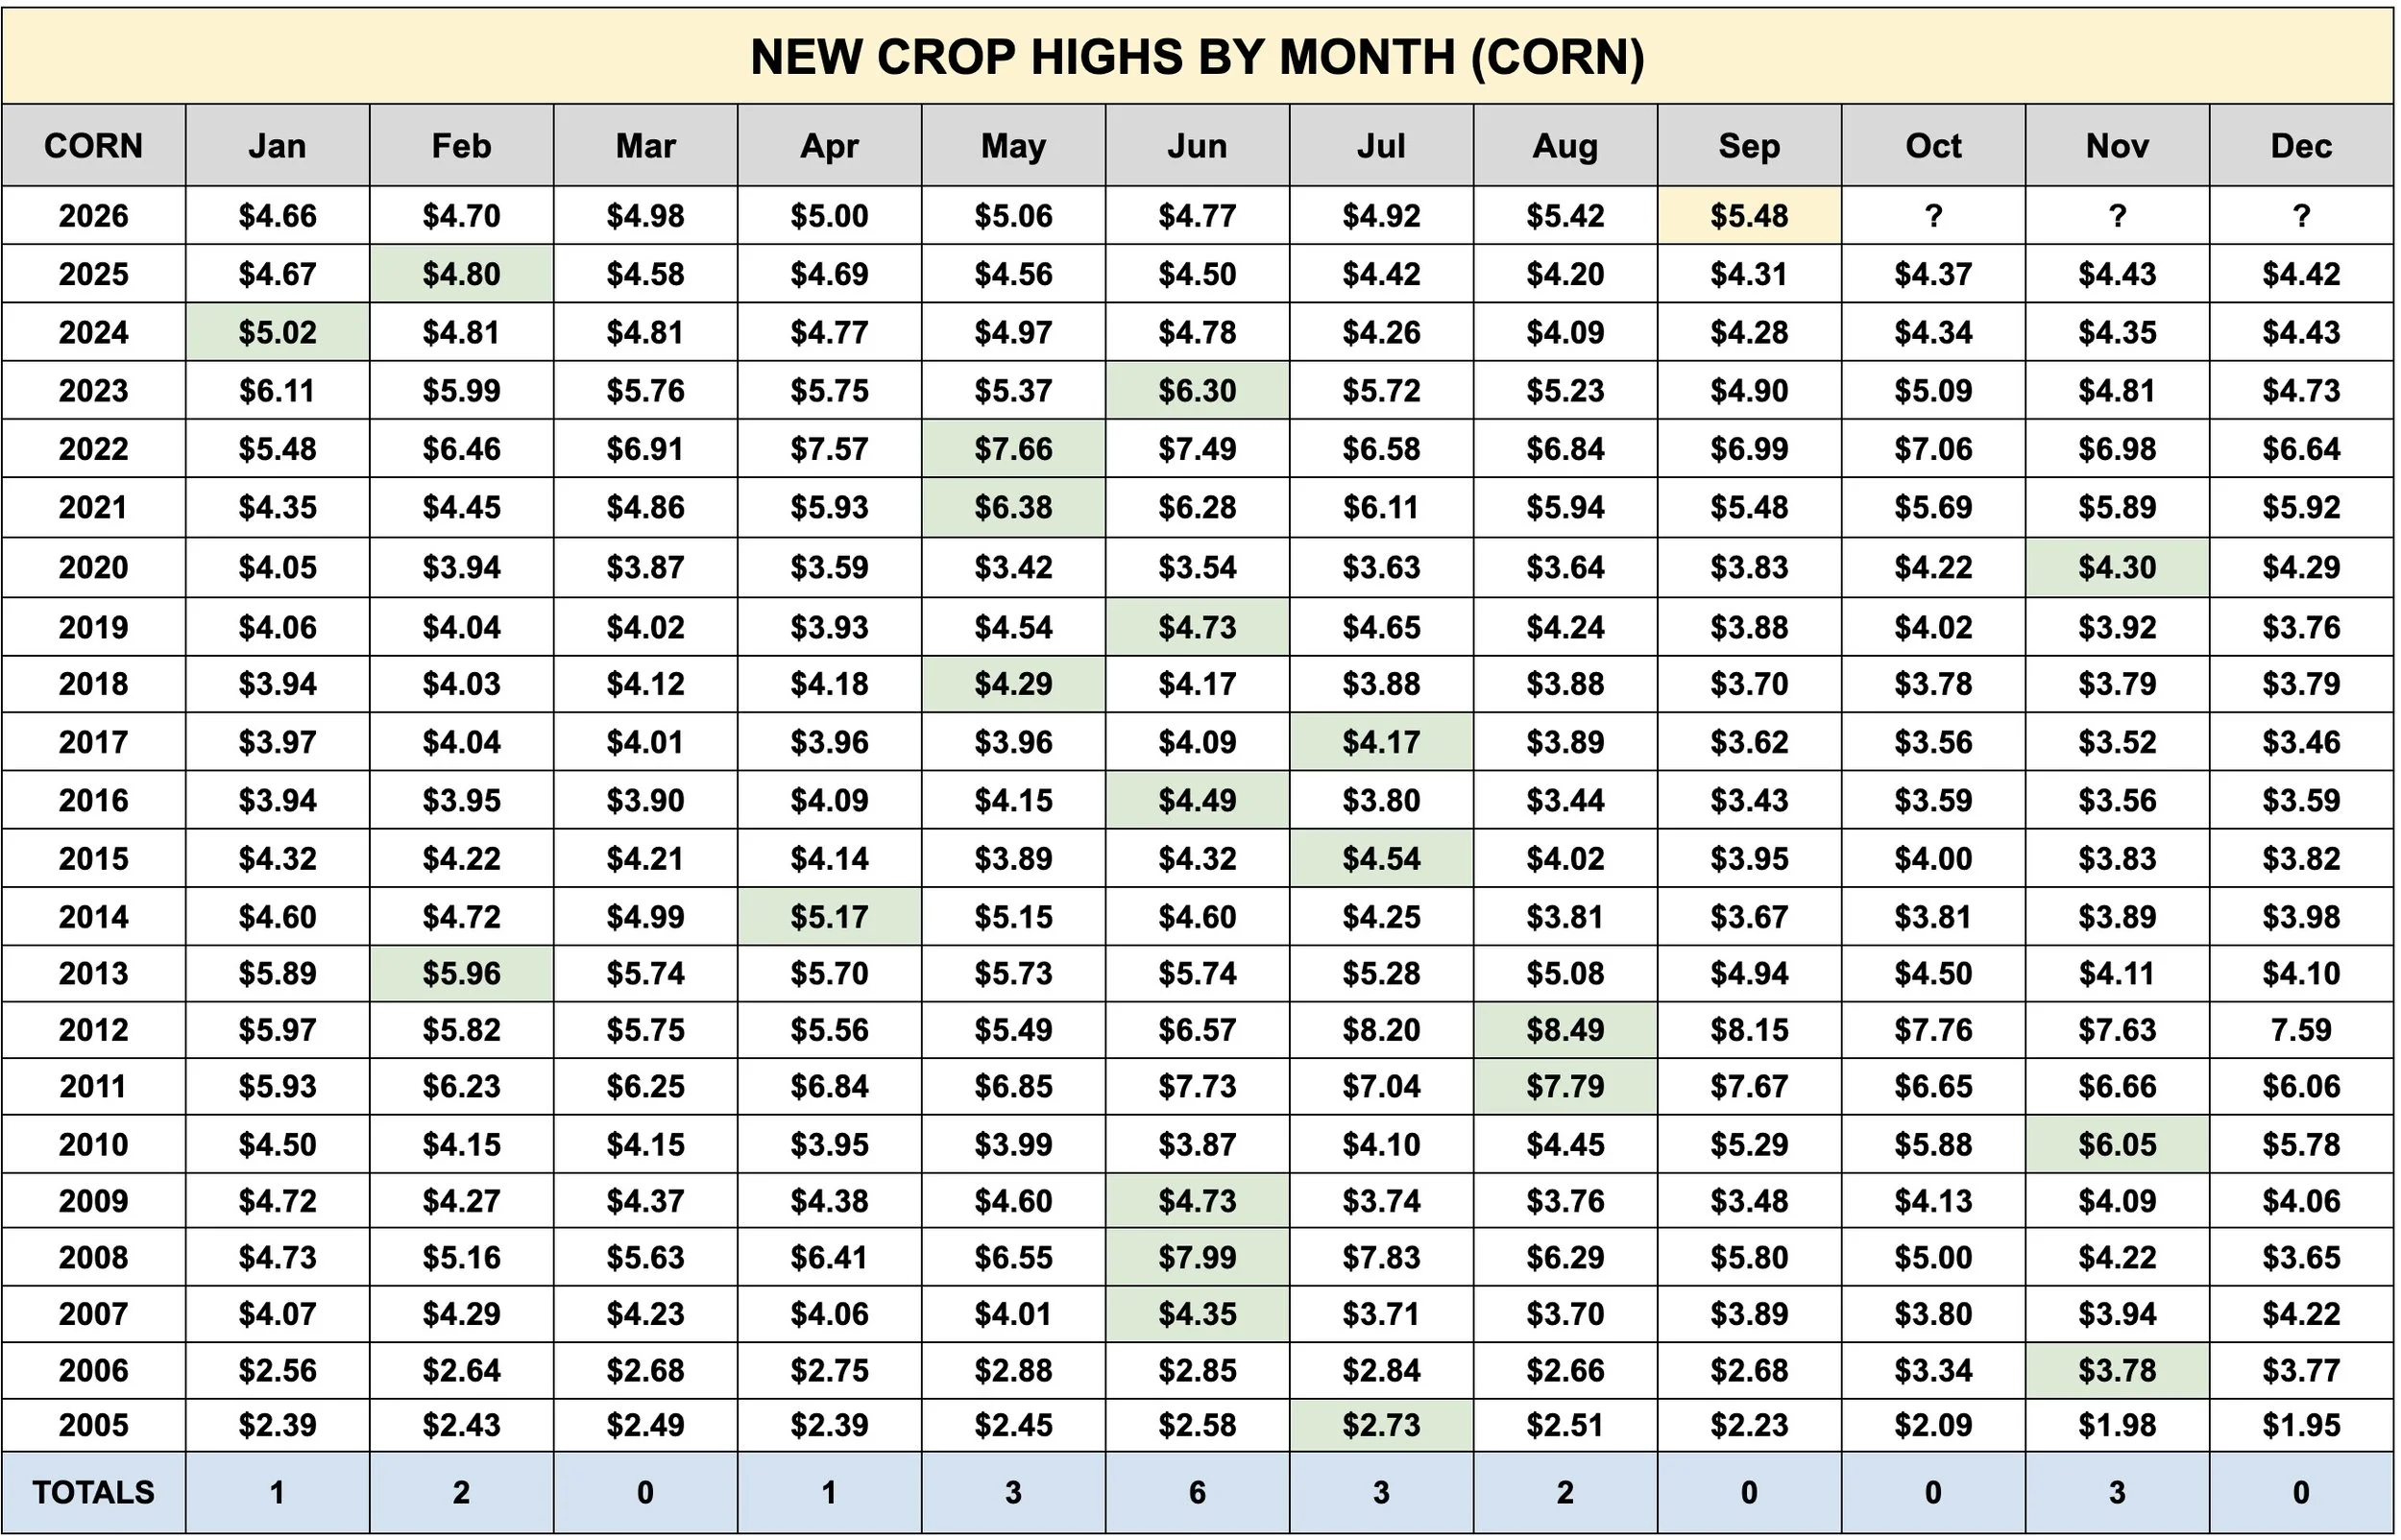
If we look at the highest prices for every month for Dec corn.
The answer would be: No
We have never once posted our highest price for the year in September.
We have also never once posted our highest price for the year in October.
The most interesting part?
The last two times we posted our highs at the end of the year were 2020 and 2010.
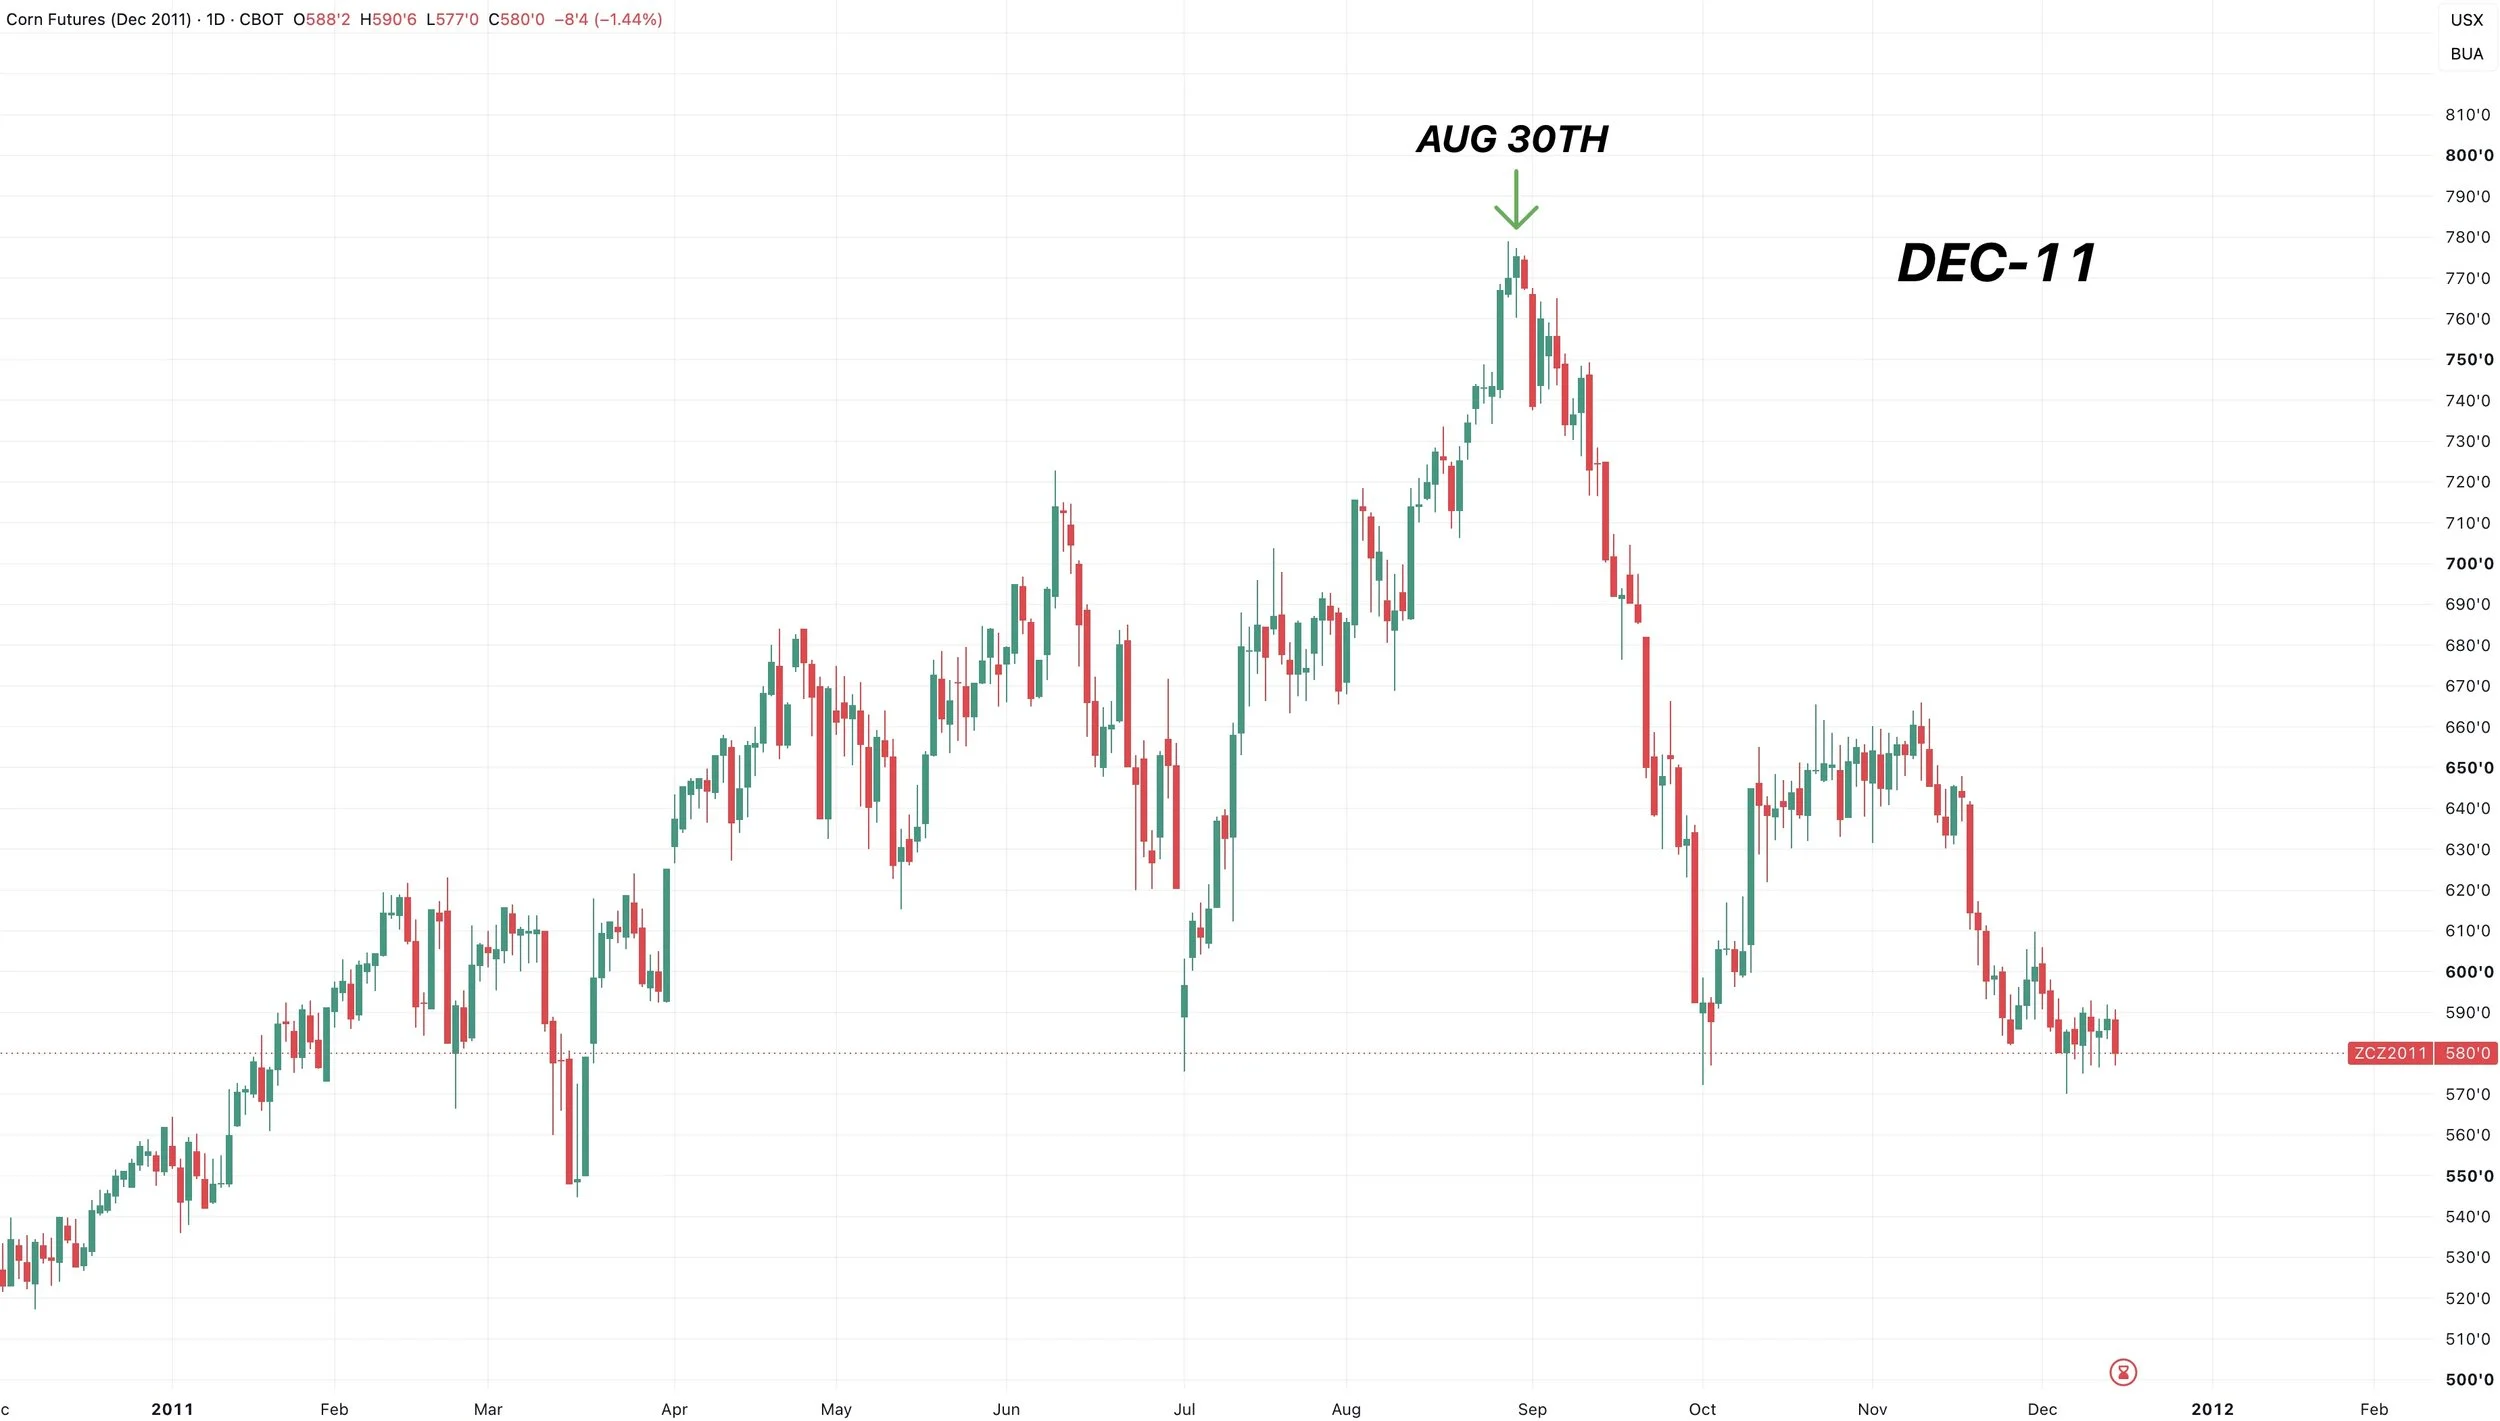
The closest we ever got to posting our highs for the year in September was back in 2011.
We posted our highest close on August 30th before falling until October.
But as I talked about last week.. this feels far more similar to 2010 or 2020 than it does to 2011 or 2012.
2011 was a bull market. Corn was trading over $7.70 at the time.
We obviously aren’t in a bull market.. yet.
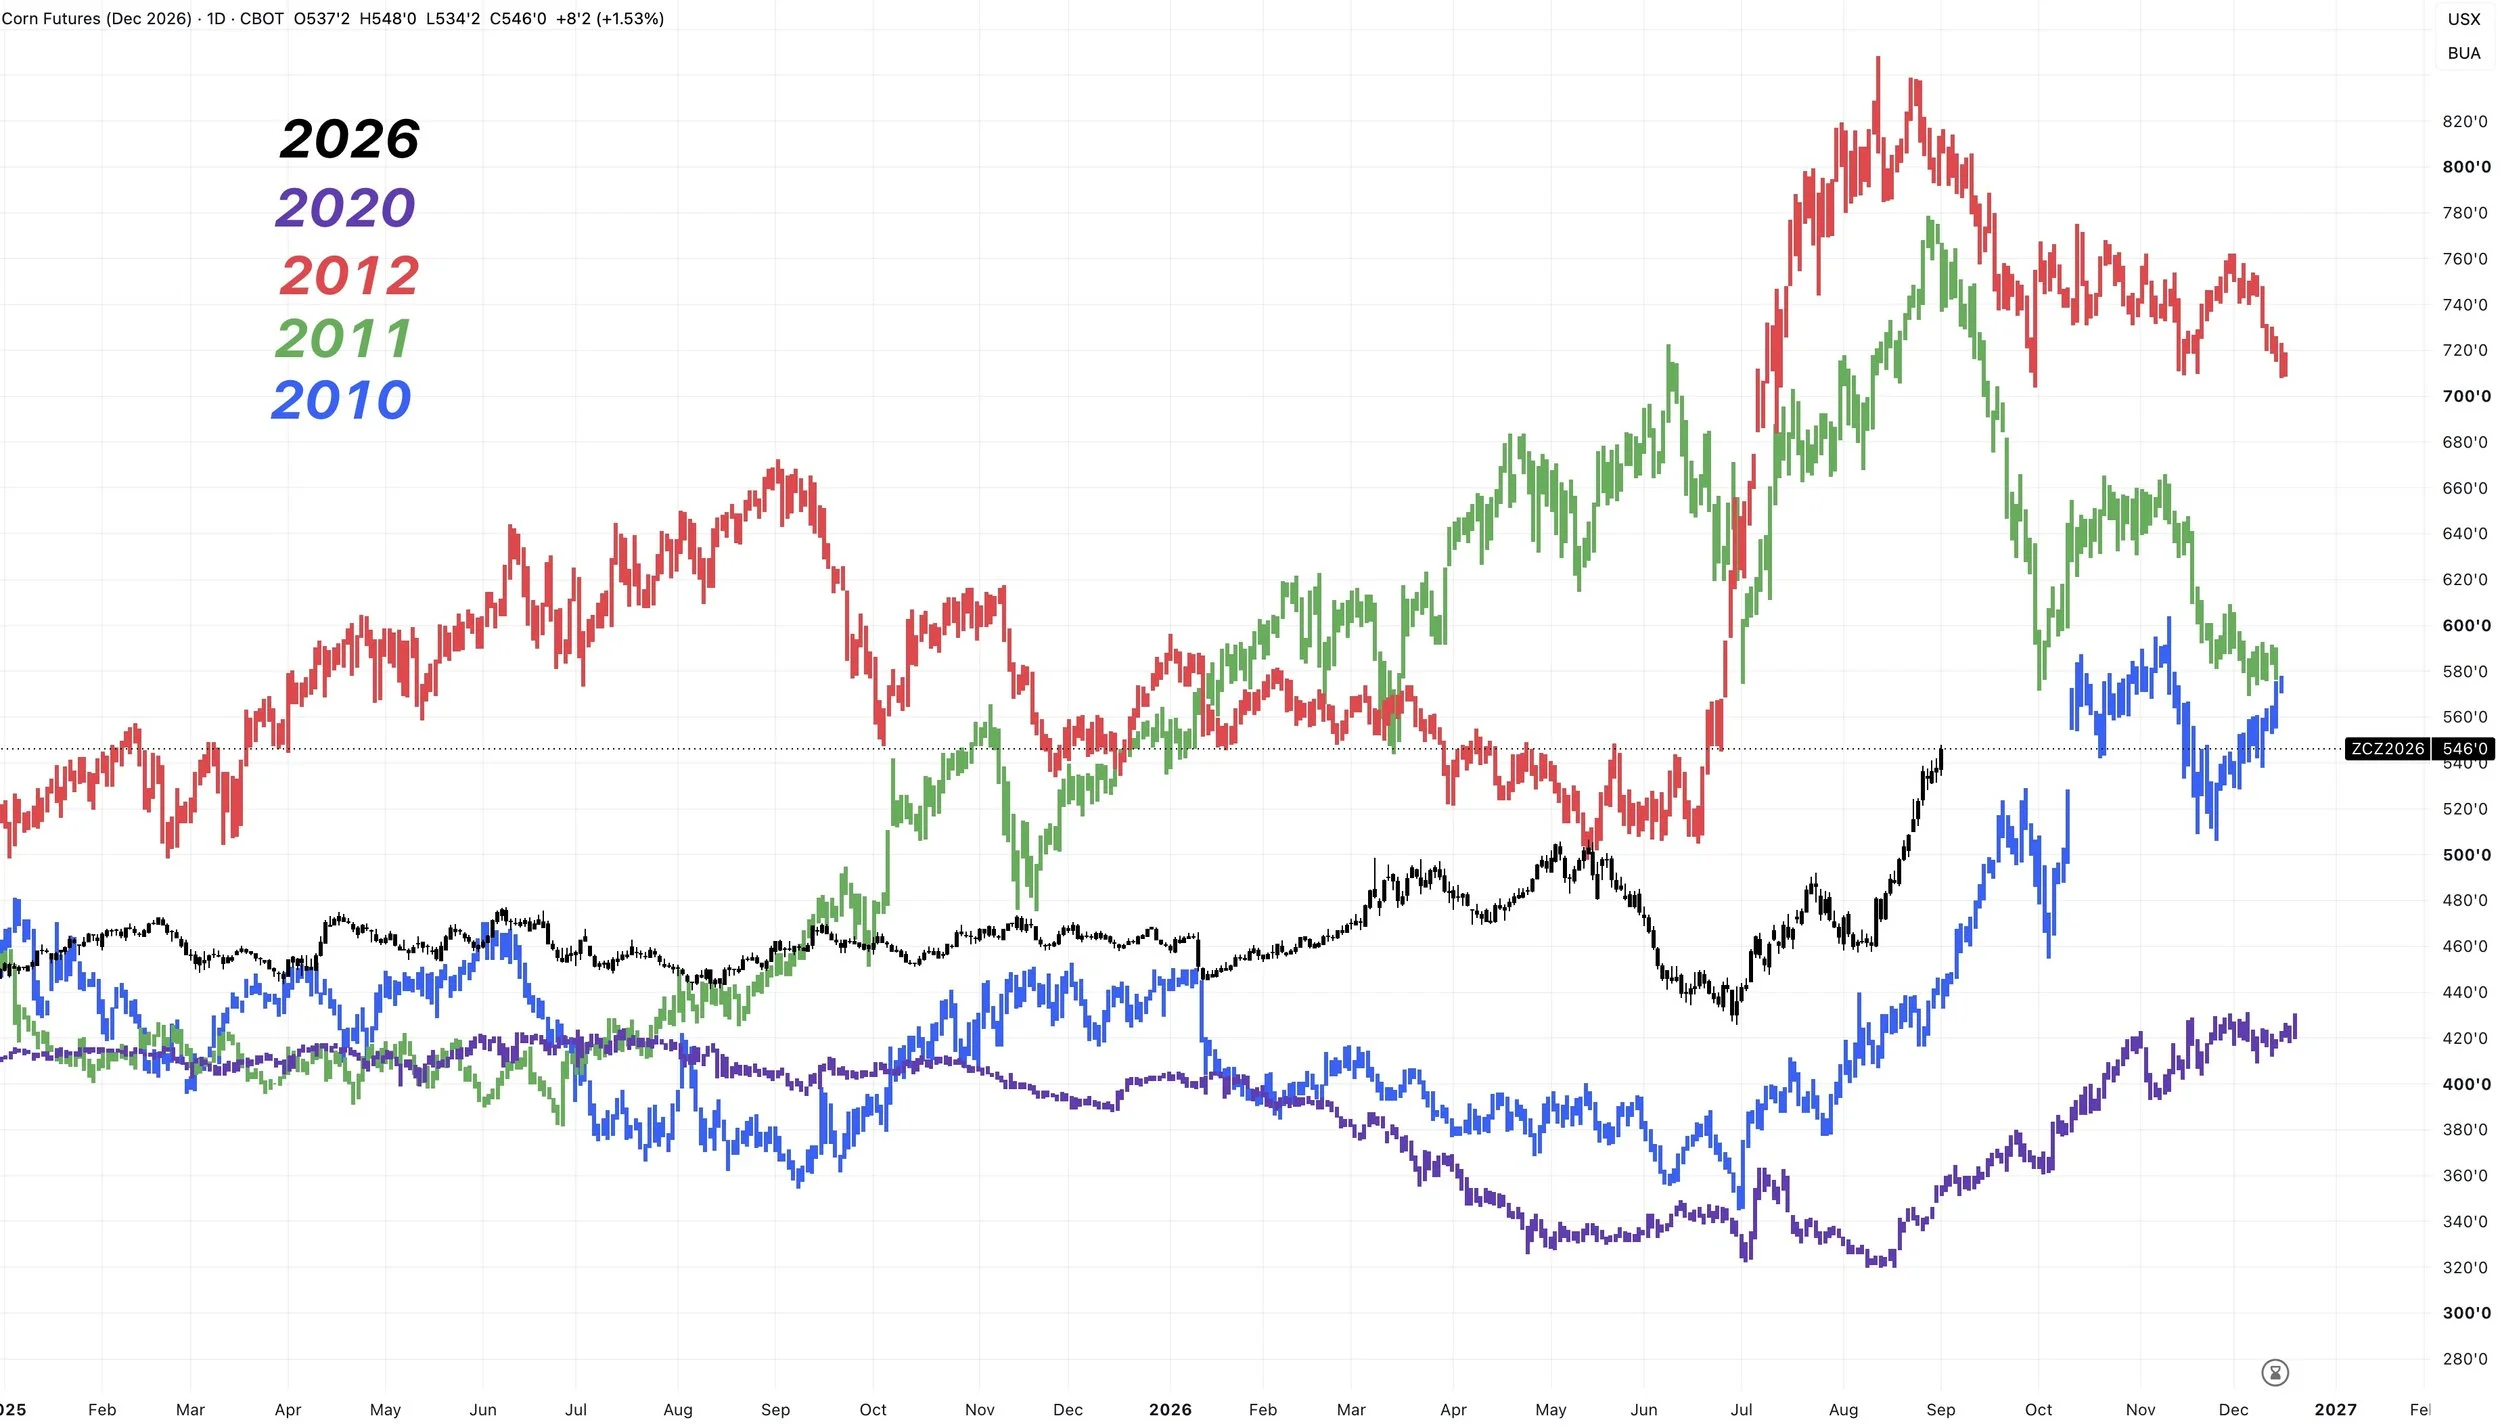
If you are comparing 2026 to 2010 and 2020..
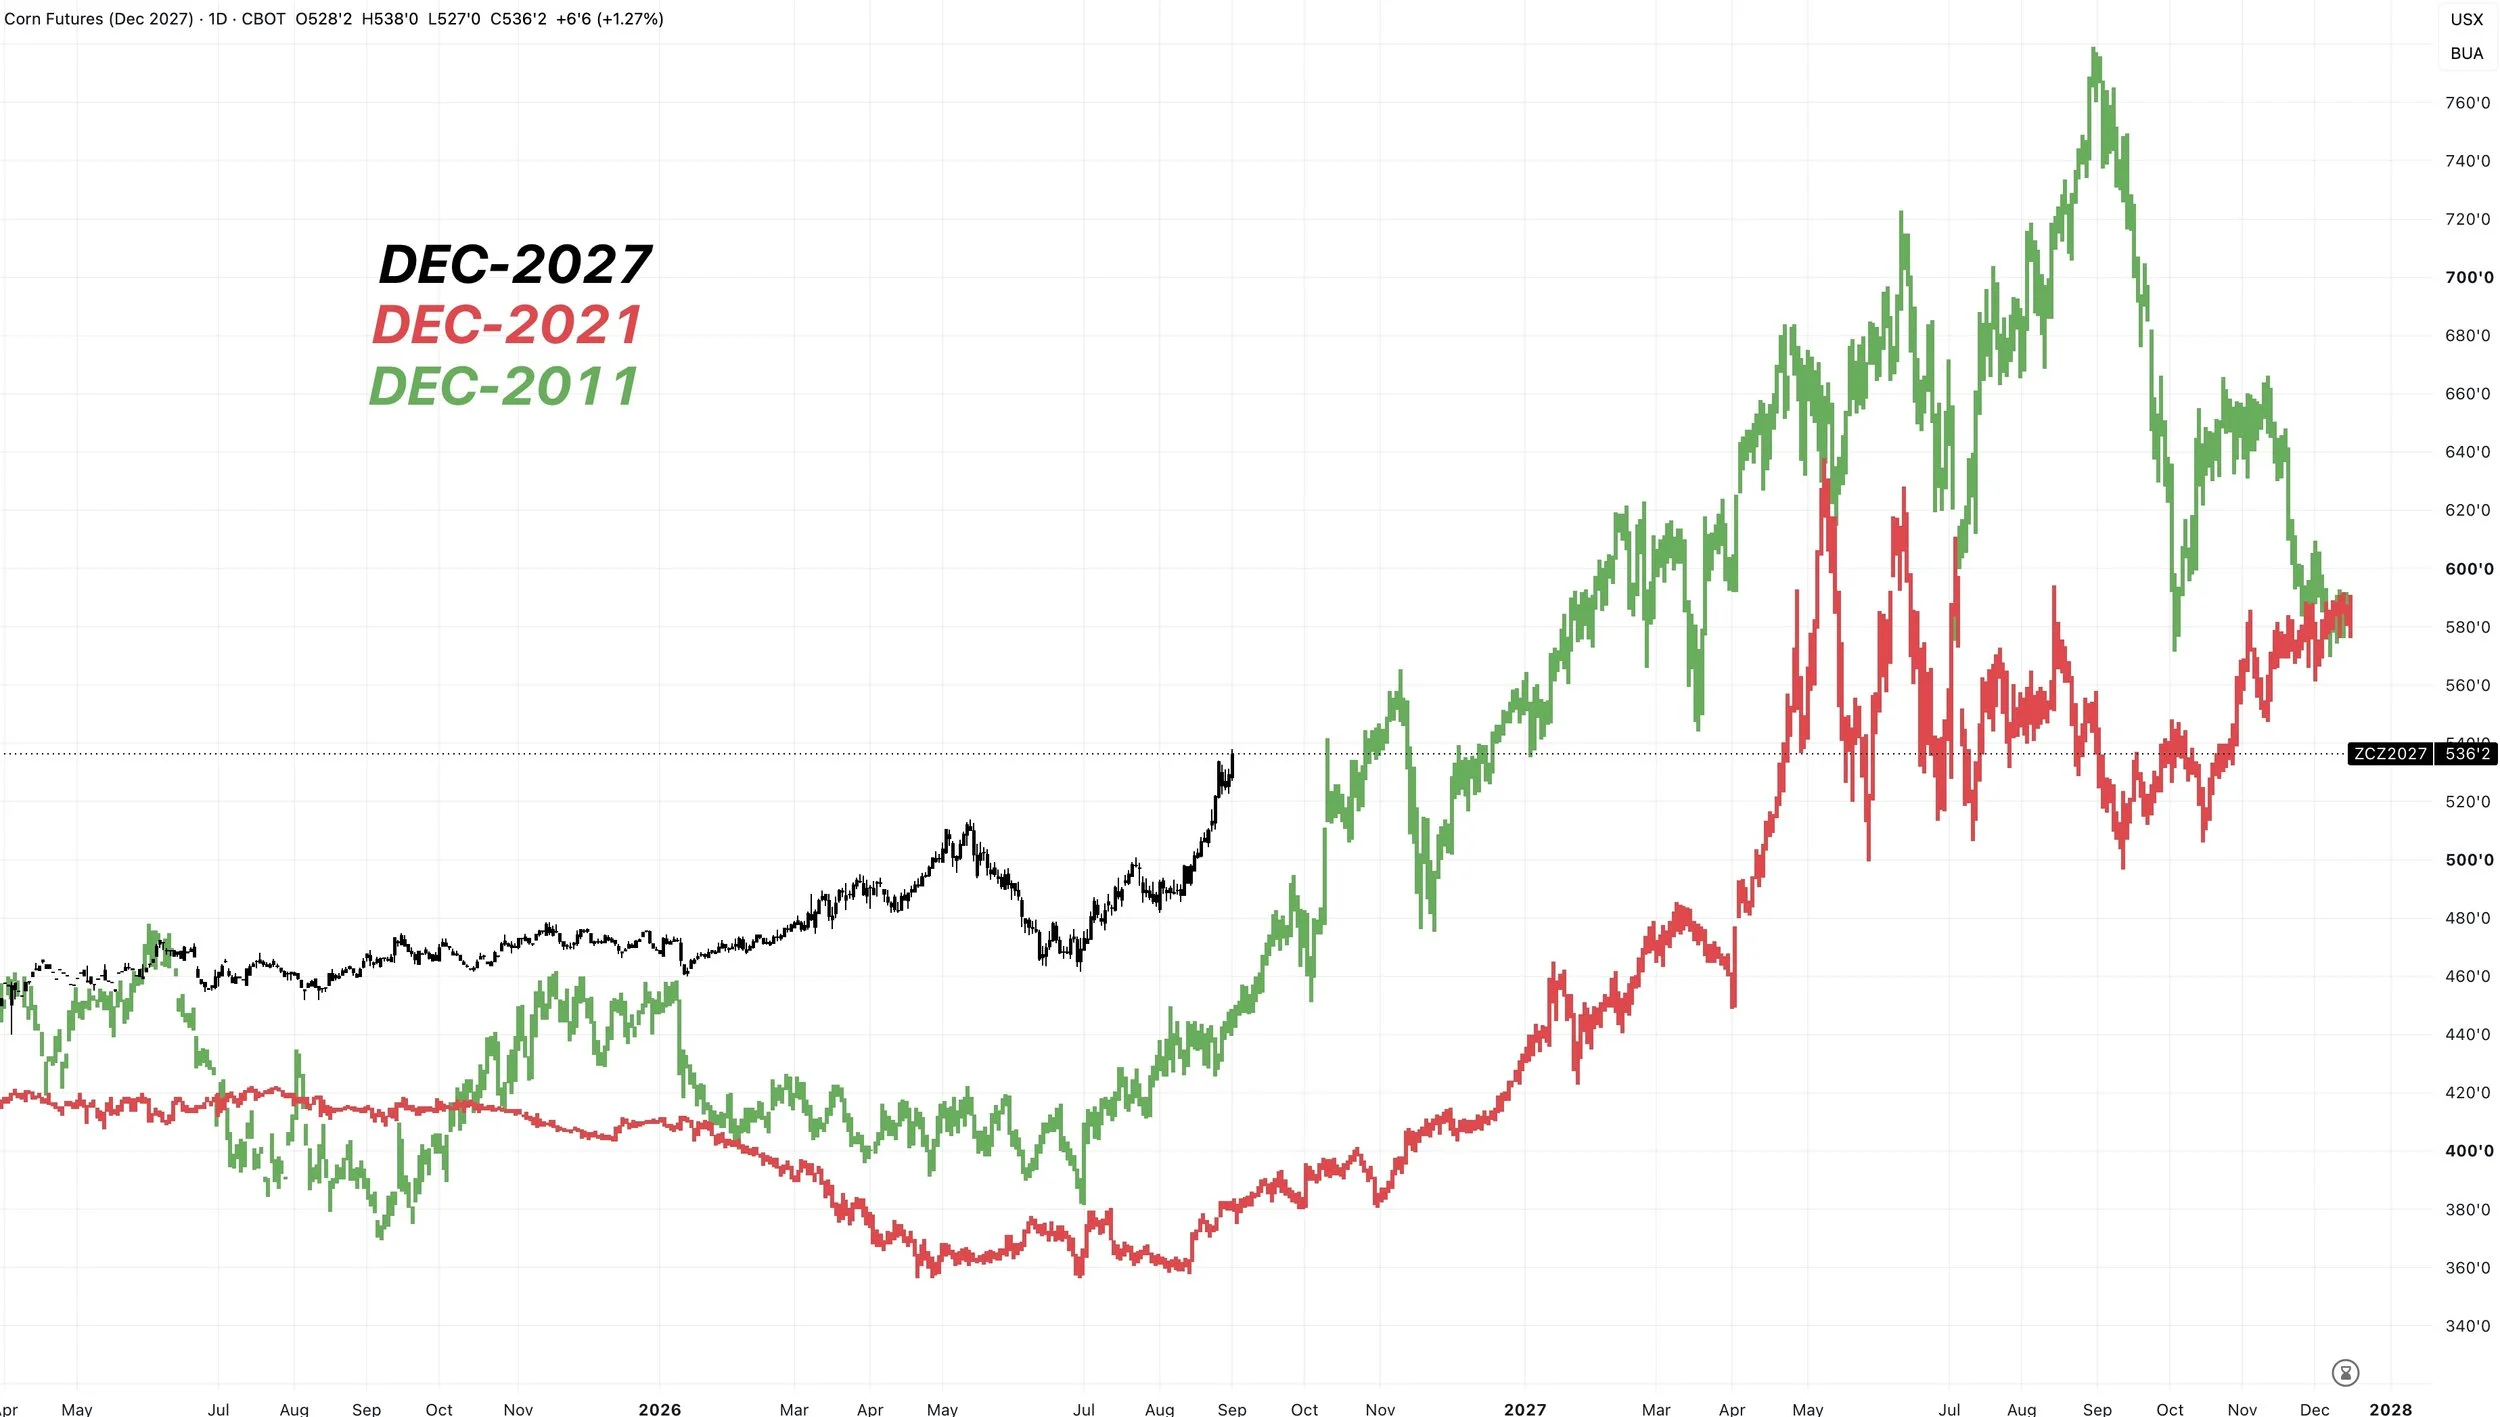
Then you of course have to compare 2027 to 2011 and 2021.
Here is what those two years looked like compared to Dec-27 corn.
Both continued higher into the following year.
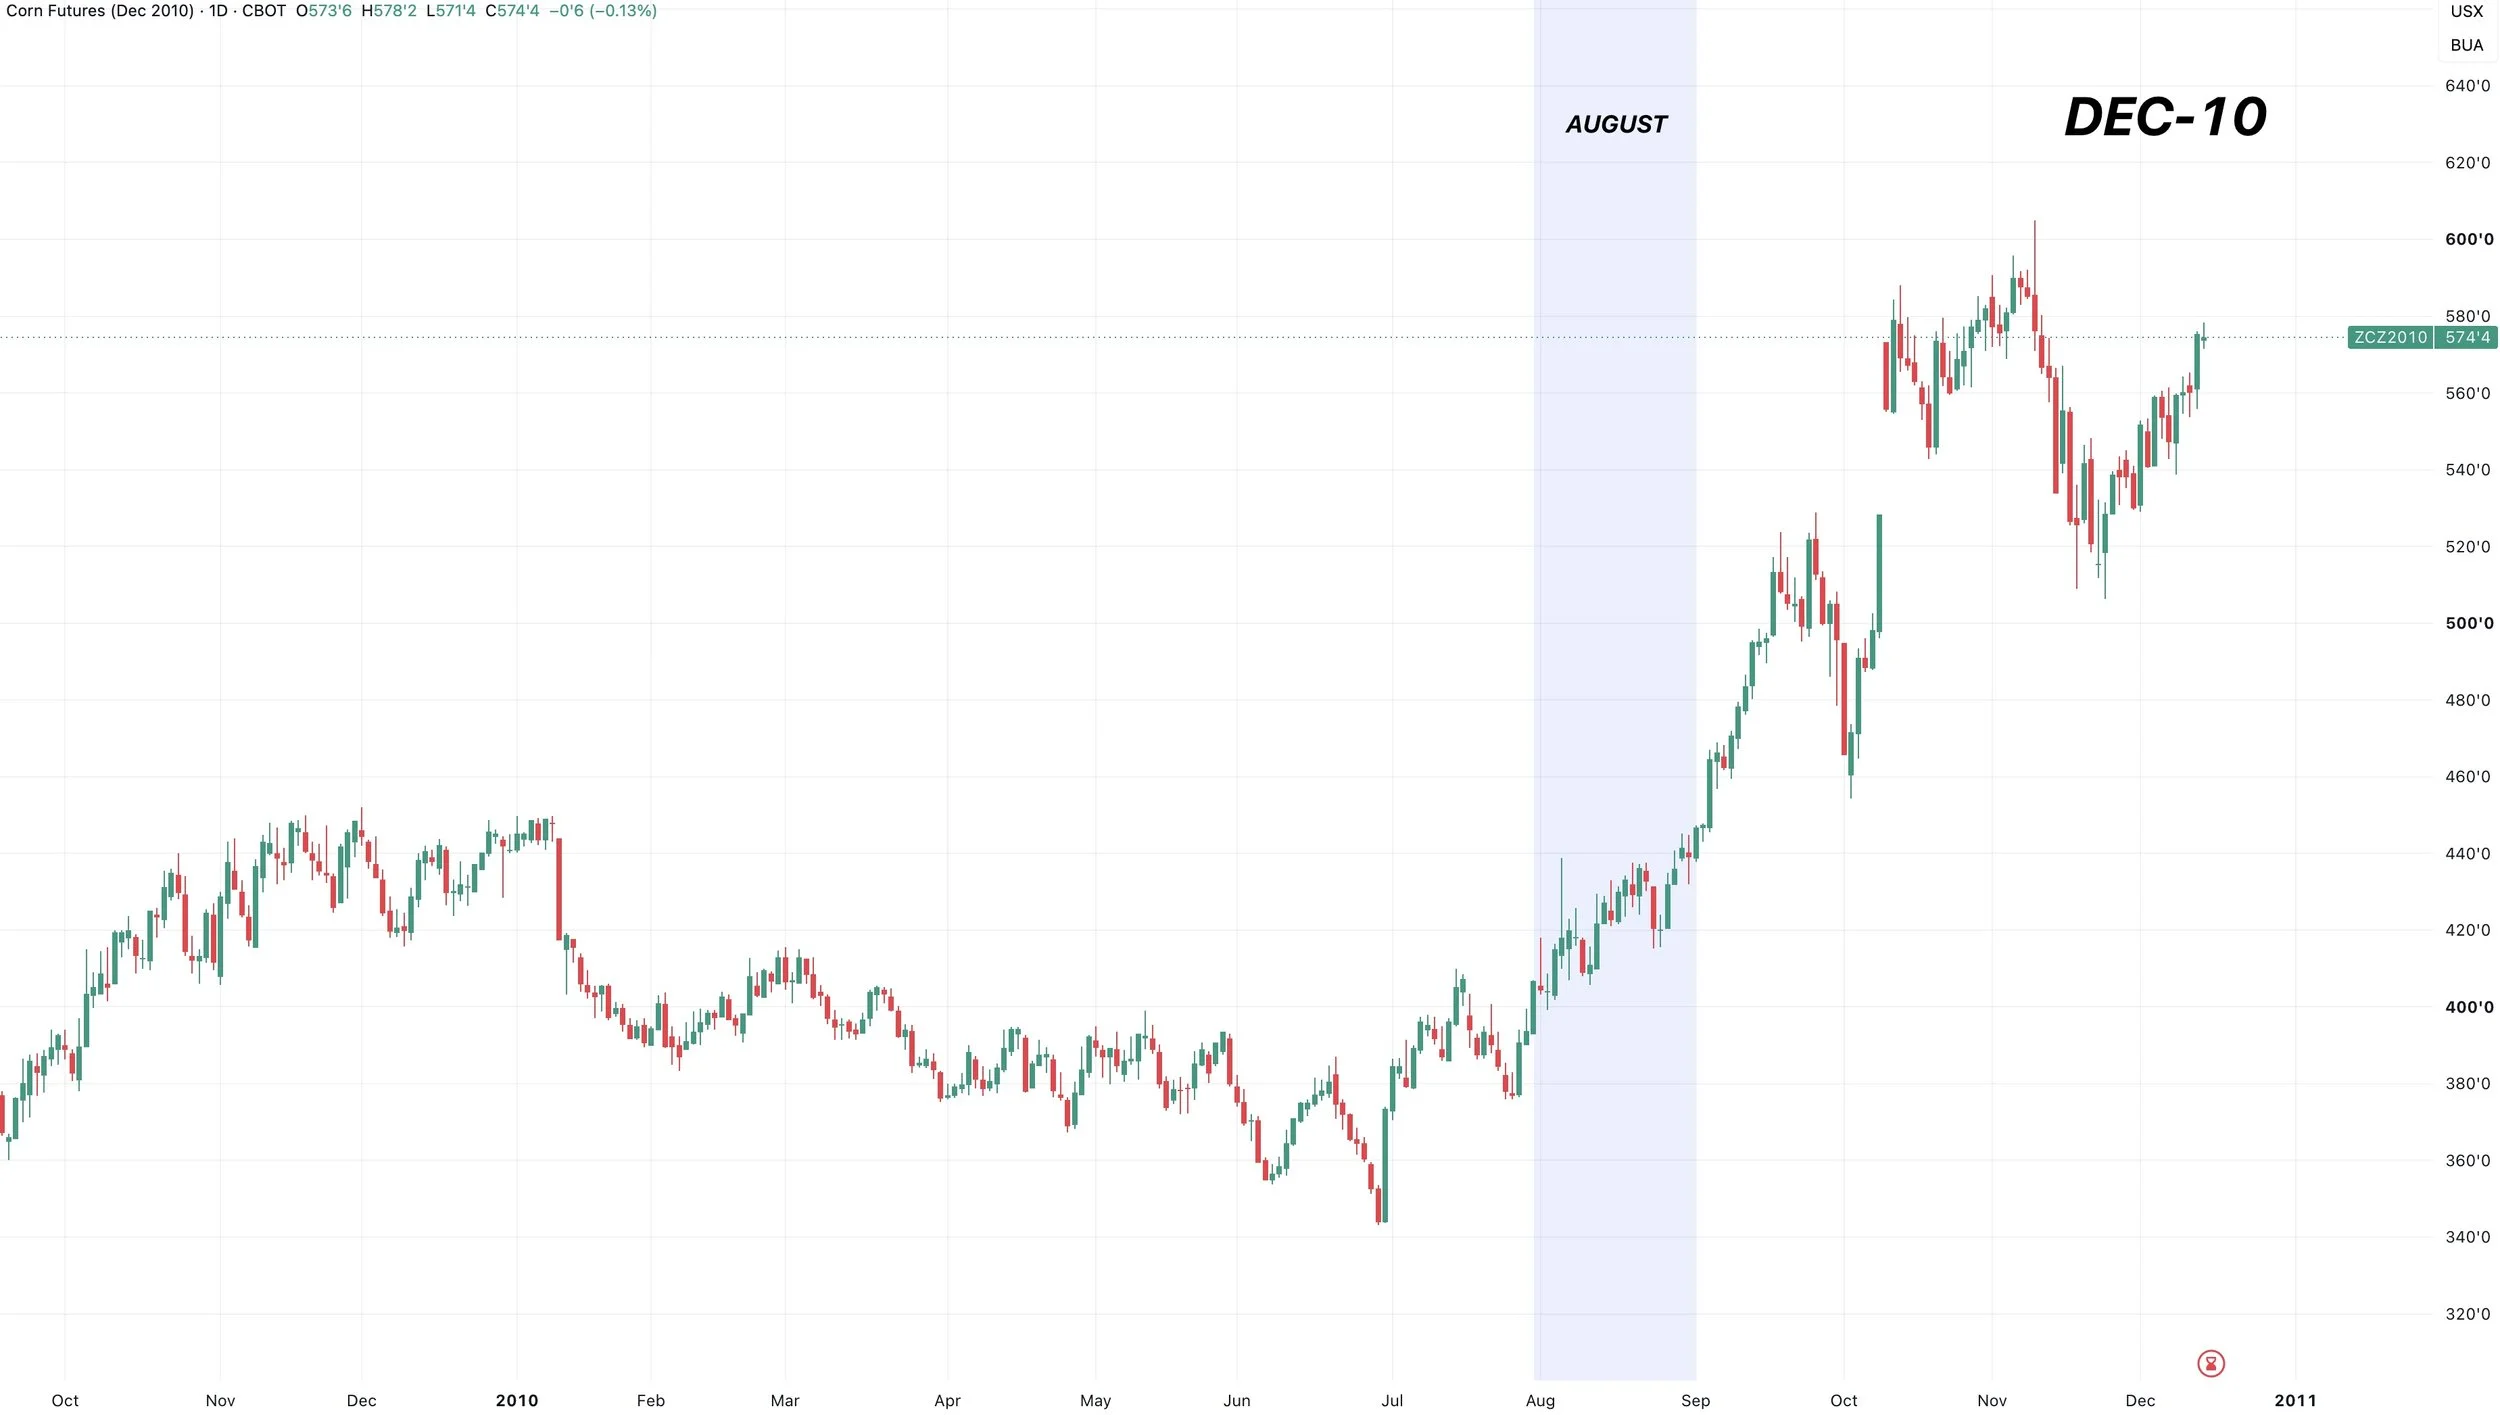
What Happens After a Strong August?
Corn just posted our strongest August ever. Of all-time.
There are only 4 other years that had a similarly strong August.
Those years were:
2022 (bull market)
2020 (started the bull market)
2011 (bull market)
2010 (started the bull market)
That's interesting..
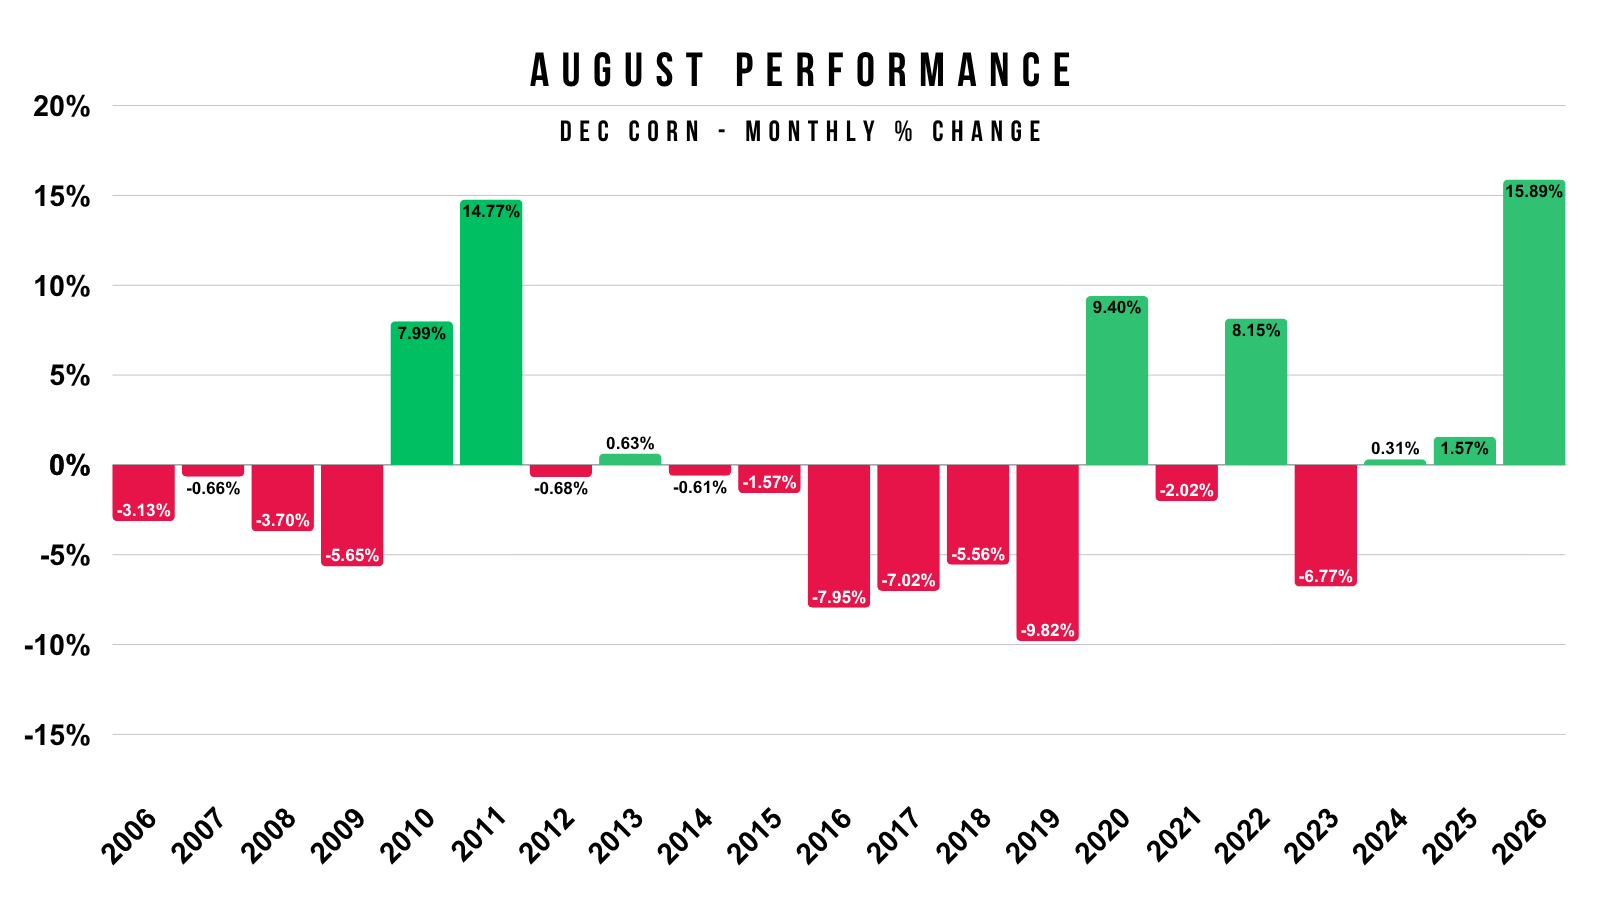
But let's look at what actually happened in each year we had a strong August.
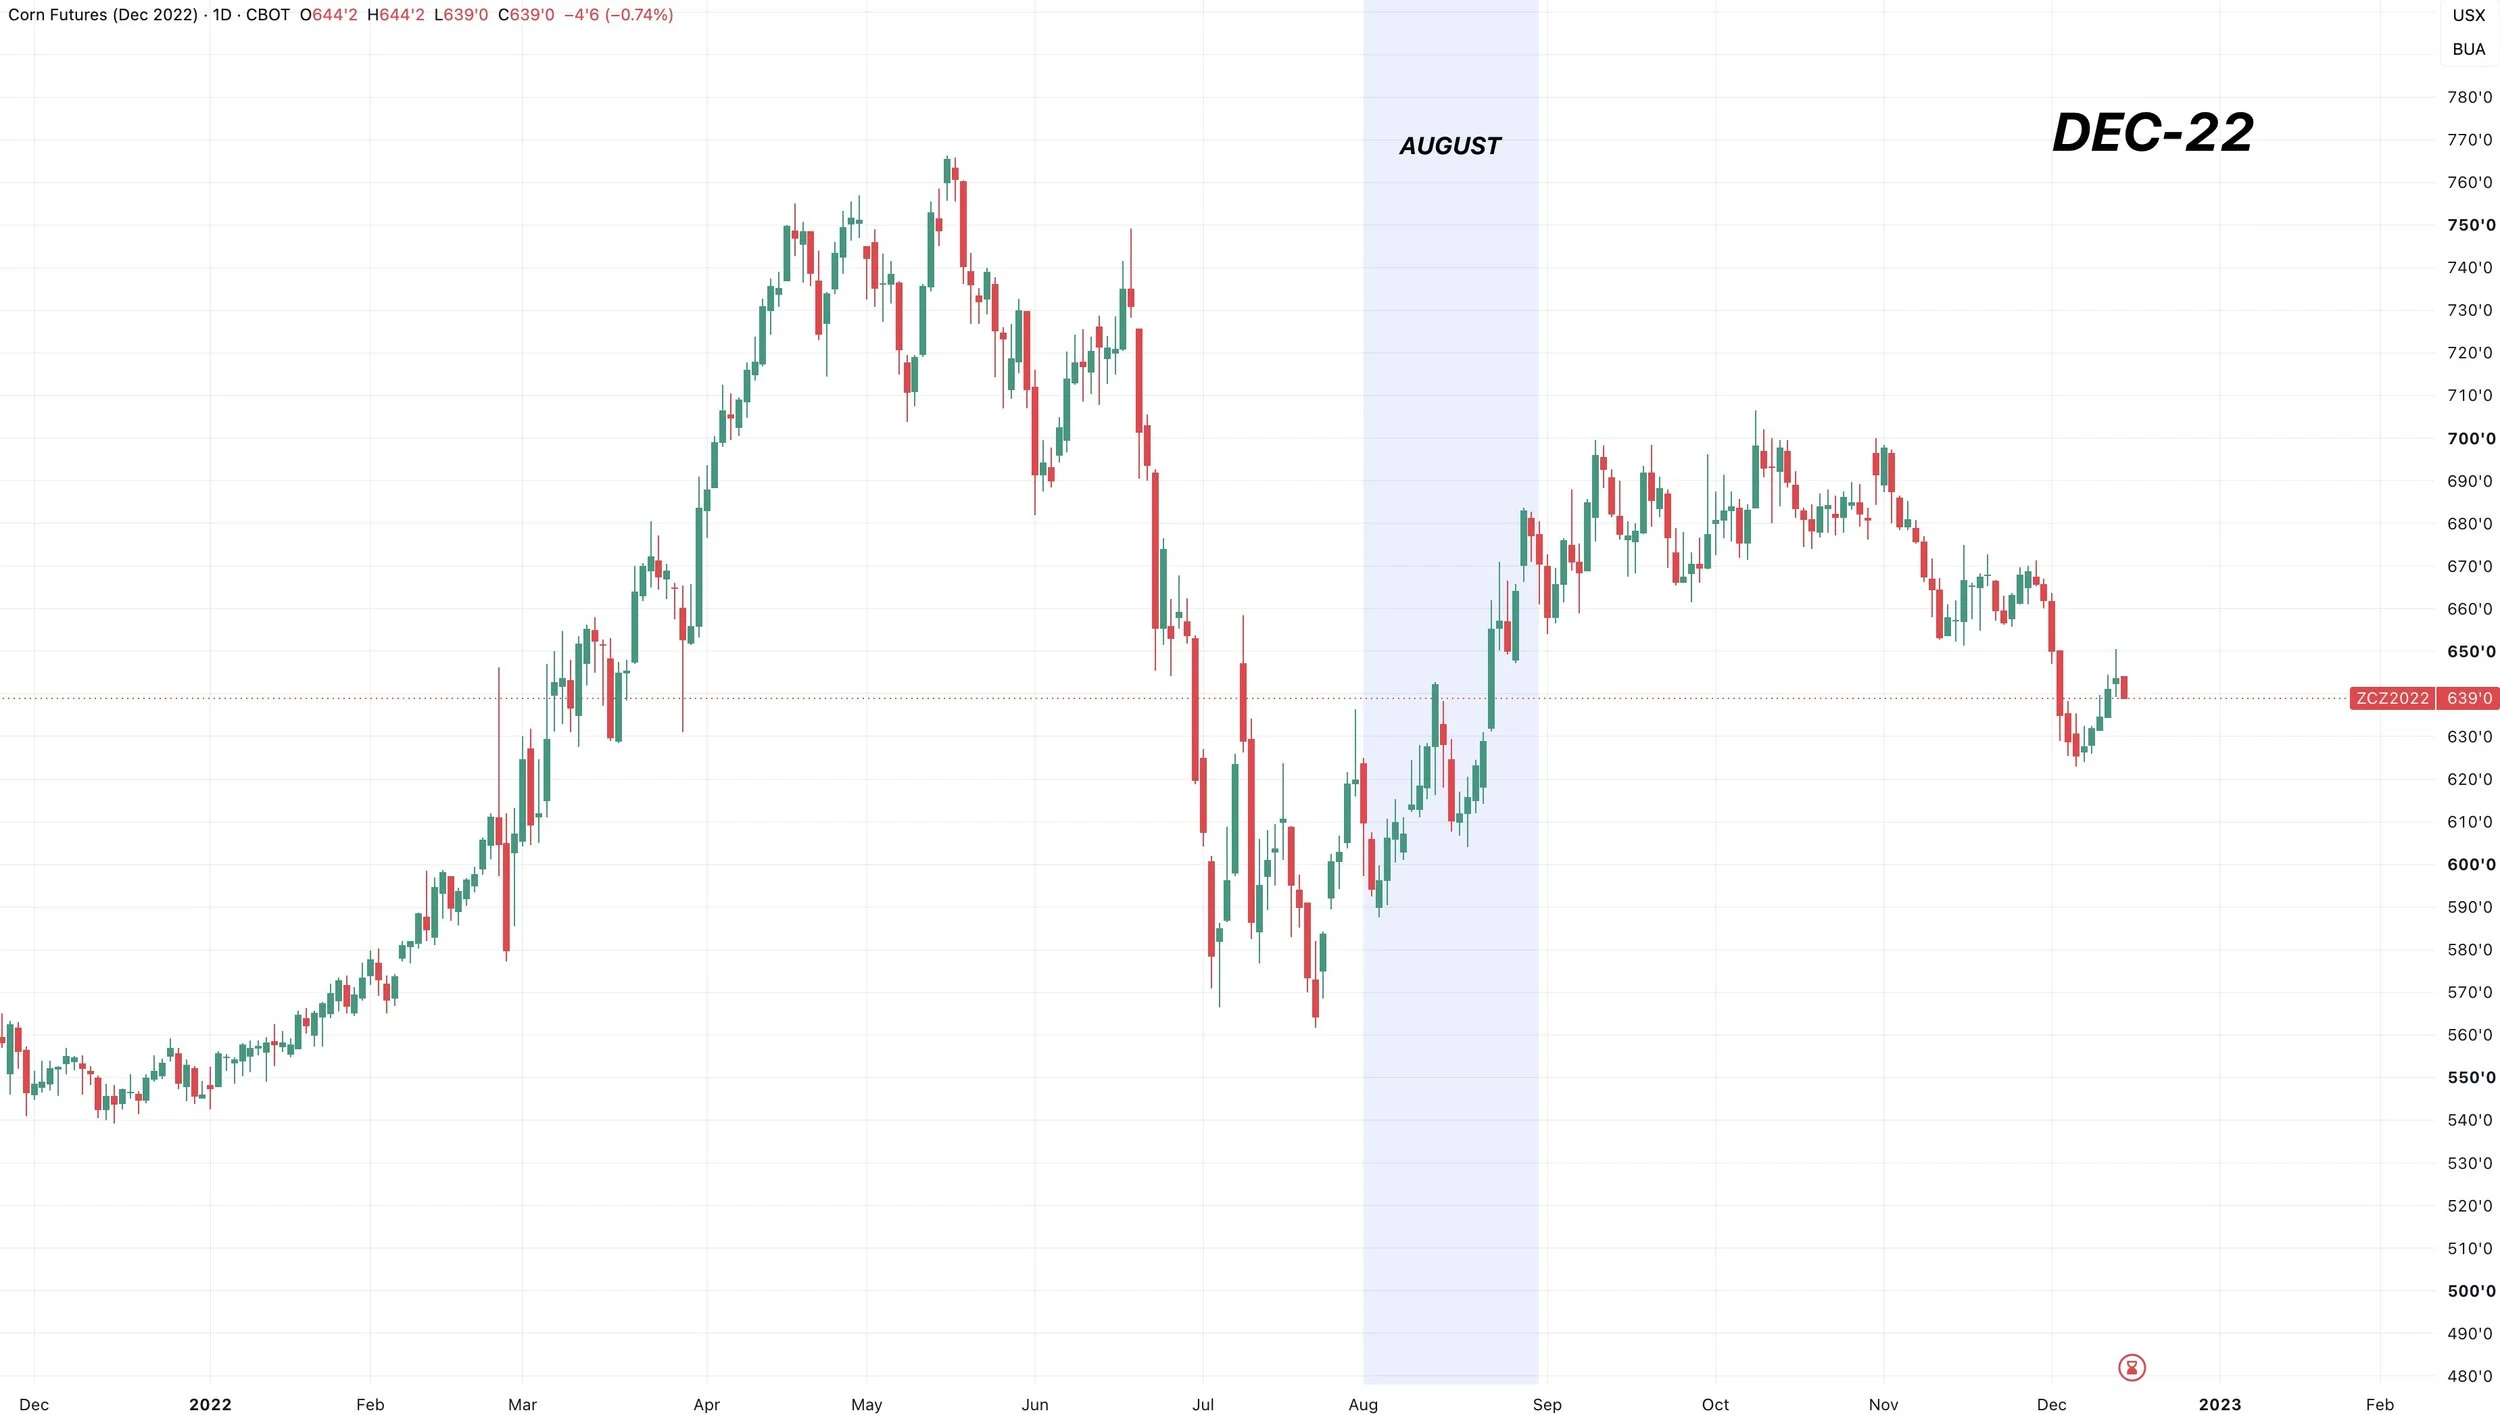
2022:
The August rally came after a brutal summer sell off. The rally did not reclaim what we lost. However, the market stayed strong until November.
Corn was trading over $7.00 at the time for reference.
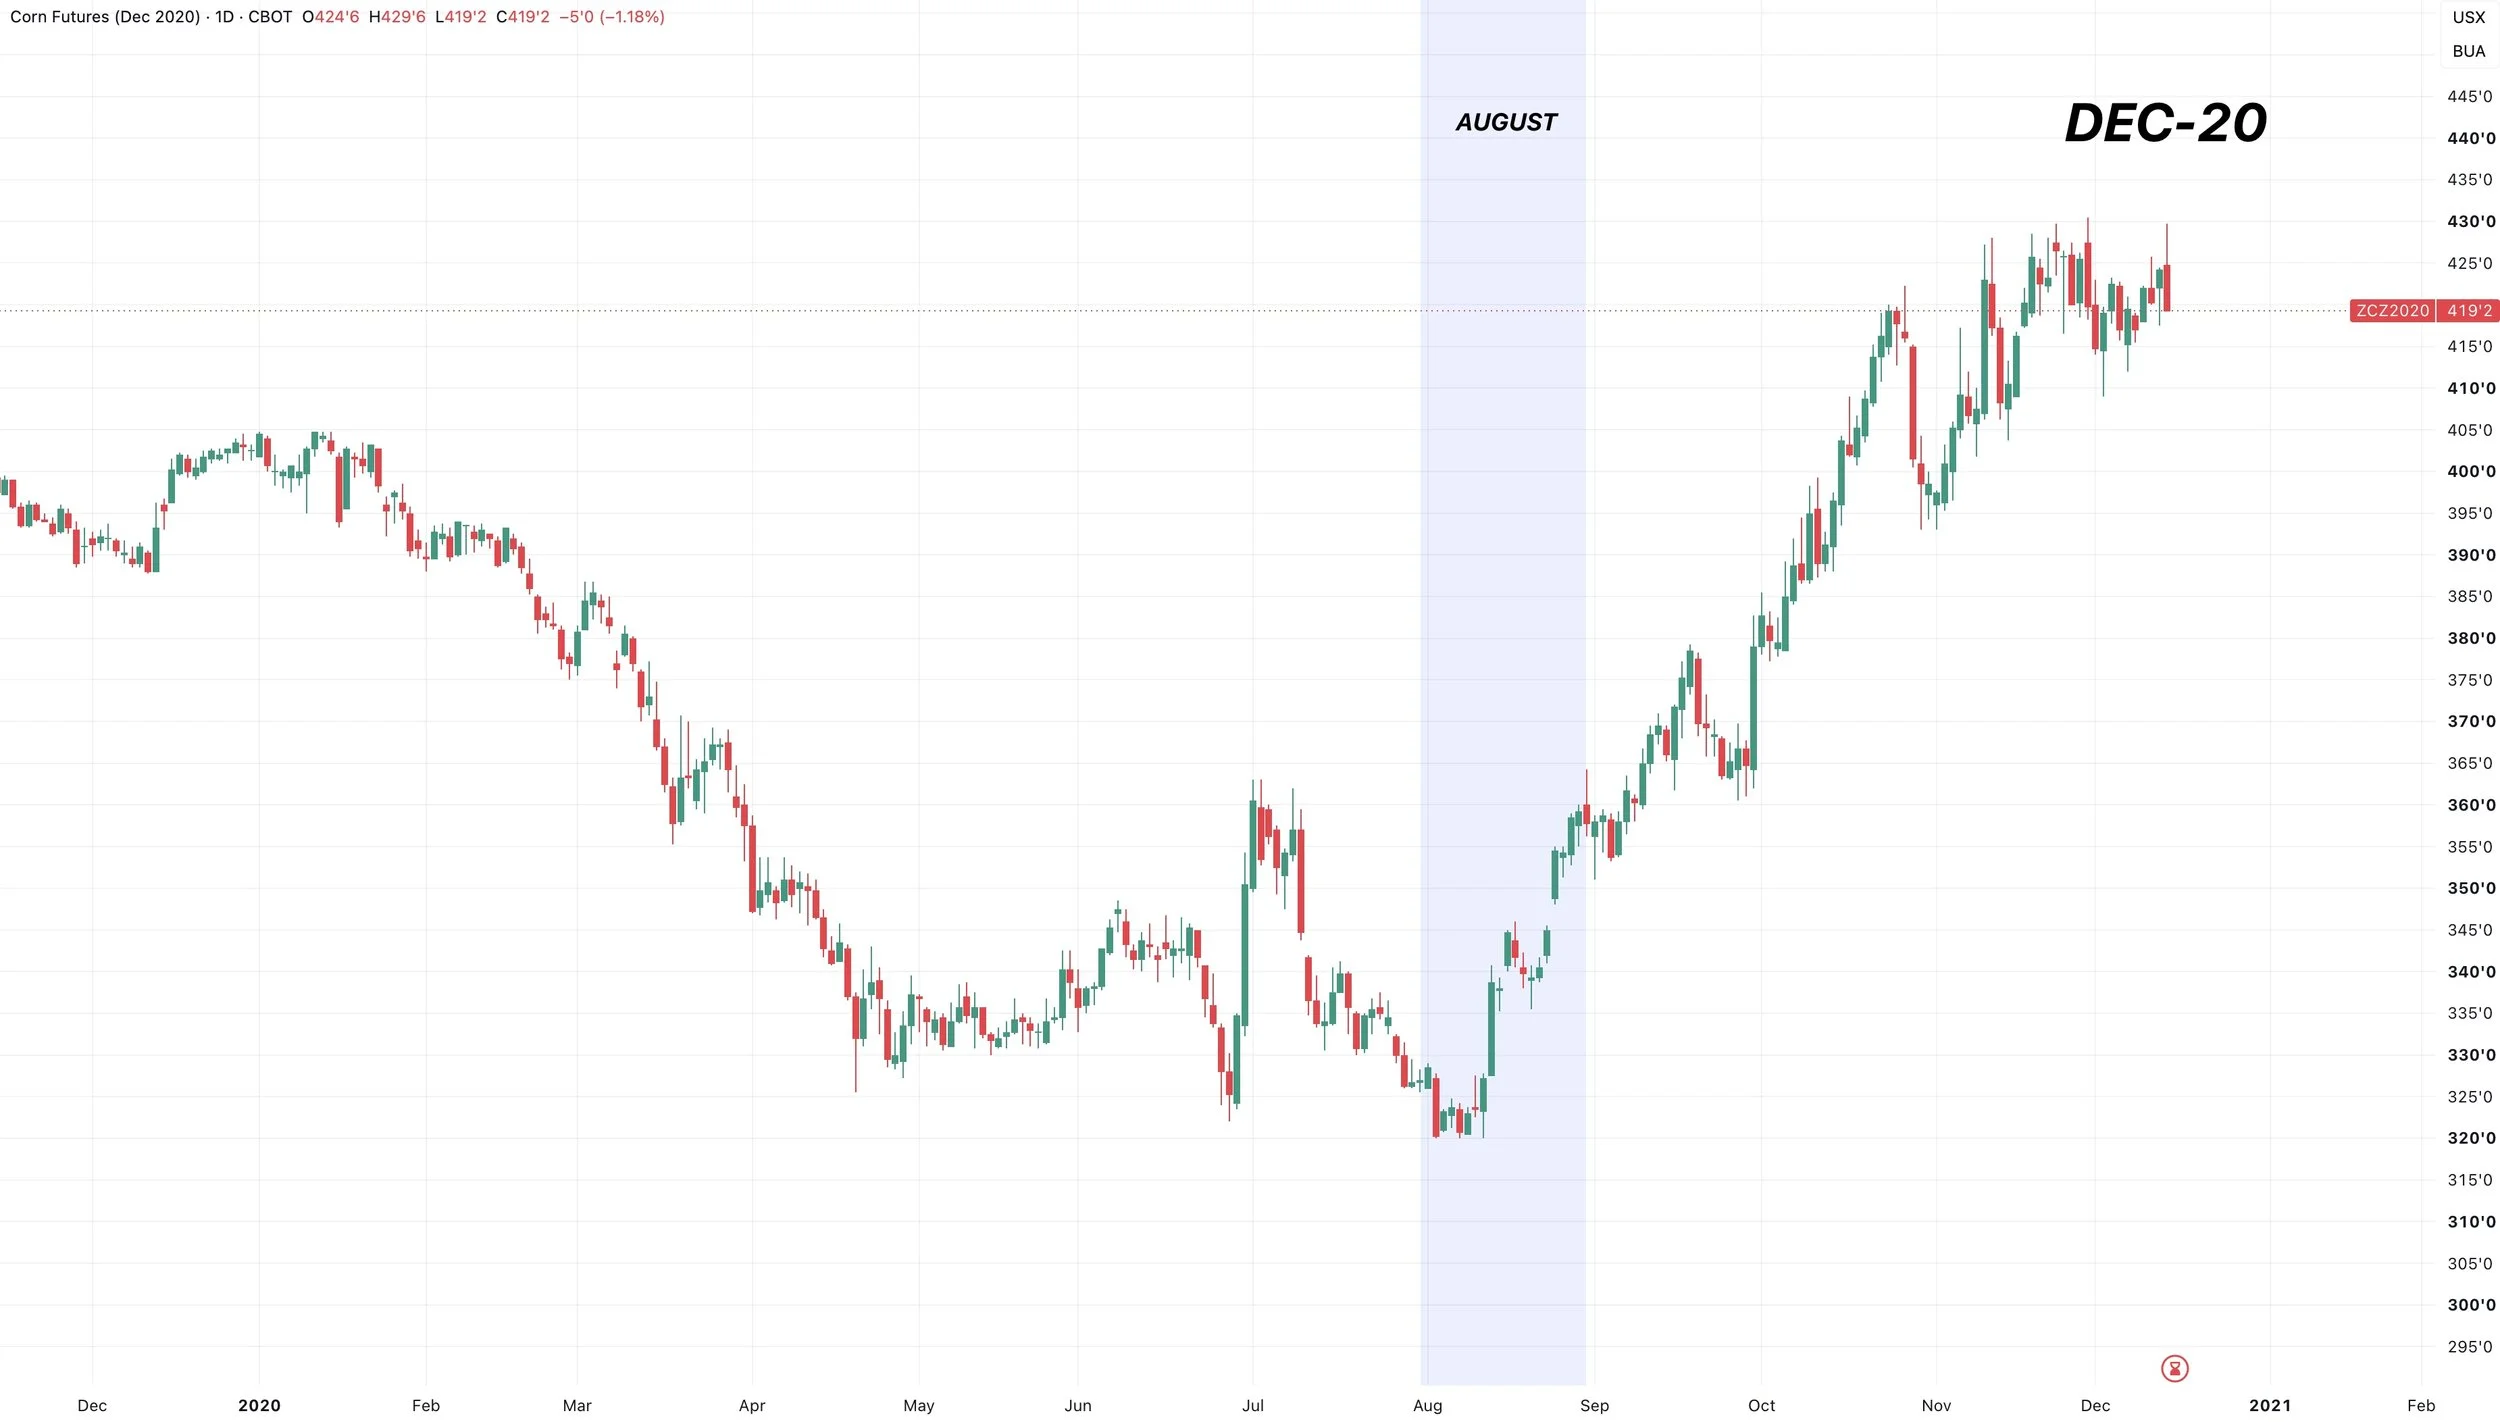
2020:
The rally continued the rest of the year.
Which led to a bull market the following year.
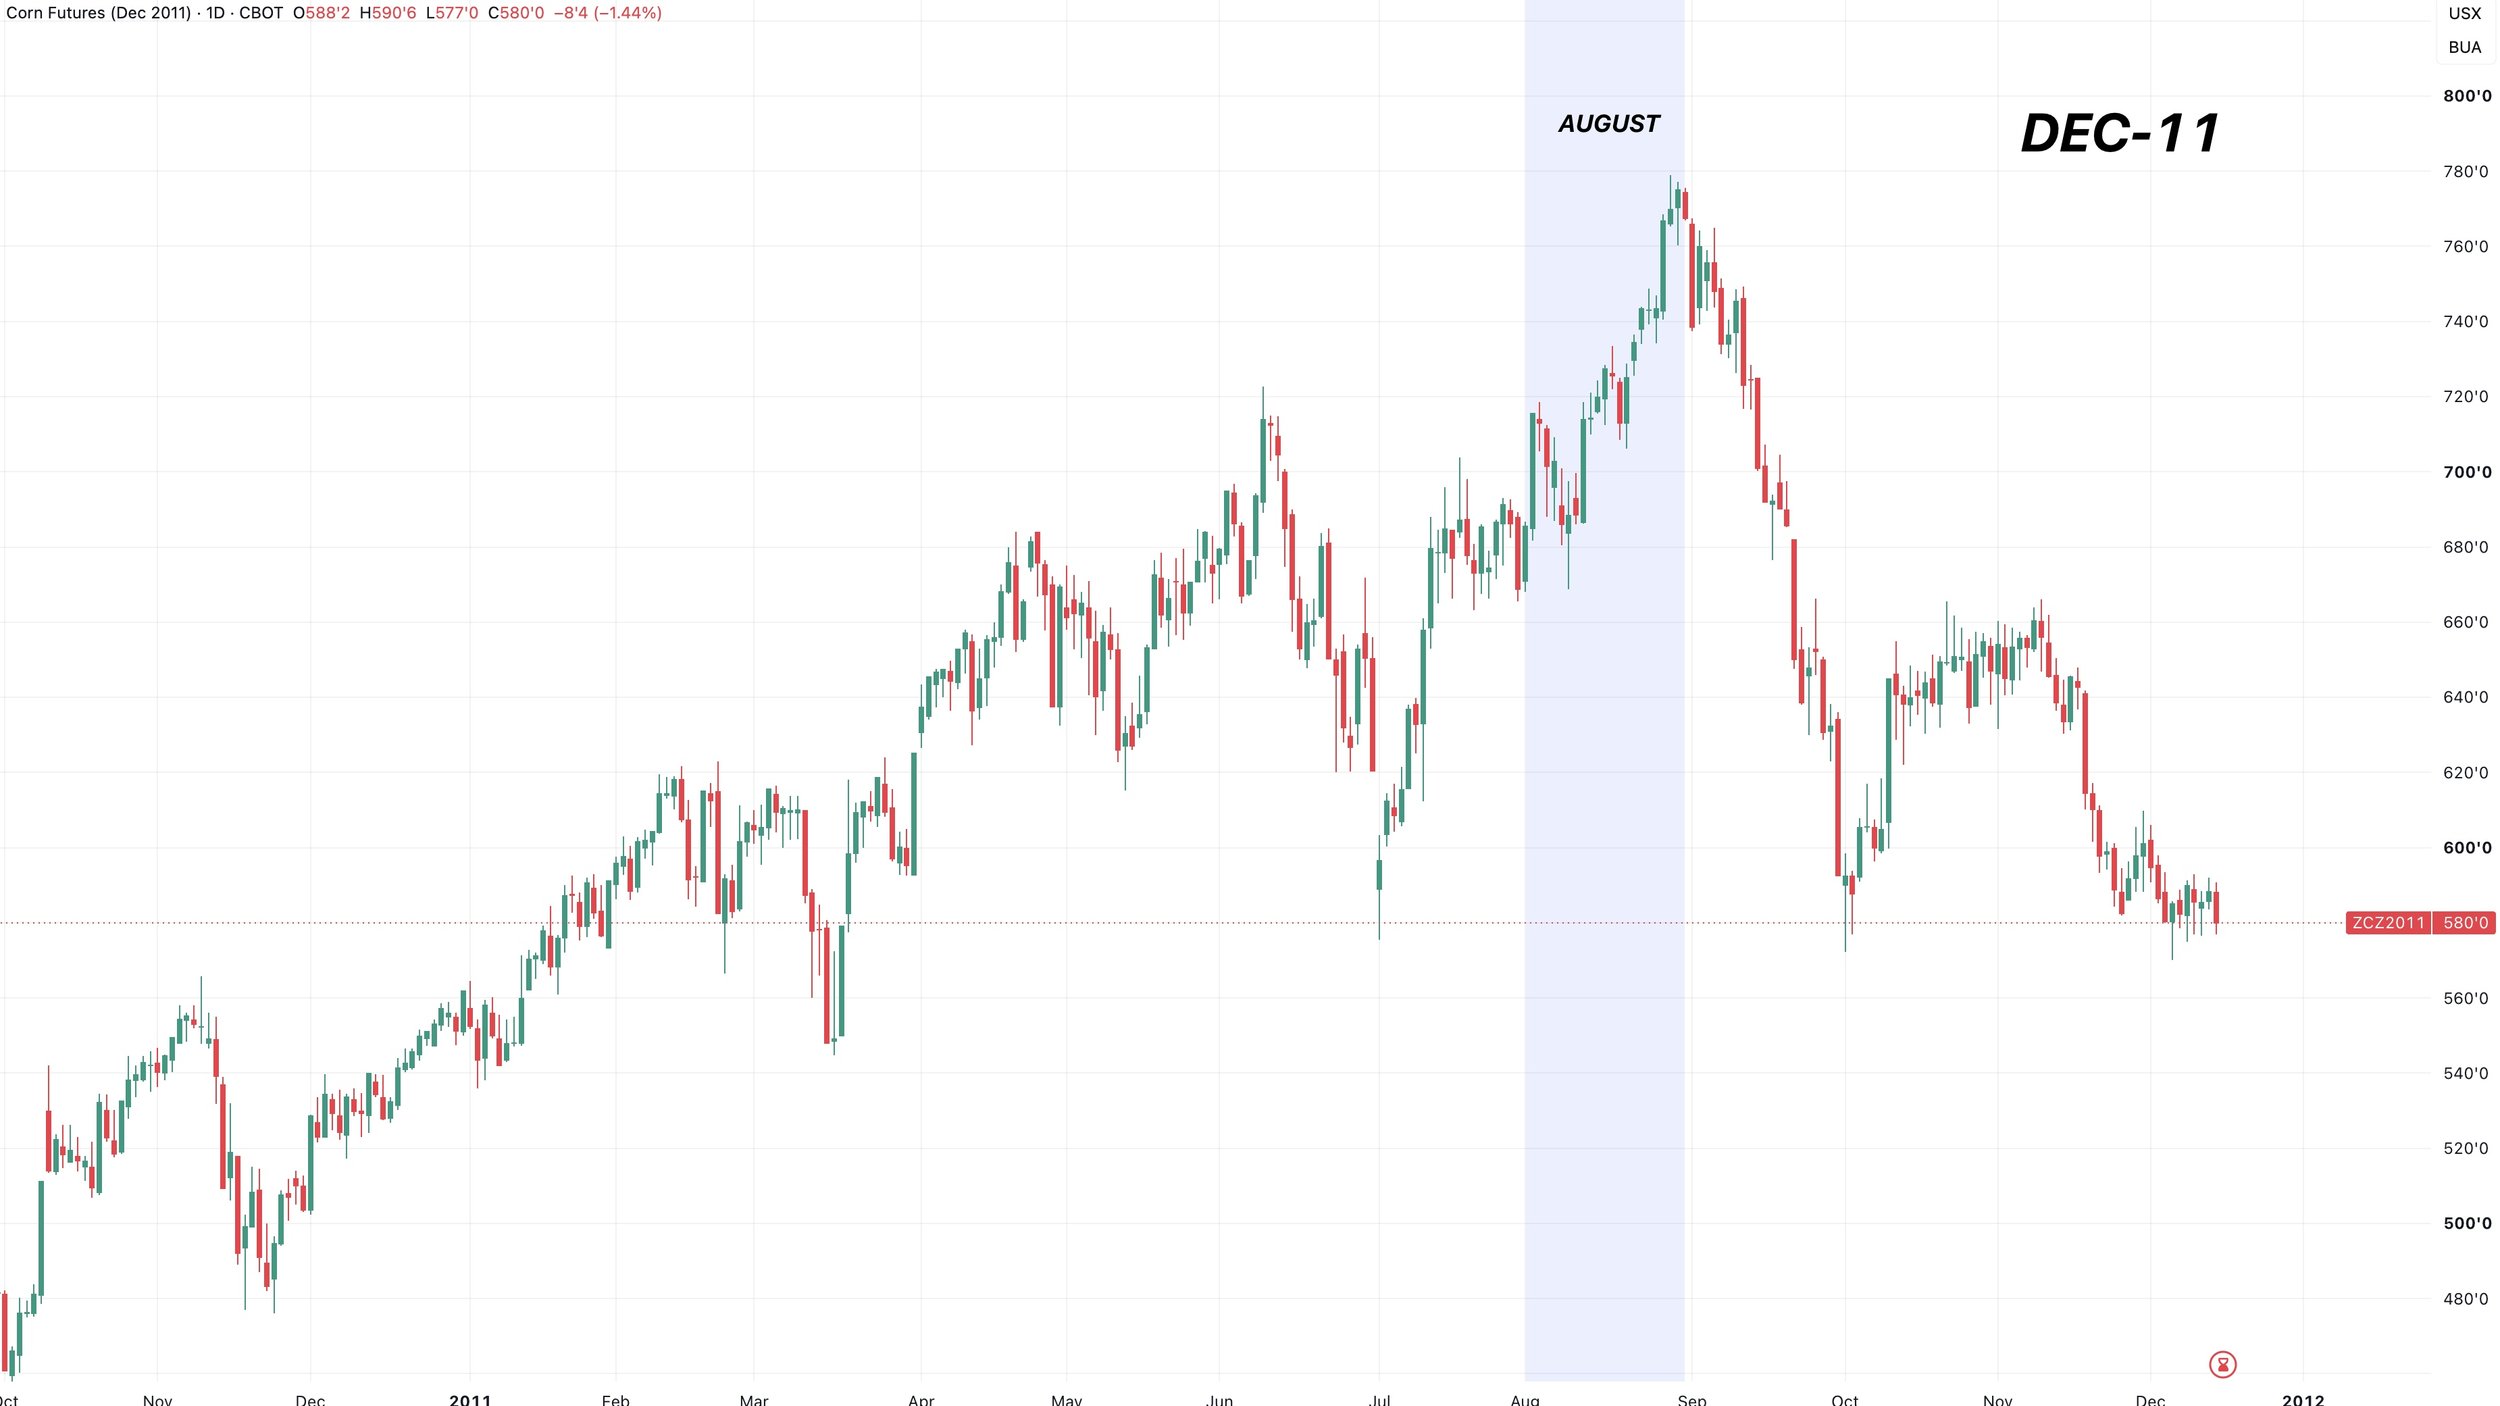
2011:
Now this would be the only year where the market did not stay strong after it's strong August performance.
The market basically went lower every day of September.
2010:
Lastly you have 2010.
Once again, the market was strong the rest of the year.
Which eventually led to a bull market the following year.
First Monthly Breakout Since 2020:
Here is another reason to believe this year is more similar to that of 2010 or 2020.
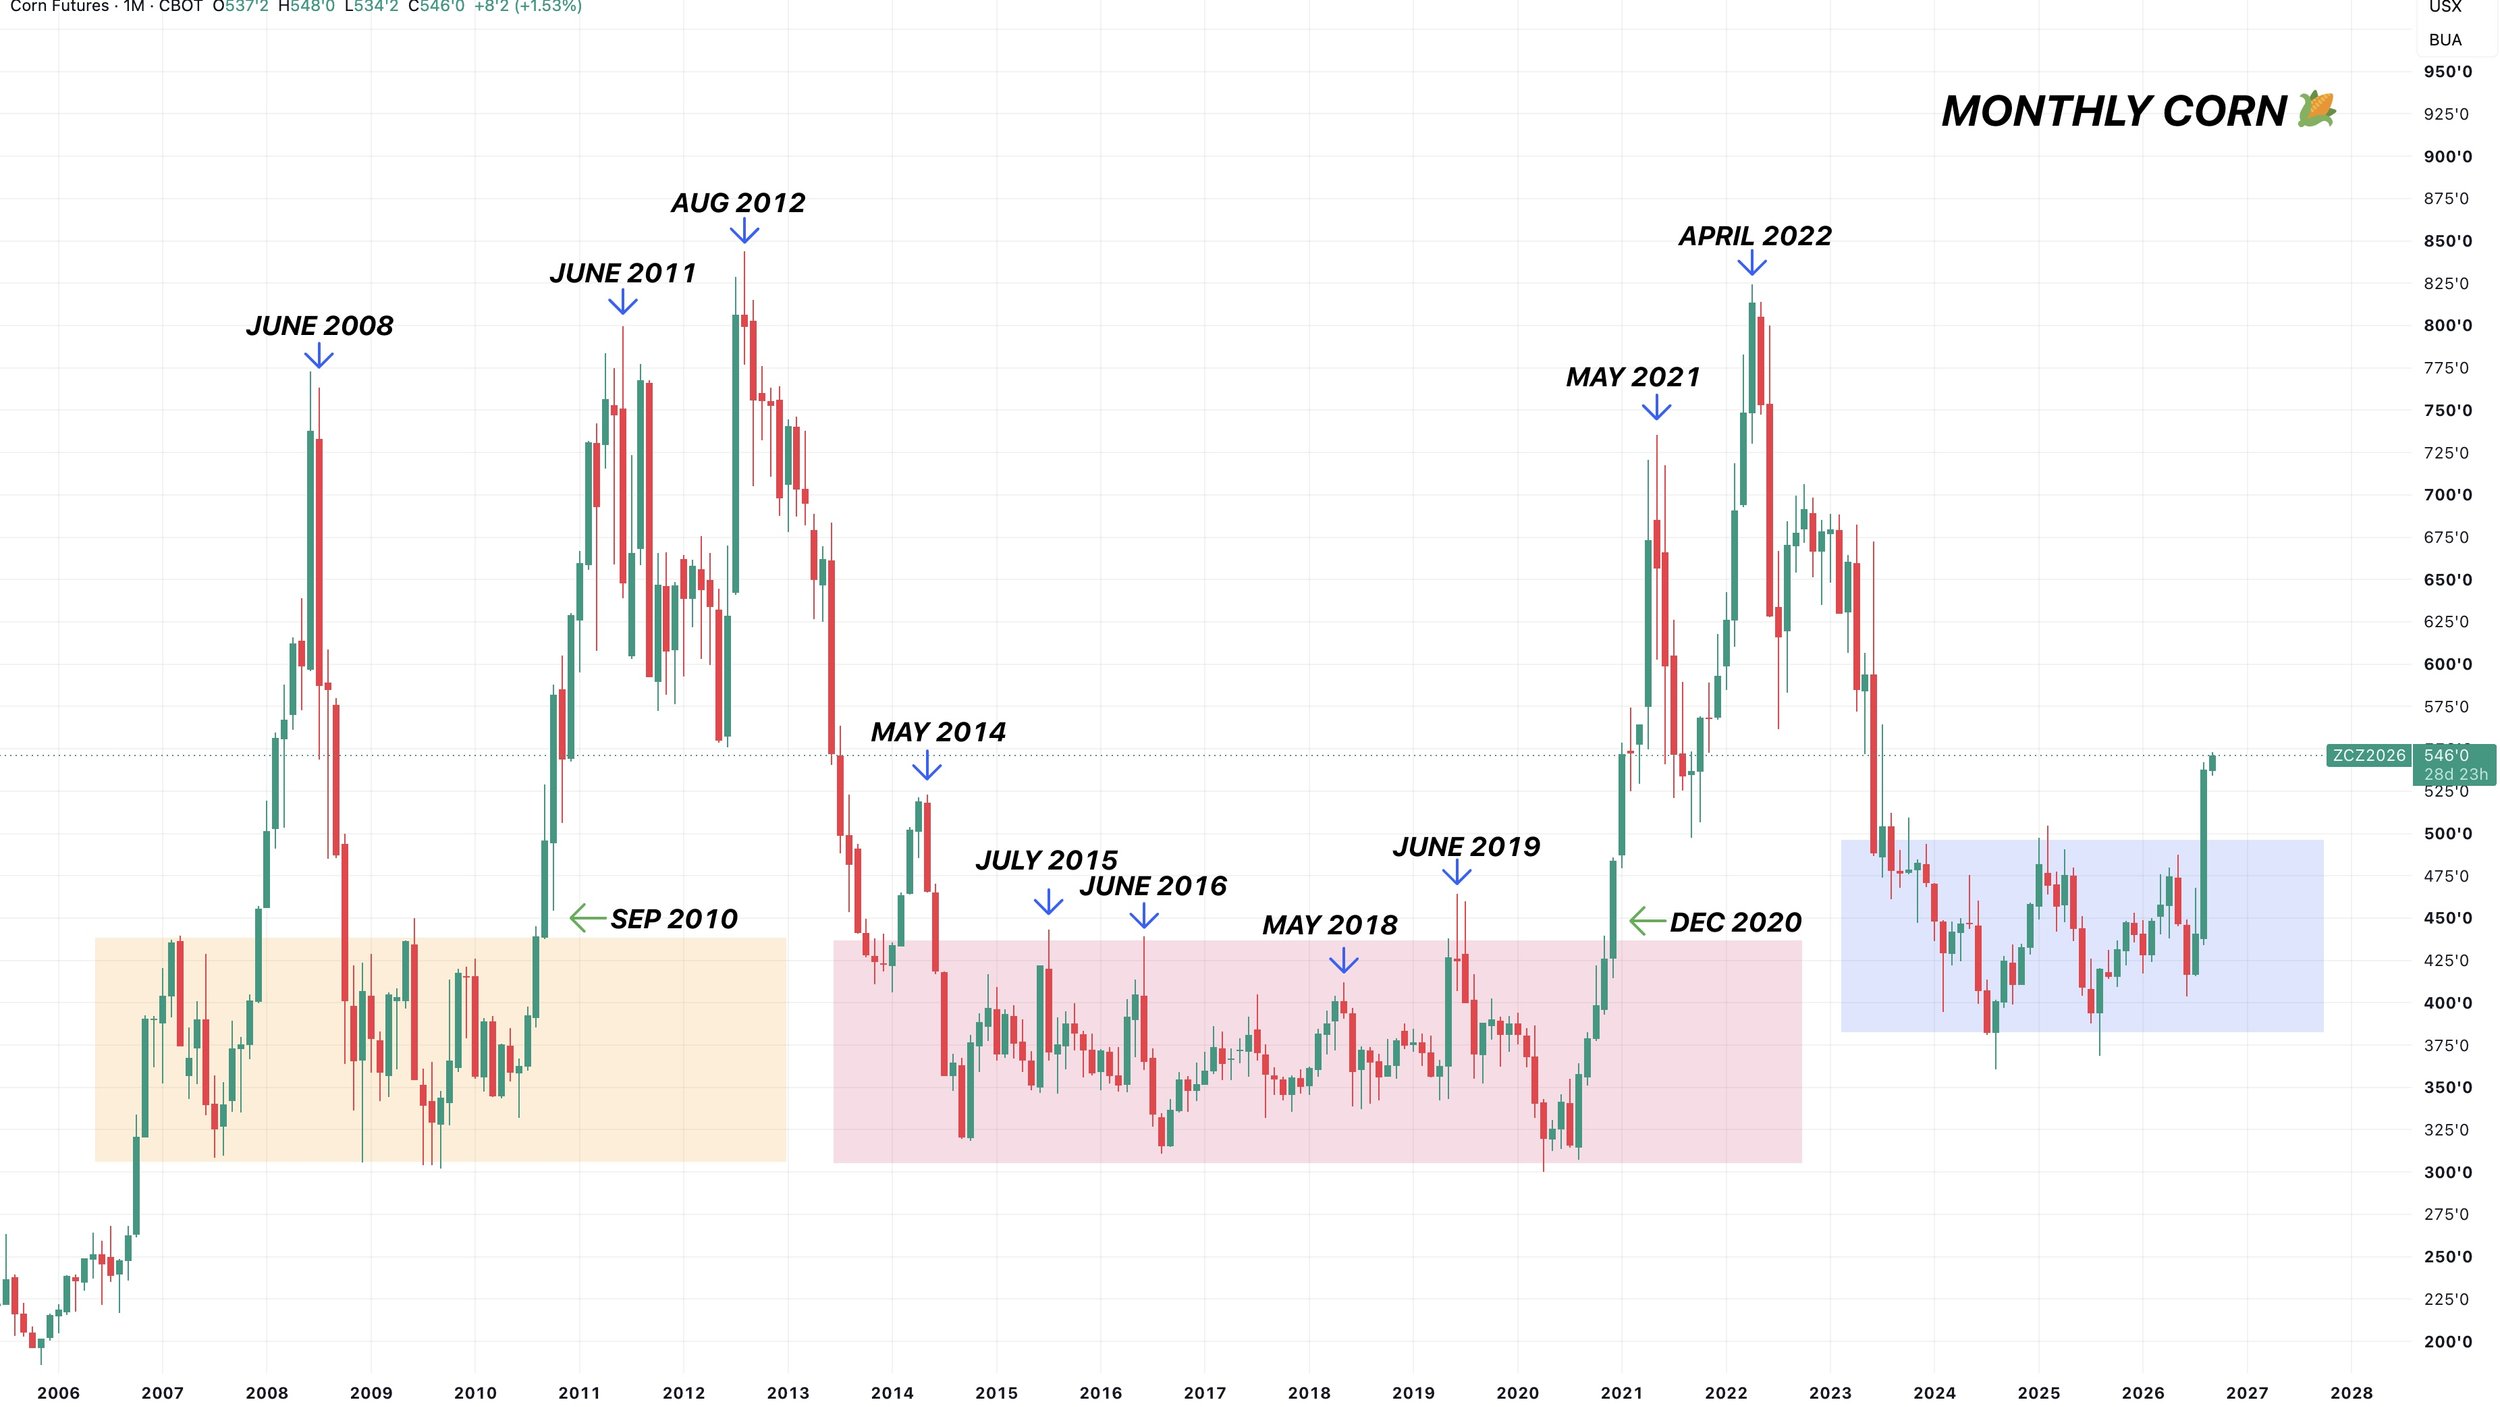
Corn tends to be trapped in a $1.00 range.
We've been trapped in a rough $1.00 range for the last 3 years since 2023.
We offically just broke out of that range.
The last two times we broke out of a multi year range were 2010 and 2020.
Interestingly enough.. both of the breakouts happened at the end of the year.
2010 happened in September.
2020 happened in December.
Where as most of those rallies that fade and do not last, occured during the spring to summer time.
End of year rallies have had a tendency to continue into the following year.
So I'd argue there are absolutely some similarities here.
What about soybeans?
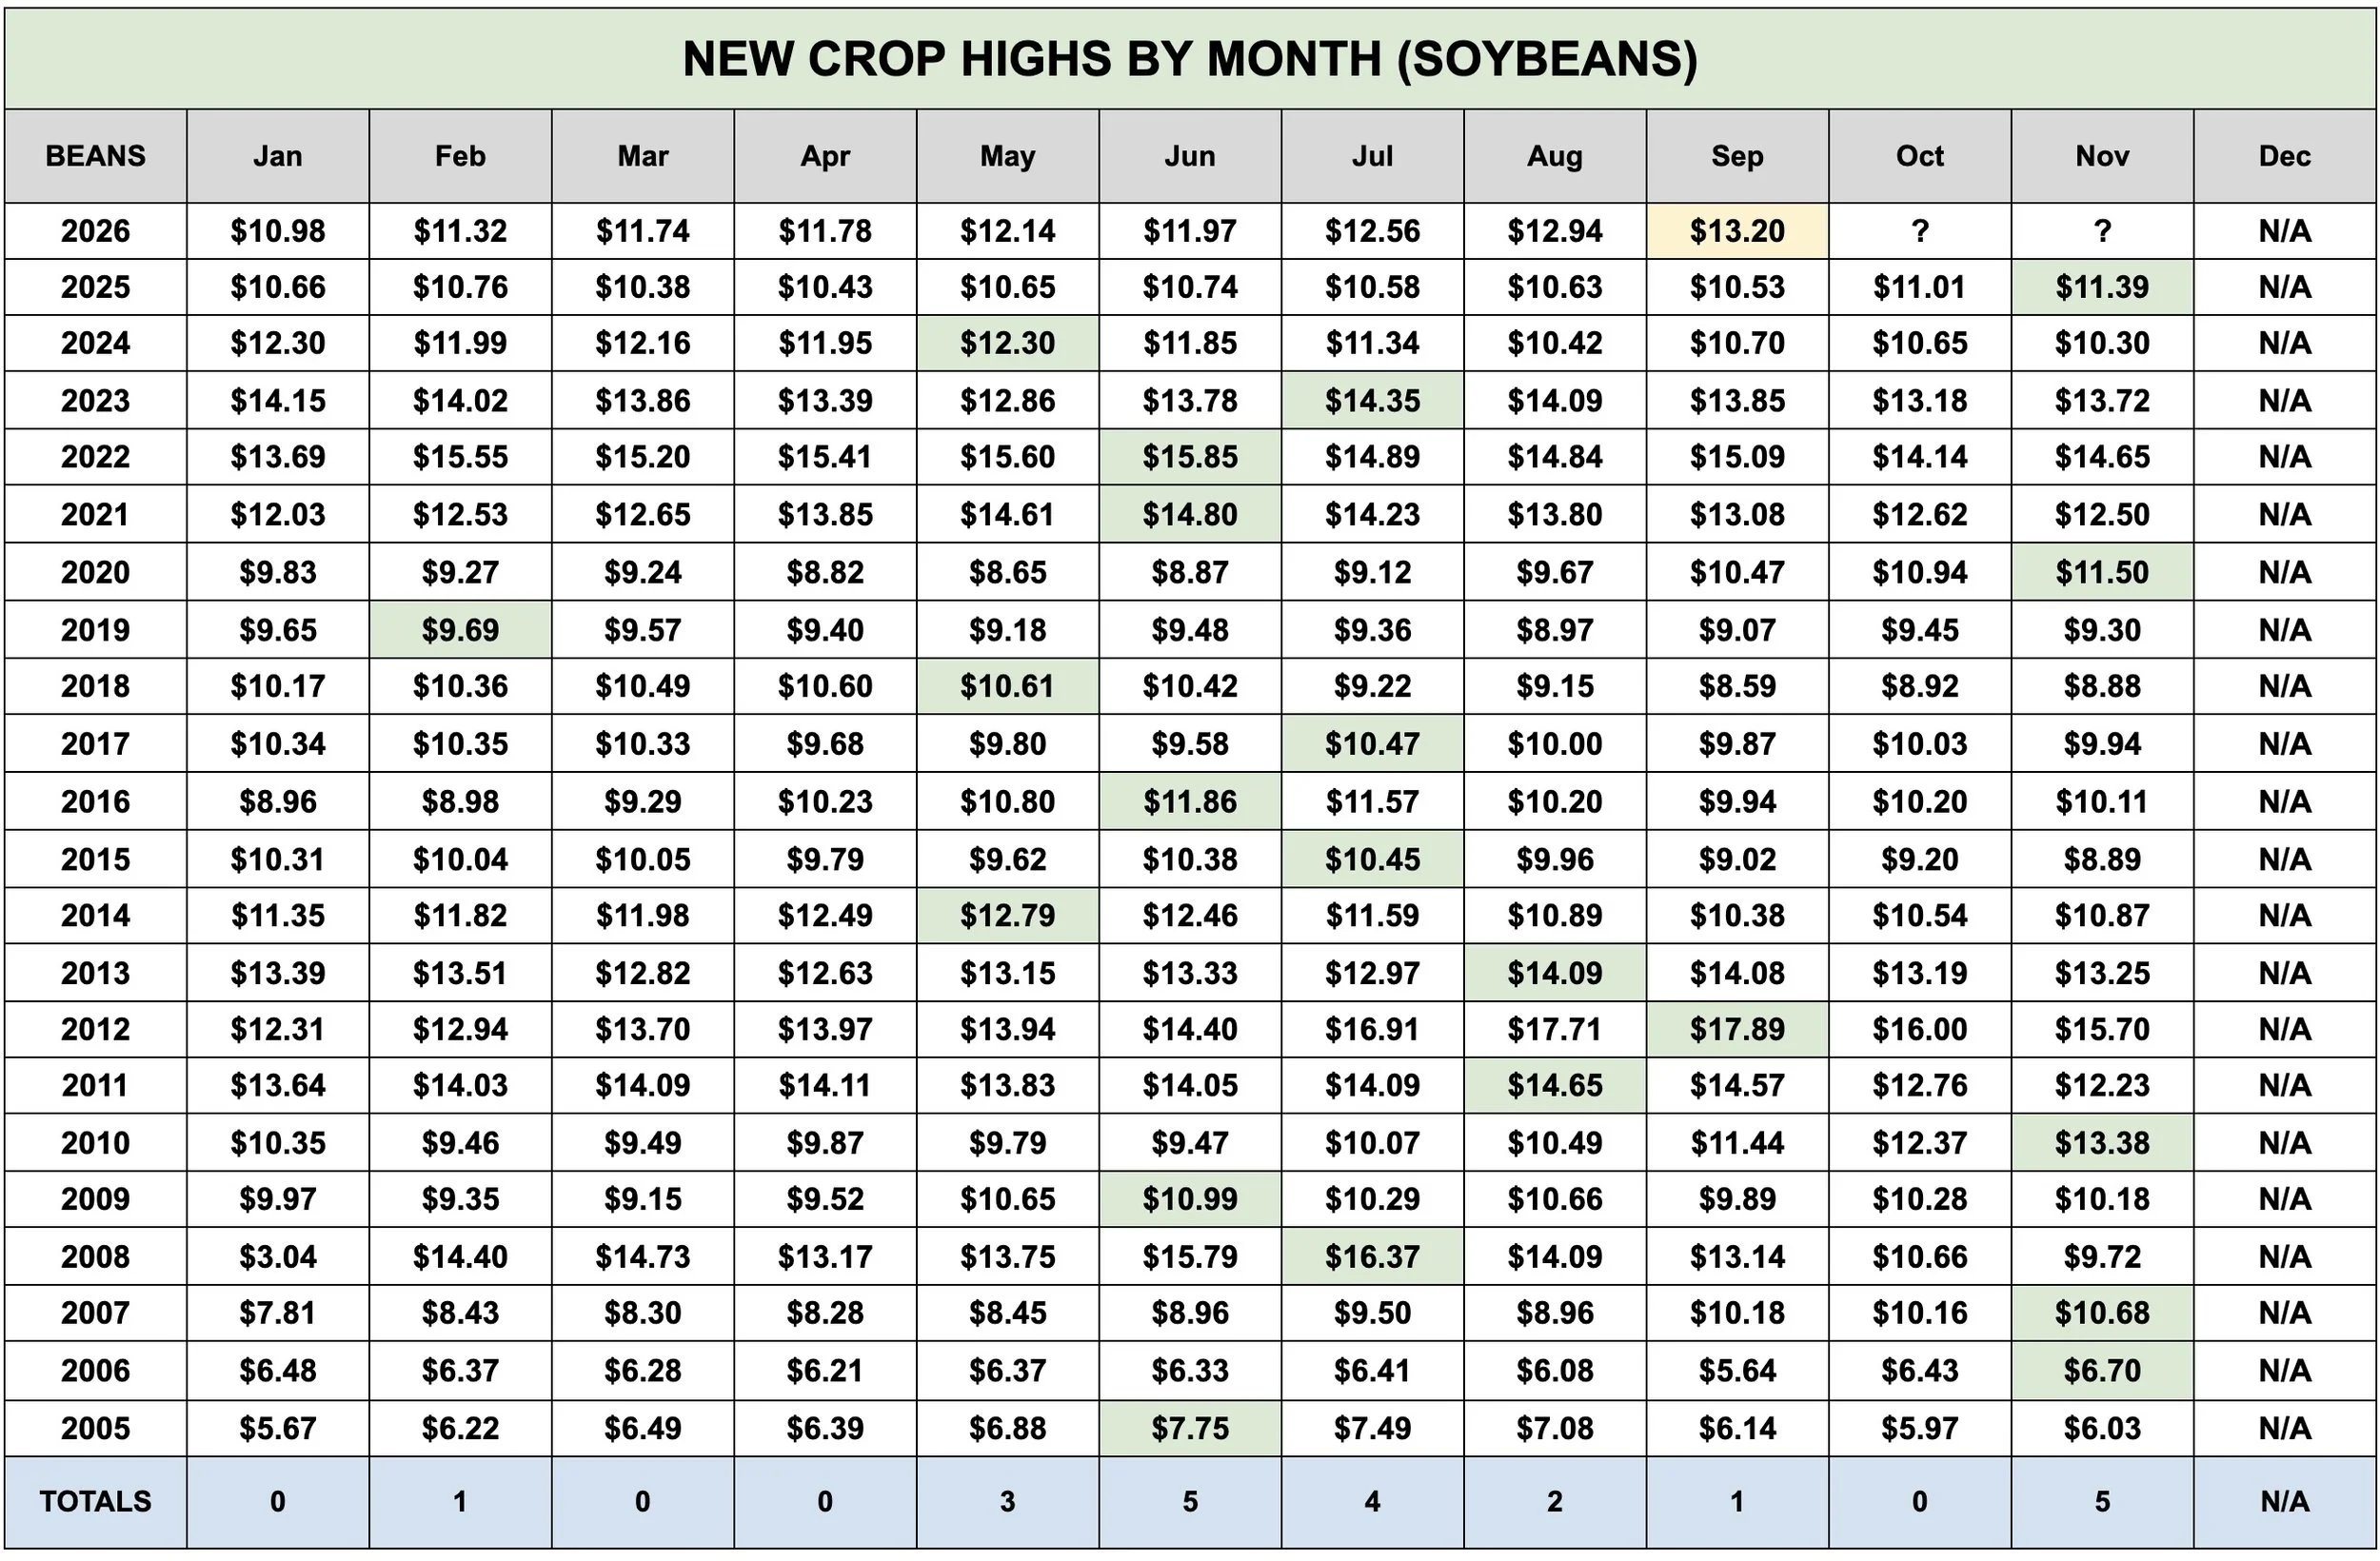
Soybeans have only posted their highs in September one time ever.
Which was back in 2012.
But I'd once again argue that this year isn’t all that similar to 2012.
Sure, we have some concerns surrounding supply, but this has largely been a demand led run. Where the market is questioning whether our supply can meet that demand. Rather than a weather scare.
Soybeans have never topped in October.
November is actually the most common month outside of June.
Charts
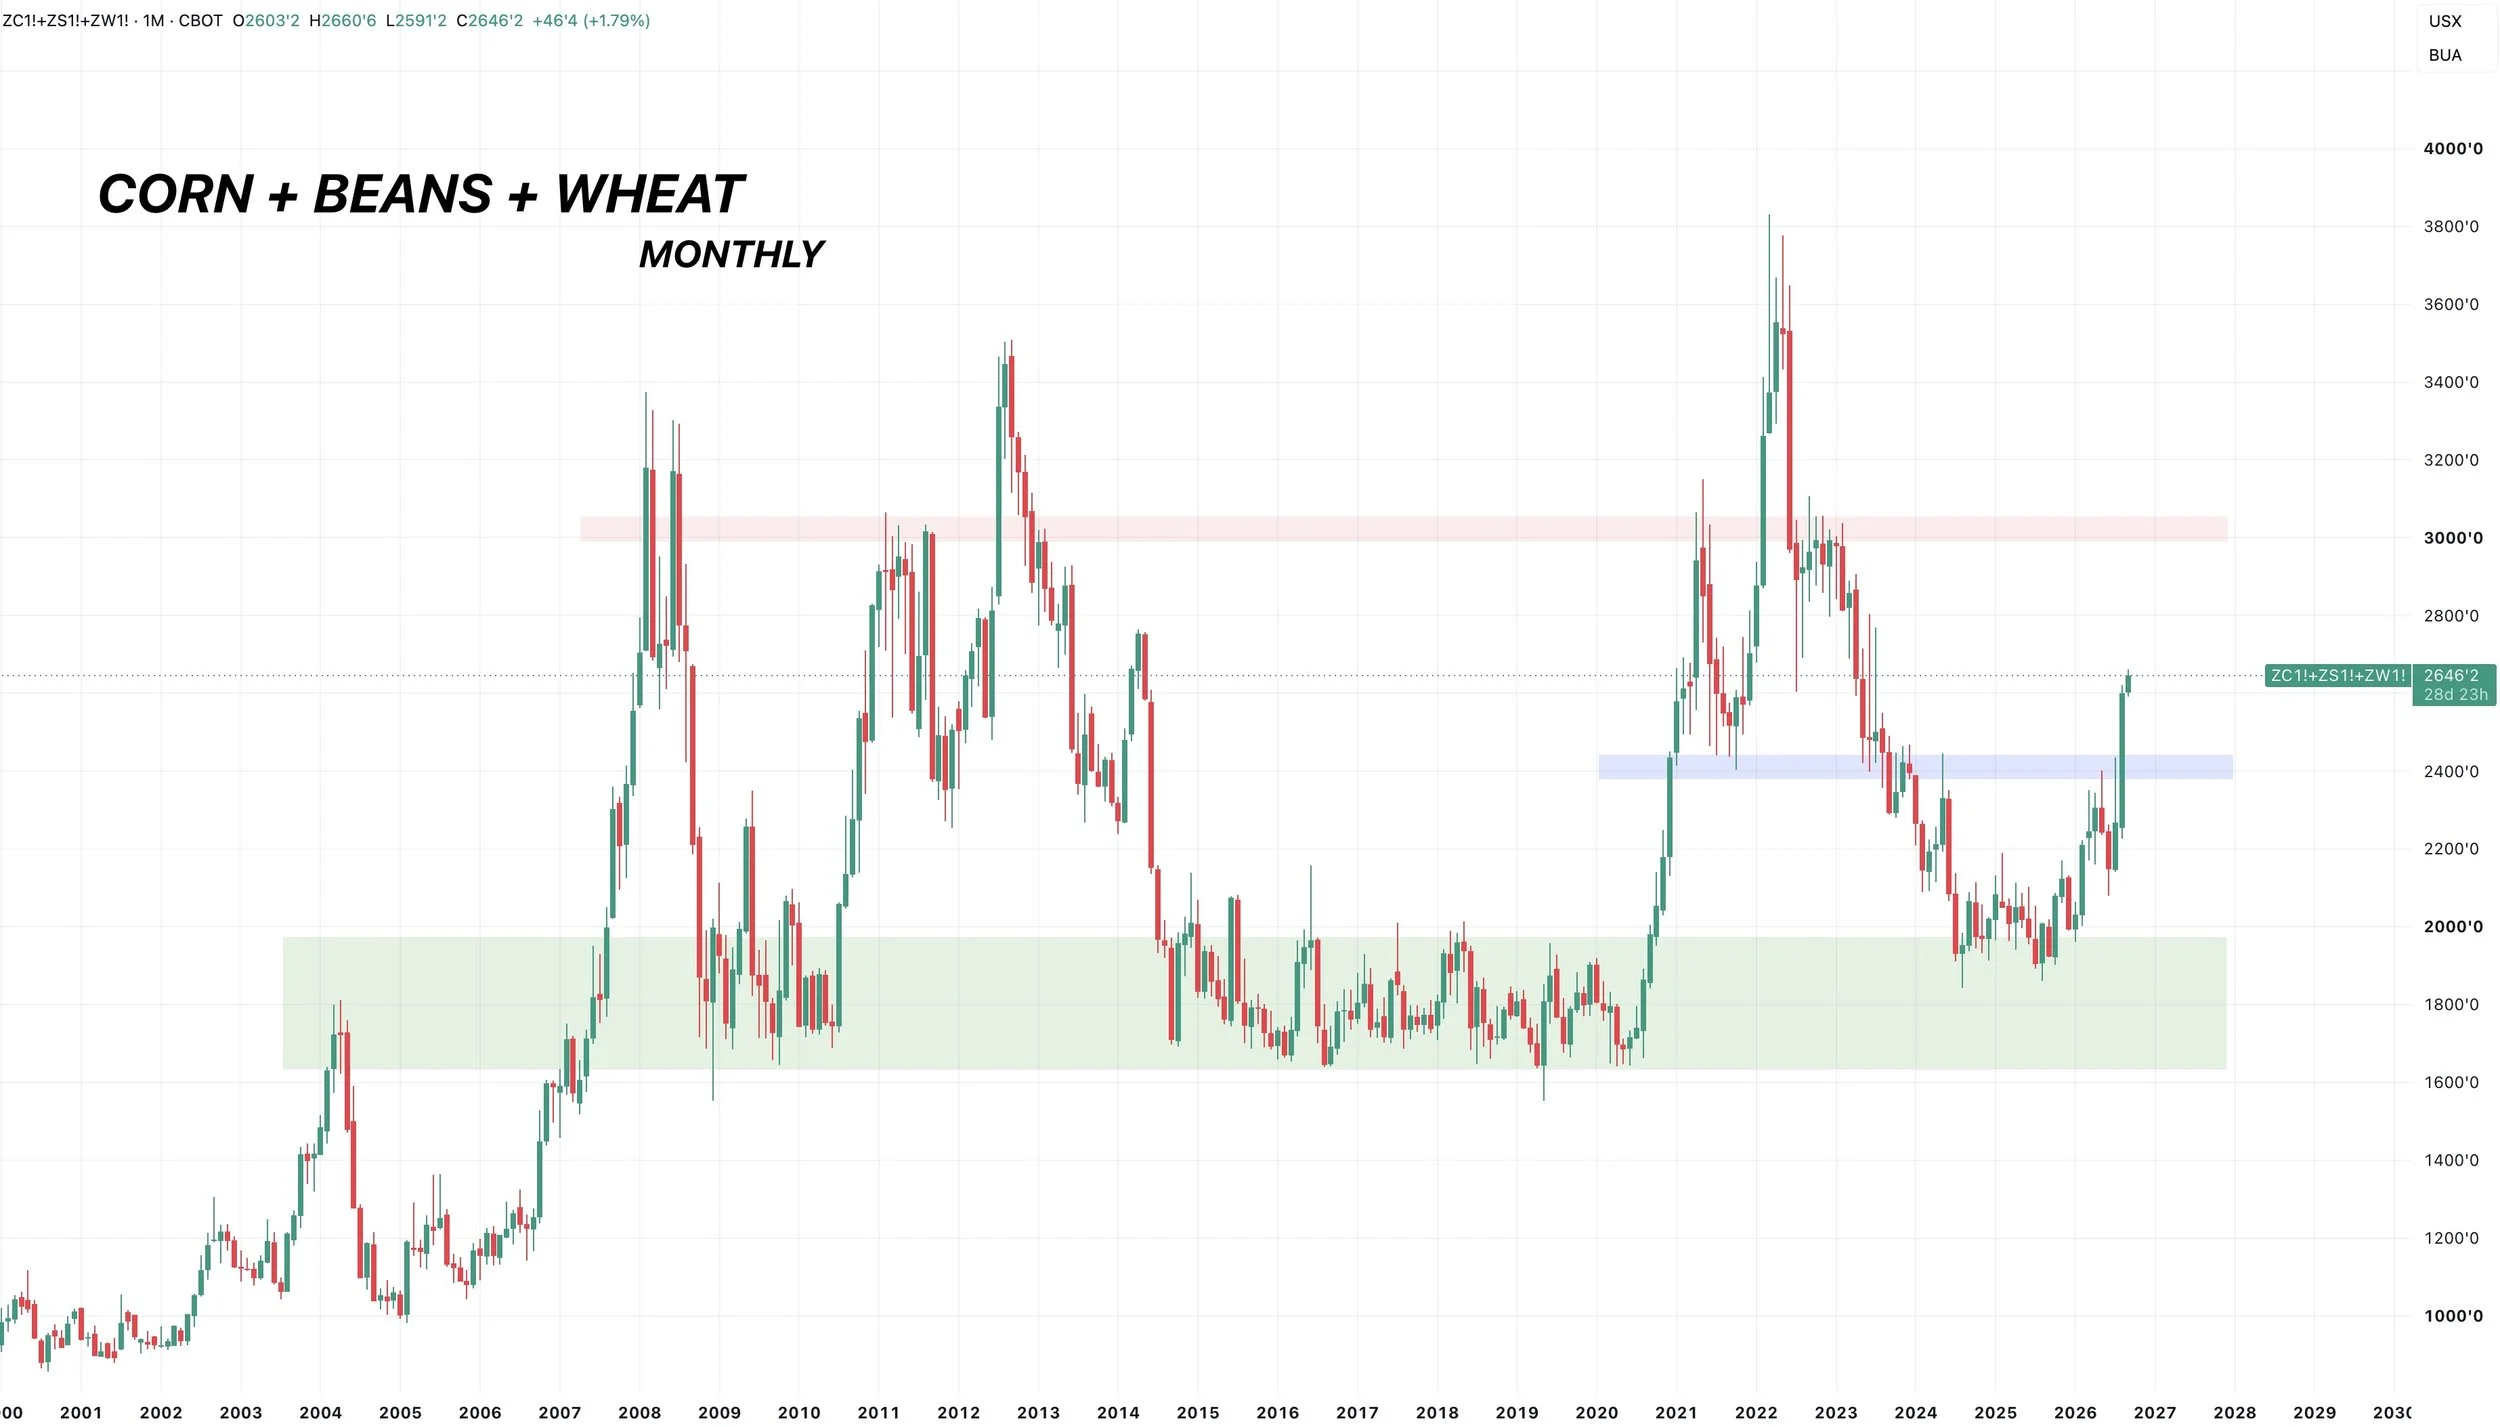
Corn + Beans + Wheat Chart
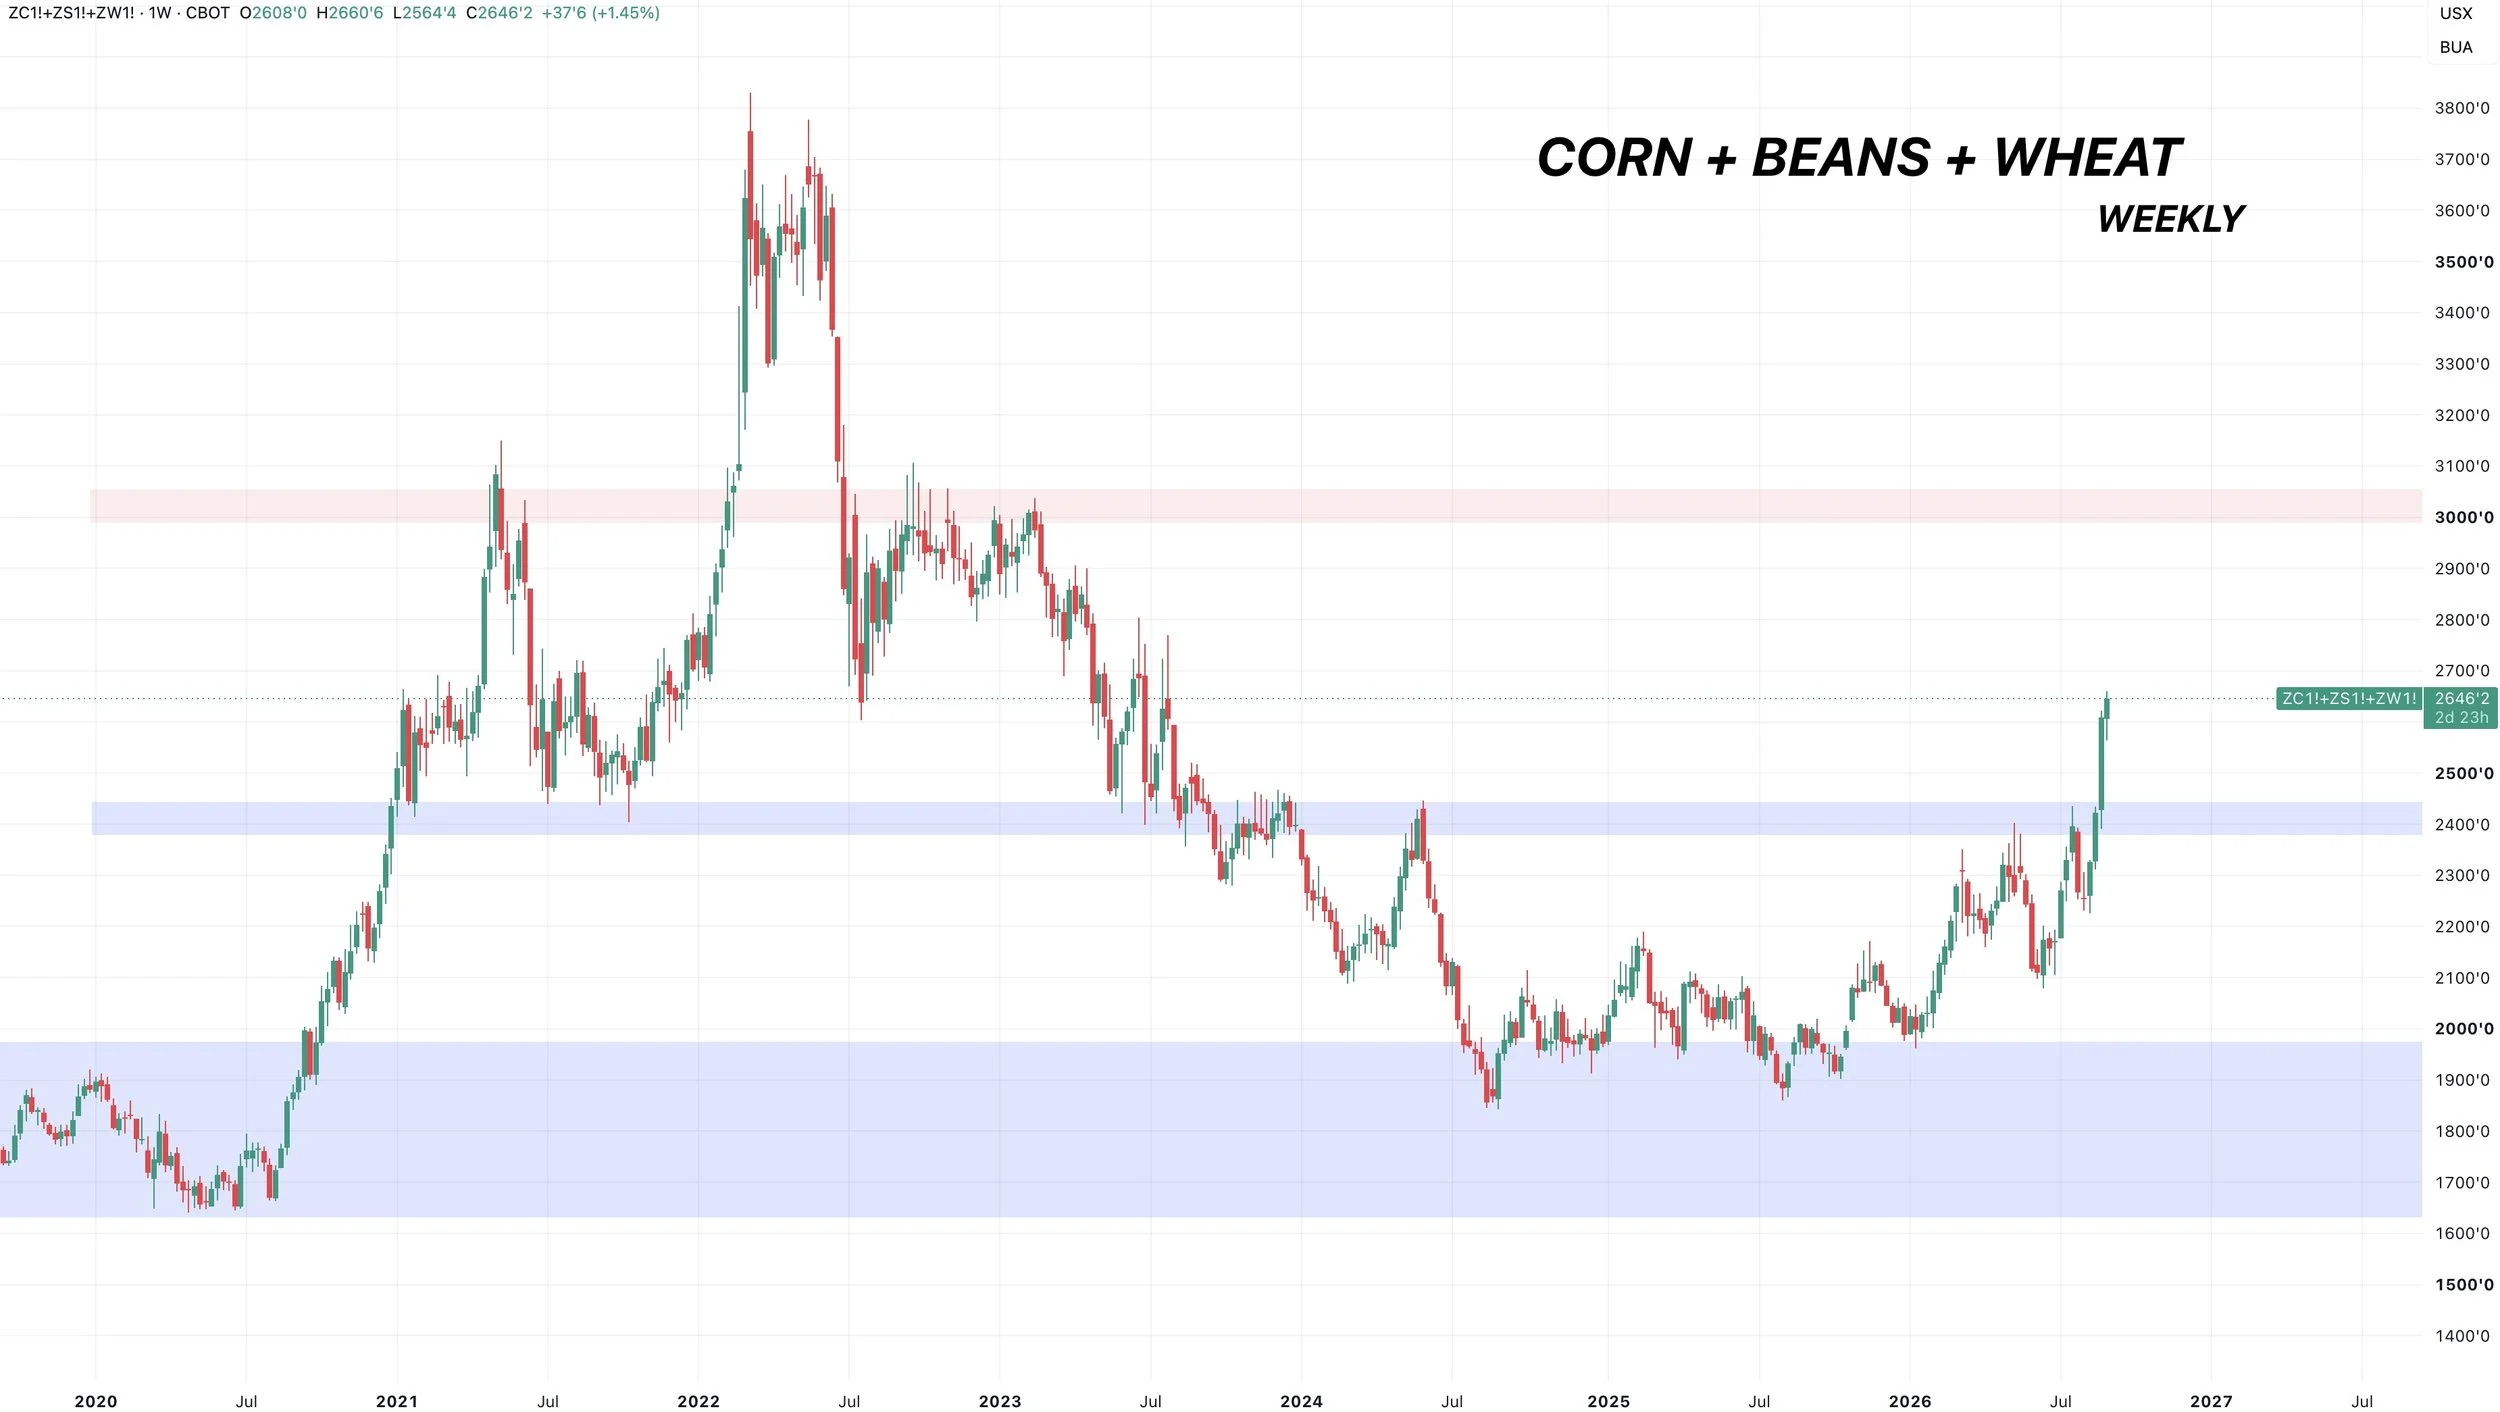
Here is a chart that combines front month corn, soybeans, and wheat prices.
This first one is the weekly chart.
This chart looks very bullish long term.
We have been sideways the last few years. We are now breaking out. Shattering some pretty significant resistance.
As we cleared those highs from 2024 and the lows from 2021.
It likely won’t be a straight line higher, but long term this chart looks very promising and I'd say it definitely has room to run further towards those 2021 highs and 2023 highs.
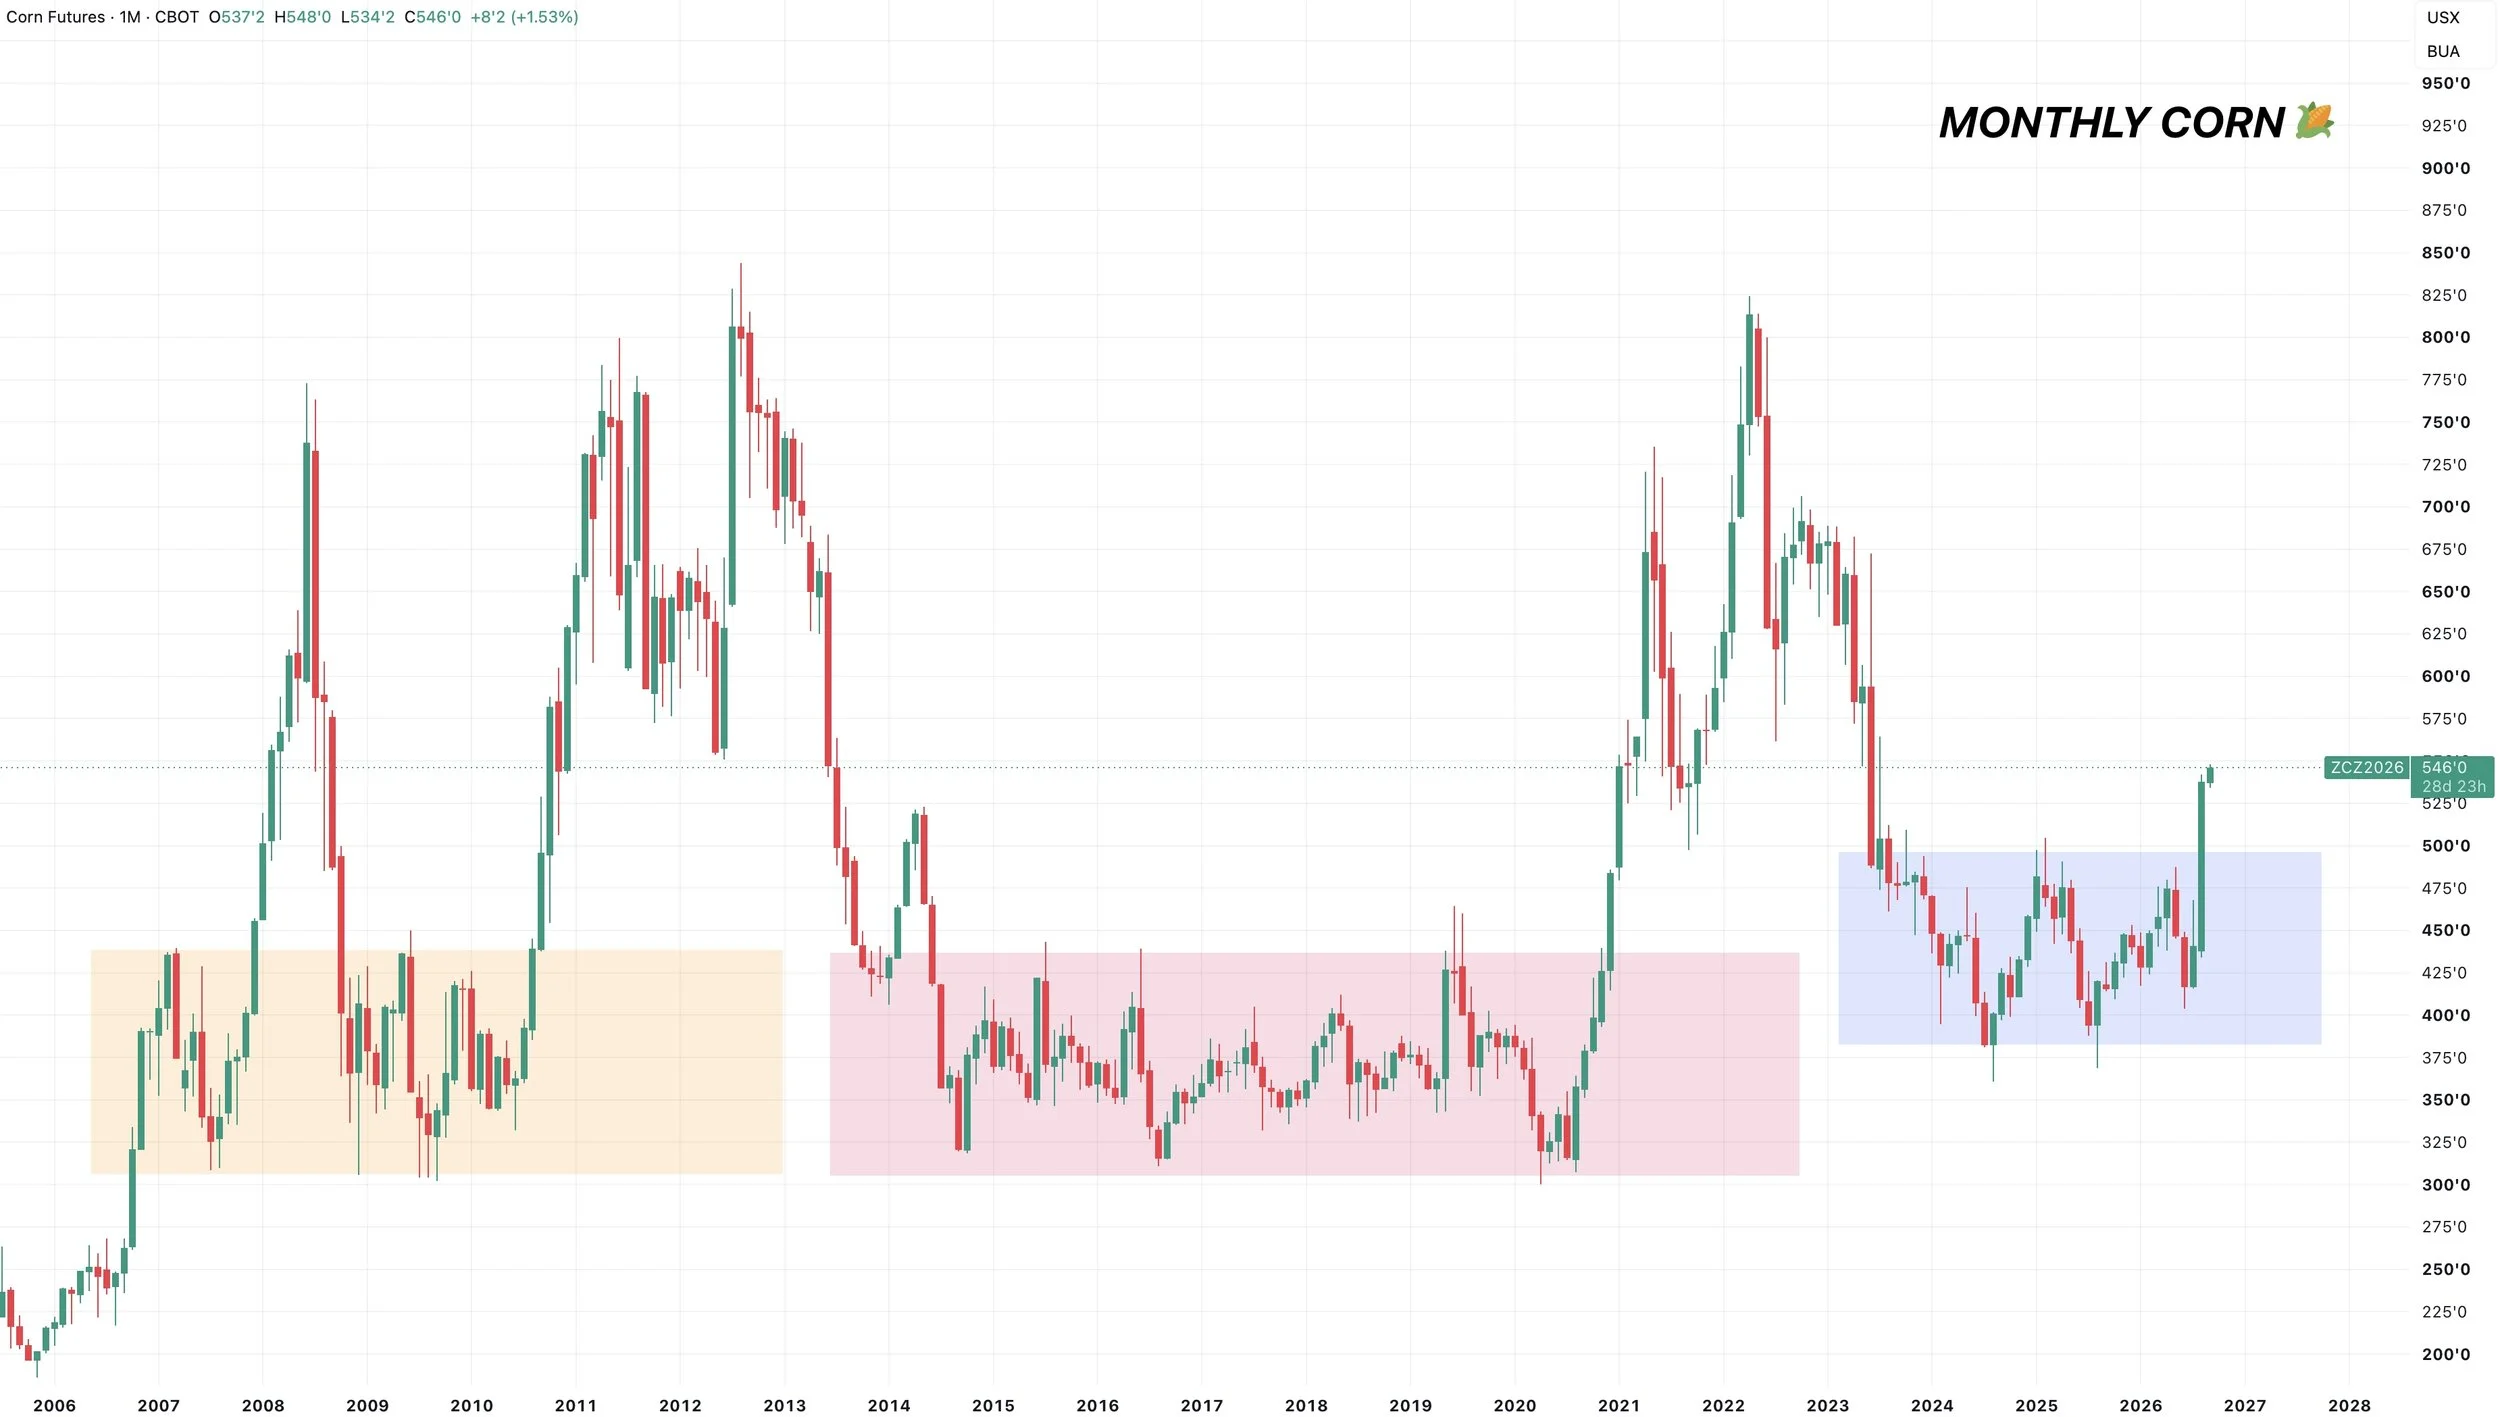
Here is the monthly chart for another perspective.
These are monthly candles, so again this doesn’t mean the grains have to go to those 2022 type of levels tomorrow, but the chart looks great long term.
We had that nice rounded bottom the last two years, which occured right at the previous highs from the last bear market. Turning that old ceiling into the new floor.
Now breaking out. The last few times it broke out, it went quiet a bit higher, towards that red box. So again, could have room to run.
Corn
Dec Corn Chart:
Short term we are getting very close to my first target of $5.50 to $5.56
Which is the golden fib from the contract lows up to those May highs.
We were really close to issuing a corn sell/hedge alert today but did not.
However, this would be an area where we want to consider taking some risk off the table here shortly for those who need to do so.
We could potentially have an alert out tomorrow.
Hitting a target doesn’t mean the rally is over, and doesn’t mean we have to stop here at all. But this would be a common area to see the rally take a breather.
So for those who lack storage or are behind in your marketing, this is where we'd consider doing something.
If you're in a comfortable spot, we don’t mind being patient. As we still think the grains as a whole have plenty of potential long term.
Keep in mind, we do NOT want to get ourselves into an oversold situation at all.
The potential in this market is the best it's been in years. That potential does not "have" to unfold. But I'm making sure we have plenty of bullets in case it does.
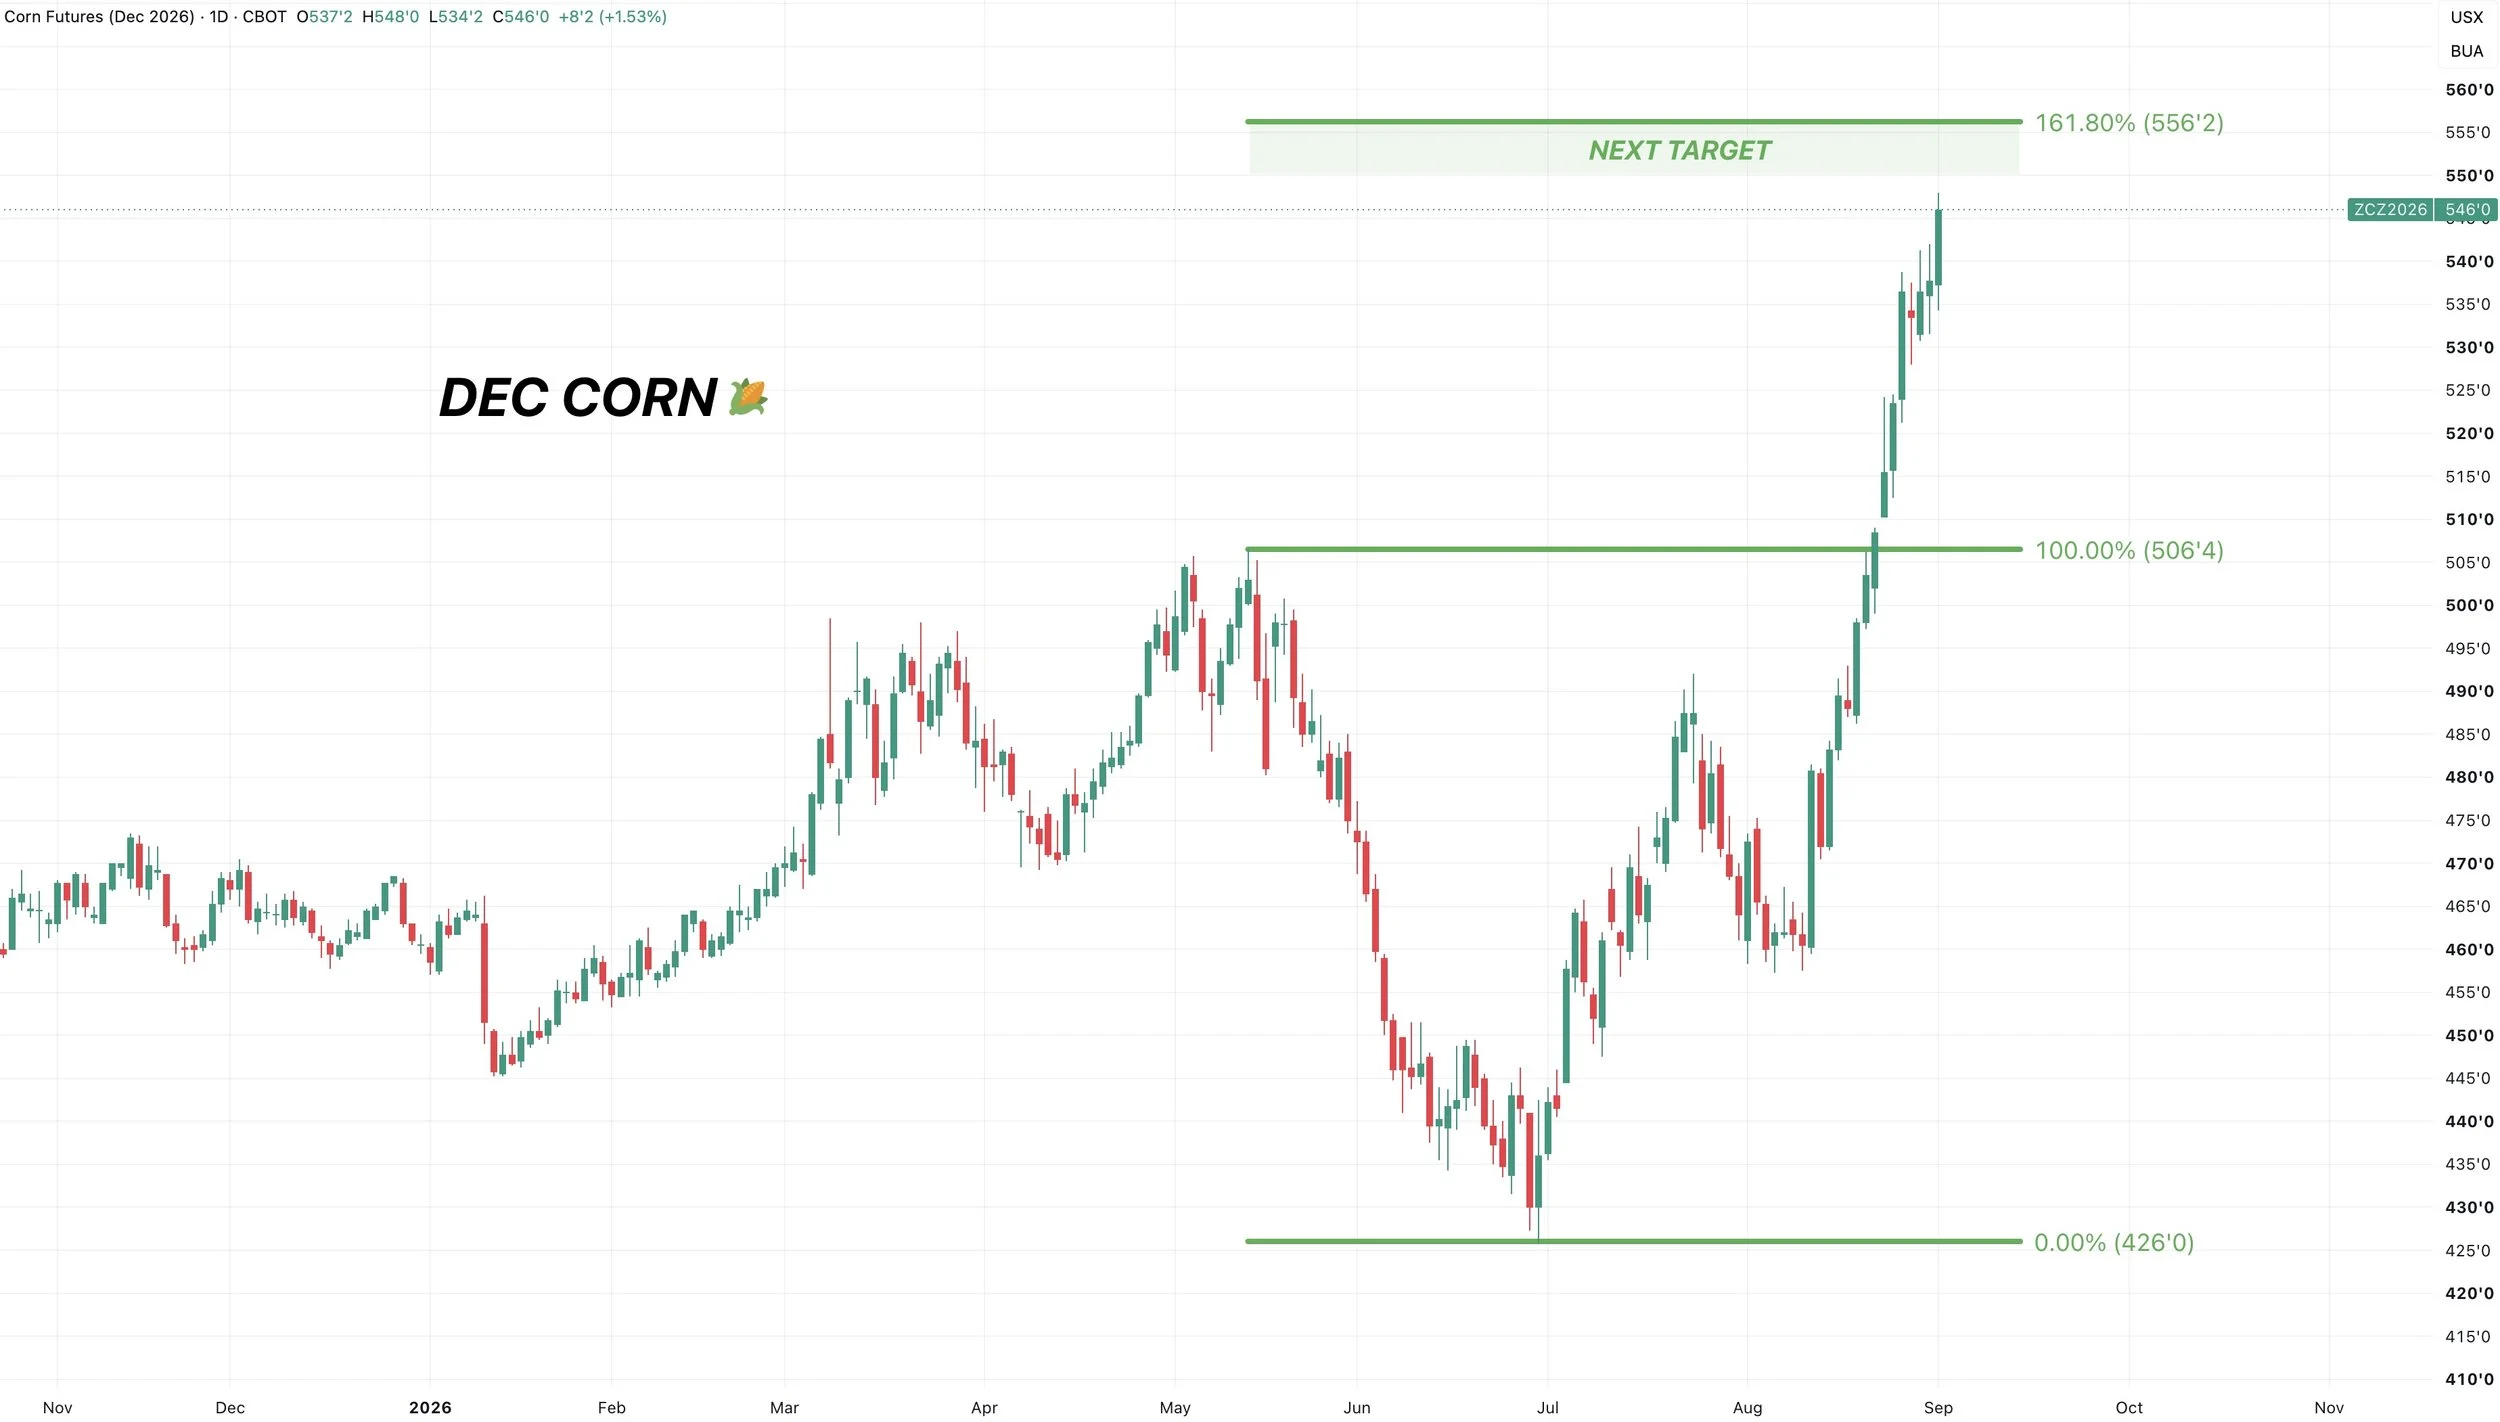
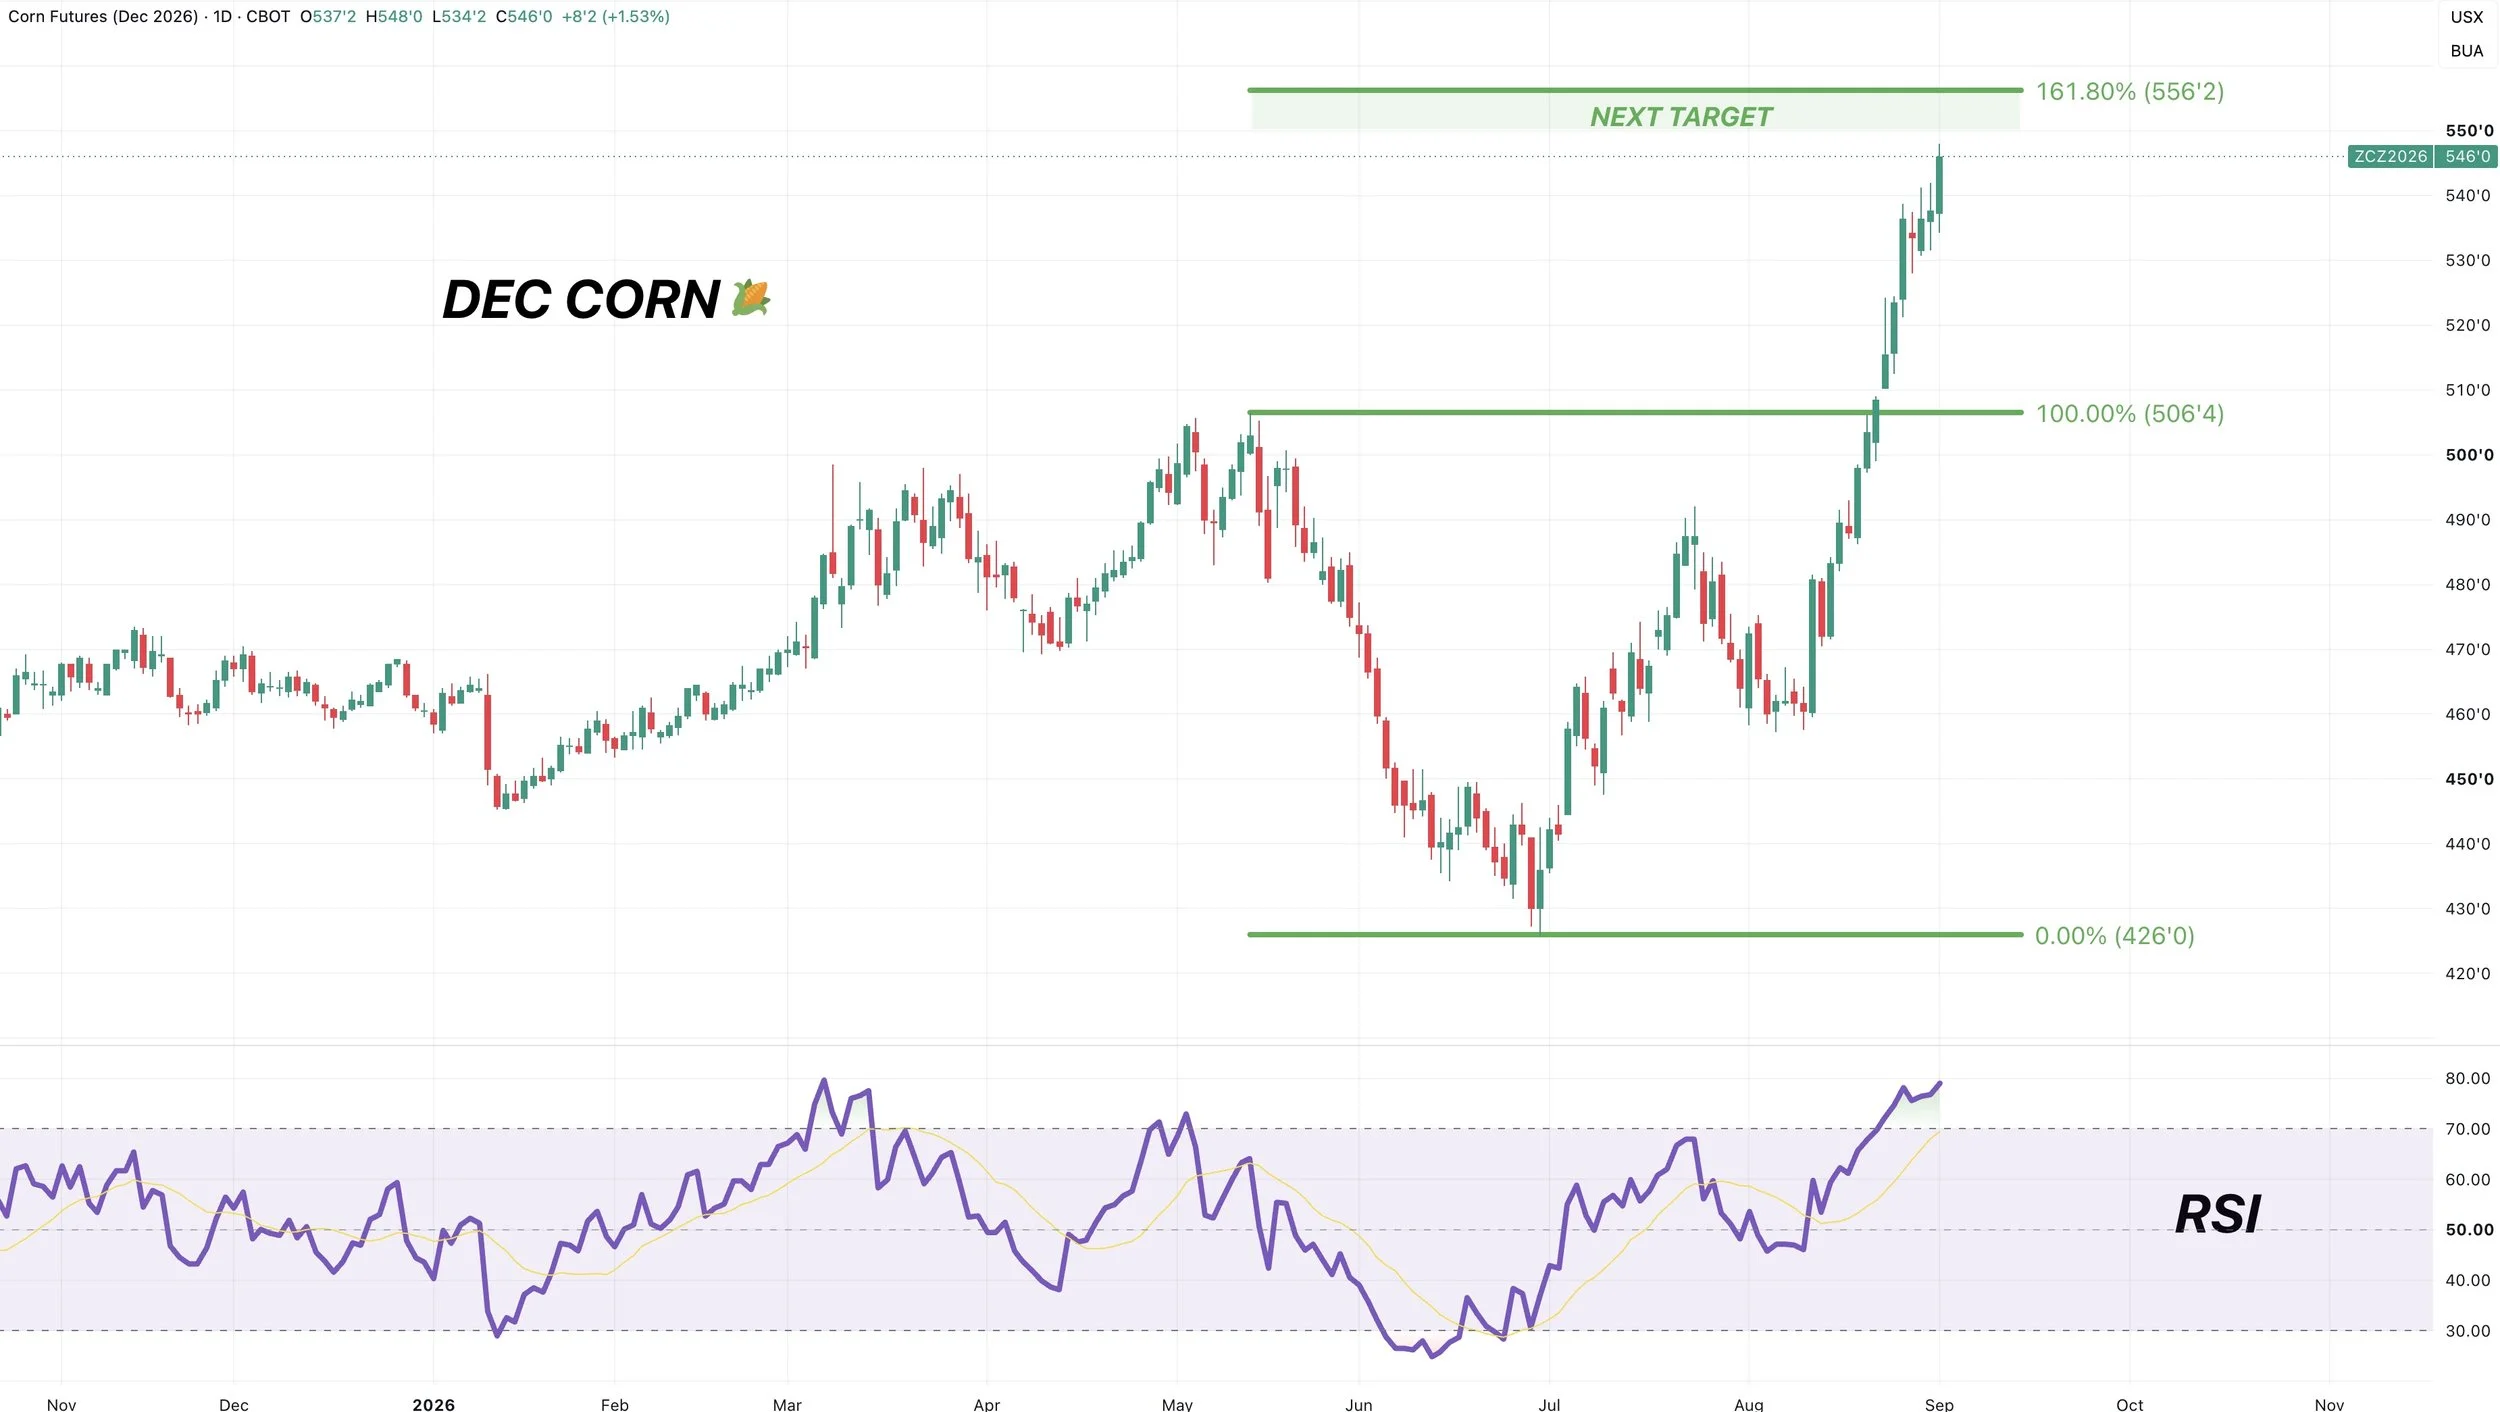
We are starting to get pretty overextended here.
As the RSI is getting close to hitting the most overbought levels it's seen.
Again, doesn’t mean we can’t continue higher. But seeing a pullback and having this rally catch it's breathe would not be a surprise.
As we've gone straight up for +90 cents. We’ve only had 3 red days since the Aug USDA.
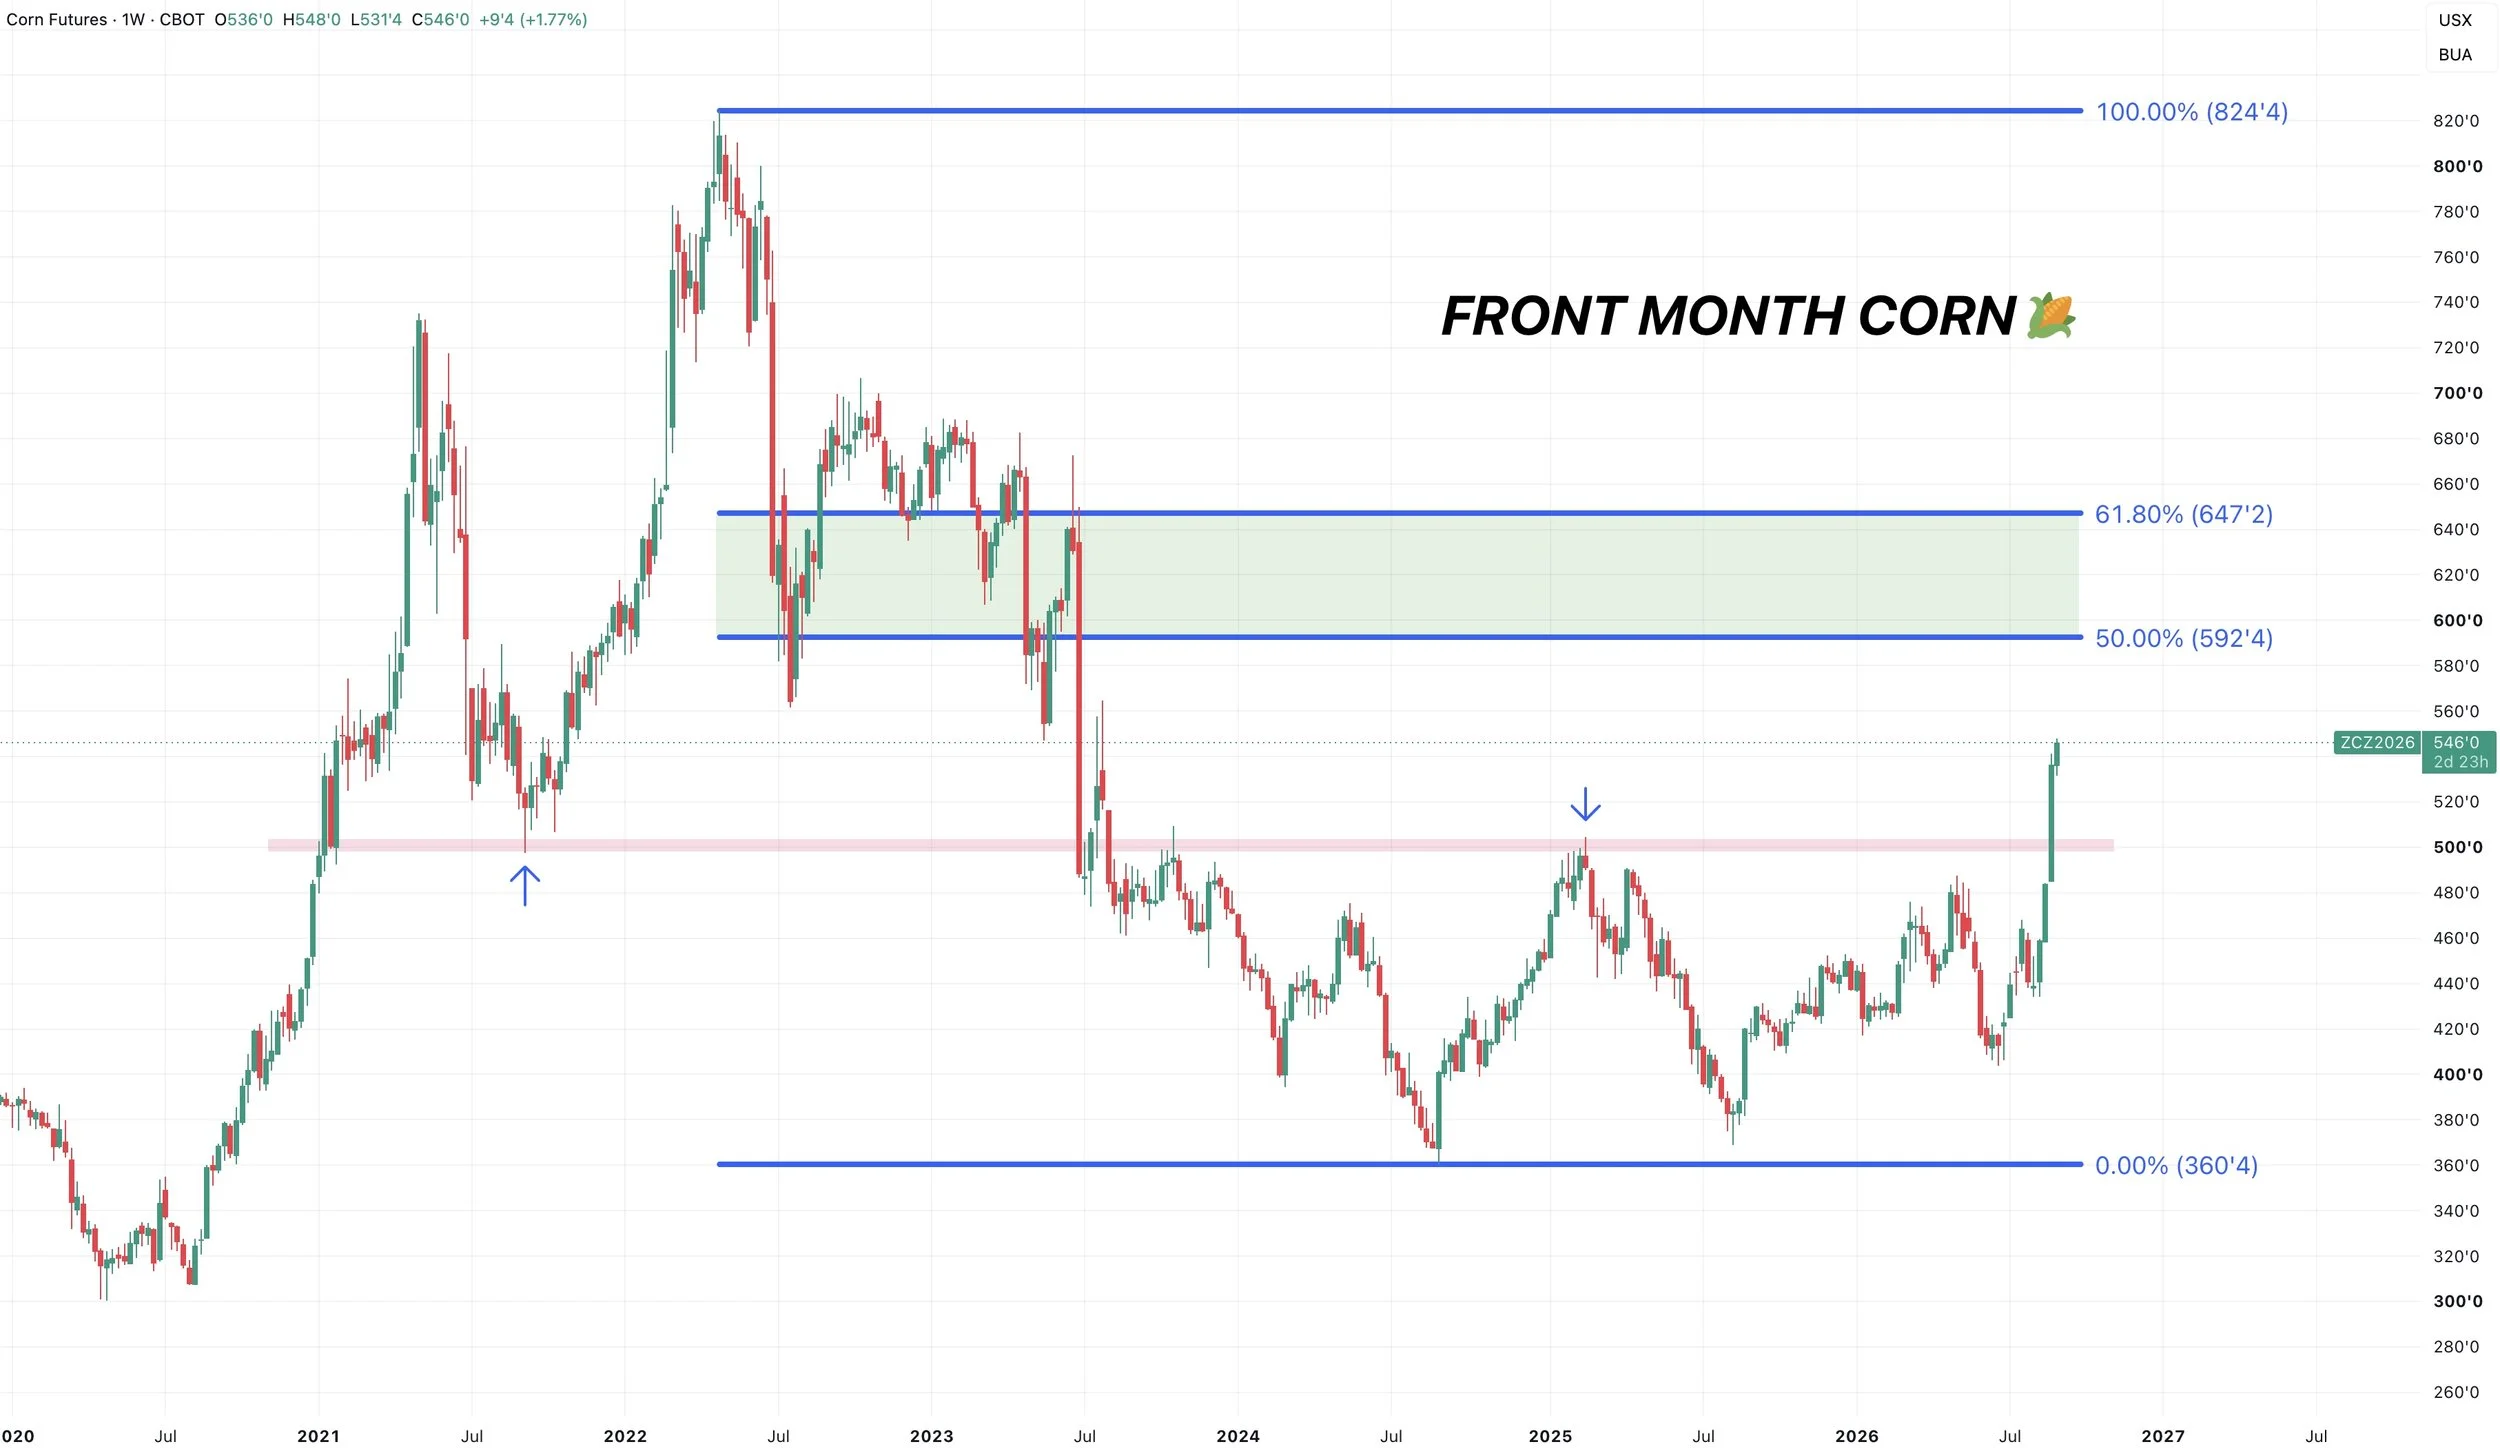
Weekly Chart: Breakout
This chart looks amazing.
We broke key resistance. Those highs from 2025 and the lows from 2021.
Posting our very first higher low and higher high of the entire bear market. Finally breaking out of this sideways range we've been in for 3 years.
That seems important. So the long term structure of this chart has definitely shifted higher.
This doesn’t mean there won’t be set backs along the way, but the stucture looks promising long term.
If you took some retracements from the 2024 lows of $3.60 up to the 2022 highs of $8.24. The 50% to 61.8% levels come in at $5.92 to $6.47
Monthly Chart: Another Breakout
I already showed this chart. But this one is breaking out as well.
Corn likes to consolidate in roughly a $1.00 range. Which we've been doing since 2023.
We've now received our first breakout of a range since 2020.
This of course doesn’t mean corn definitively has to go to $6 to $7 but this chart is not bearish at all and offers plenty of upside potential.
Soybeans
Disclaimer: there is risk of loss trading futures and options. Past performance does not necessarily indicate future results. This is our opinion and should be treated as such.
Today's Sell & Hedge Alert:
We did issue a sell signal and hedge alert for soybeans today.
If you missed it: Click Here
As almost all of our signals have been this year, this was mostly geared towards those who: lack storage, have to move stuff off the combine, or are behind in their marketing.
This is a spot where we like to get caught up or get some protection.
If you're in a comfortable spot, we do not want to get carried away with sales or get ourselves oversold. As we see further potential.
What could you consider?
We always prefer to use options as it gives you the most flexibility in your marketing.
If you don’t like using options, then we'd just consider a small incremental sale.
If you have a hedge account, here are a few routes you could consider:
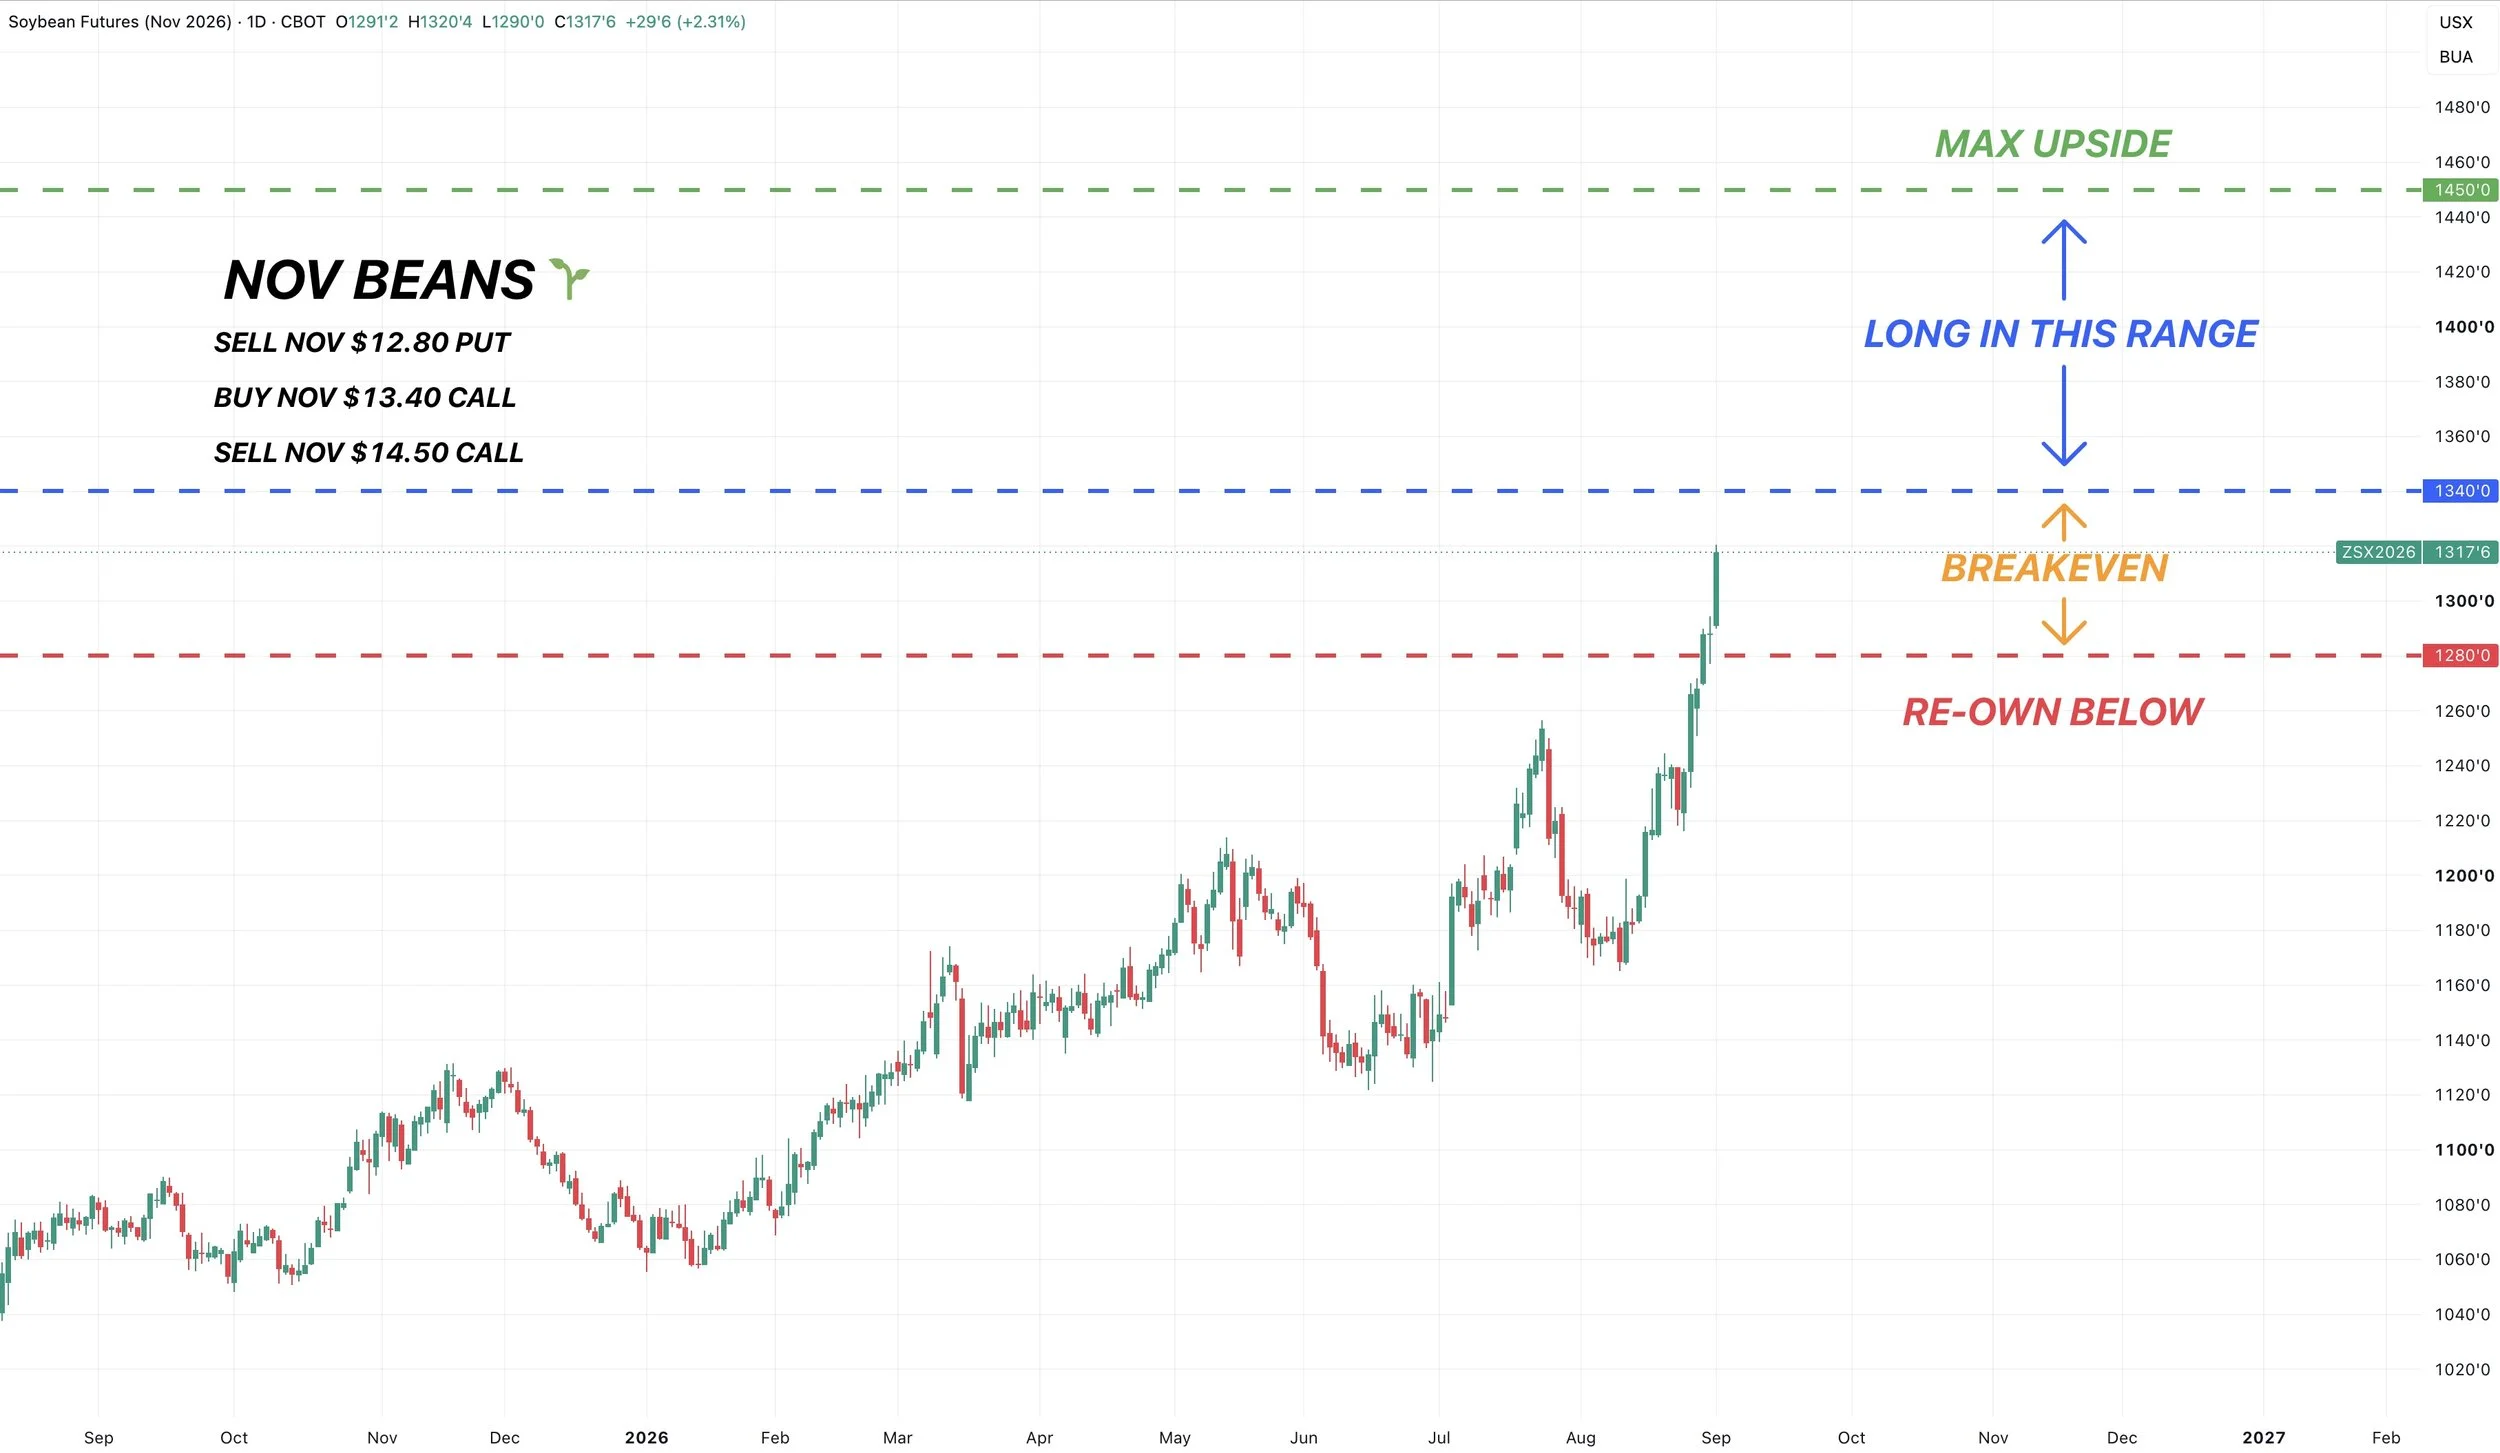
1) Cash Sale & Re-Own
If you make a sale and would like to keep your upside open, this would be one possible strategy to look at.
Sell Nov $12.80 put
Buy Nov $13.40 call
Sell Nov $14.50 call
This would give you a max upside of $14.50, in exchange you could re-own soybeans on the board at $12.80. This would be roughly a zero cost trade, but selling options does require margin.
Here is a visual on how the trade would work at expiration.
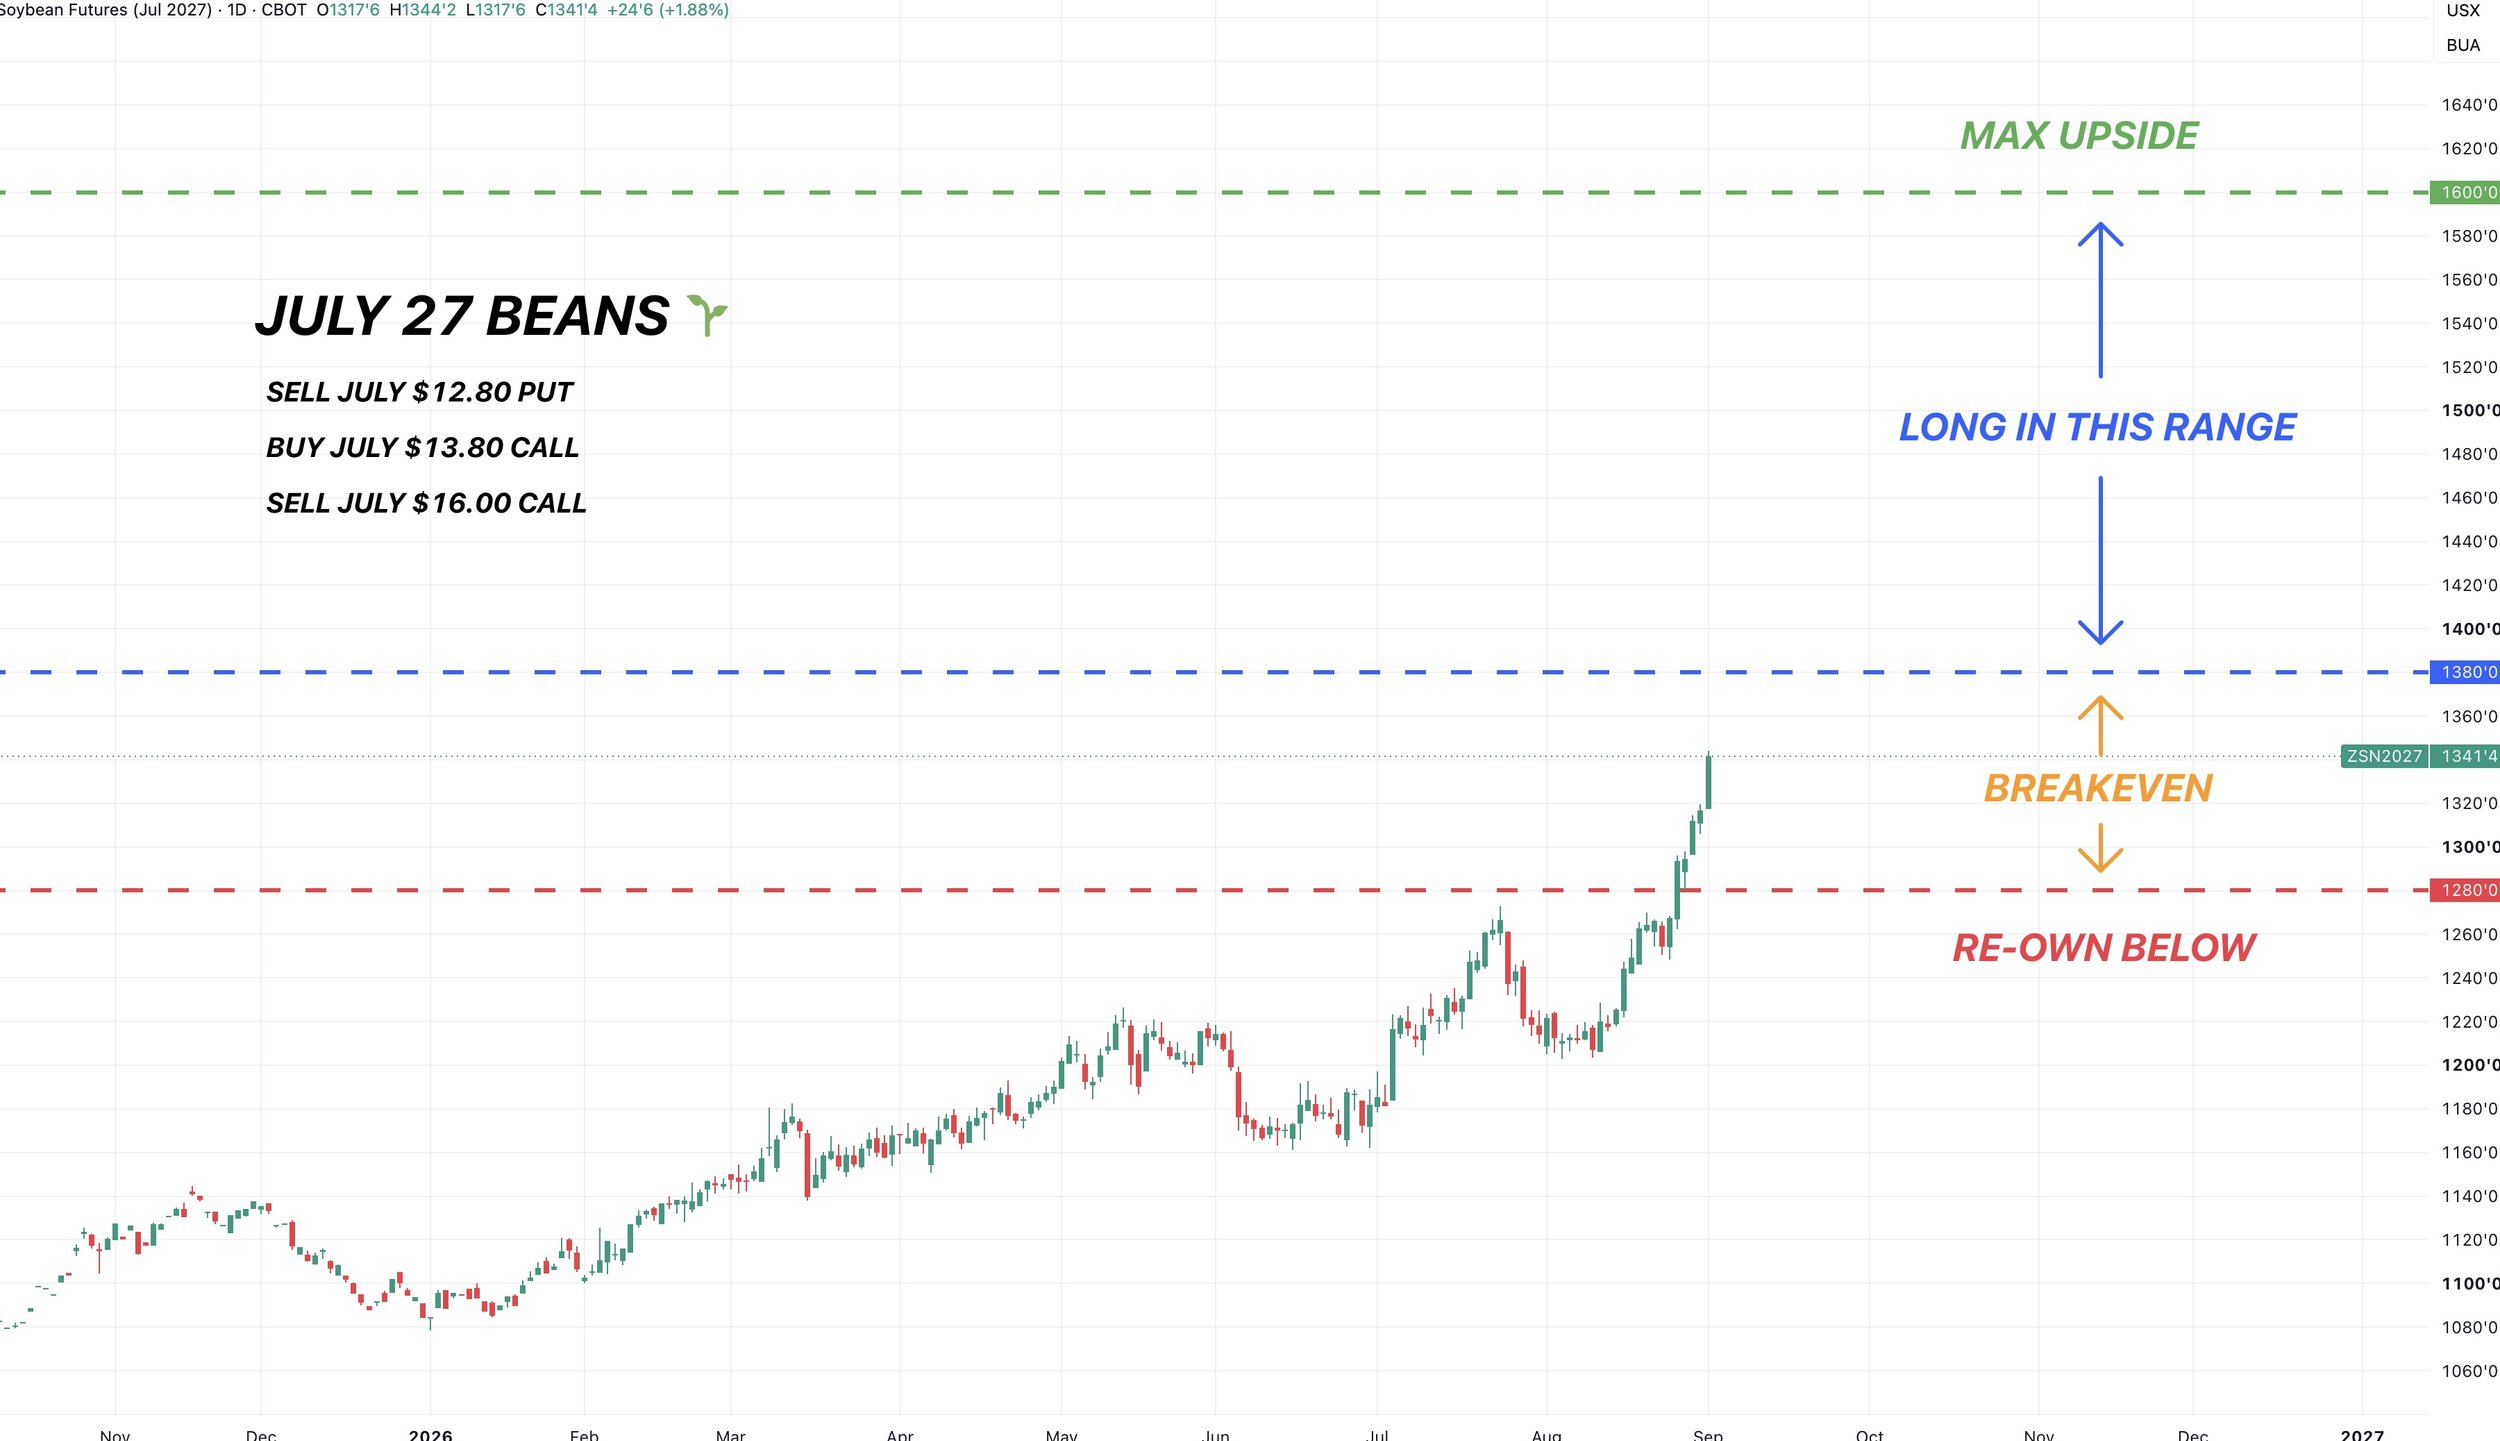
Another strategy you could consider is:
Sell July $12.80 put
Buy July $13.80 call
Sell July $16.00 call
This would give you upside until $16. In exchange, you could re-own July beans 60 cents lower than we are today. This would also be about a zero cost trade but would require margin.
Here is a visual of that one.
2) No Sale & Downside Protection
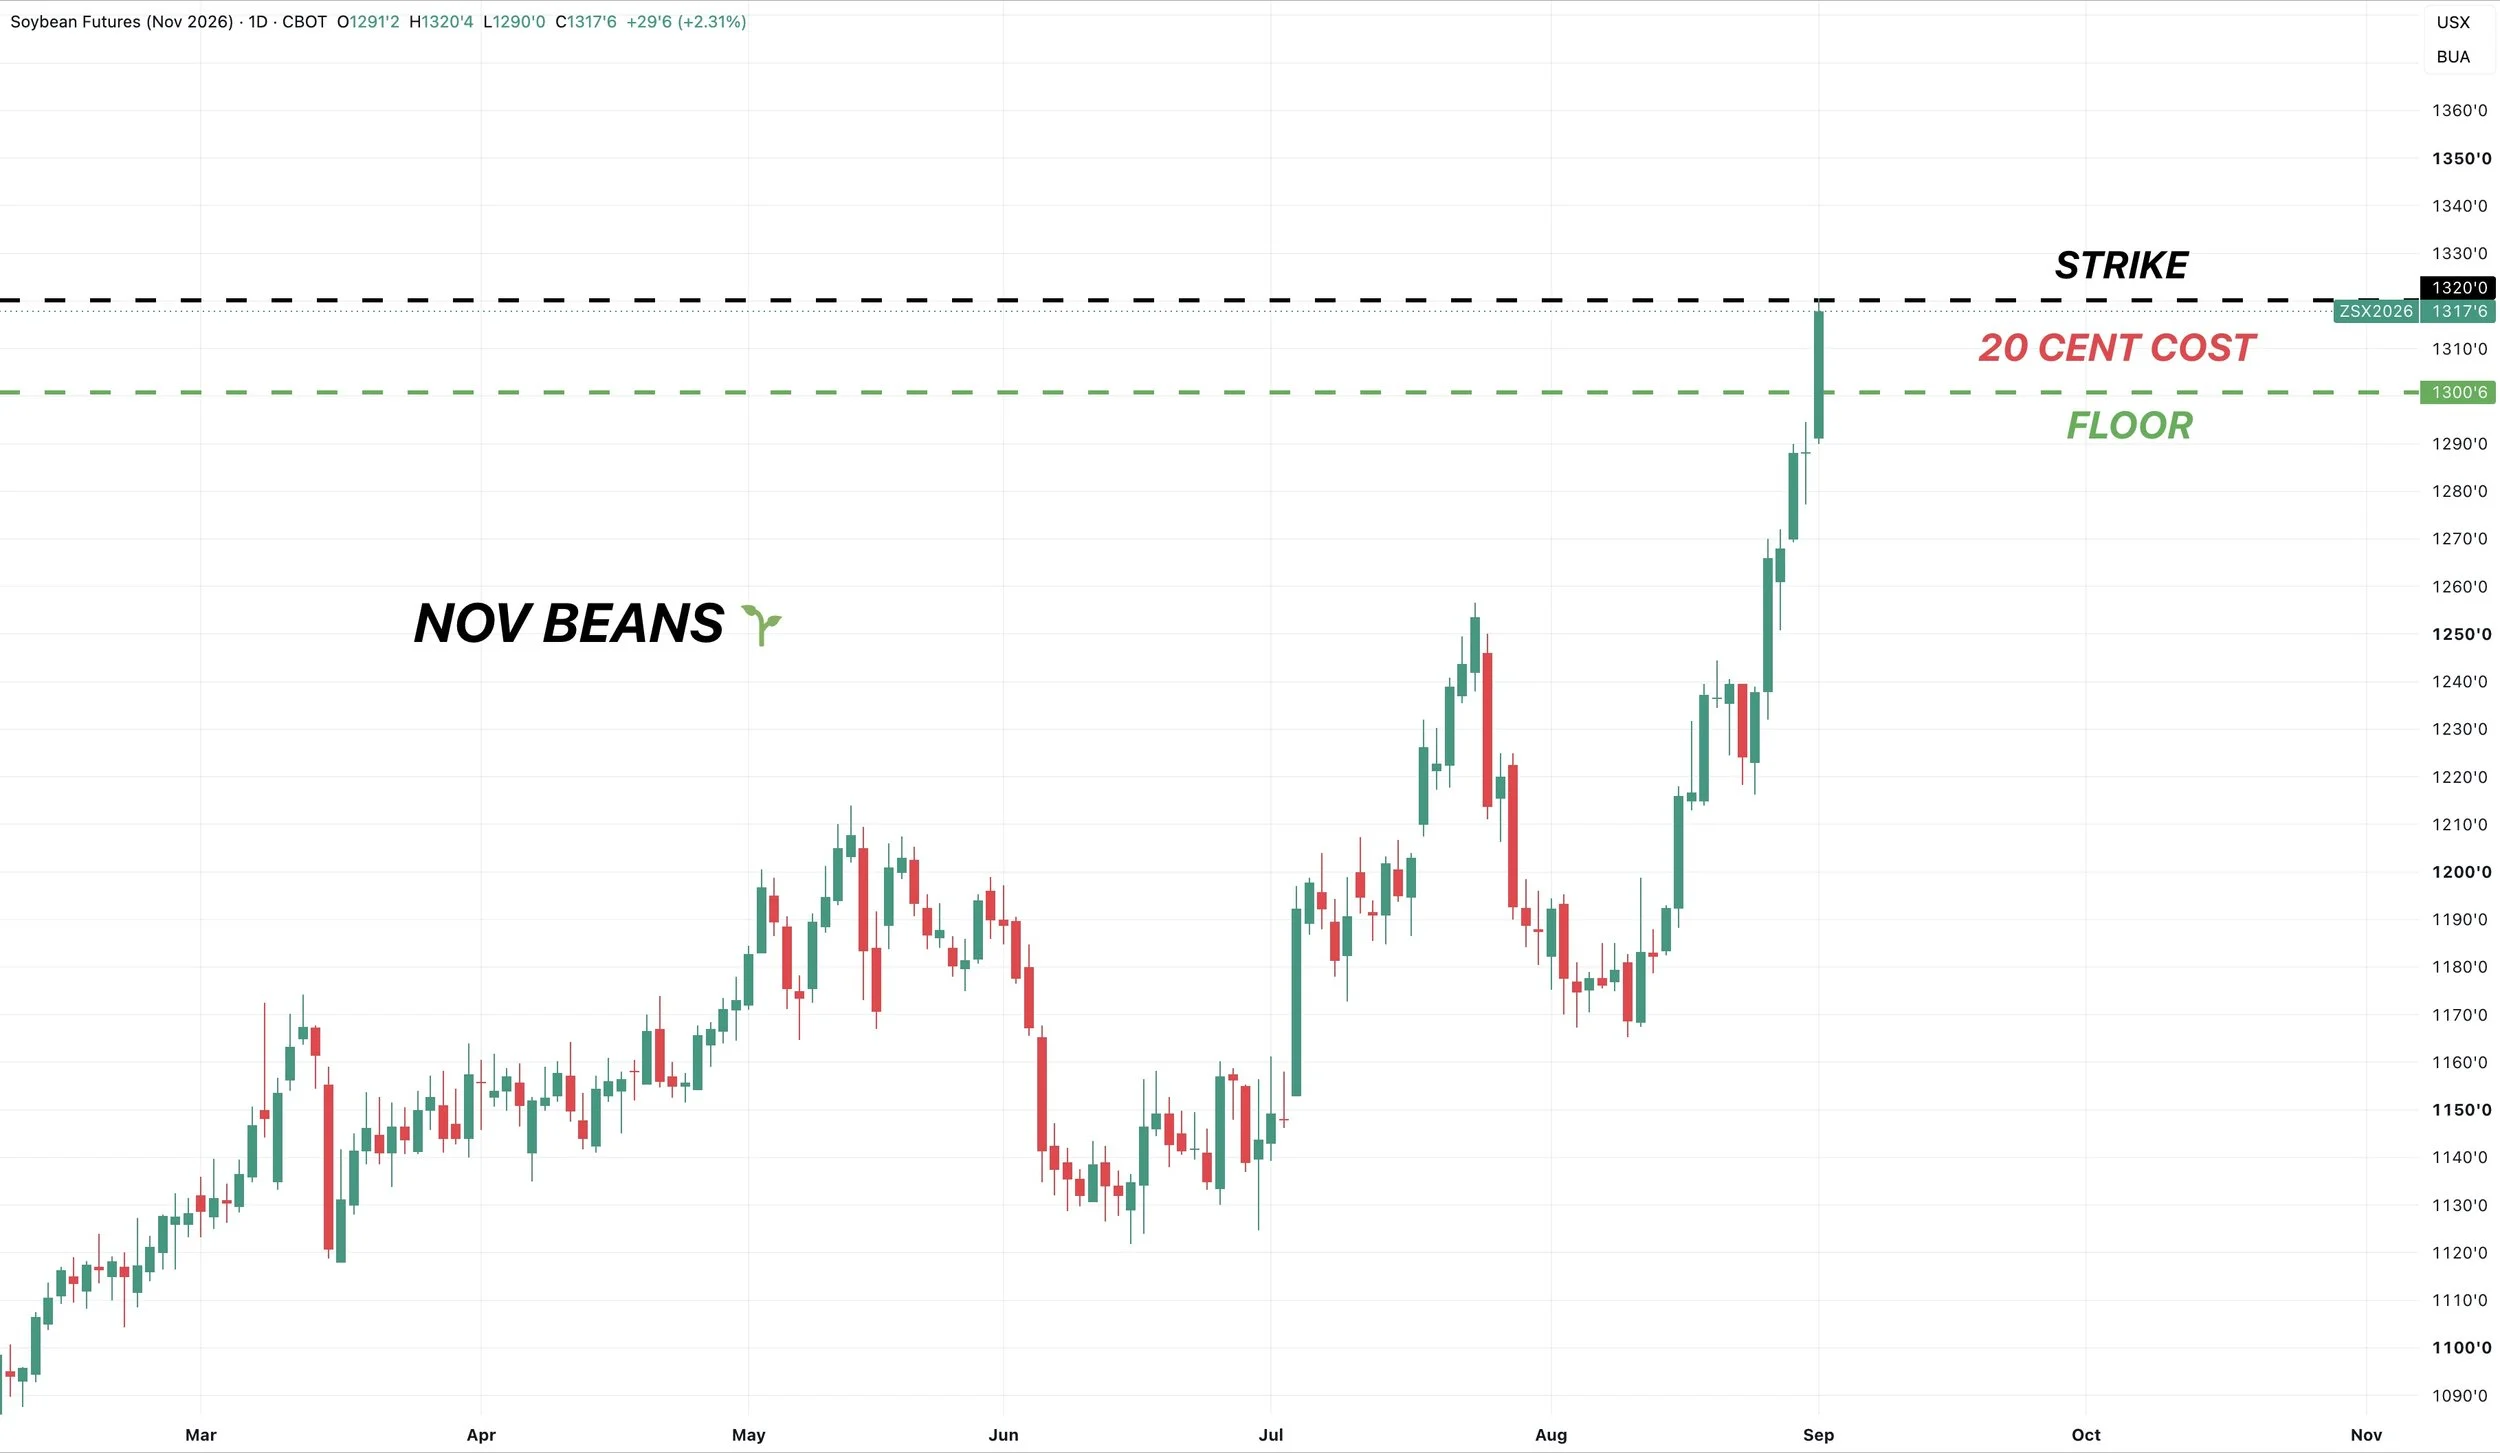
Instead of making a sale and re-owning, another route you could take is simply grabbing some downside protection if you prefer not to make a sale.
We want to ride this market up as much as possible. But instead of spending a bunch of money on a long term floor we would much rather have a short term floor.
For example the July $13.40 puts cost 75 cents which is a ton.
On the other hand, a $13.00 put that expires in 10 days cost around 11 cents.
Or the $13.20 puts that expire in 10 days cost around 20 cents. Which would you a floor of $13.00 until that USDA report.
There are a thousand ways to manage your risk, if you'd like to discuss what might make most sense for you please reach out anytime.
Office: (806)484-1214
Why the alert?
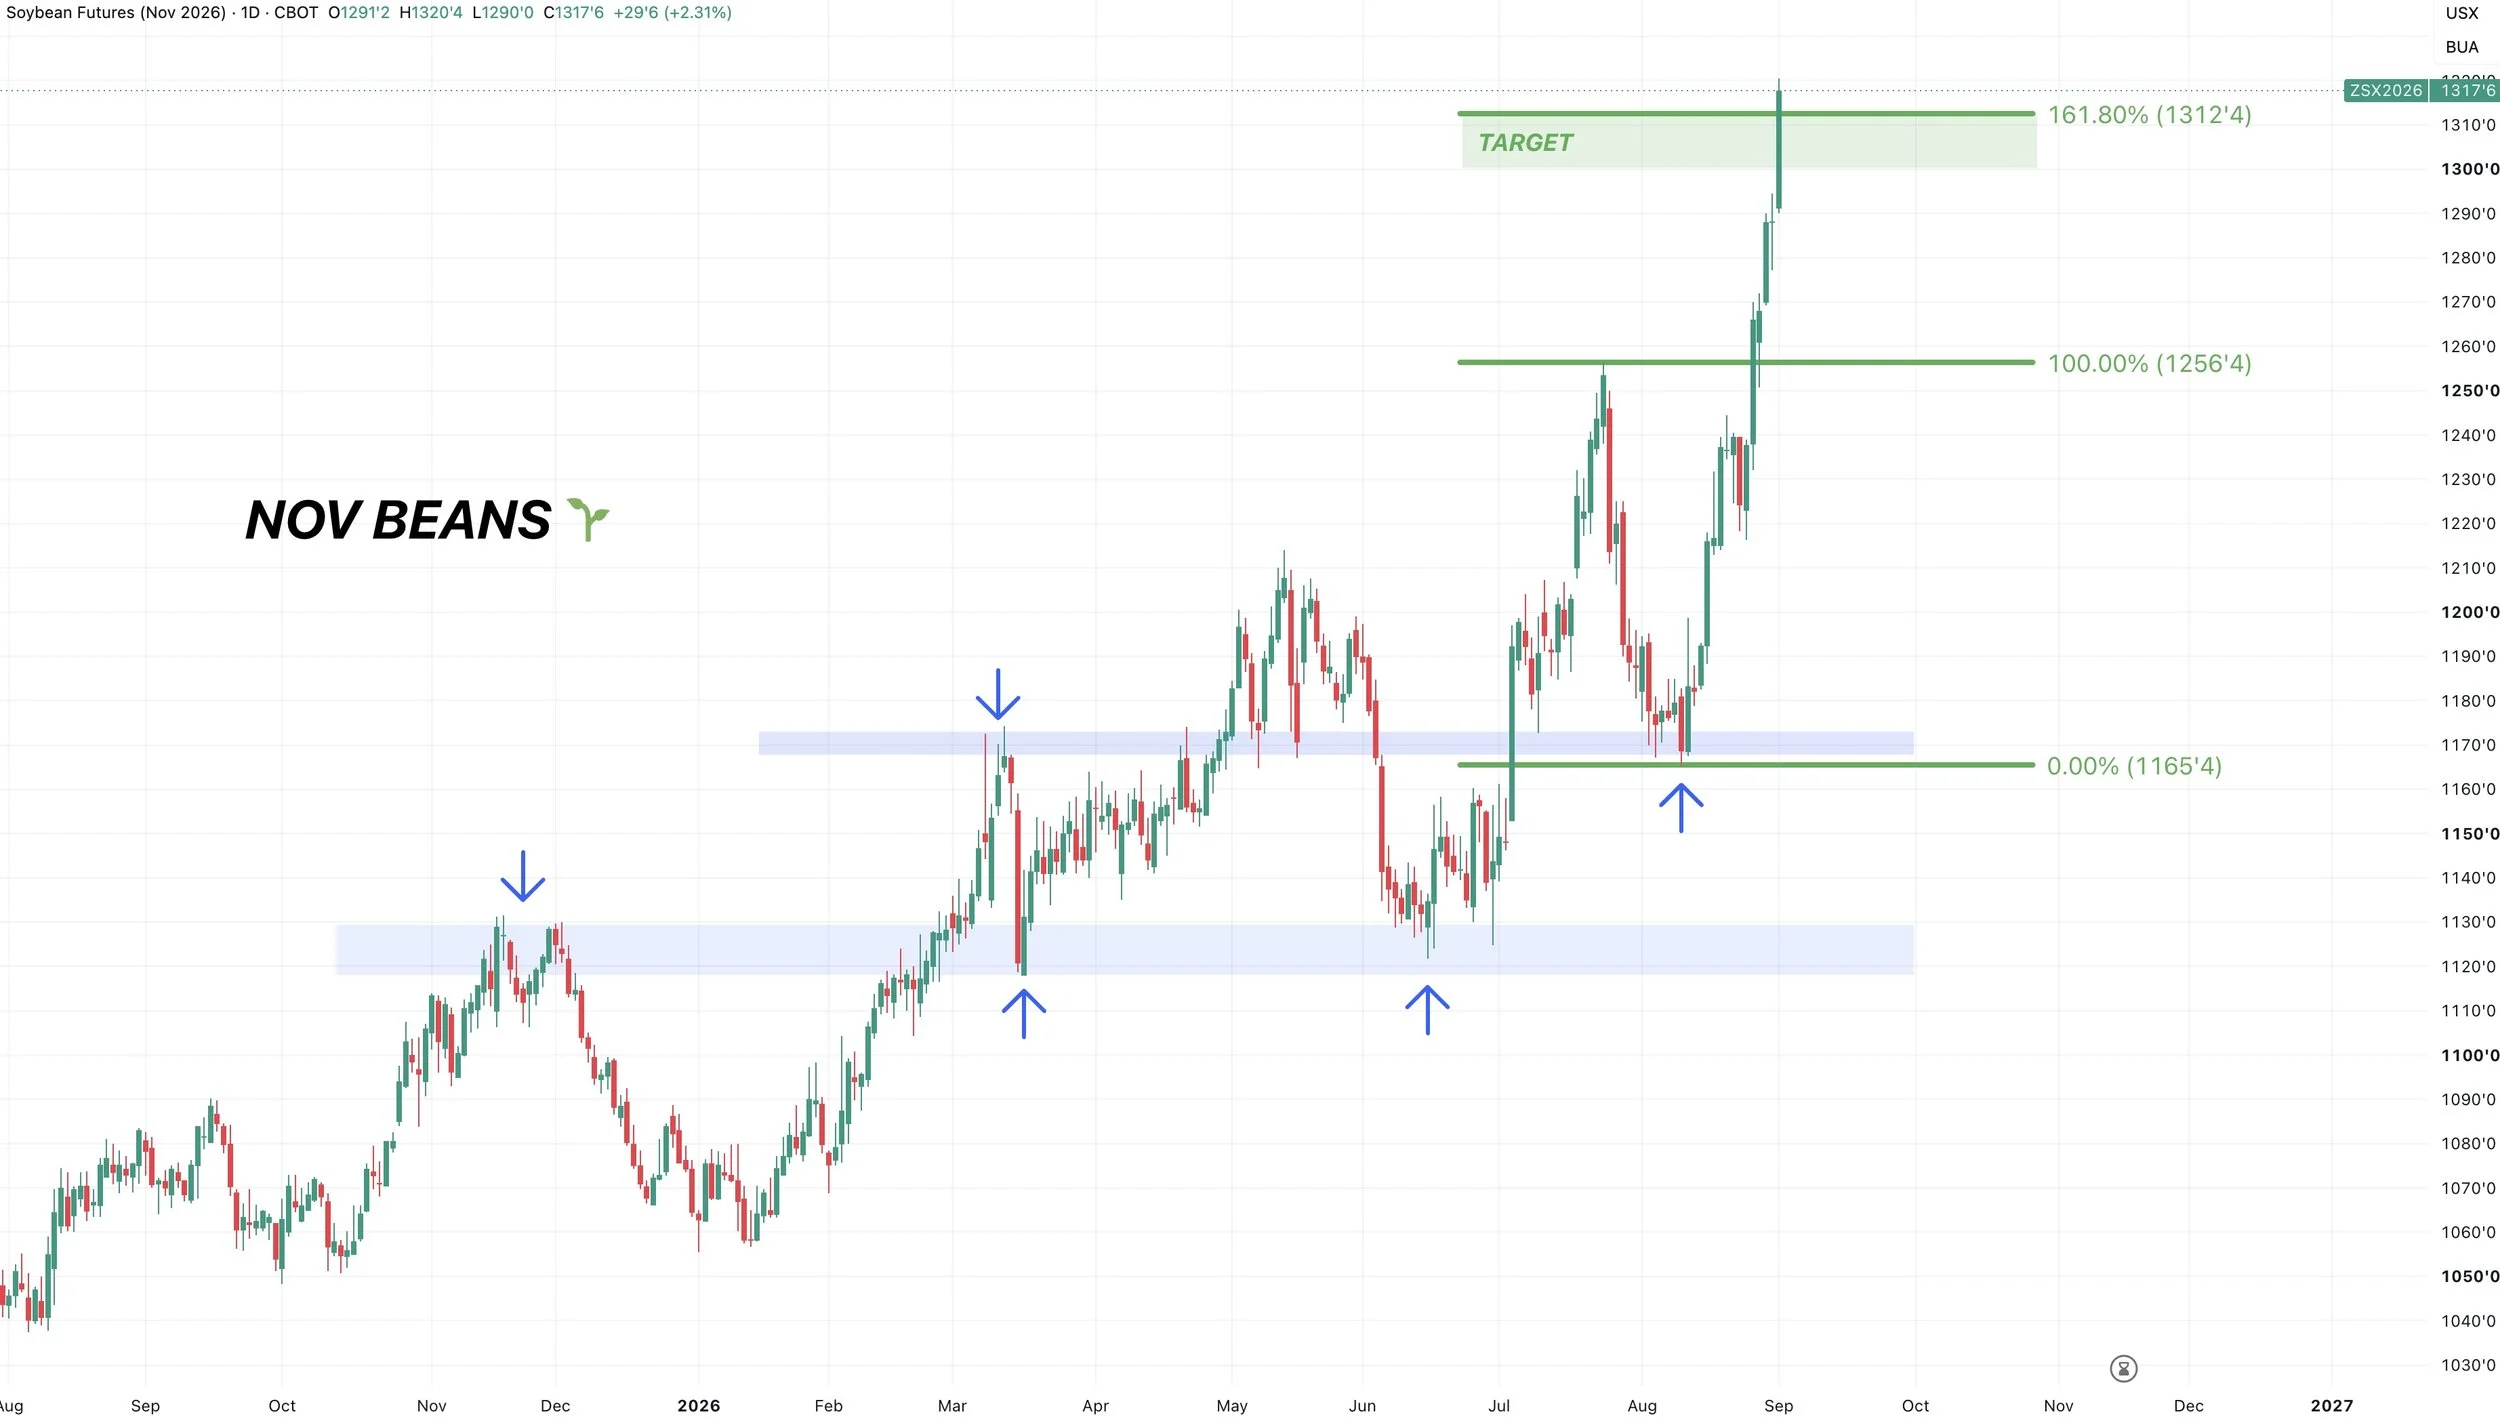
Nov Beans Chart:
The main reason for the alert was that we hit our next target we've had for the last month or so.
The golden fib. Which is the 161.8% retracement from the August lows up to the July highs.
This is a common continuation target.
It of course doesn’t mean we can’t keep running, but short term this would be a point of interest and where a pullback wouldn’t be surprising.
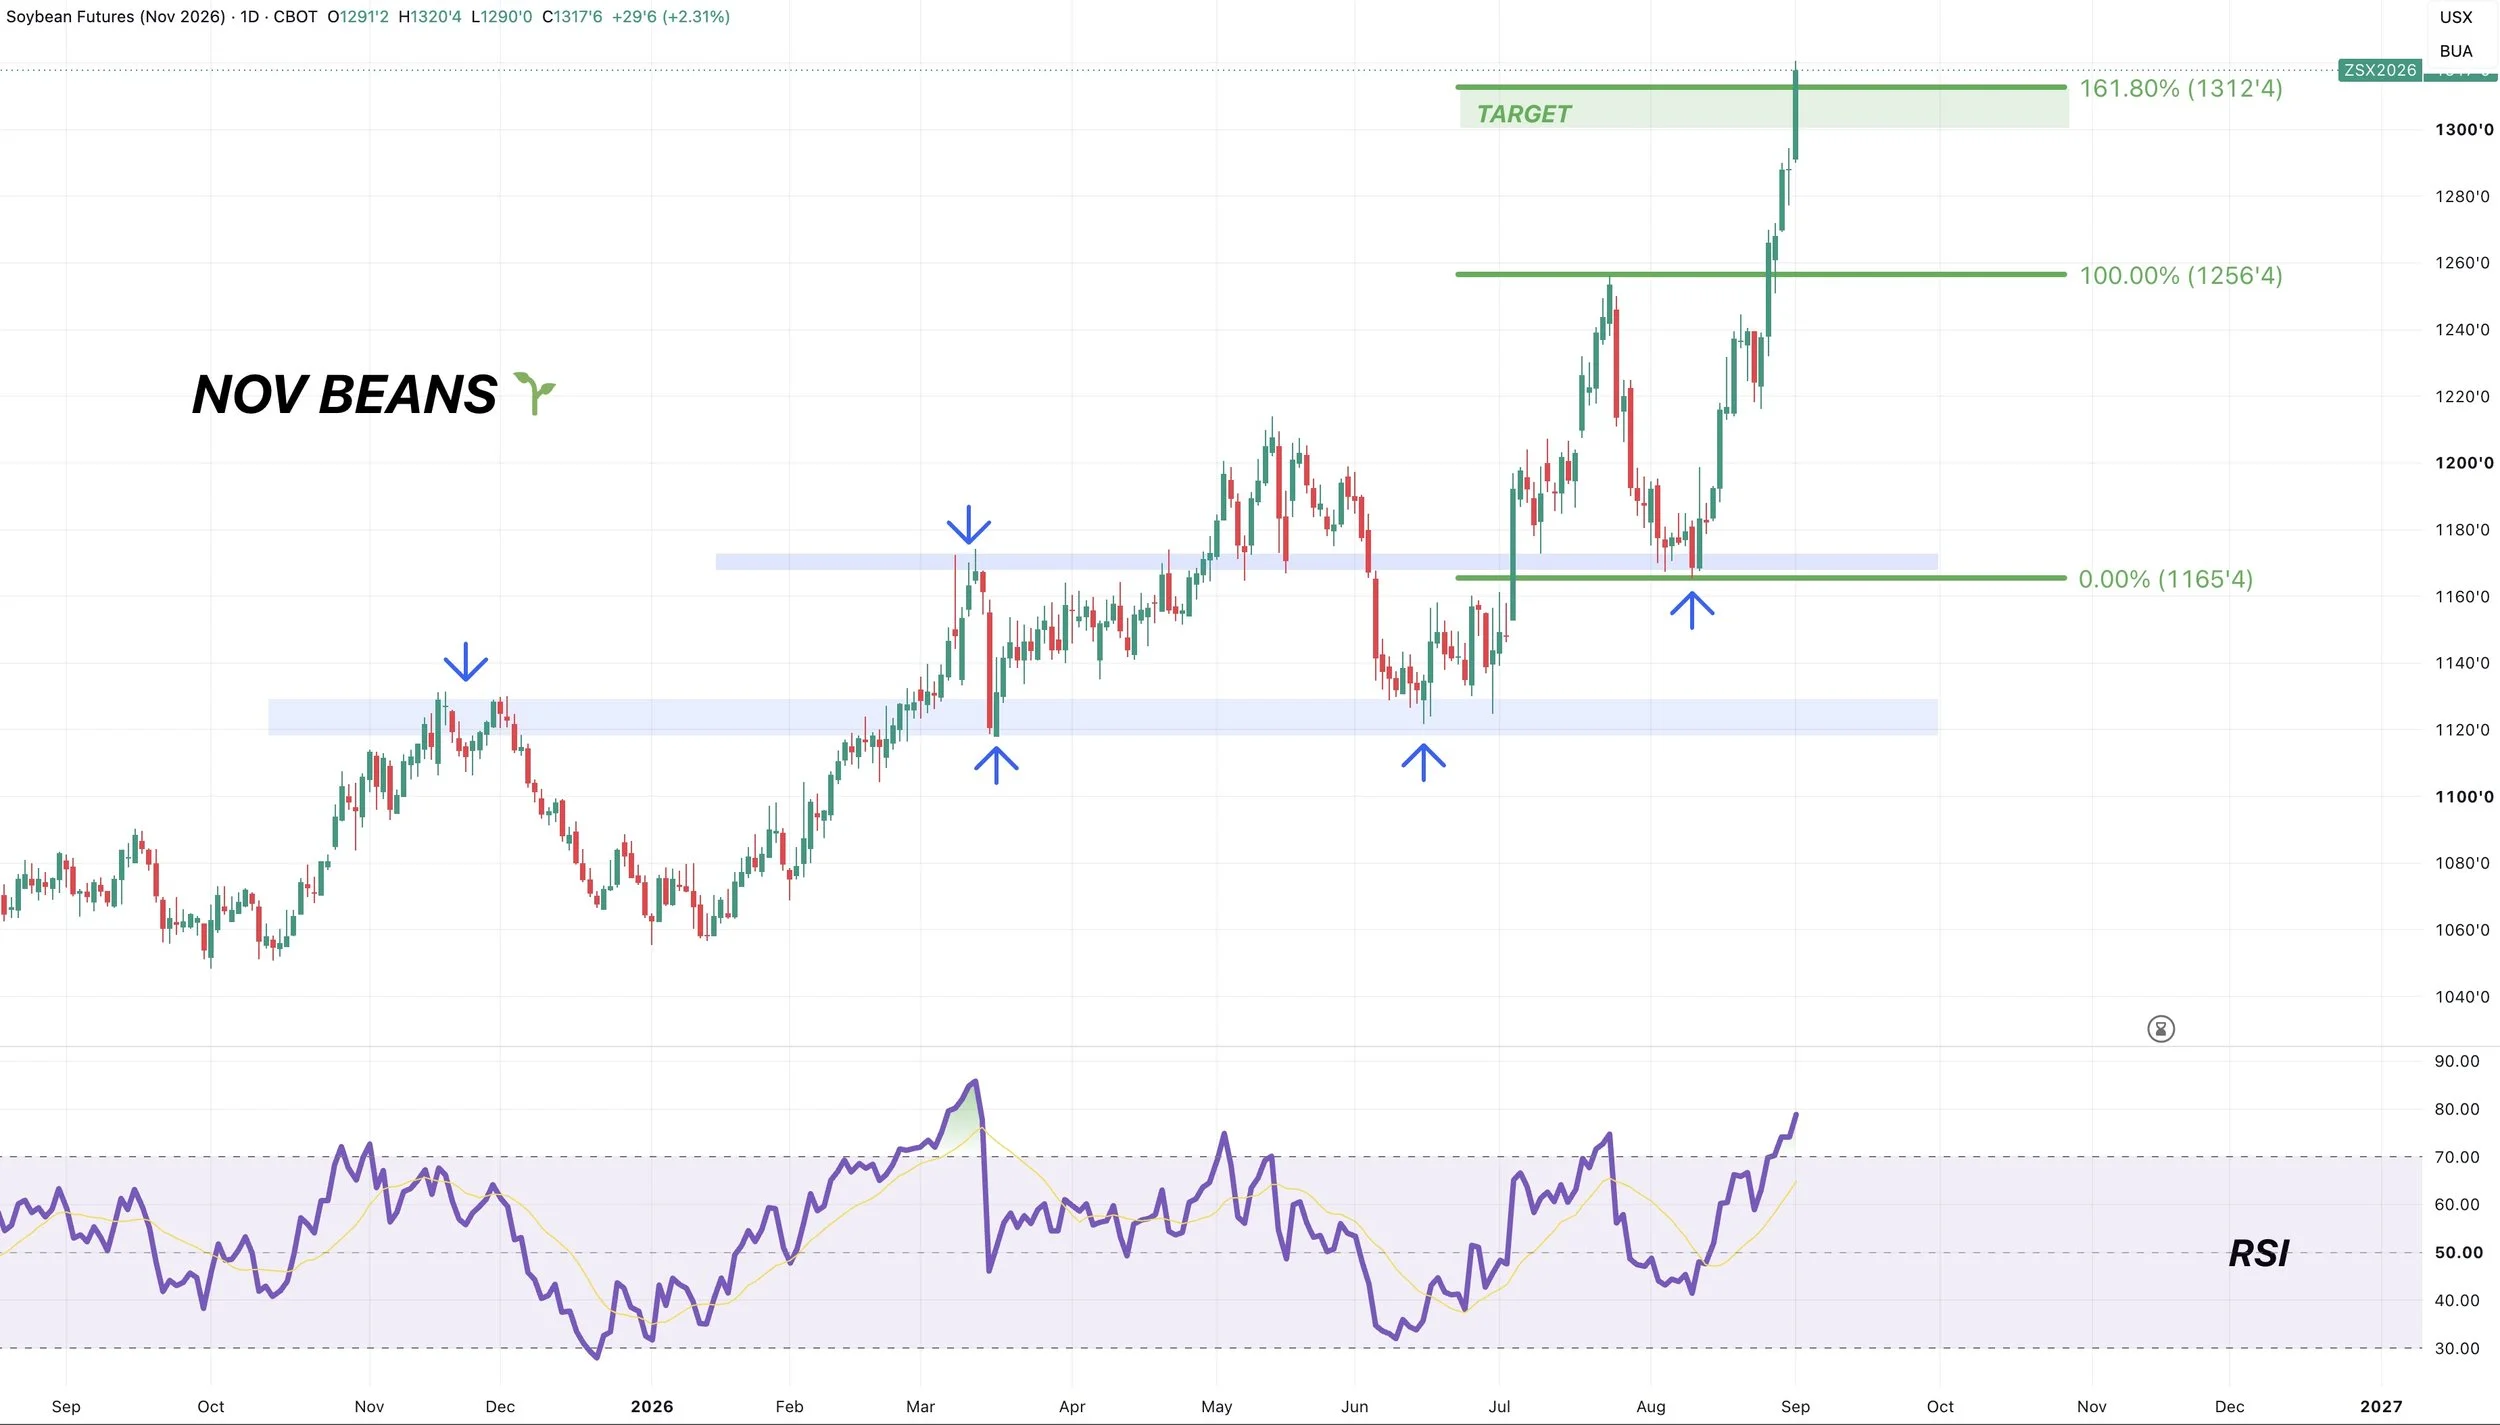
We are also starting to get pretty overbought in soybeans as well.
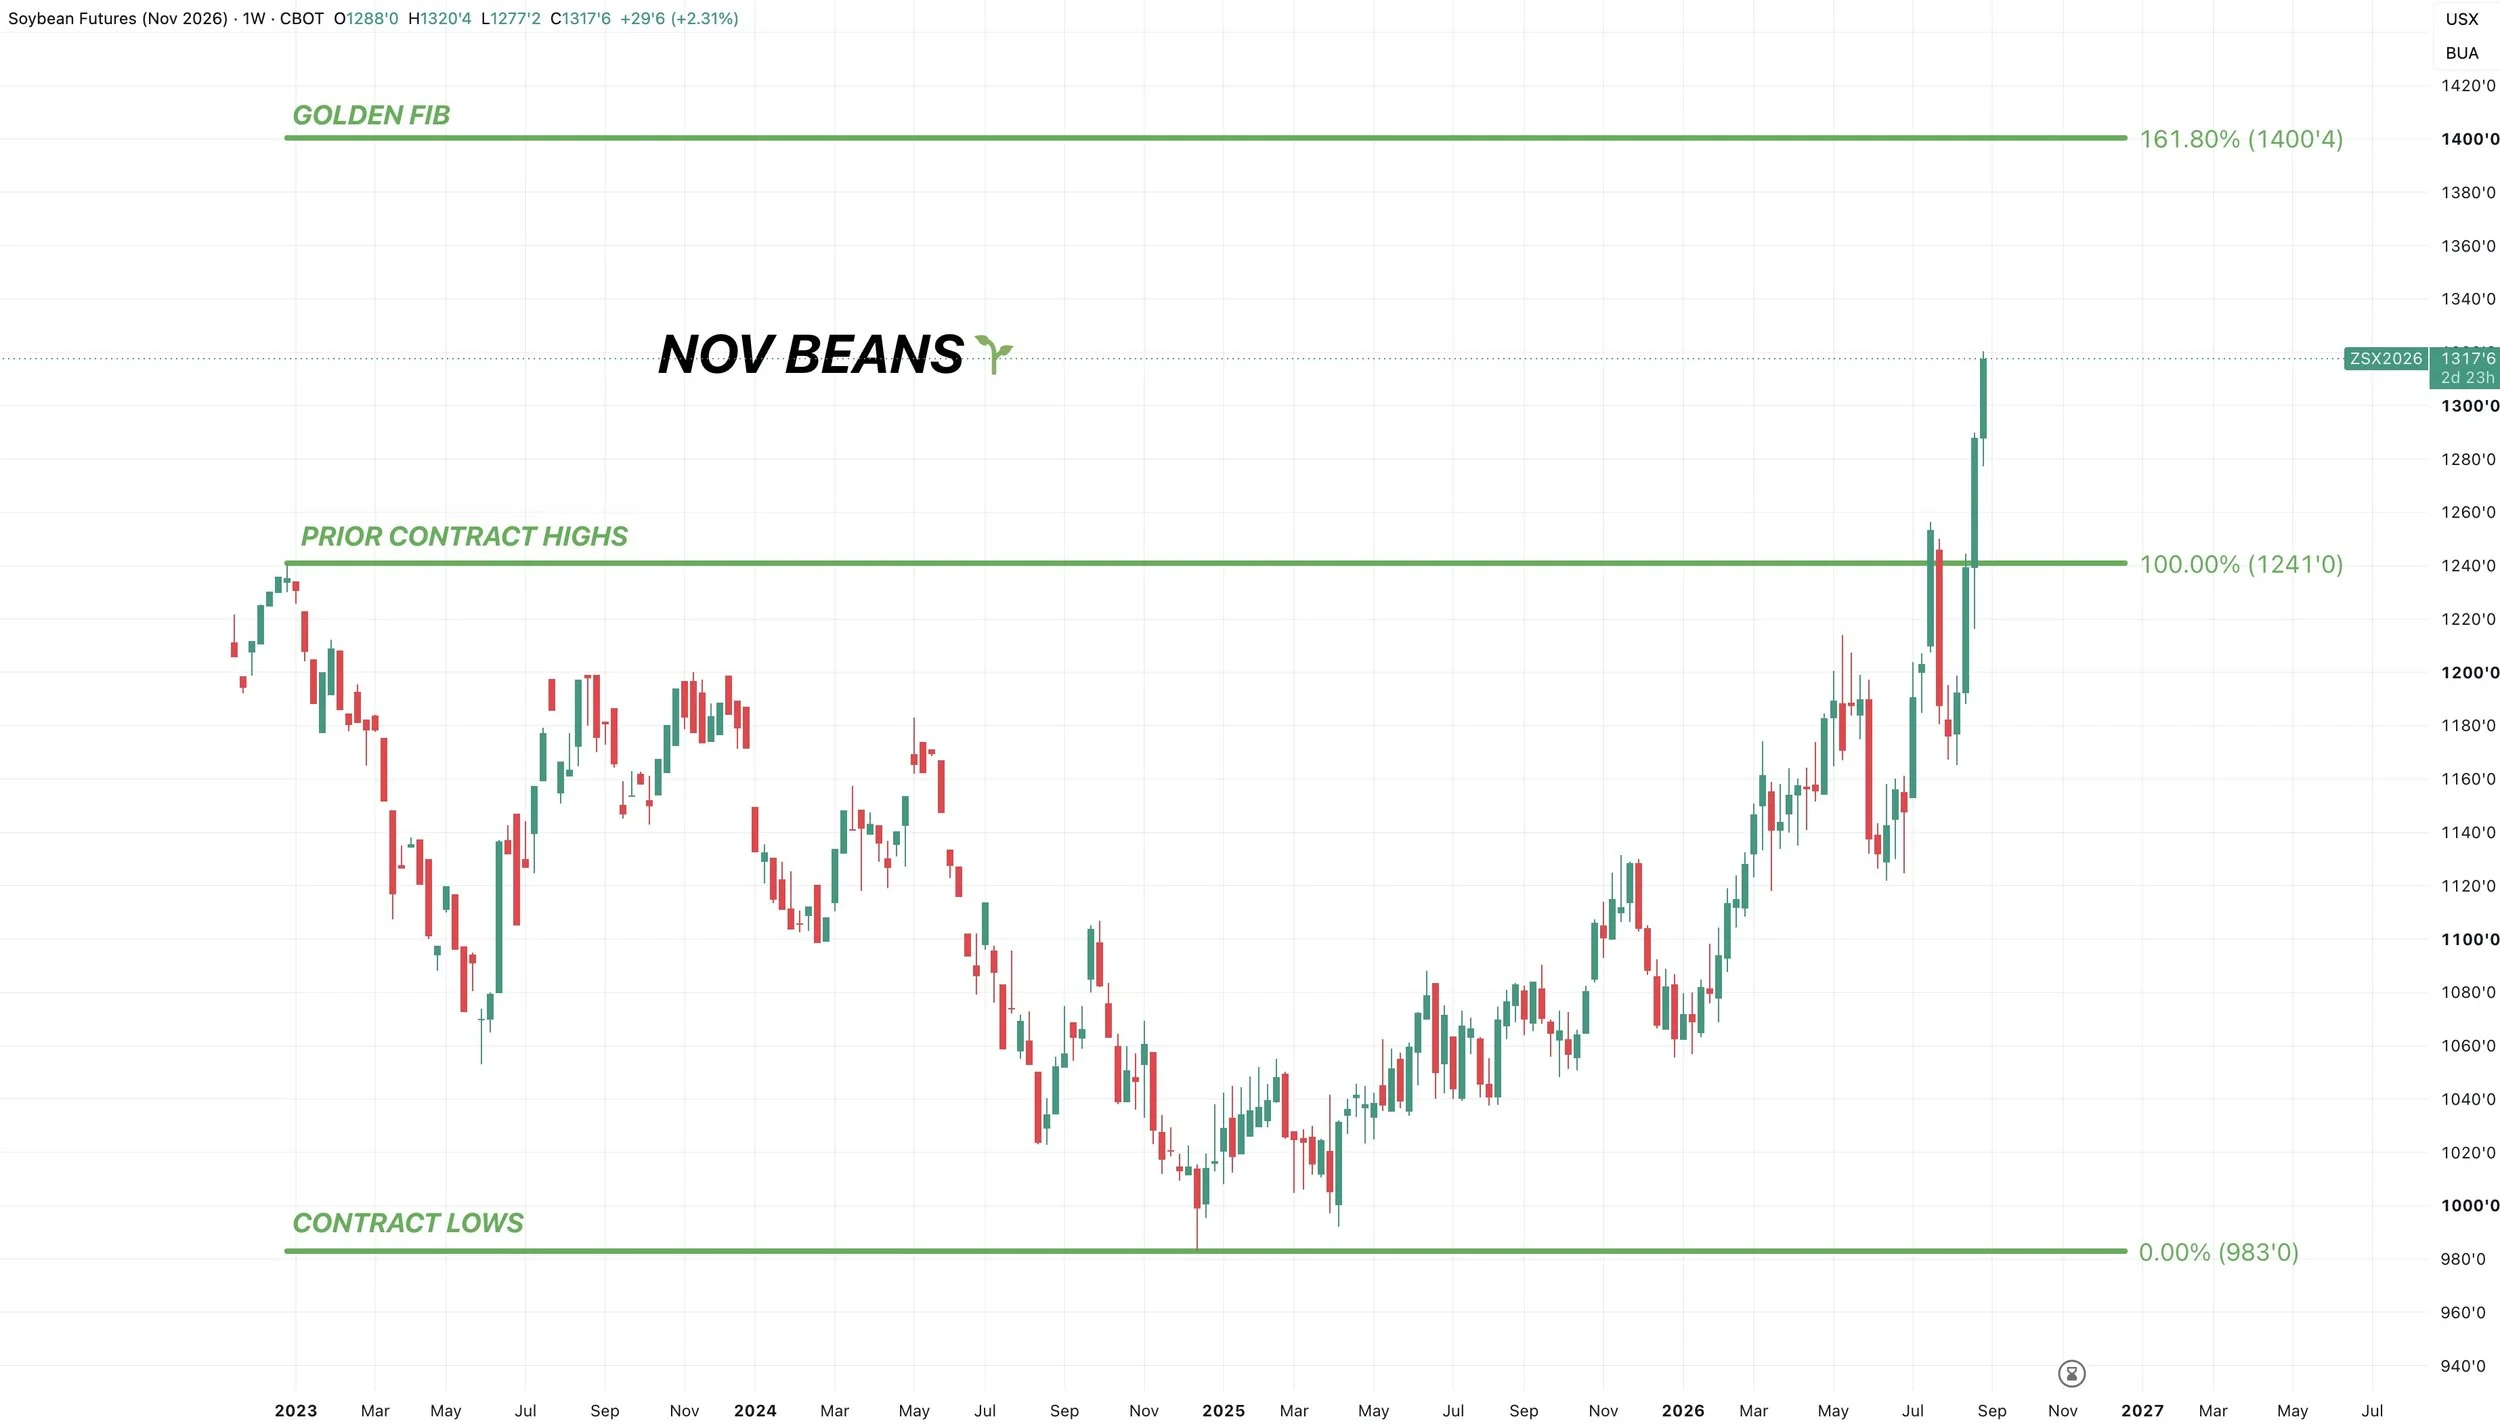
Next Possible Target:
My next target is always subject to change.
But for right now, beyond the target we hit today, this is one I am watching.
If you take the golden fib from the contract lows all the way up to the previous contract highs. It comes in right at $14.00
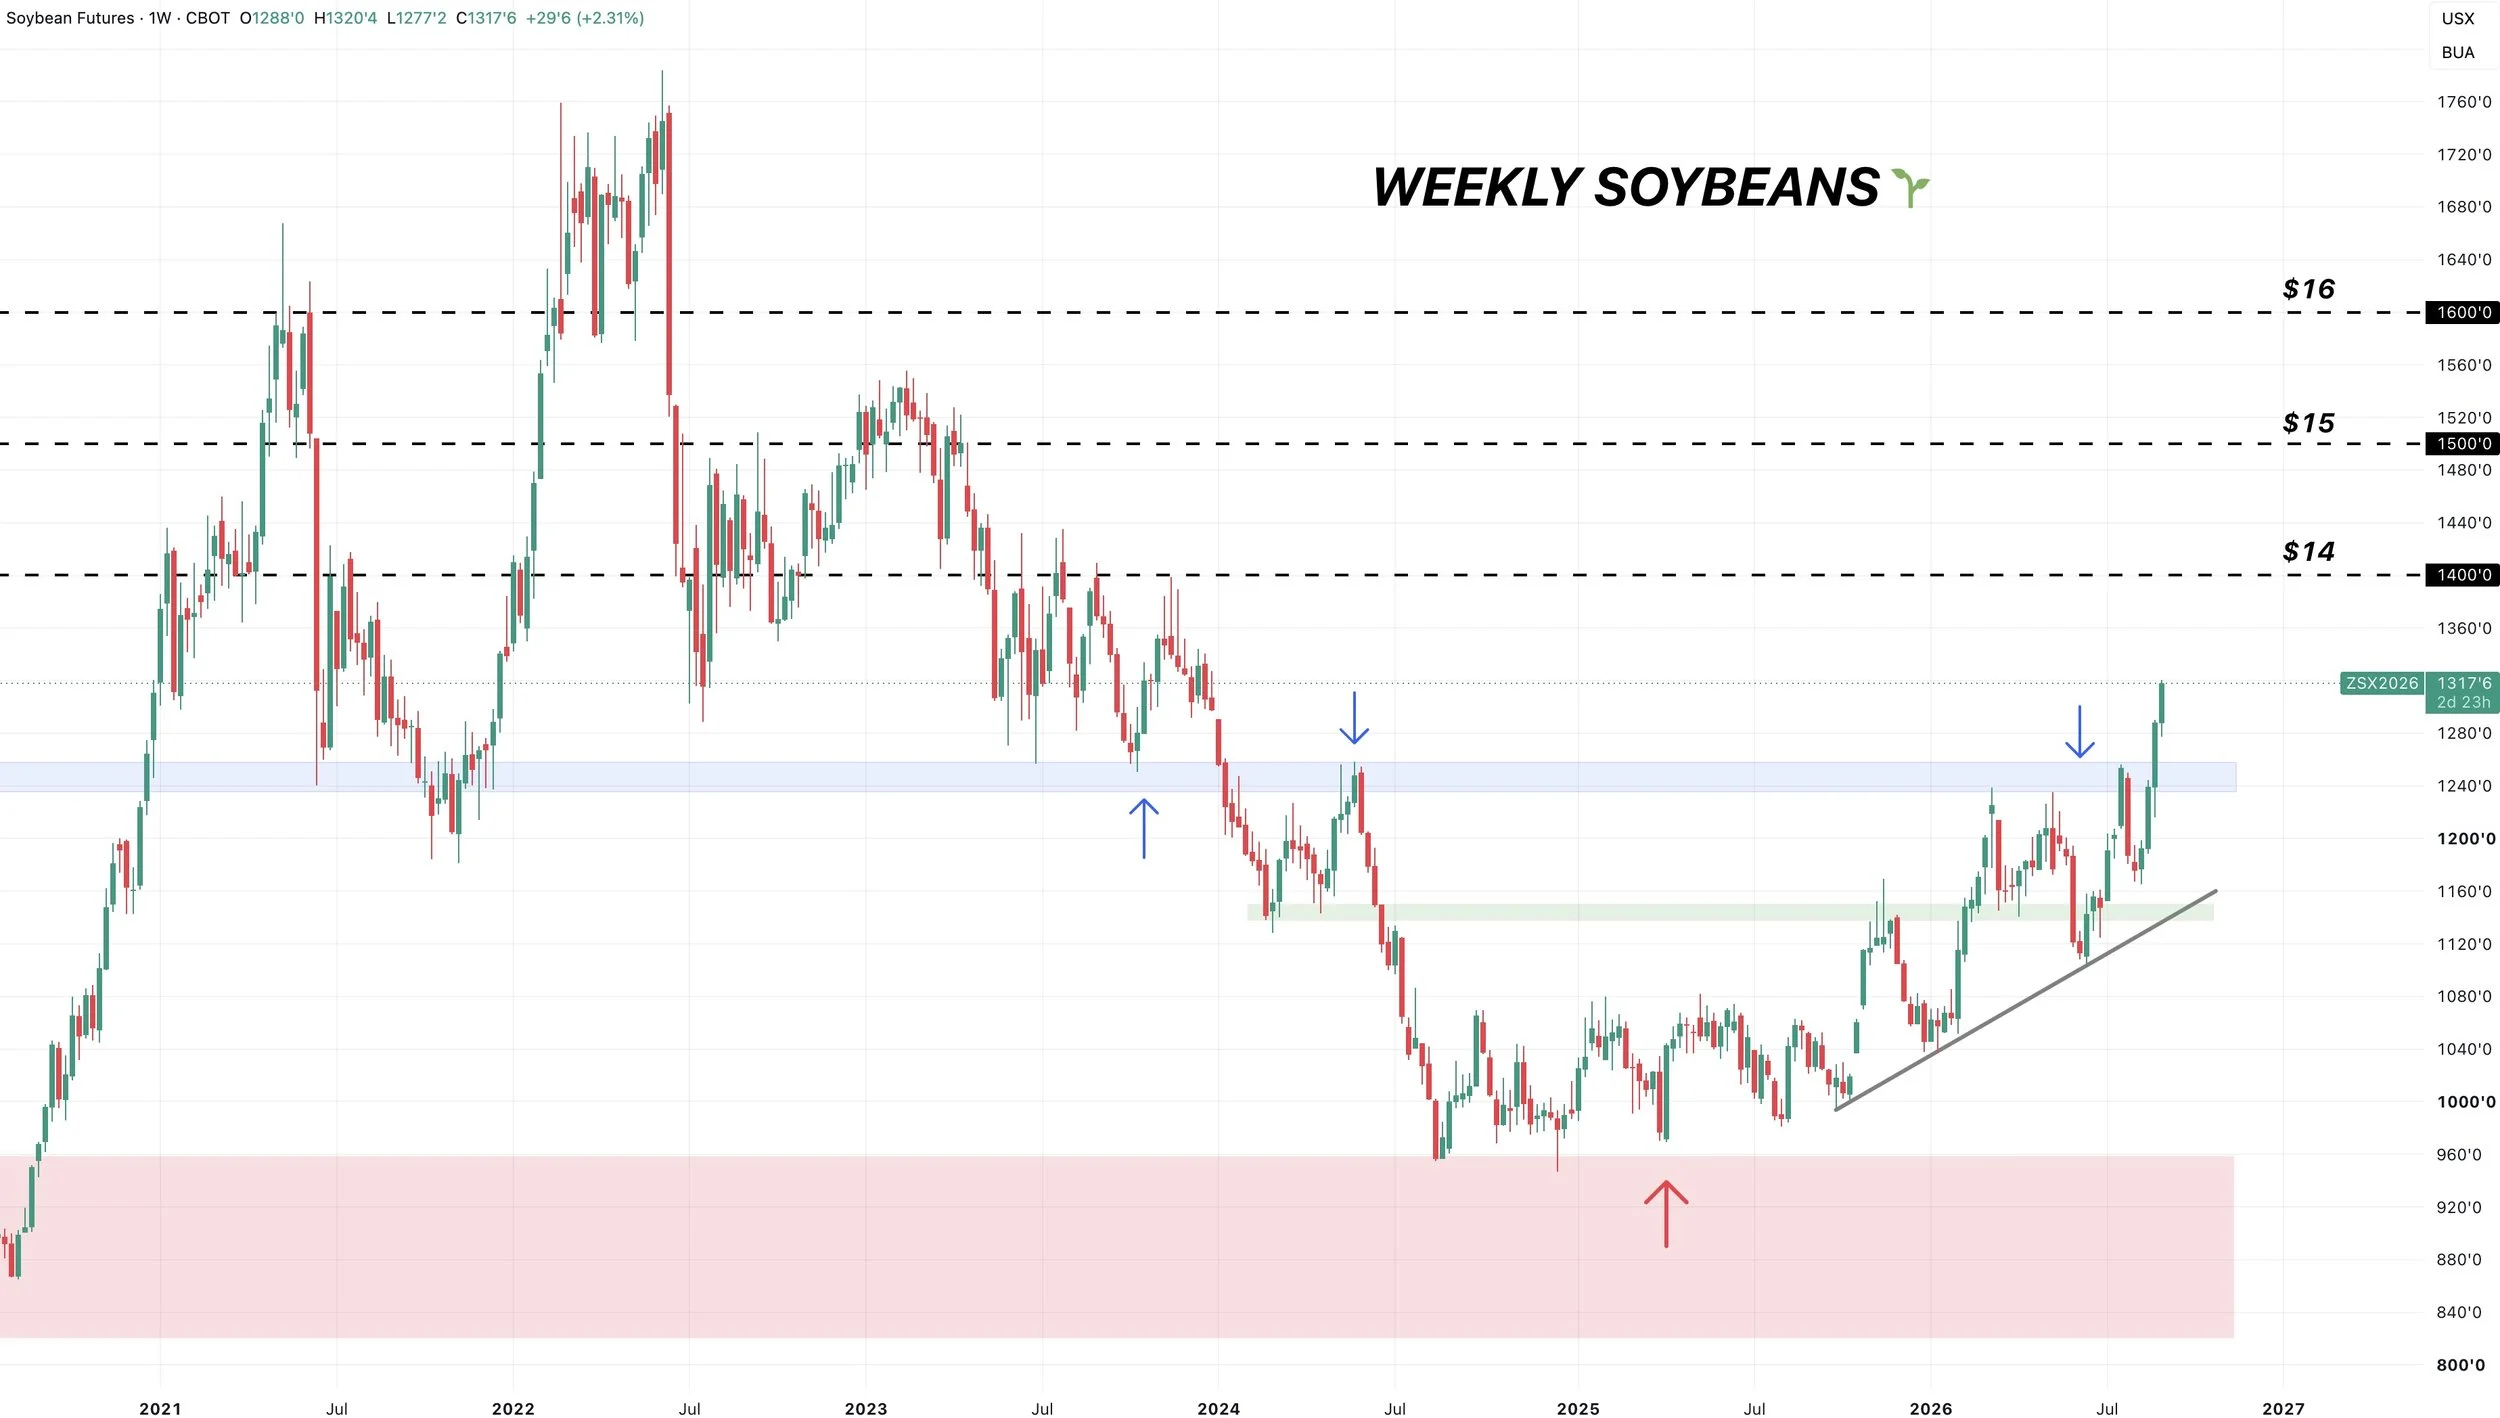
Weekly Chart:
If you zoom out, the long term structure looks very bullish as we've been talking about for a very long time now the last several months.
We've got higher highs and higher lows.
We just broke big resistance, taking out those highs from 2024.
Beans are in the teens for the first time in 3 years.
I'd argue there is still room to run long term and $14 to $15 beans does not look all that far out of the realm of possibilities..
Monthly Chart:
For starters this chart looks great.
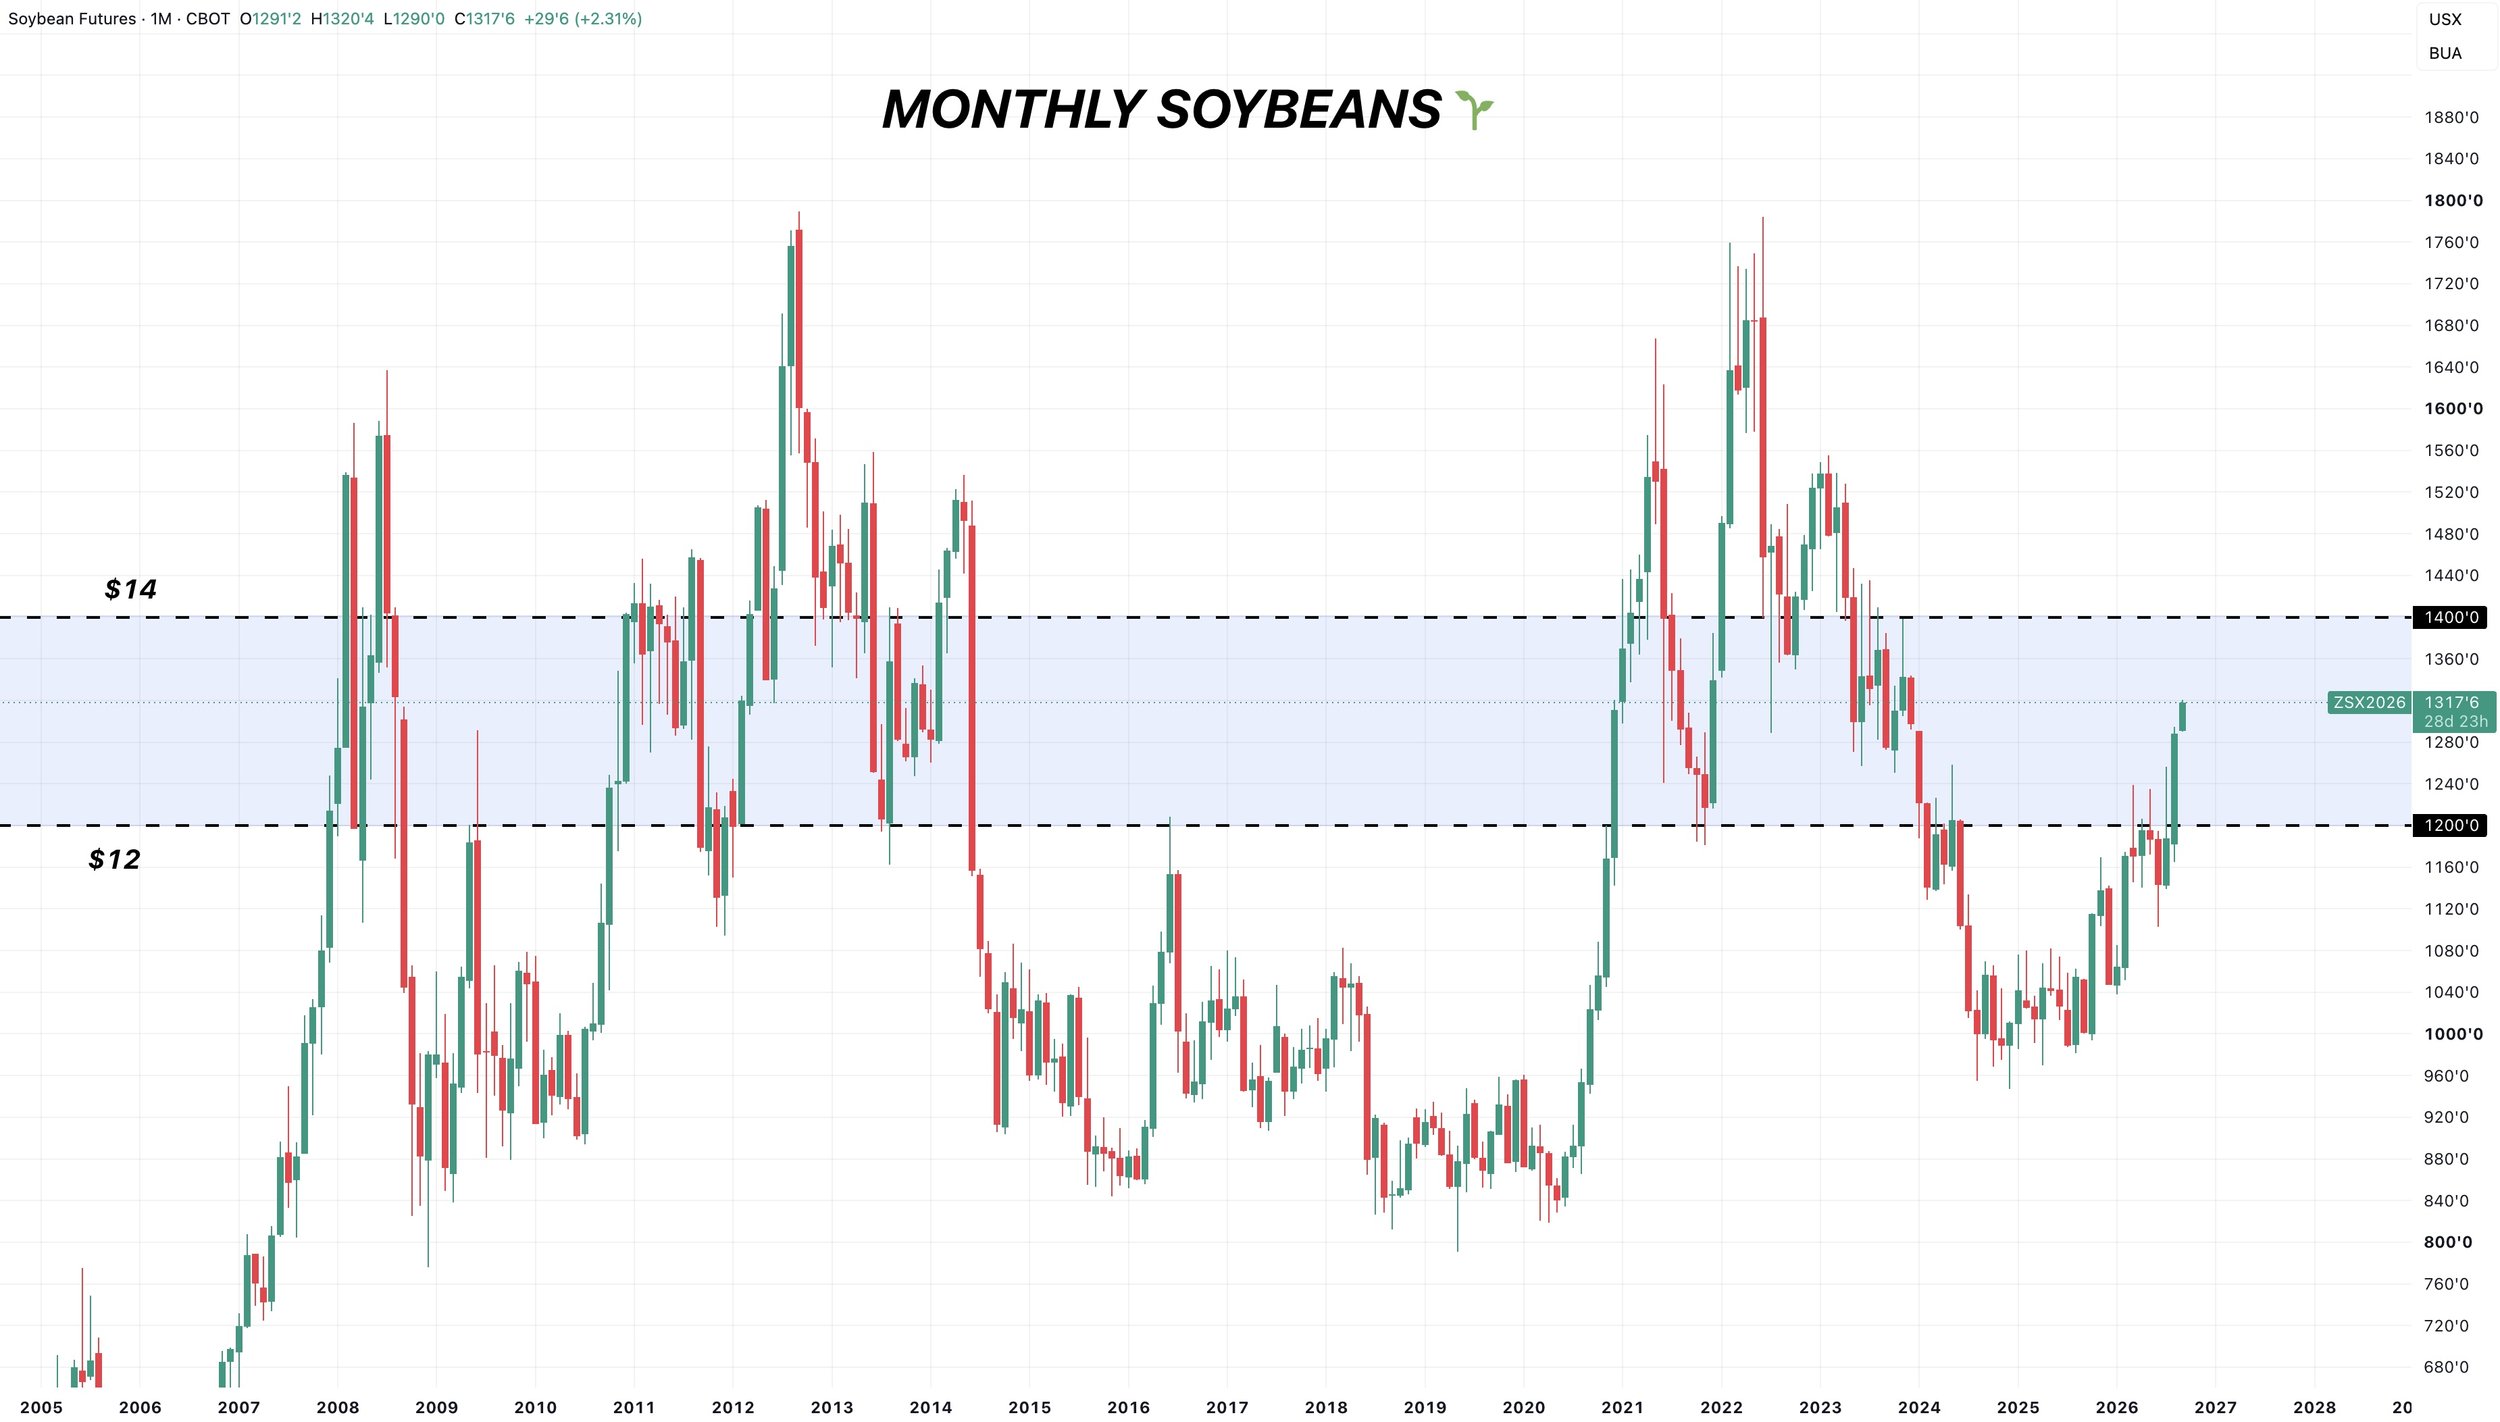
Here is something interesting I found on the monthly chart.
The blue box highlights $12.00 to $14.00
Every time we have broke above $12.00 and saw a monthly close above $12.00, the market has ran to at least $14.00. In most cases higher.
Following a monthly close above $12.00, the rally has never stopped in the $13.00's. There are times we’ve traded above $12.00 and did not make it to $14.00, but those only happened when we failed to close above $12.00. (Examples: 2009, 2016, and this year)
Wheat
Dec KC Chart:
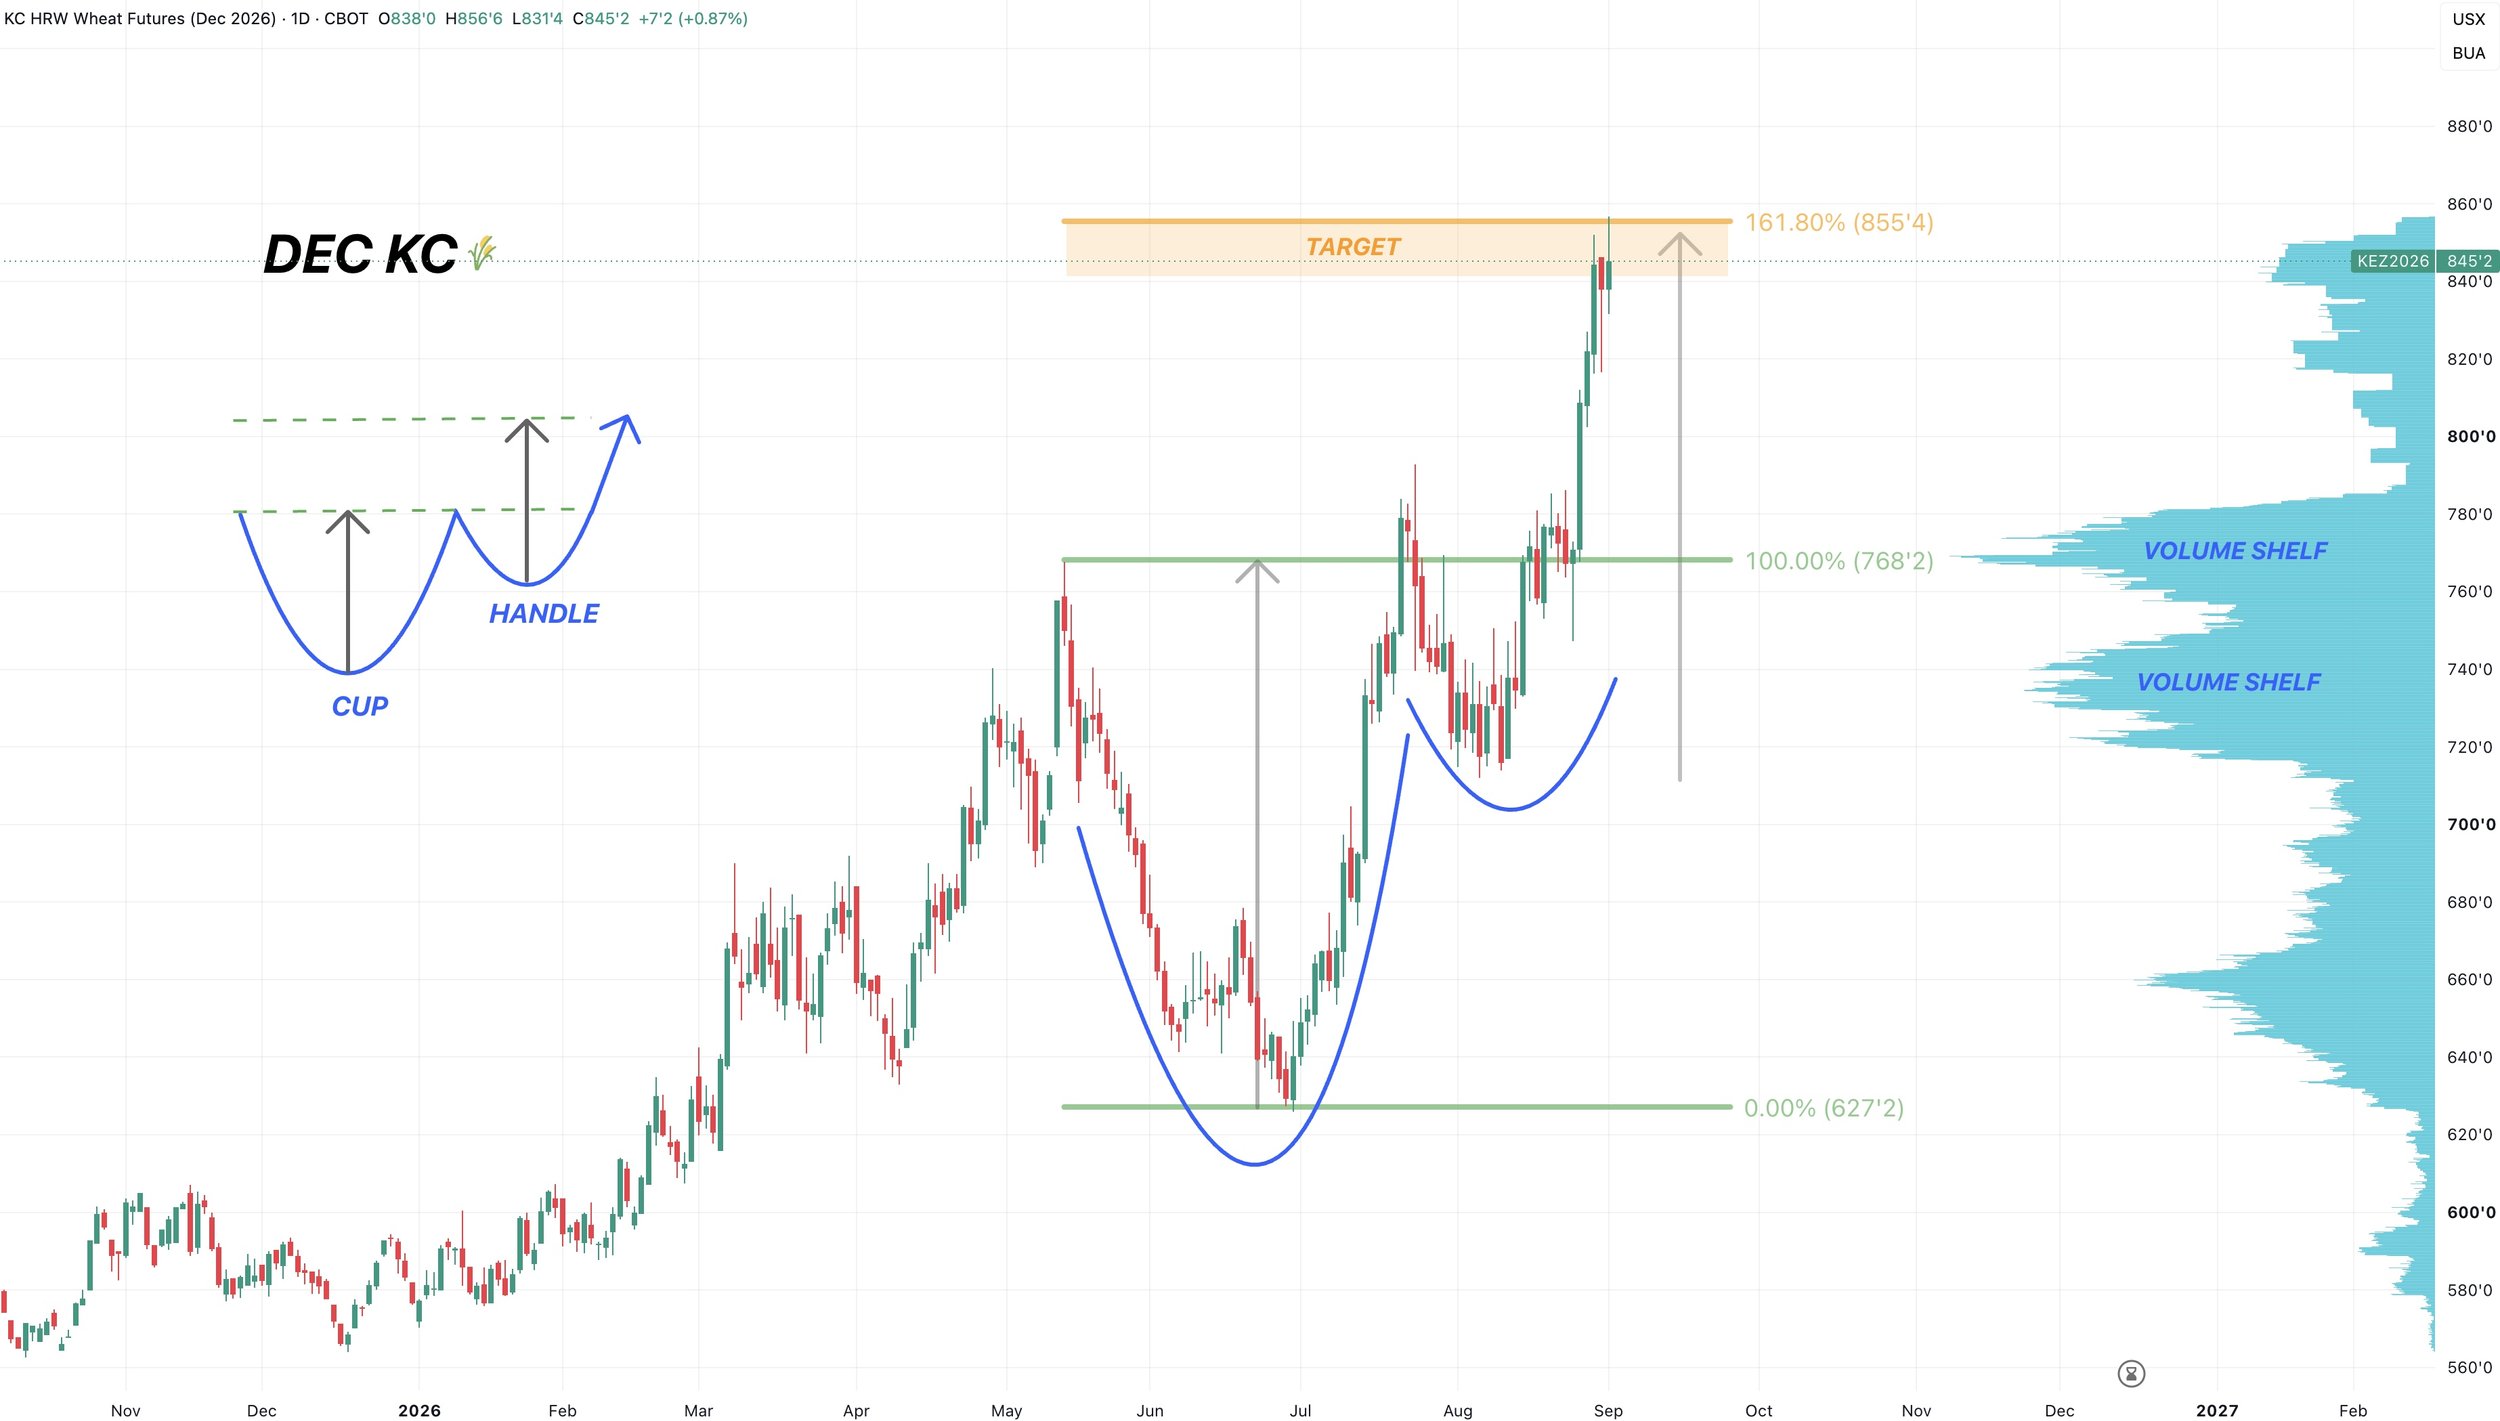
We had that sell signal and hedge alert for the first time in a long time on Monday.
As we hit that target we've had for the last month or so.
We hit the implied move from this cup and handle pattern.
We also hit the golden fib. The 161.8% retracement from the June lows up to the May highs.
So this is still an area where we want to managing our risk if you need to do so.
If we fail here, I'll be sharing where I think we could bottom.
If we continue higher, I'll be sharing some next possible upside objectives.
Monthly KC Chart:
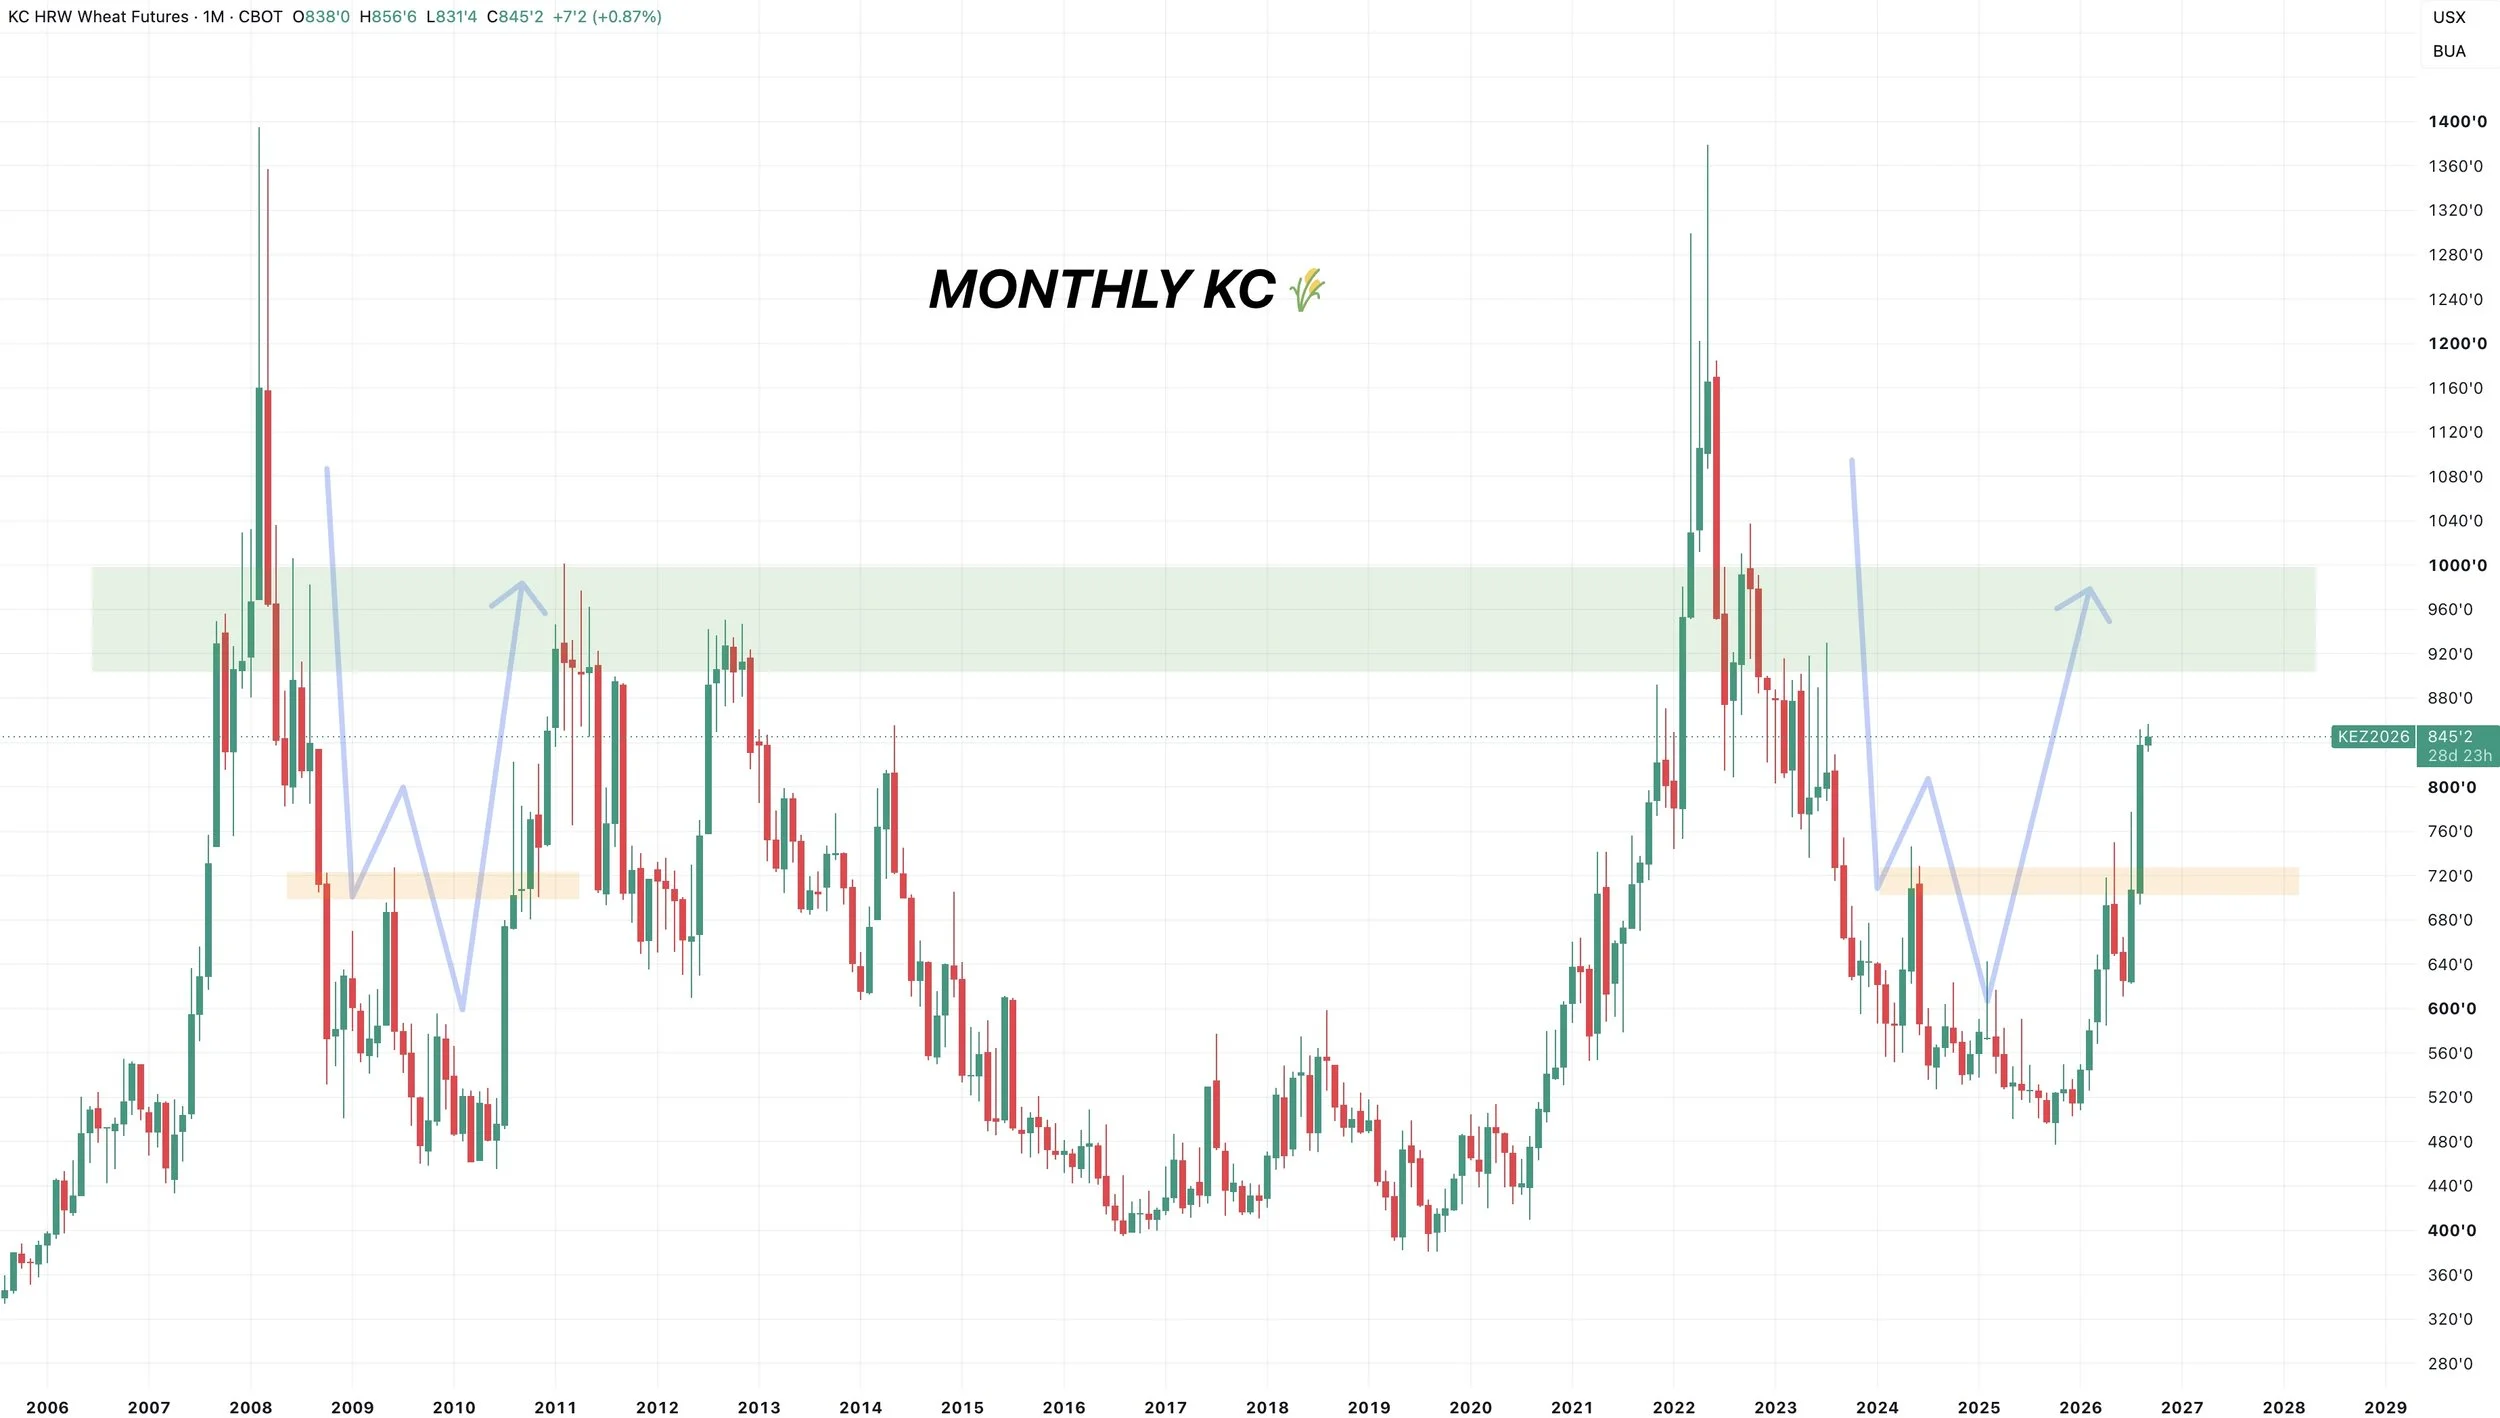
If you zoom out, what could definitely still have long term upside potential.
This rally looks very similar to what we saw back in 2010-2011.
Every major rally in the wheat market has ran up to at least that $9 to even $10 range.
If we get into that $9 to $10 green box, it probably makes sense to be more aggressive.
Considering there is only a handful of months we've ever closed above that range.
MPLS Wheat Chart:
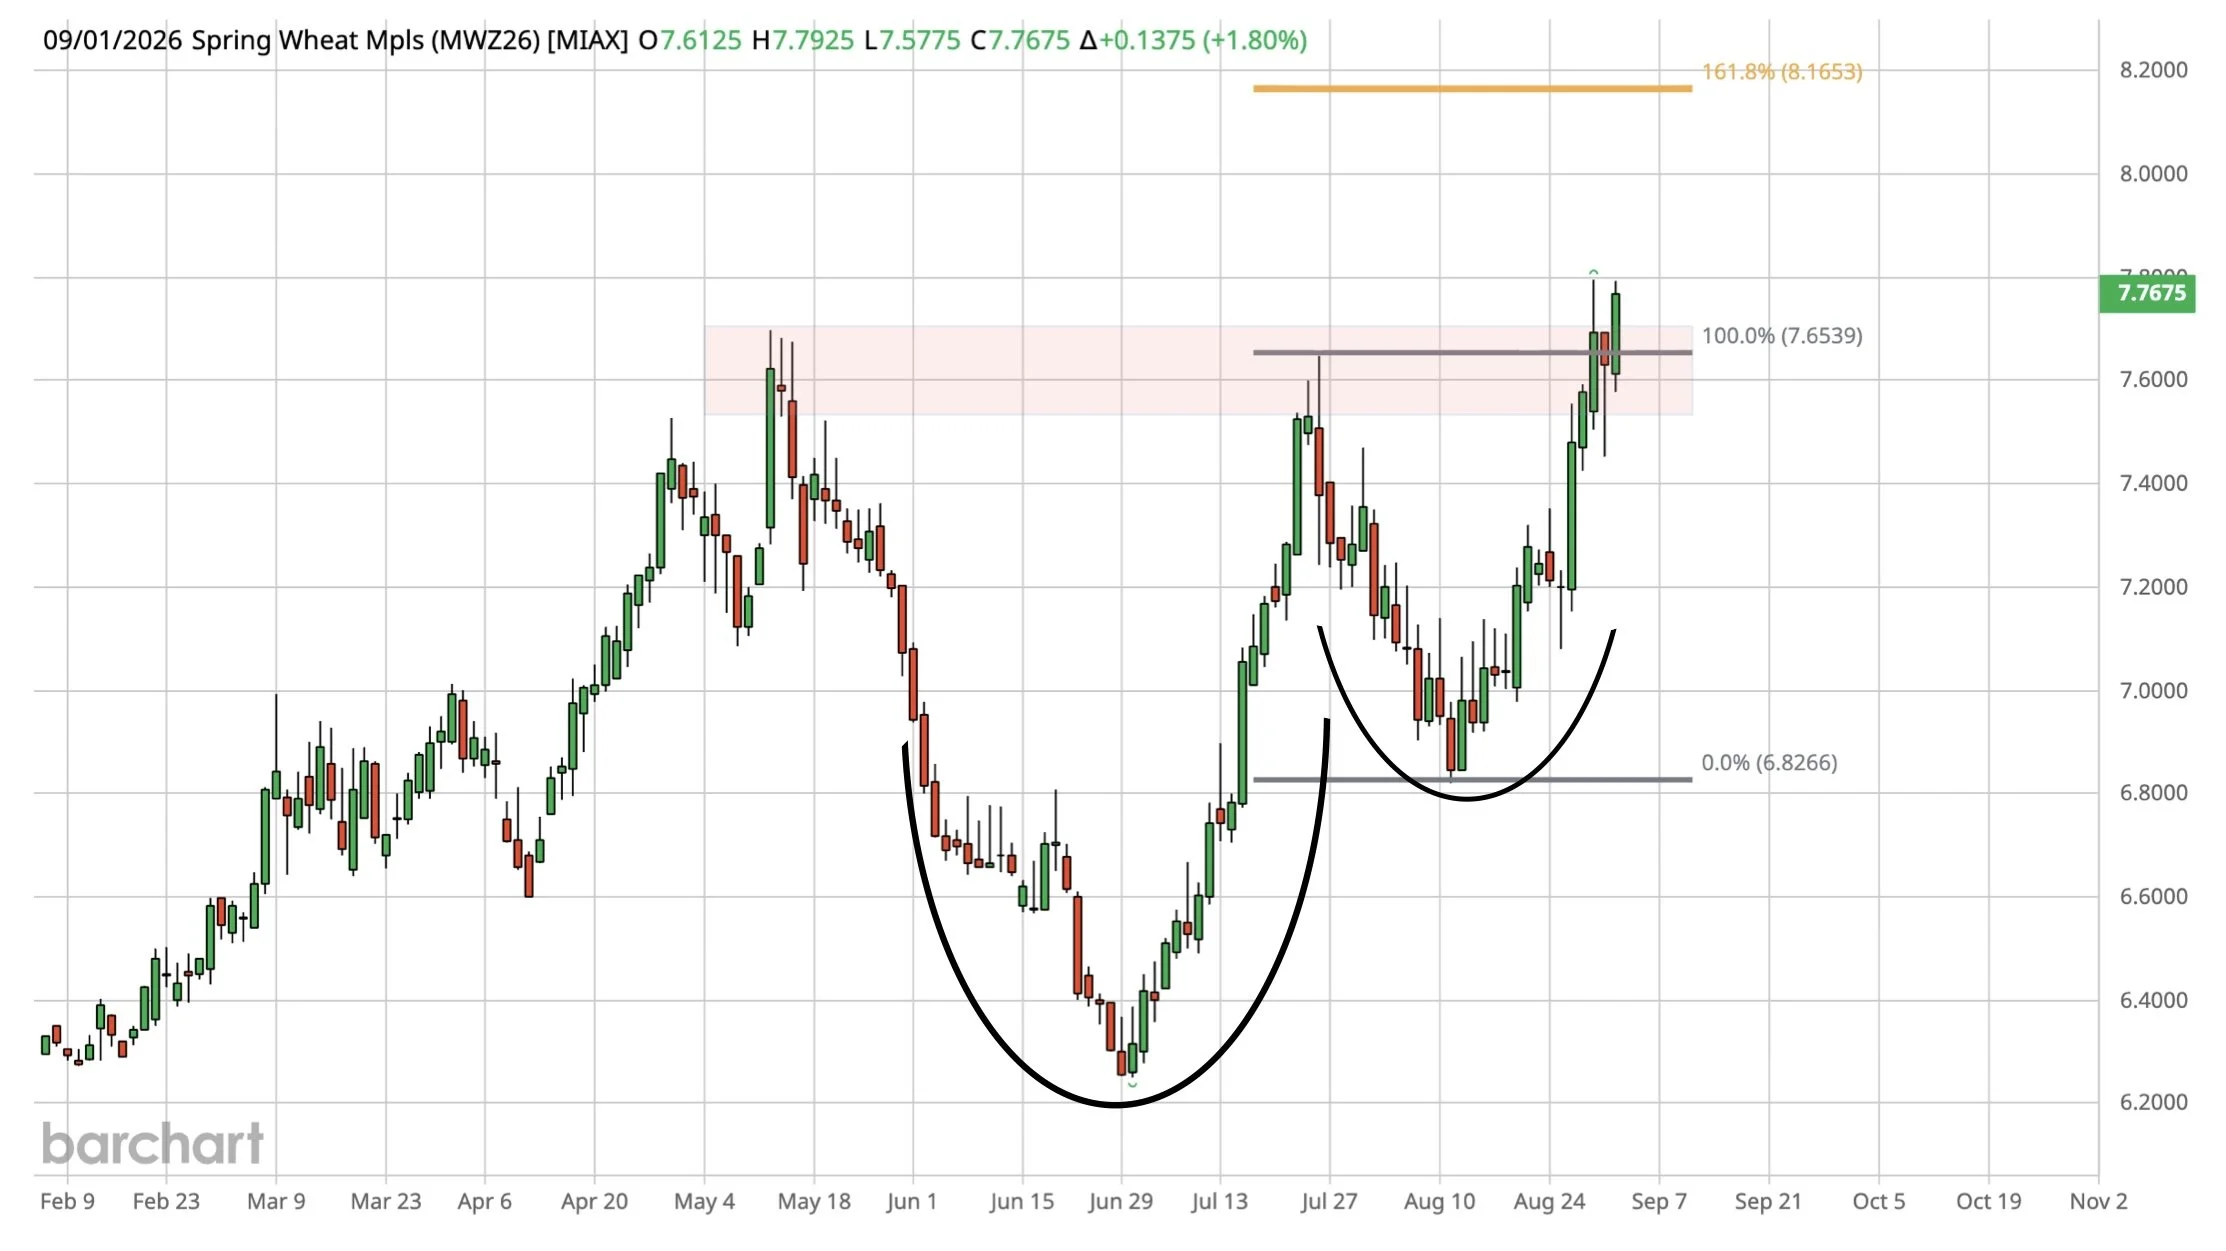
MPLS has been lagging KC.
It does look like we are attempting to break through this resistance, but not quiet out of the woods yet.
We still have this cup and handle pattern here.
We still have the golden fib that sits around $8.15, which is going to be an area of interest if we break out and continue to rally.
Cattle
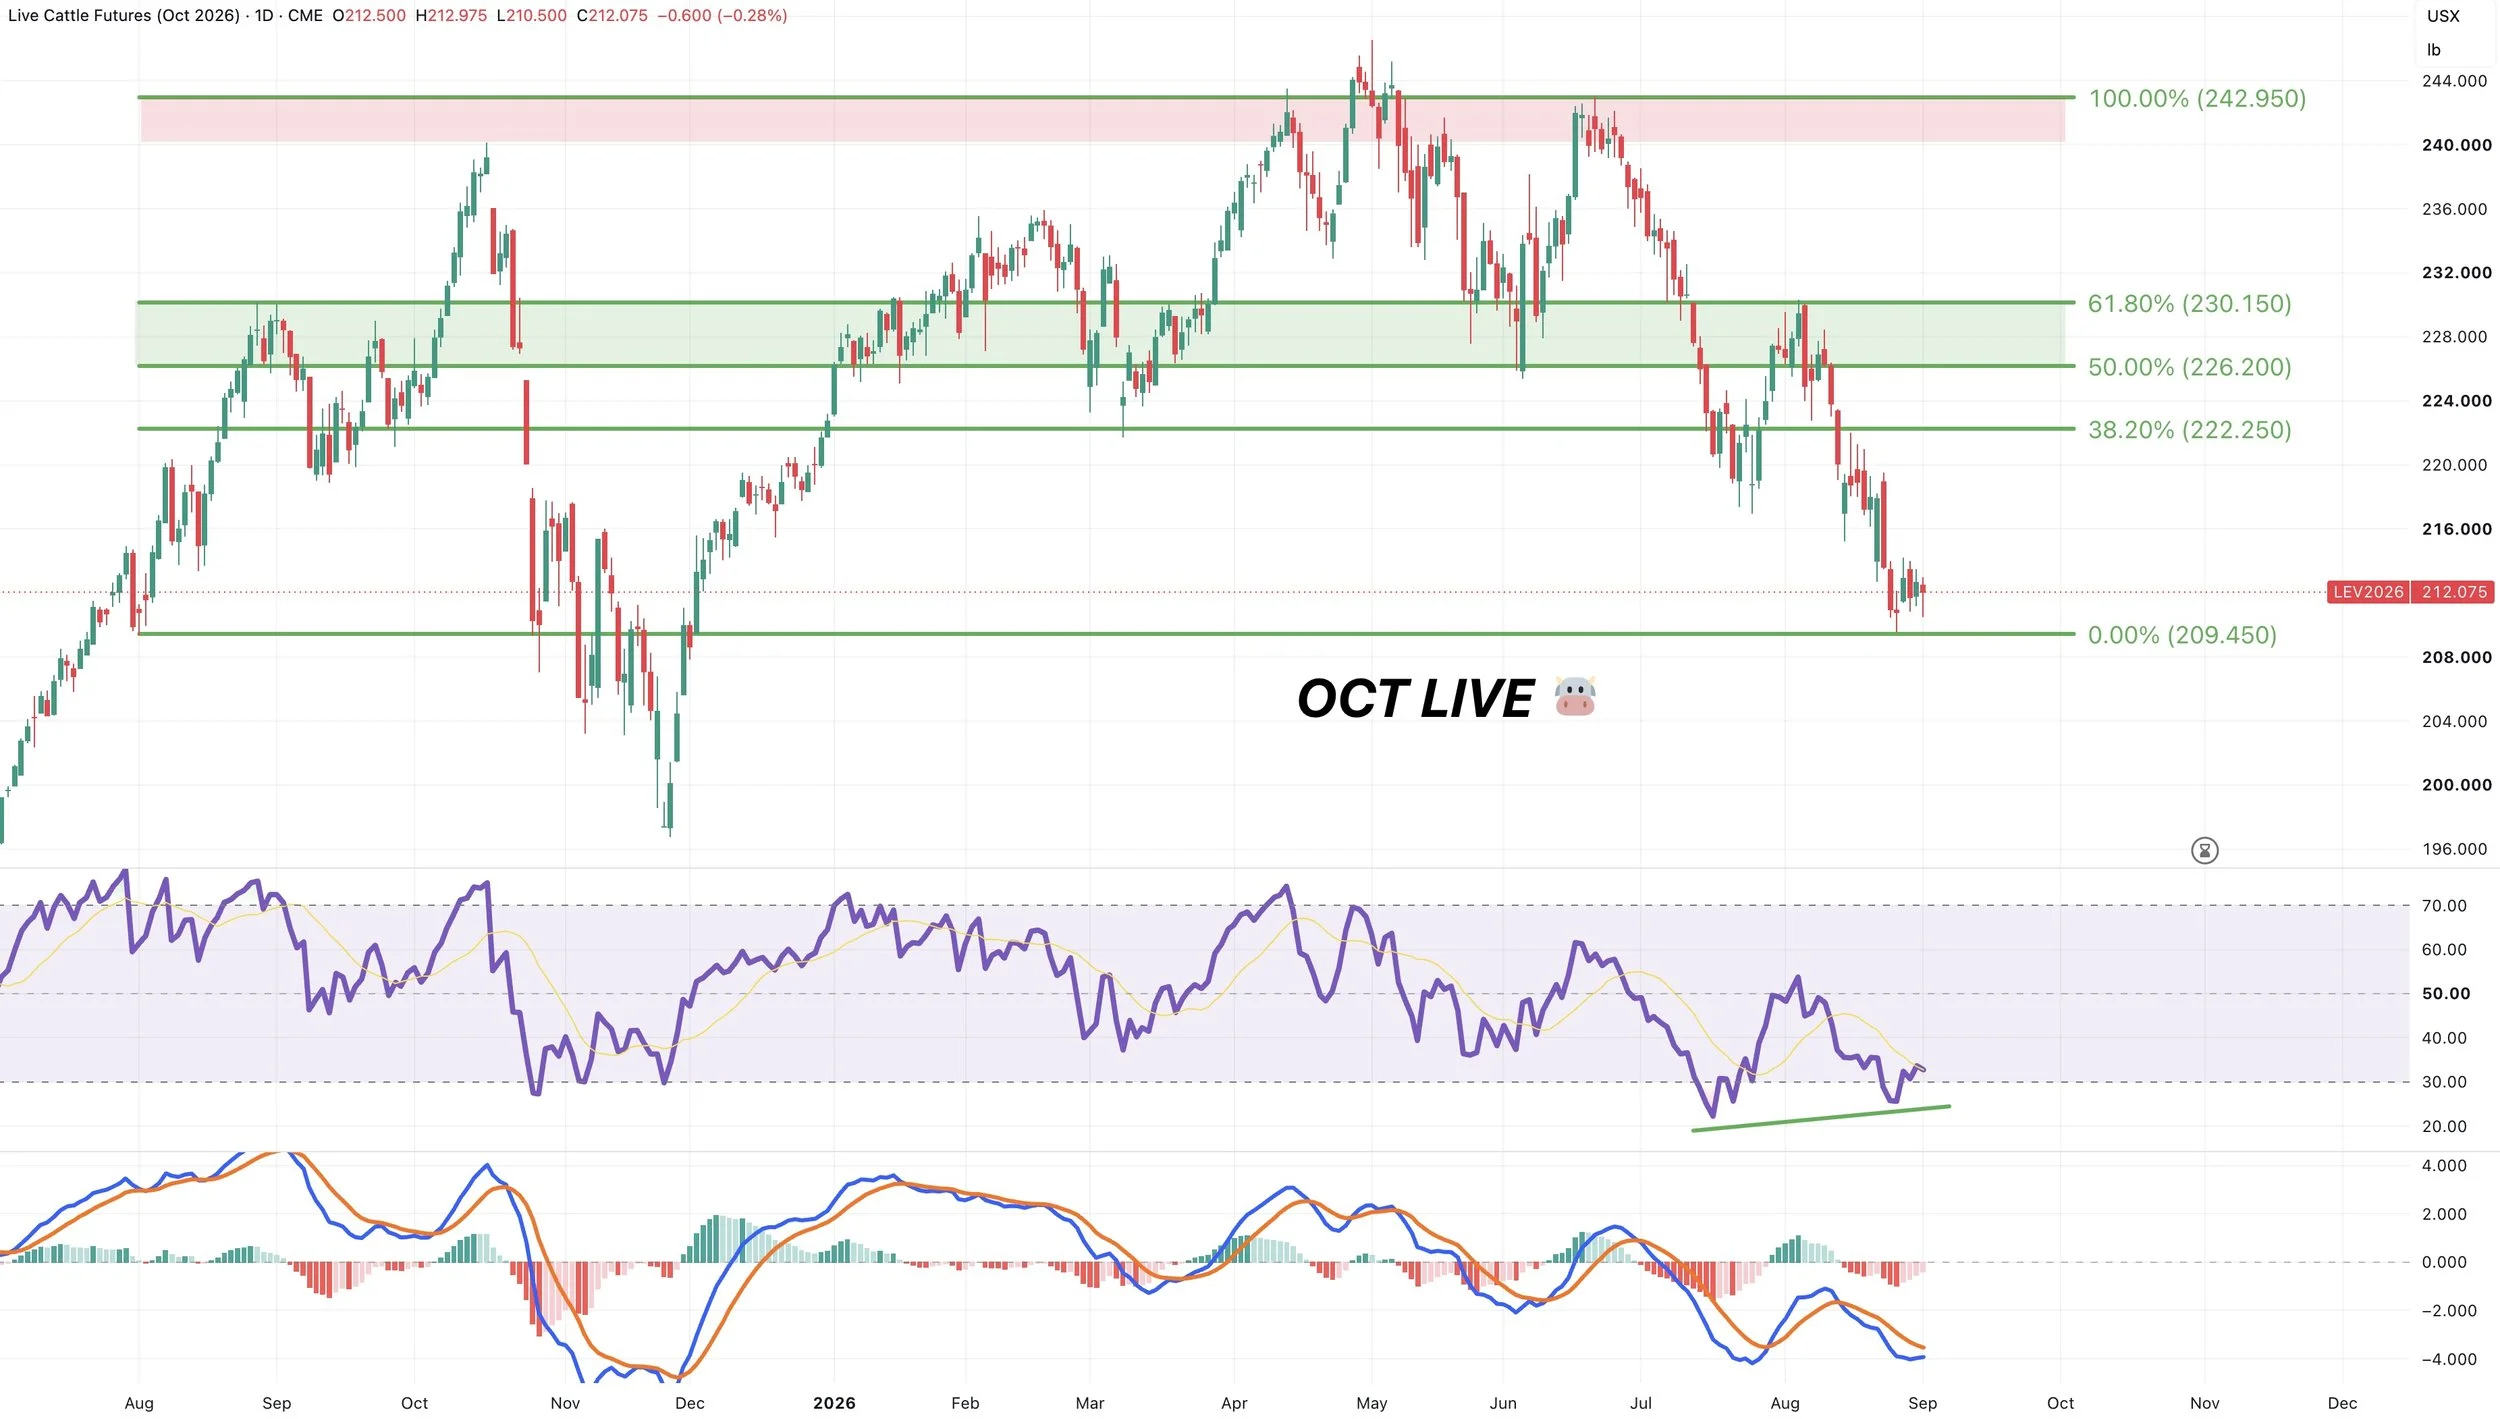
Oct Live Chart:
Cattle still doesn’t look too hot down here.
I'm still in the camp that any sizeable rally should be protected as the trend is lower.
It'd probably be beneficial for cattle if the corn market took a step back.
The indicators are still suggesting this market might want to try to at least get a dead cat bounce.
As we still have bullish divergence on the RSI and the MACD looks like it wants to cross bullish as well.
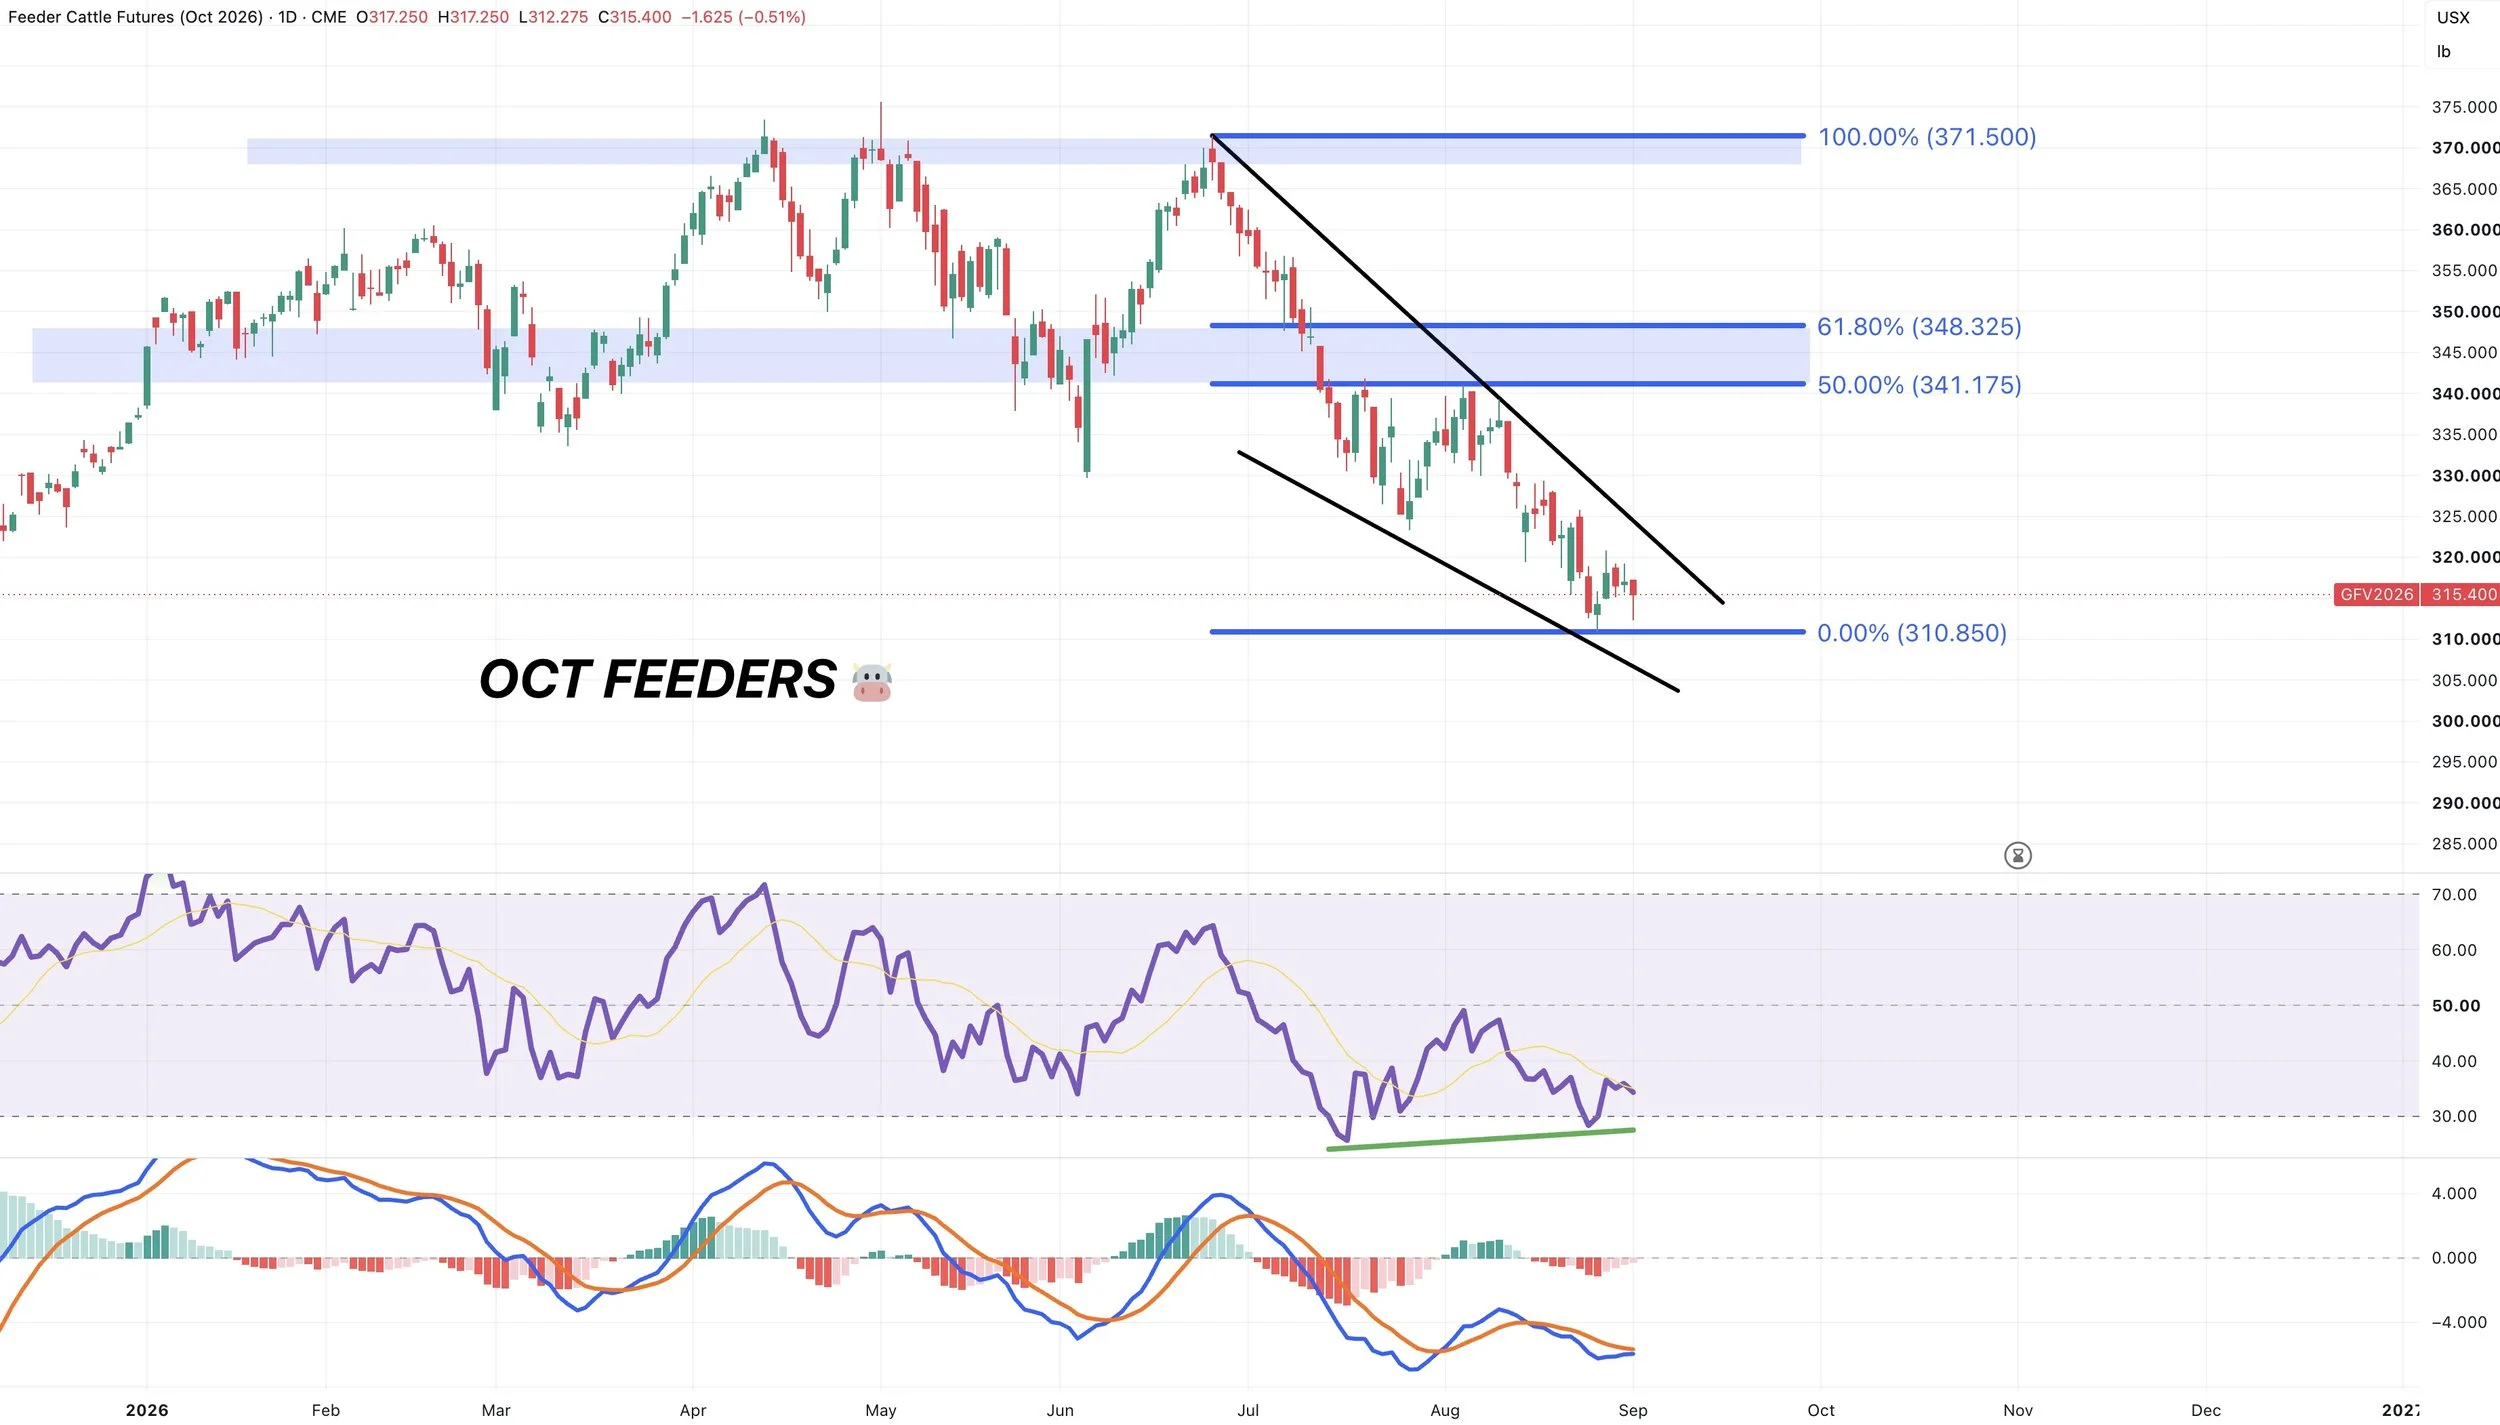
Oct Feeders Chart:
Same thing here.
Essentially trying to catch a falling knife.
We do have a wedge pattern I'm watching.
Looking to protect a sizeable rally towards the golden zone.
Also showing bullish divergence on the RSI and the MACD is close to crossing bullish. So the indicators suggest a possible bounce soon.
Want to Talk?
Our phones are open 24/7 for you guys if you ever need anything or want to discuss your operation.
Jeremey & Office: (806)484-1214
Sebastian: (605)280-1186
Email: sfrost@dailymarketminute.com
Hedge Account
Interested in a hedge account? Use the link below to set up an account or give us a call.