
DOES THIS USDA MEAN ANYTHING?
MARKET UPDATE
You can scroll to read the usual update as well. As the written version is the exact same as the video.
Timestamps for video:
Overview: 0:00min
USDA: 0:45min
Corn: 3:25min
Corn Charts: 8:40min
Beans: 12:00min
Bean Charts: 14:30min
Wheat Charts: 16:35min
Cattle Charts: 18:40min
Want to talk?
Office: (806)484-1214
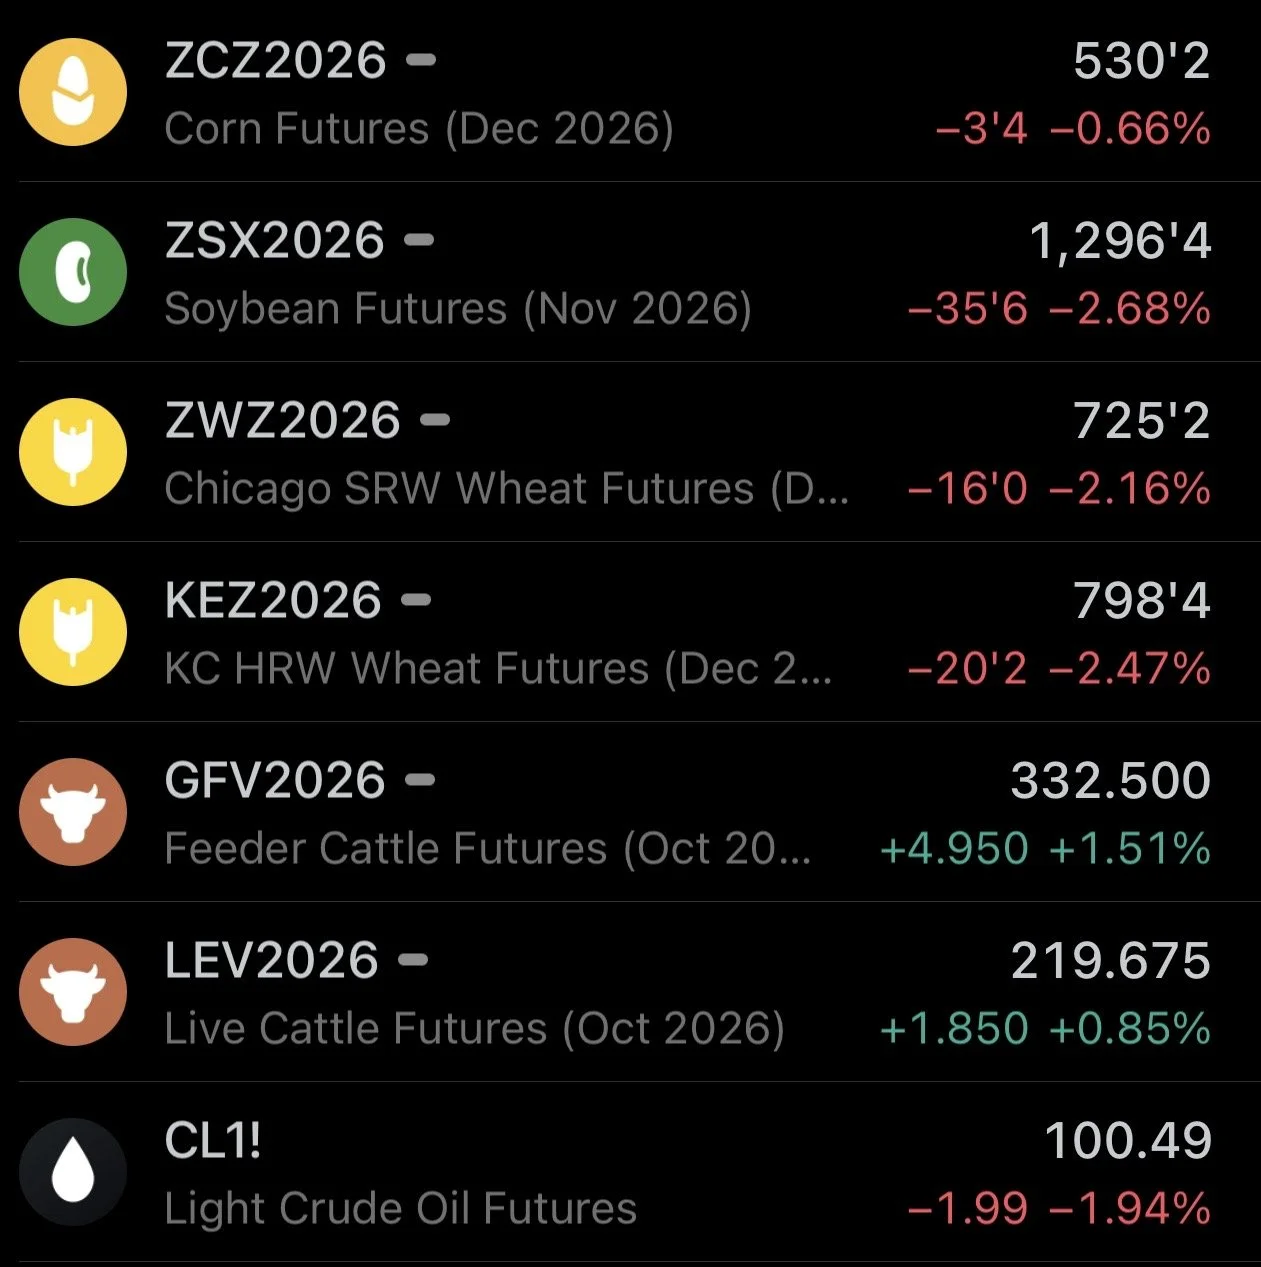
Futures Prices Close
Overview
First off I did want to take a second to remember 9/11, honor those fallen, and thank those who served.
As for the markets, grains got hit hard today following the USDA report. While the cattle market continues to put together a nice bounce.
Before the report, the market was actually already weak.
Before the report:
Corn was down -8 cents
Beans were down -25 cents
Wheat was down -20 cents
Today's all about the USDA report.
We'll be going over what changes they made, how it impacts things, and going over things we are watching on the charts. As I do still think we could be in for a little more weakness short term as we've been discussing the last week or two.
Let's dive right into the report..
USDA Recap
Numbers vs Estimates
Corn
Yield came in slightly higher than expected. At 178.5 vs the estimates of 178.2 bpa. However, this was still a sizeable cut from last month's 180.7.
Harvested acres actually came in below the estimates. At 88.5 million vs the estimates of 88.58 million.
Carryout came in at 1.567 billion bu. Which was higher than the trade estimate of 1.528 but still well below last month's 1.653.
So pretty much everything for corn came in a tad higher than the trade was expecting, but still well below last month's numbers.
Maybe the trade was expecting a more bearish outcome, given that we sold off heading into the report.

Soybeans
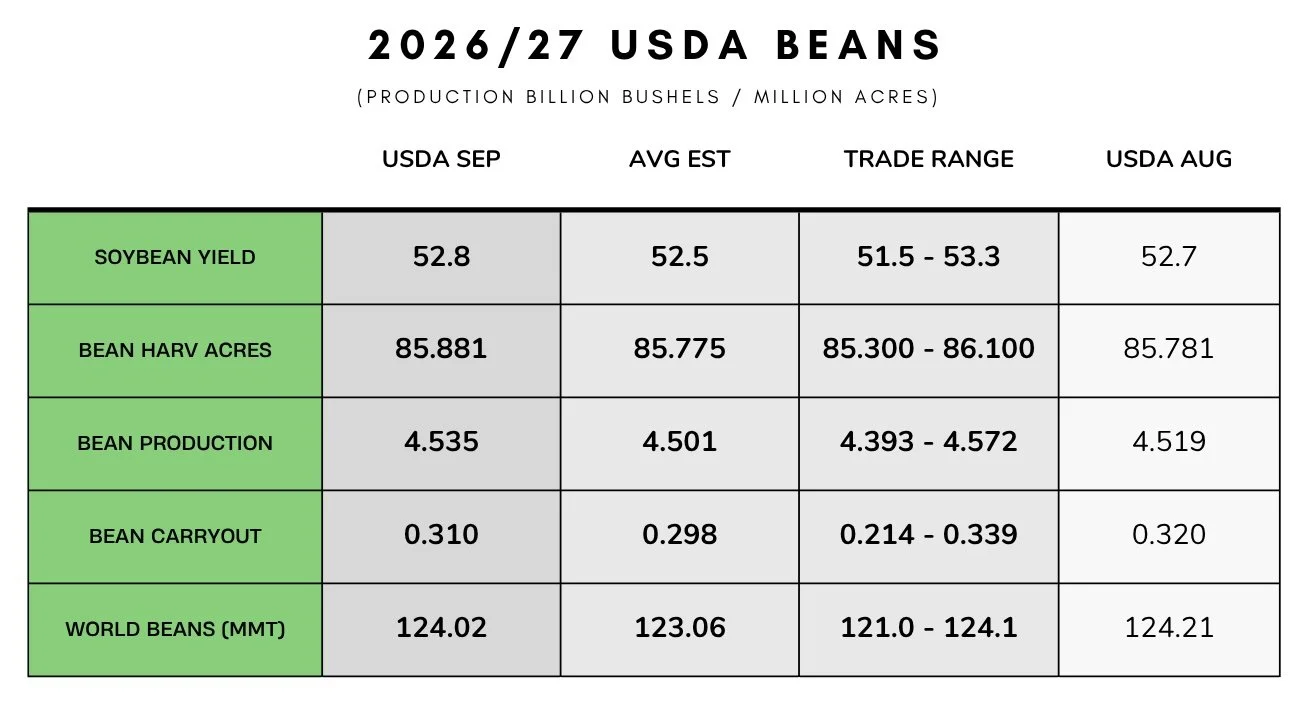
Yield actually increased from 52.7 to 52.8 bpa. Despite the trade expecting a cut down to 52.5.
Harvested acres came up slightly from last month.
With the disappointment in yield, our carryout came in at 310 million bu. Which was higher than the trade's estimate of 298 million but still lower than last month's 320 million.
Wheat
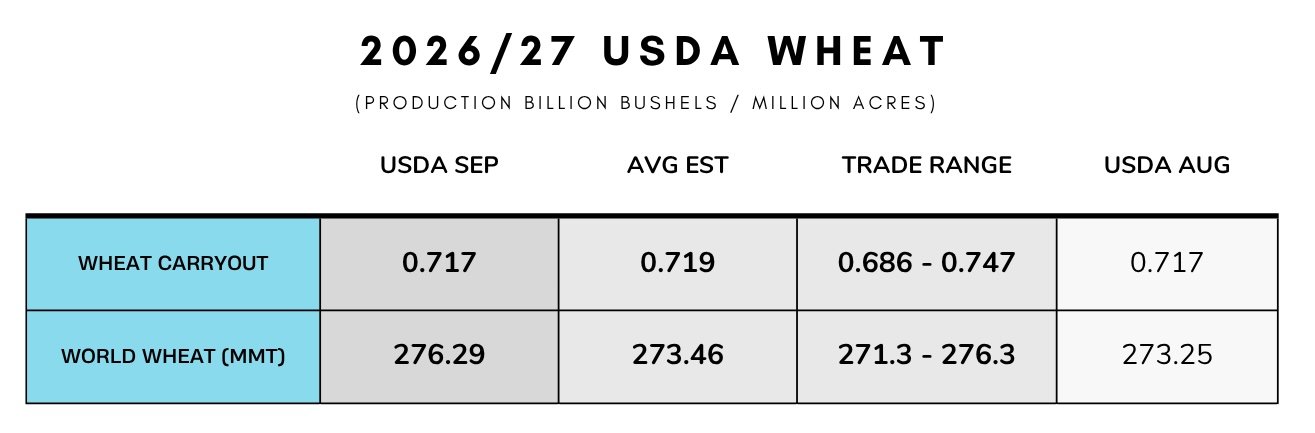
The US balance sheet waas left completely unchanged, so nothing to see there.
The world number saw a pretty sizeable increase on the other hand.
The trade was expecting it to be unchanged, but it jumped from 273.25 MMT up to 276.29 MMT.
This was due to larger crops in Argy, Australia, and Canada.
What did the USDA actually do?
Let's jump into the full balance sheet changes to see exactly what the USDA did.
On all of these balance sheets:
Green = Bullish Change
Red = Bearish Change
Yellow = No Change
First for corn.
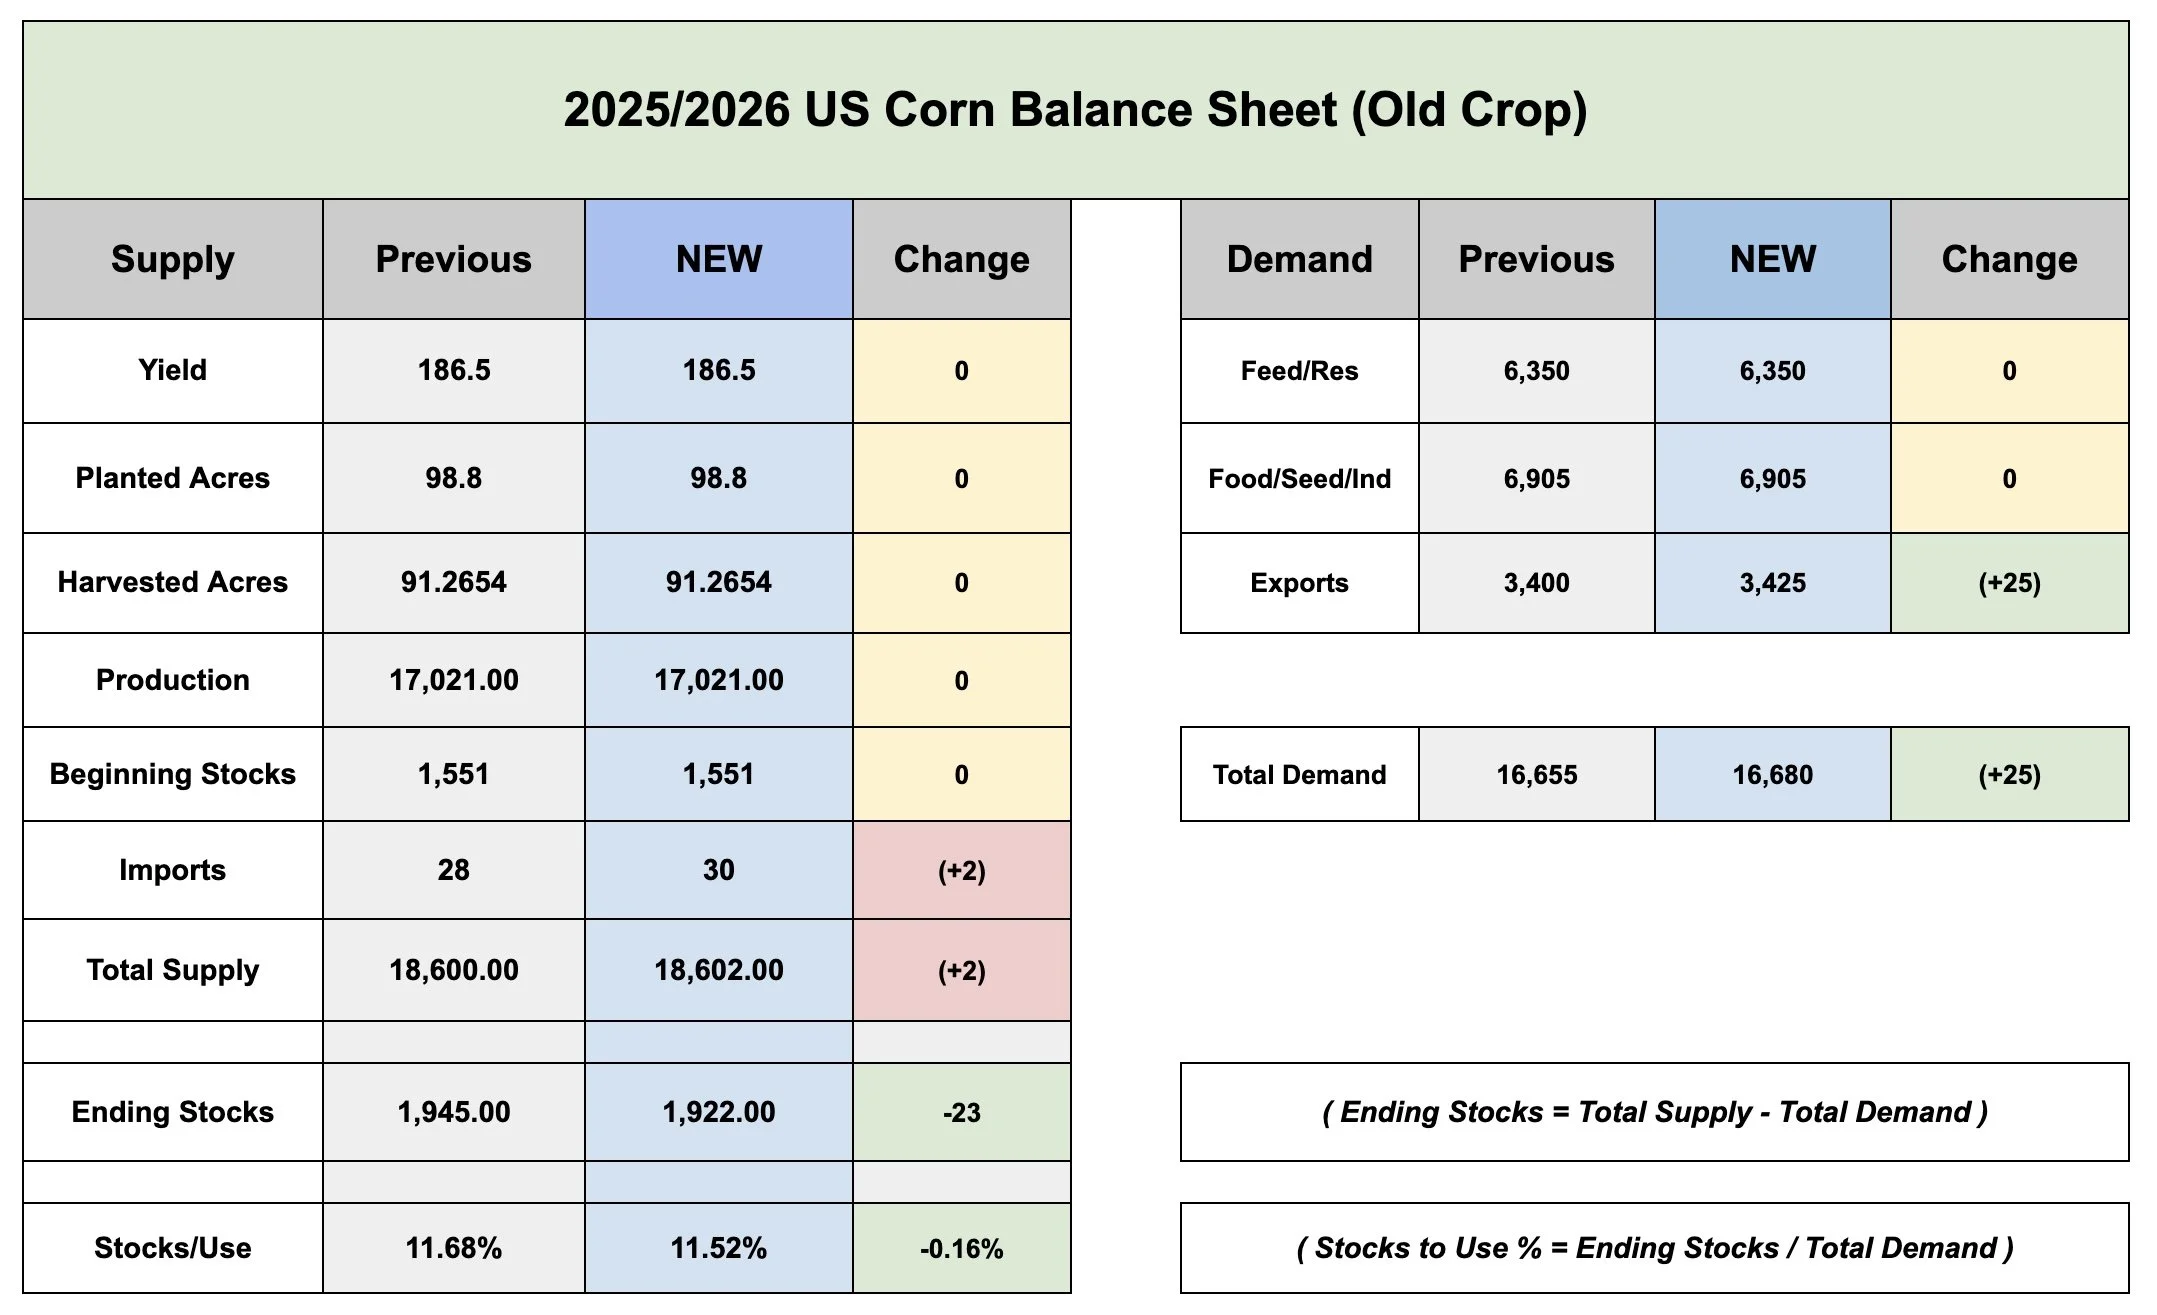
Old Crop Corn:
All they did here was bump exports by another +25 million.
Which in turn results in the new crop carryout dropping -25 million via beginning stocks.
New Crop Corn:
So we got that -25 million cut to beginning stocks.
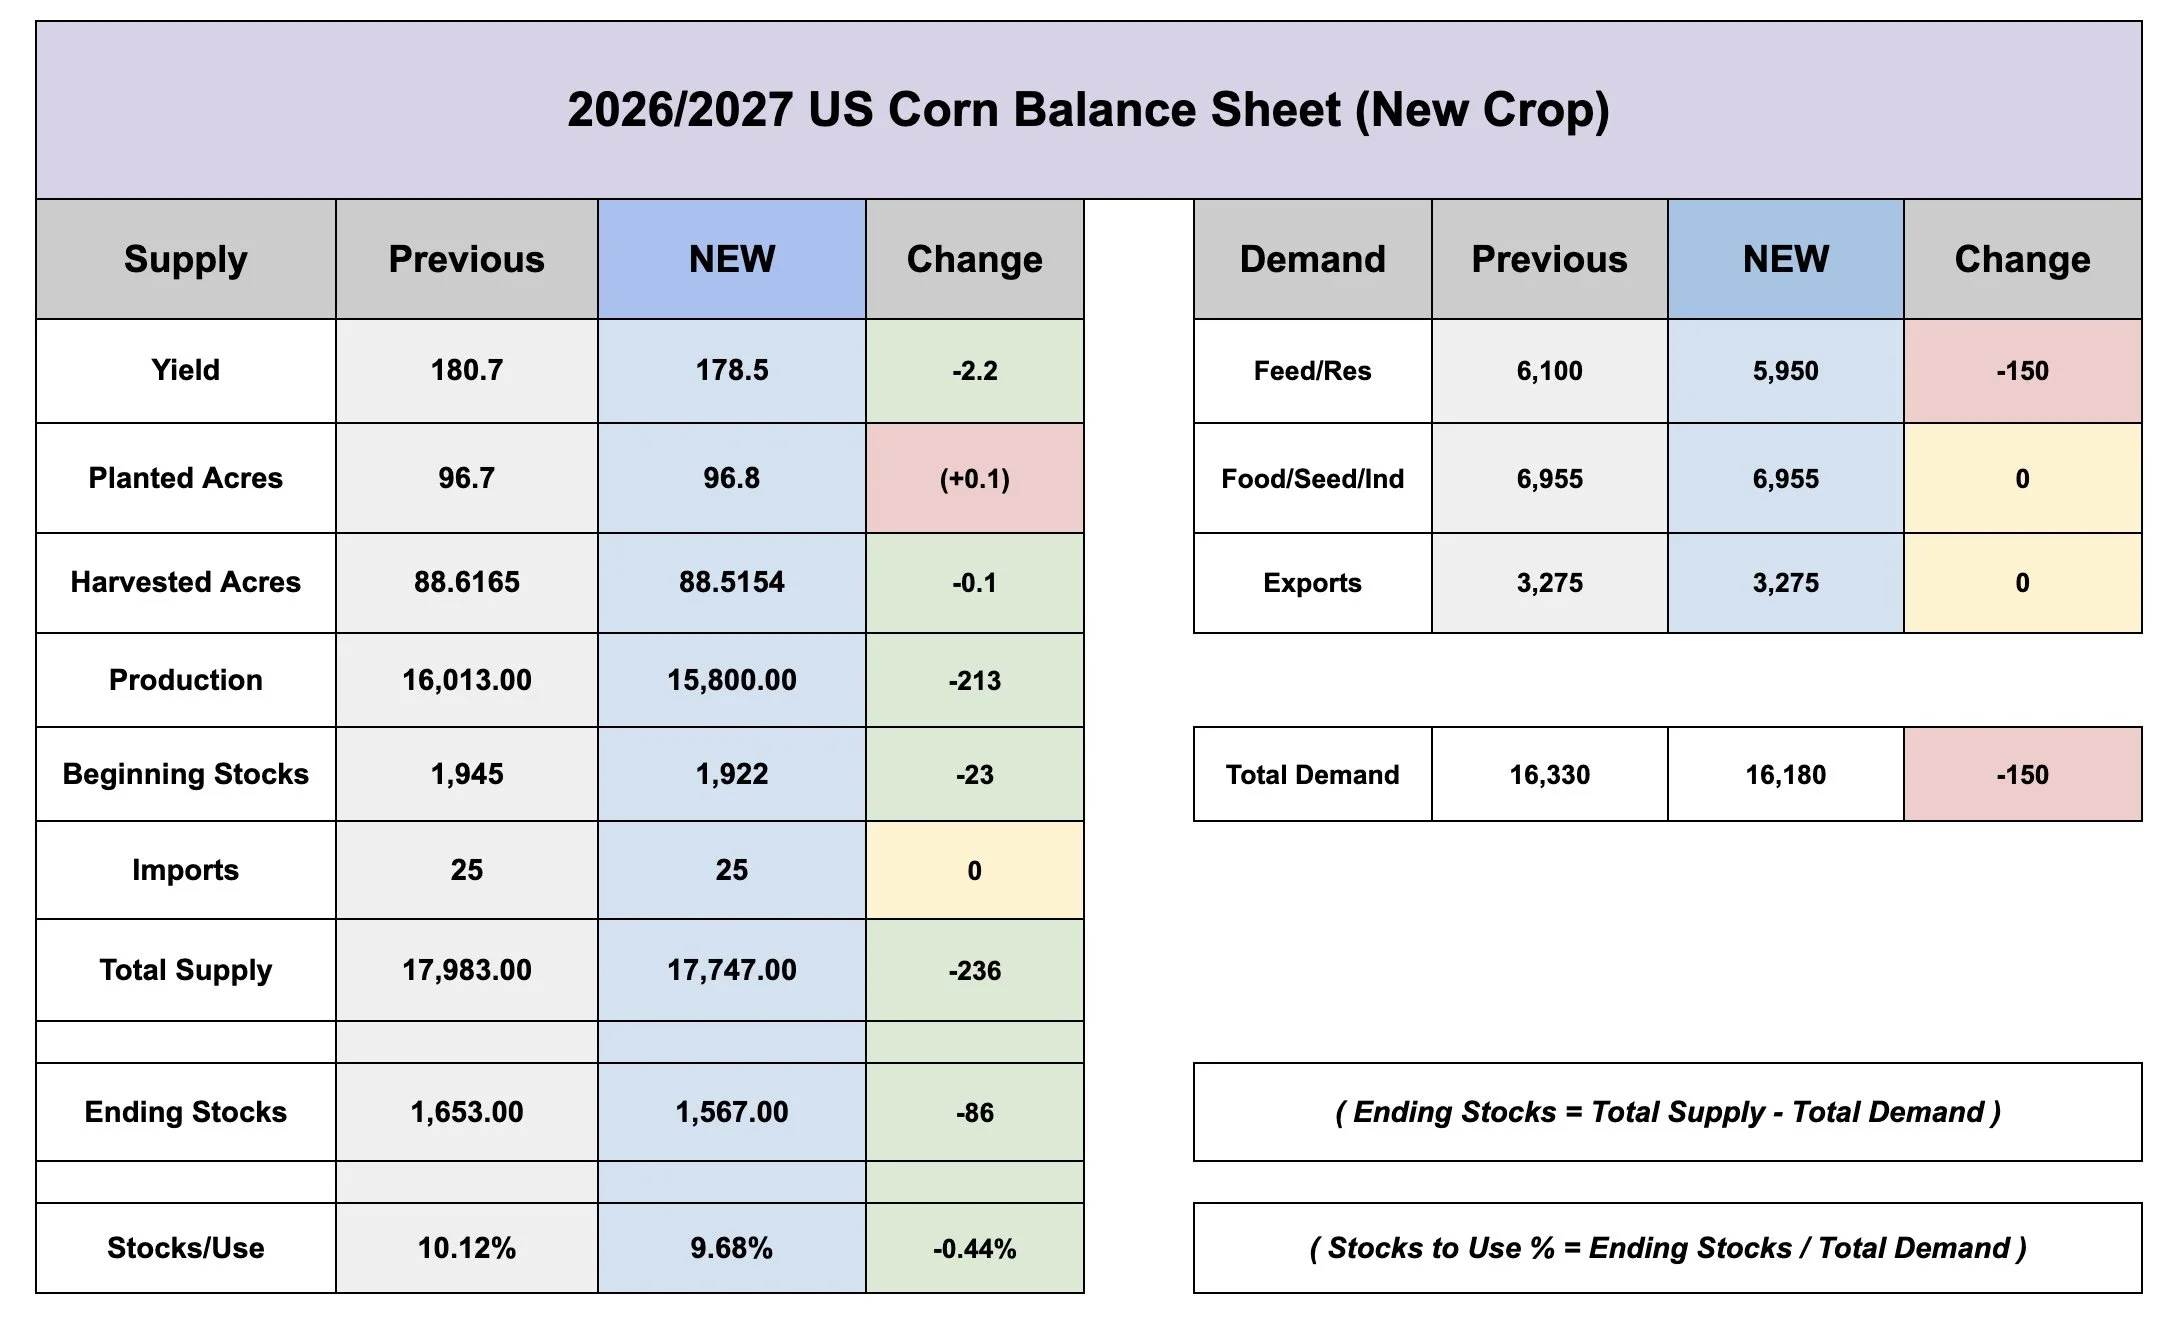
With the cut to yield, we saw supply drop -235 million bu.
However.. the USDA then offset more than half of this with a cut to the feed and residual demand. As they cut it by -150 million.
As a result, our carryout dropped -86 million bu.
One other thing to note is that our stocks to use is now offically below 10%. Coming in at 9.68%. We will get into this more later.
Next for soybeans.
New Crop Soybeans:
They left the old crop balance sheet completely unchanged. So here is the changes to new crop.
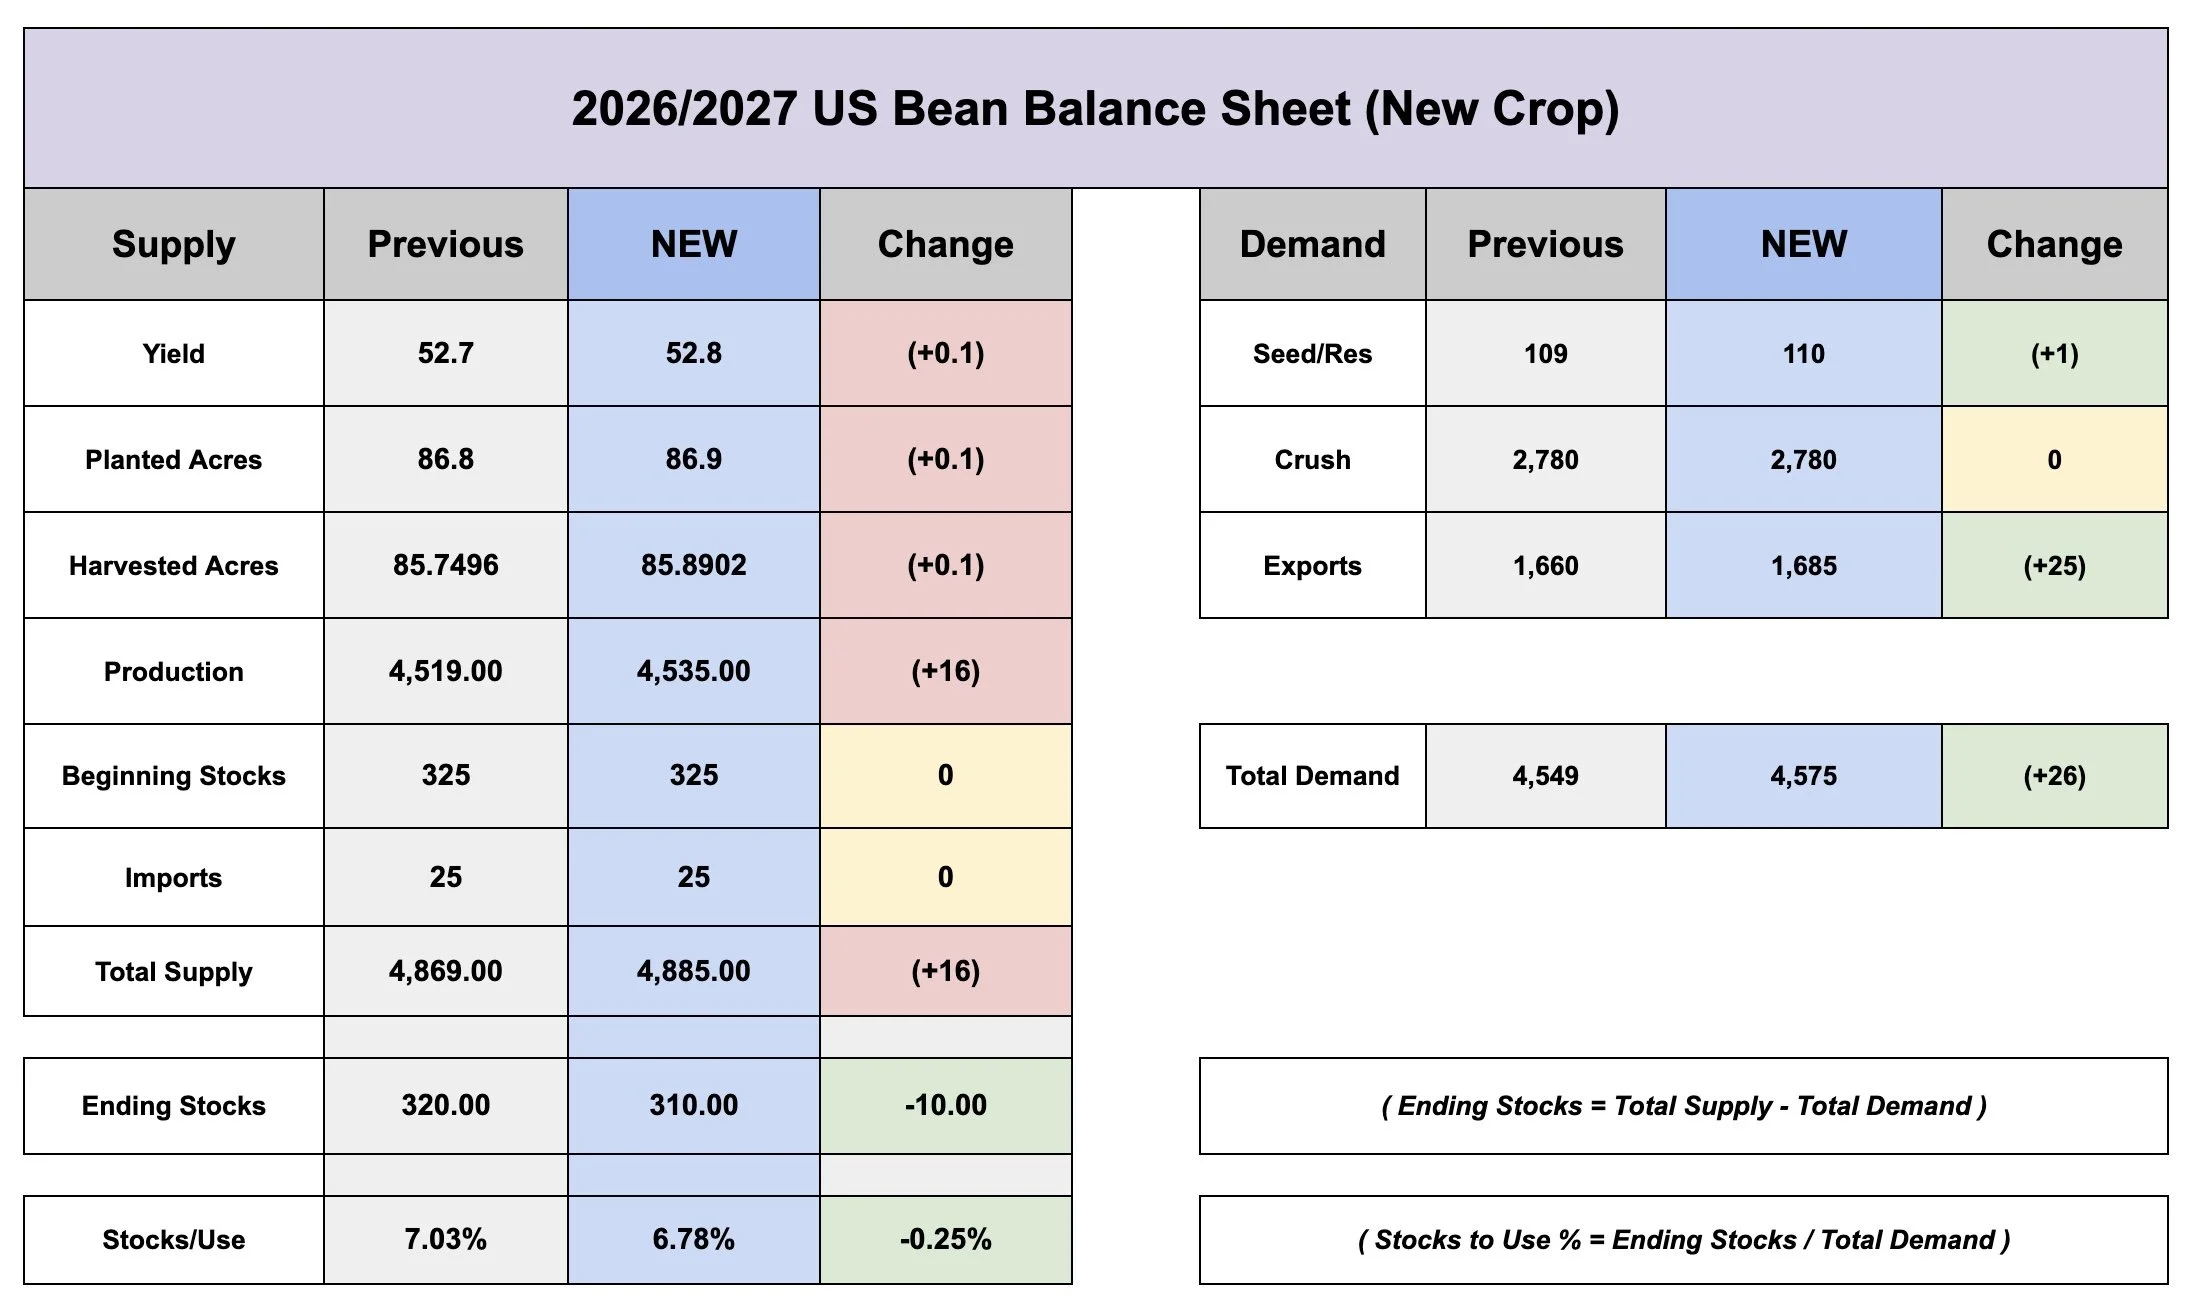
We saw supply increase +16 million bushels with the bump in yield and acres.
However, the USDA then raised exports by +25 million.
So the net result was the carryout dropping -10 million down to 310 million.
Today's Main Takeaways
Corn
Did this report change anything?
On the surface, this wasn’t a "bullish" report.
If anything I would simply call it neutral.
We saw yield drop as the market was expecting, but it wasn’t a large enough drop to get the bulls super excited here.
The market was expecting less supply and that's what we got. There is a reason the market has ran the way it has the last month. The cut to yield was priced in.
Although the report wasn’t overly bullish, it does open the door for more yield cuts.
Typically, small crops get smaller. We've seen cuts in back to back reports, so the trend of this crop is smaller.
If the USDA would have printed a 180 yield we would have seen an absolute blood bath. But they cut like the market thought they would. Just not more than was already priced in.
The USDA not magically finding more acres was nice too. As all of those magic acres were what really butchered things last year.
The most interesting part about this report?
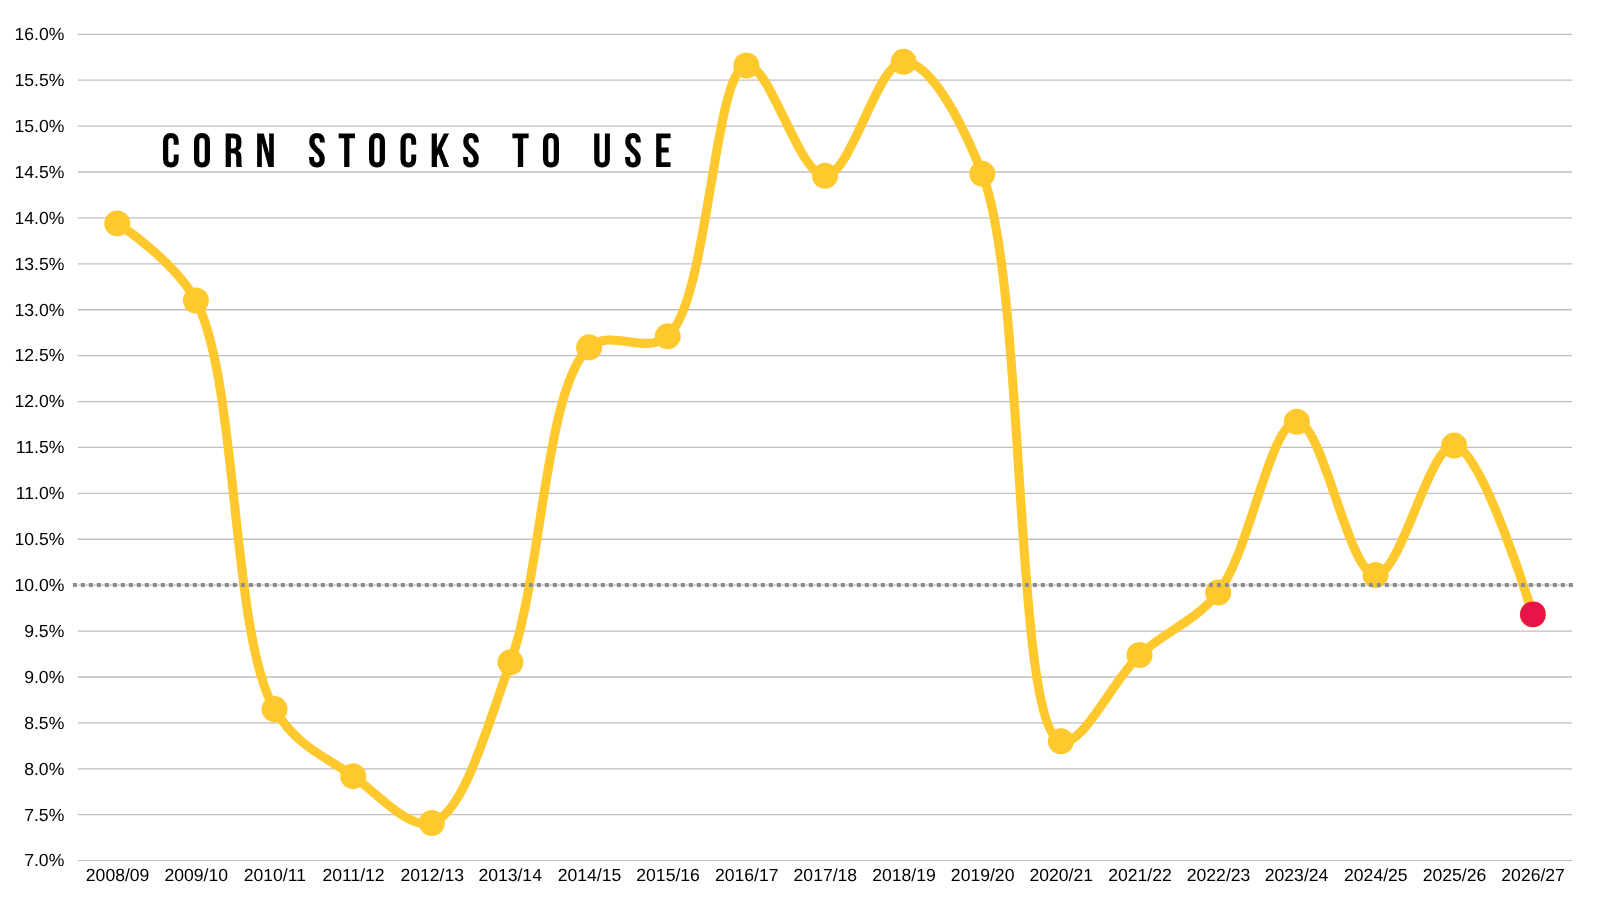
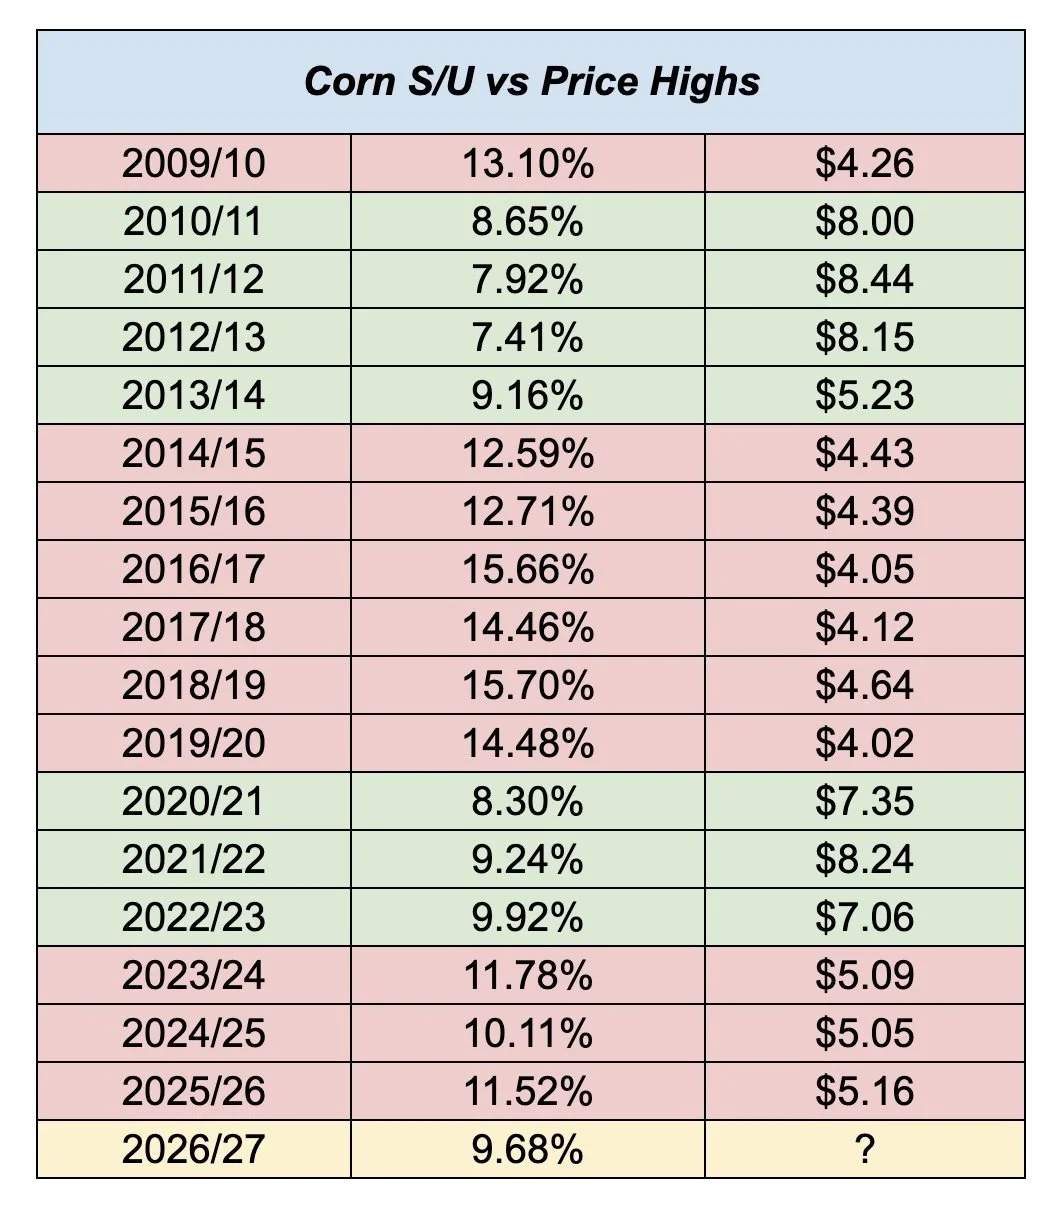
We officially have a new crop balance sheet with a sub 10% stocks to use ratio.
It came in at 9.68% as we mentioned.
This would be the first time we've been below 10% since 2022/23's 9.92%.
And it would be the tightest since 2021/22's 9.24%.
So the report itself wasn’t necessarily bullish given the market was already pricing in a smaller crop, but the balance sheet for corn is still the most bullish it's been in years.
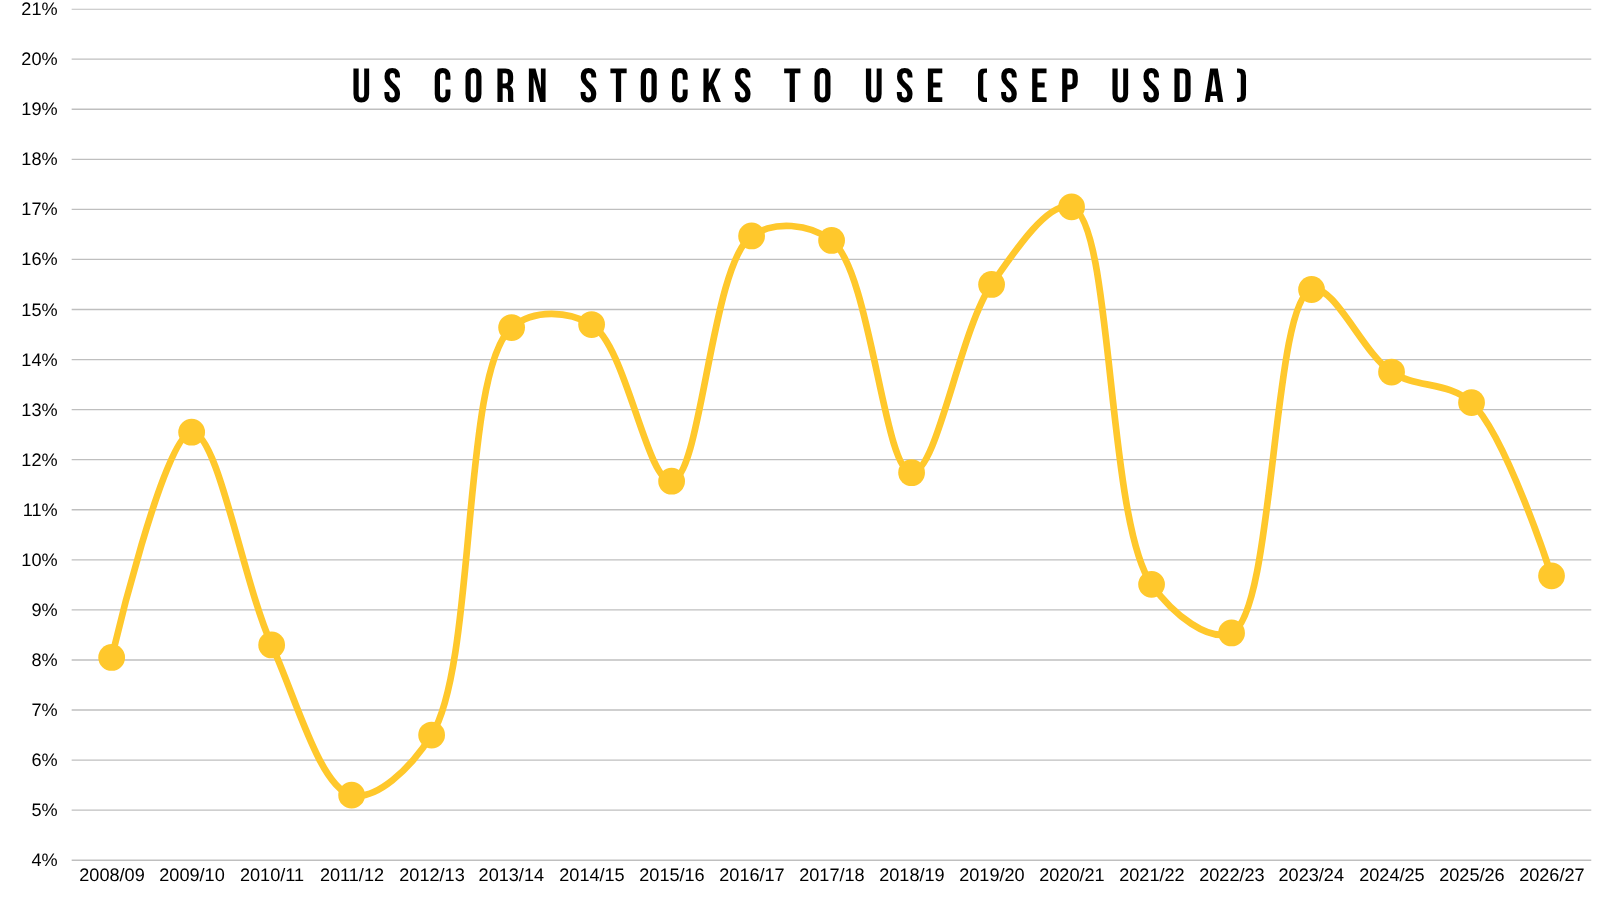
If you look at it based on where we were during the Sep USDA report.
This number would be one of the tightest in recent memory.
Almost on par with 2021 and 2022.
We are starting in a much tighter spot than we have the last several years.
The stocks to use has a very high correlation to prices.
It's probably the best way to gauge the outlook for corn.
Here is an update on the stocks to use vs corn prices.
Right now, we are entering into that bullish territory.
Bear markets happen above 12.5%.
Bull markets happen below 10%.
We are no longer in a bear market.
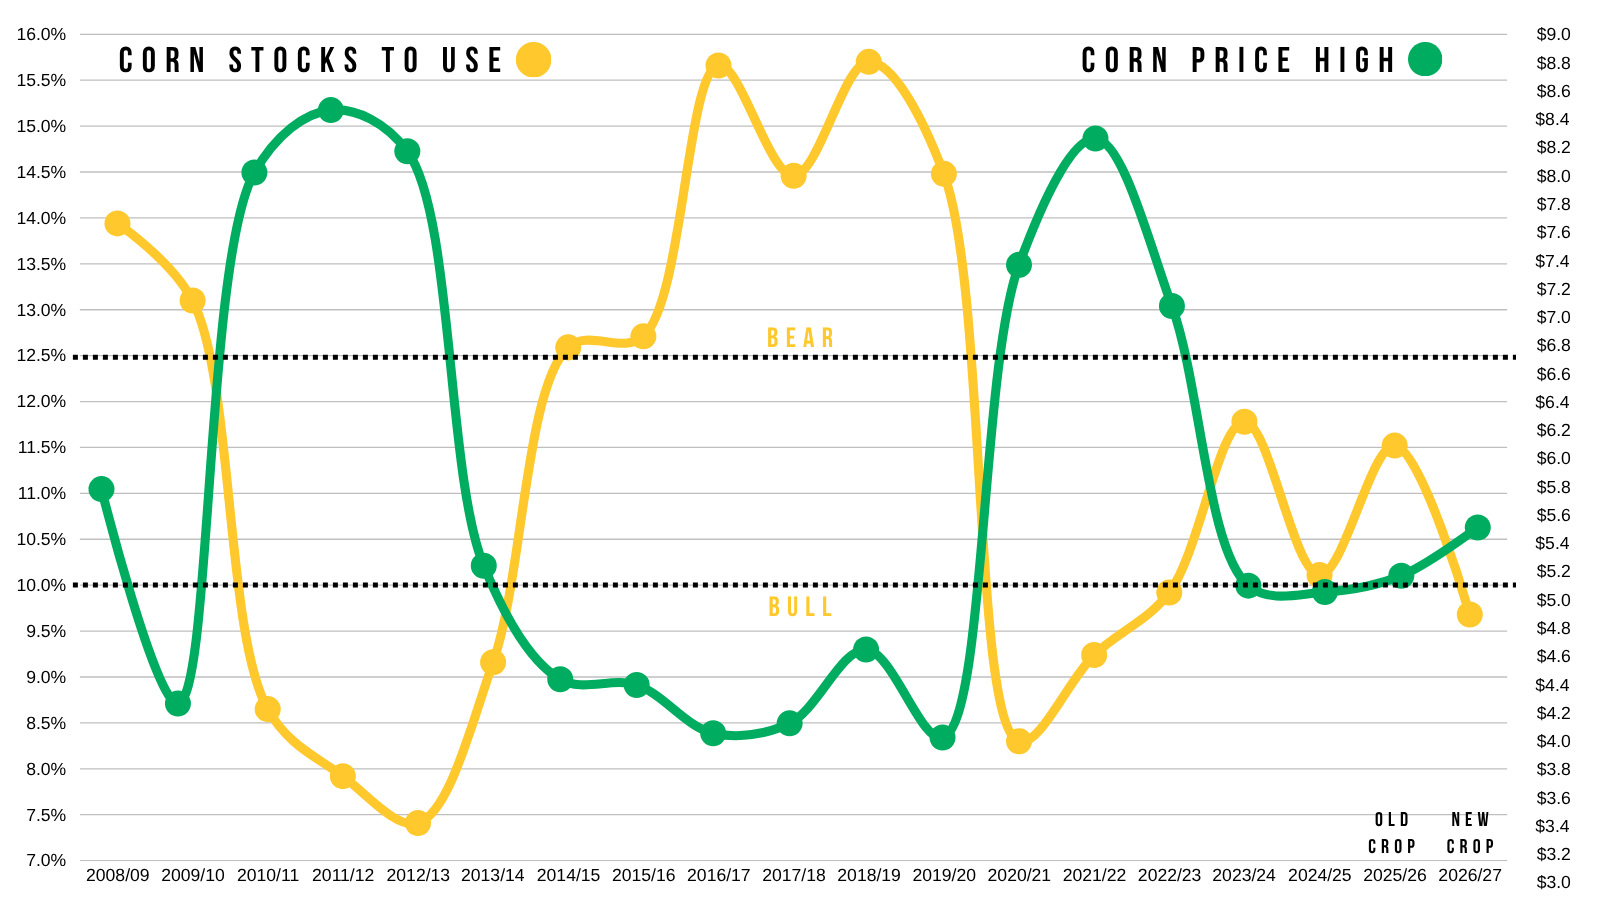
As we have talked about countless times, that 10% level is traditionally the threshold you need to see to get higher priced corn.
The 12.5% to 15% range is associated with bear markets.
The 10% to 12% range is somewhat in no man's land. Not mega bearish but not really bullish. Which is where we've been the last few years.
Below 10% is typically where you get bull market prices. When that stocks to use starts to crawl into the 8% to 9% range.
The chart above gives a pretty good visual of this. As it outlines bull market and bear market territory, along with the middle.
We are now below 10%, so this is no longer a bear market, but we likely need to see this get closer to 8% or 9% if we want to see $7 to $8 corn.
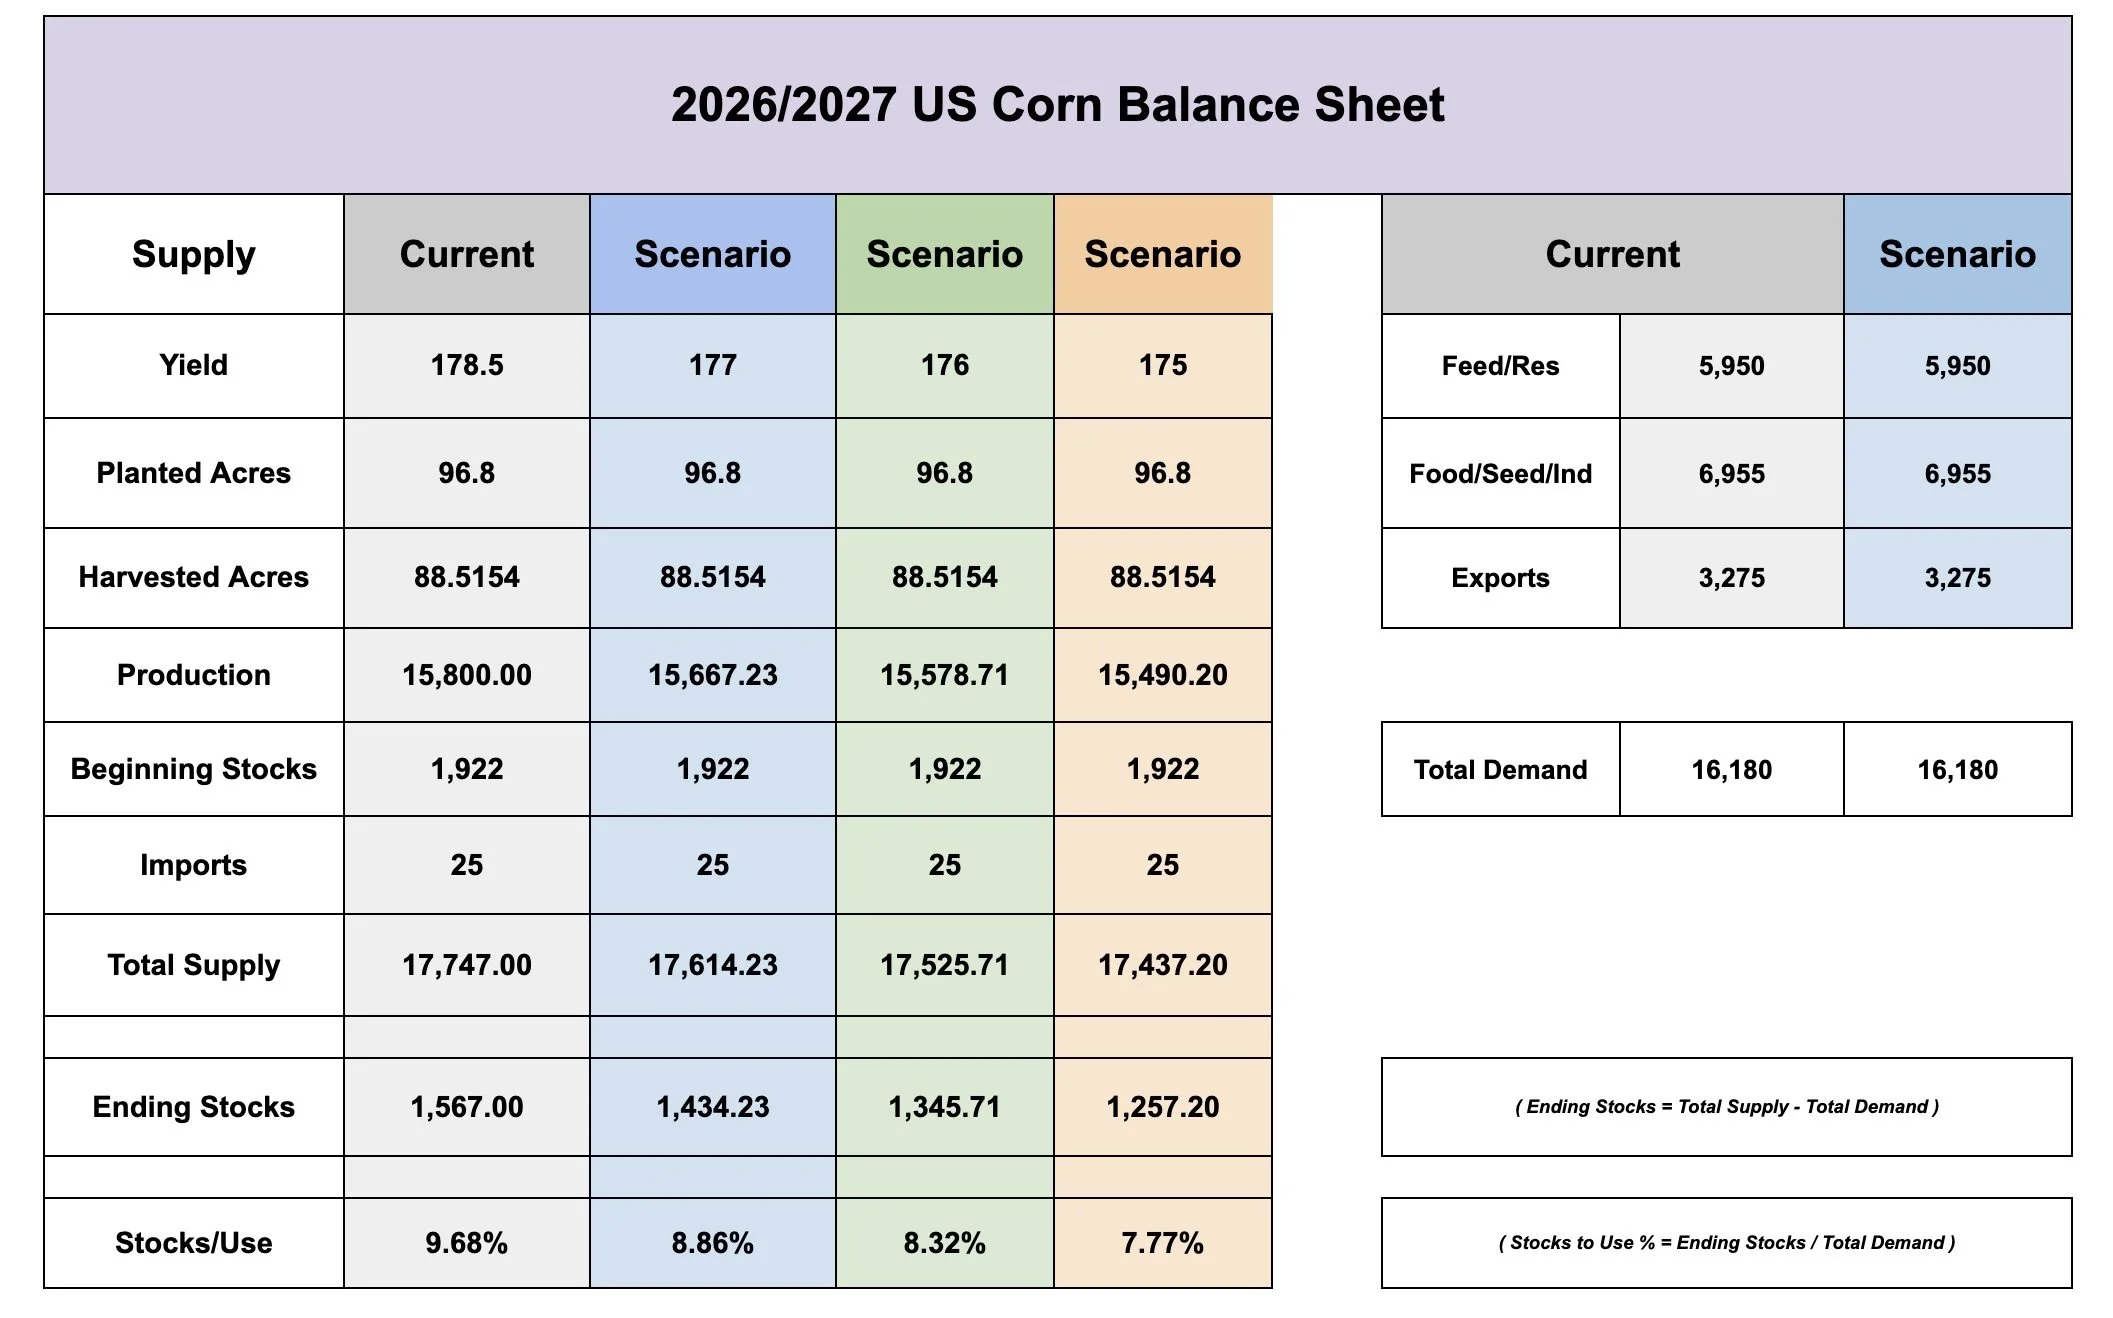
Here are some updated balance sheet scenarios based on yield changes.
All of these are before any adjustments to demand.
But purely by lowering yield, there is a real chance that this stocks to use gets pretty dang tight into that 8% to 9% range.
A 177 yield before changing demand gives you an 8.9% stocks to use.
I do also think that the USDA should eventually raise the old crop exports even further. They bumped them by 25 million today, but I think they should be at least 75 to 100 million higher or possibly even more.
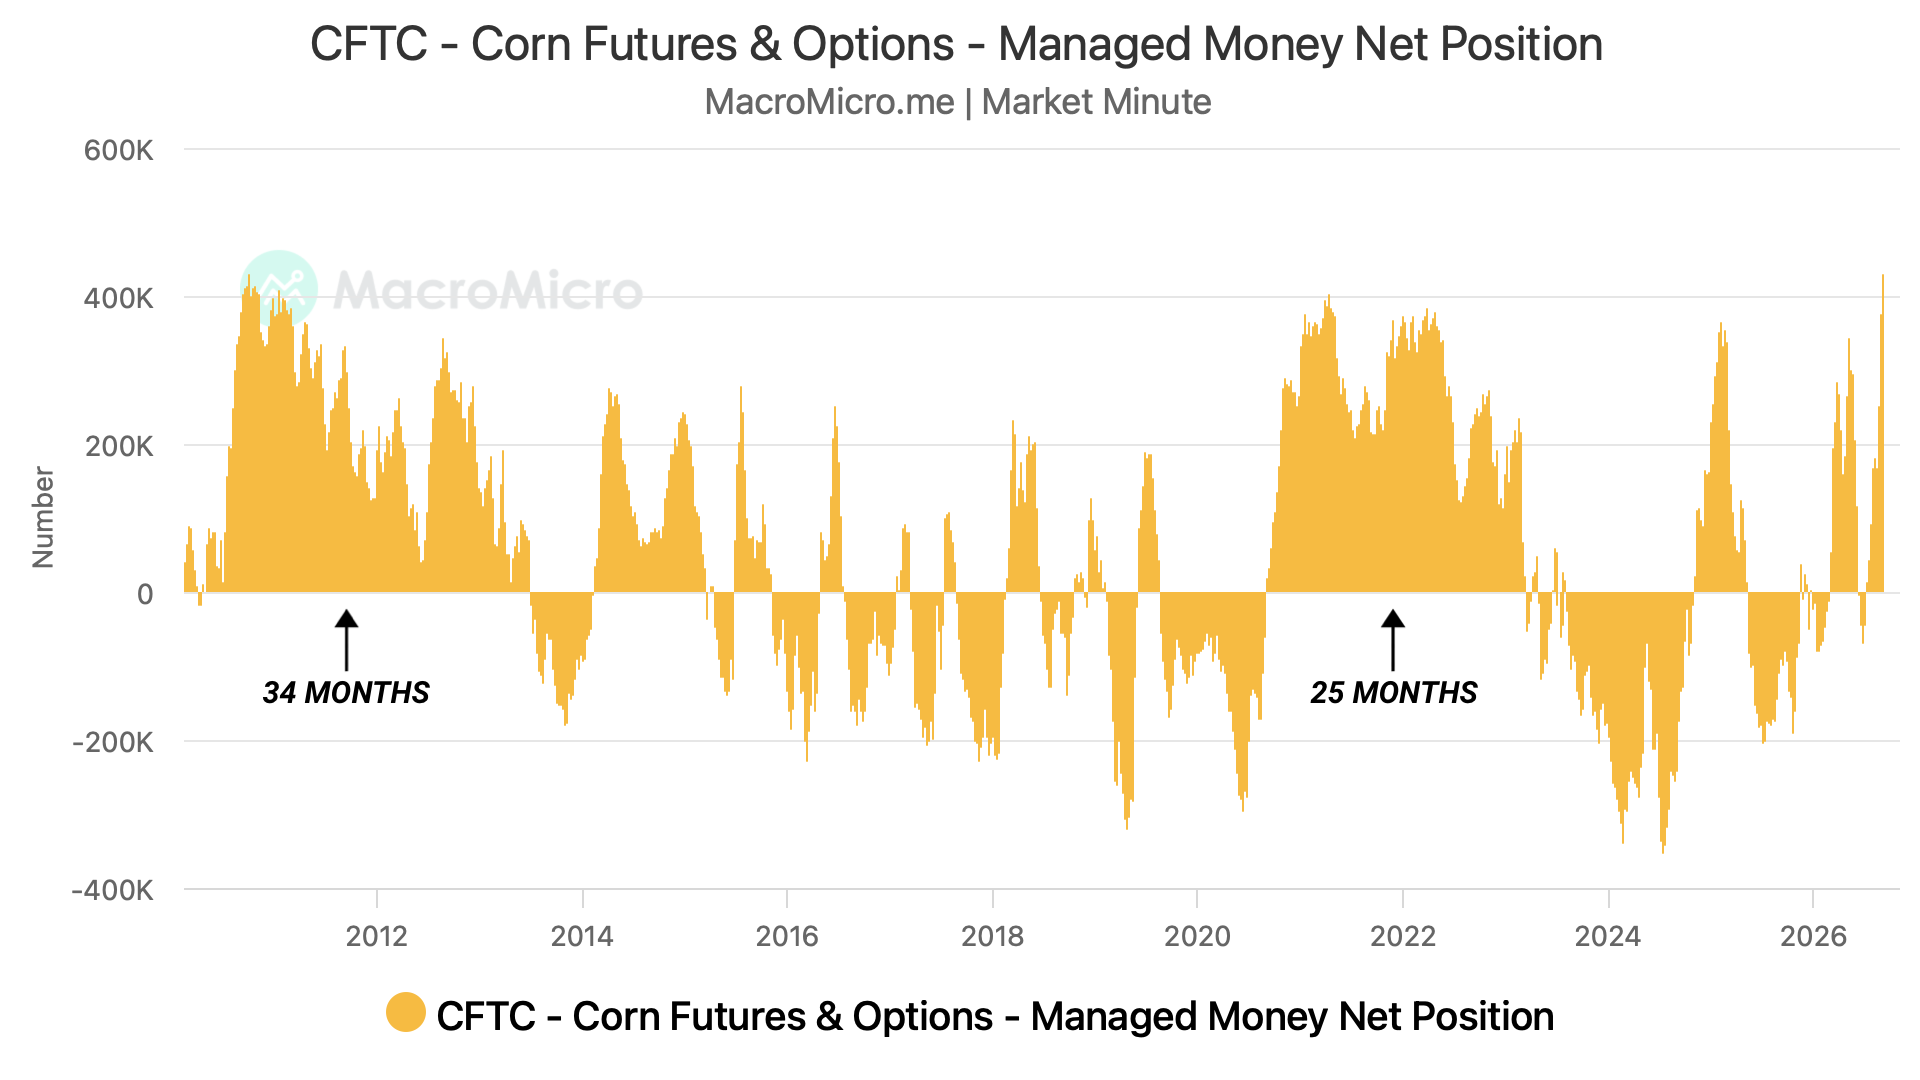
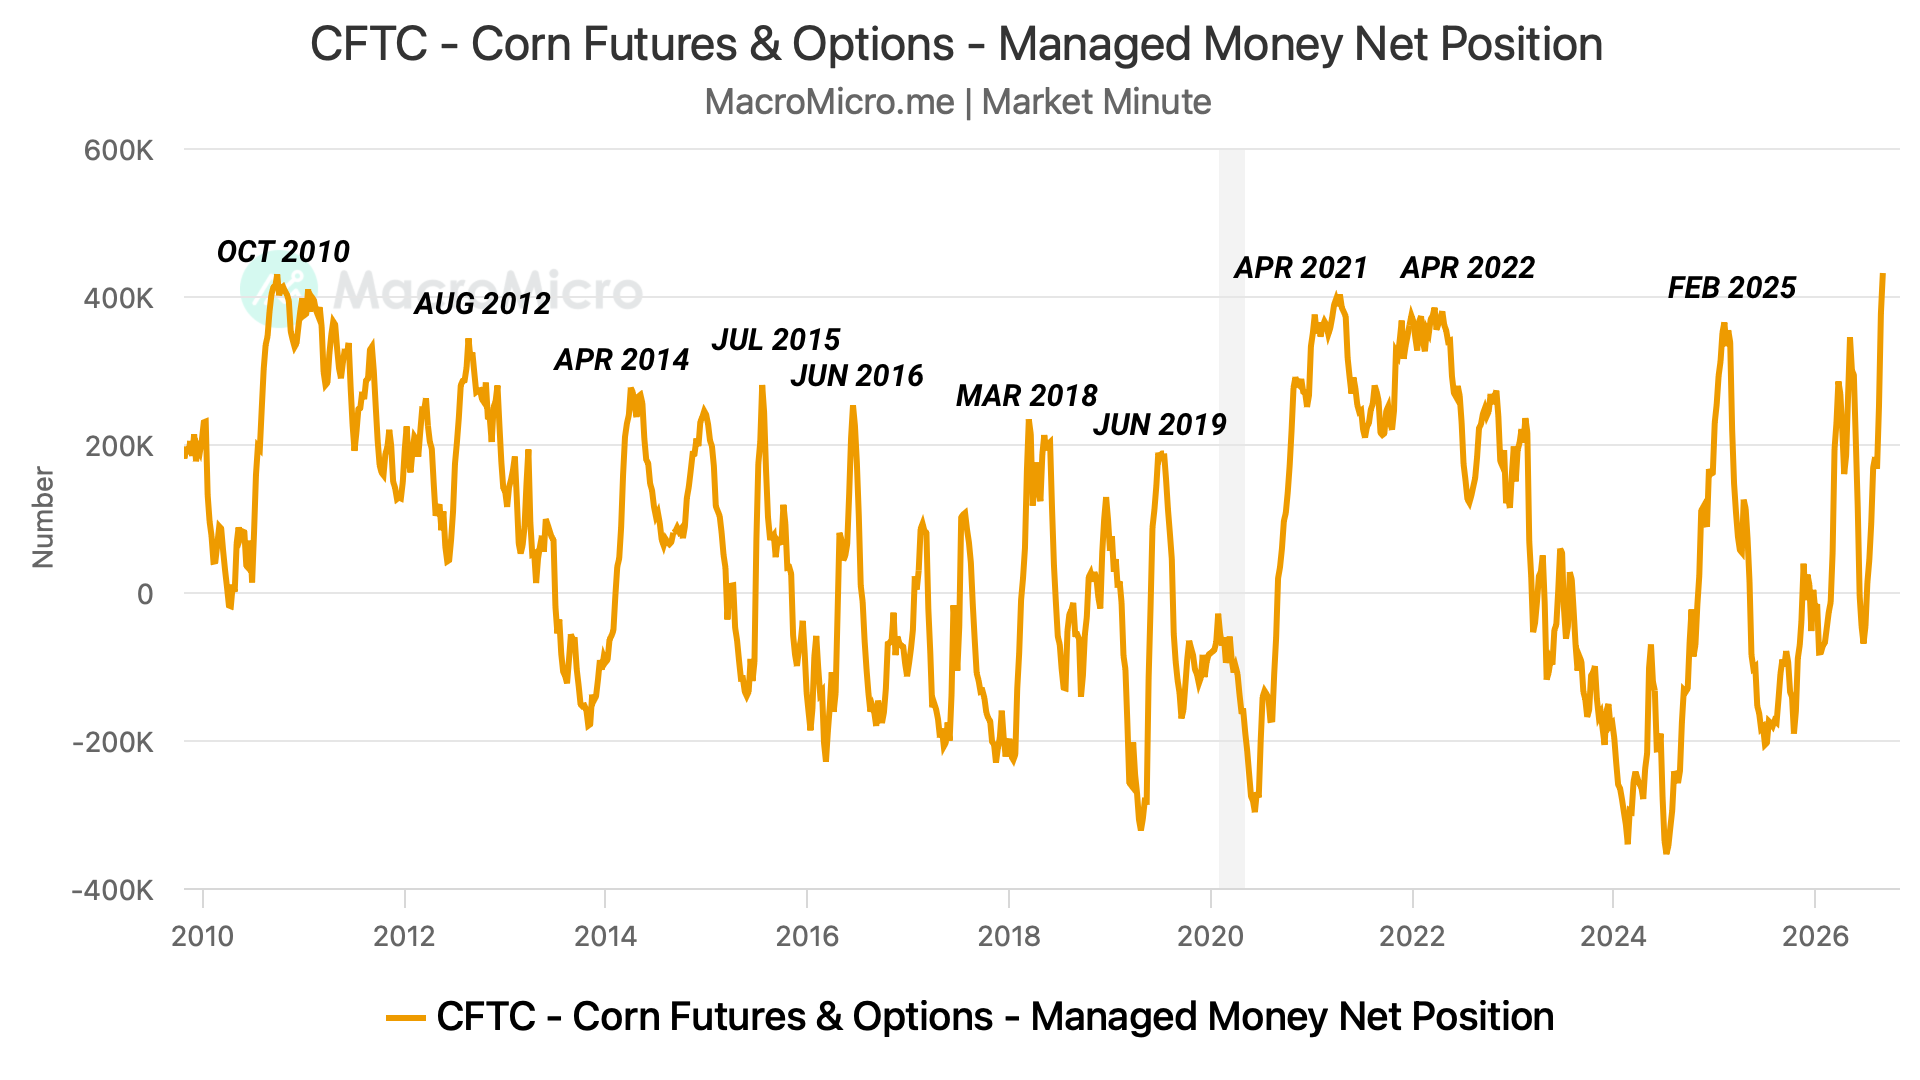
The Funds: Record Long
We went into this on Tuesday.
But the funds are record long both corn and soybeans right now.
Does this mean the rally has to be over? No.
It could mean that the funds might look to take some profits, but doesn’t mean they have to full on puke out.
There are only 3 times the funds have been long +400k contracts.
2010, 2021, and today.
How long did they stay long the last two times?
In the 2010 run, they were long for 34 months.
In the 2021 run, they were long for 25 months.
So both were 2-3 years.
Could you they full on exit? It's always possible. But I don’t see them giving up that long without a reason. I think they'll defend it for the most part, as I don’t see a reason for them to.
It doesn’t mean they can’t sell some. They don’t have to add here, but they don’t have to get short either.
Most of the times where they get super long then randomlly puke out does tend to happen during the spring to summer time rather than towards the end of the year.
Aka summer supply scares and weather rallies.
This is more than just a traditional supply scare in June.
Corn Charts
Still Long Term Bullish, Still Short Term Cautious
Long term I am bullish on corn and the rest of the grains, as I see plenty of ways for higher prices down the road.
Short term, I am pretty cautious. As I have been for the last week if you watched my previous updates.
This pull back across all of the grains isn’t surprising, and actually viewed as healthy in my opinion.
Which is the reason we sent out that sell signal and hedge alert on September 2nd at the highs.
The alert was geared towards those who lack storage or are short on time. If you've got plenty of time, by all means stay patient. I want to keep as much dry powder as possible. The corn situation is not bearish.
If you missed the alert: Click Here to View
Short term, we could be in for a correction like we've talked about the last week or so. As we've been talking about this possible pull back.
We just had a massive rally. The funds are record long. I wouldn’t be surprised to see them take a little bit of profit while the farmer is going to be forced to sell off the combine.
We could get some harvest pressure. Then once the farmers are forced to sell, the market runs it back higher. But not before forcing people out.
That's my thought process here.
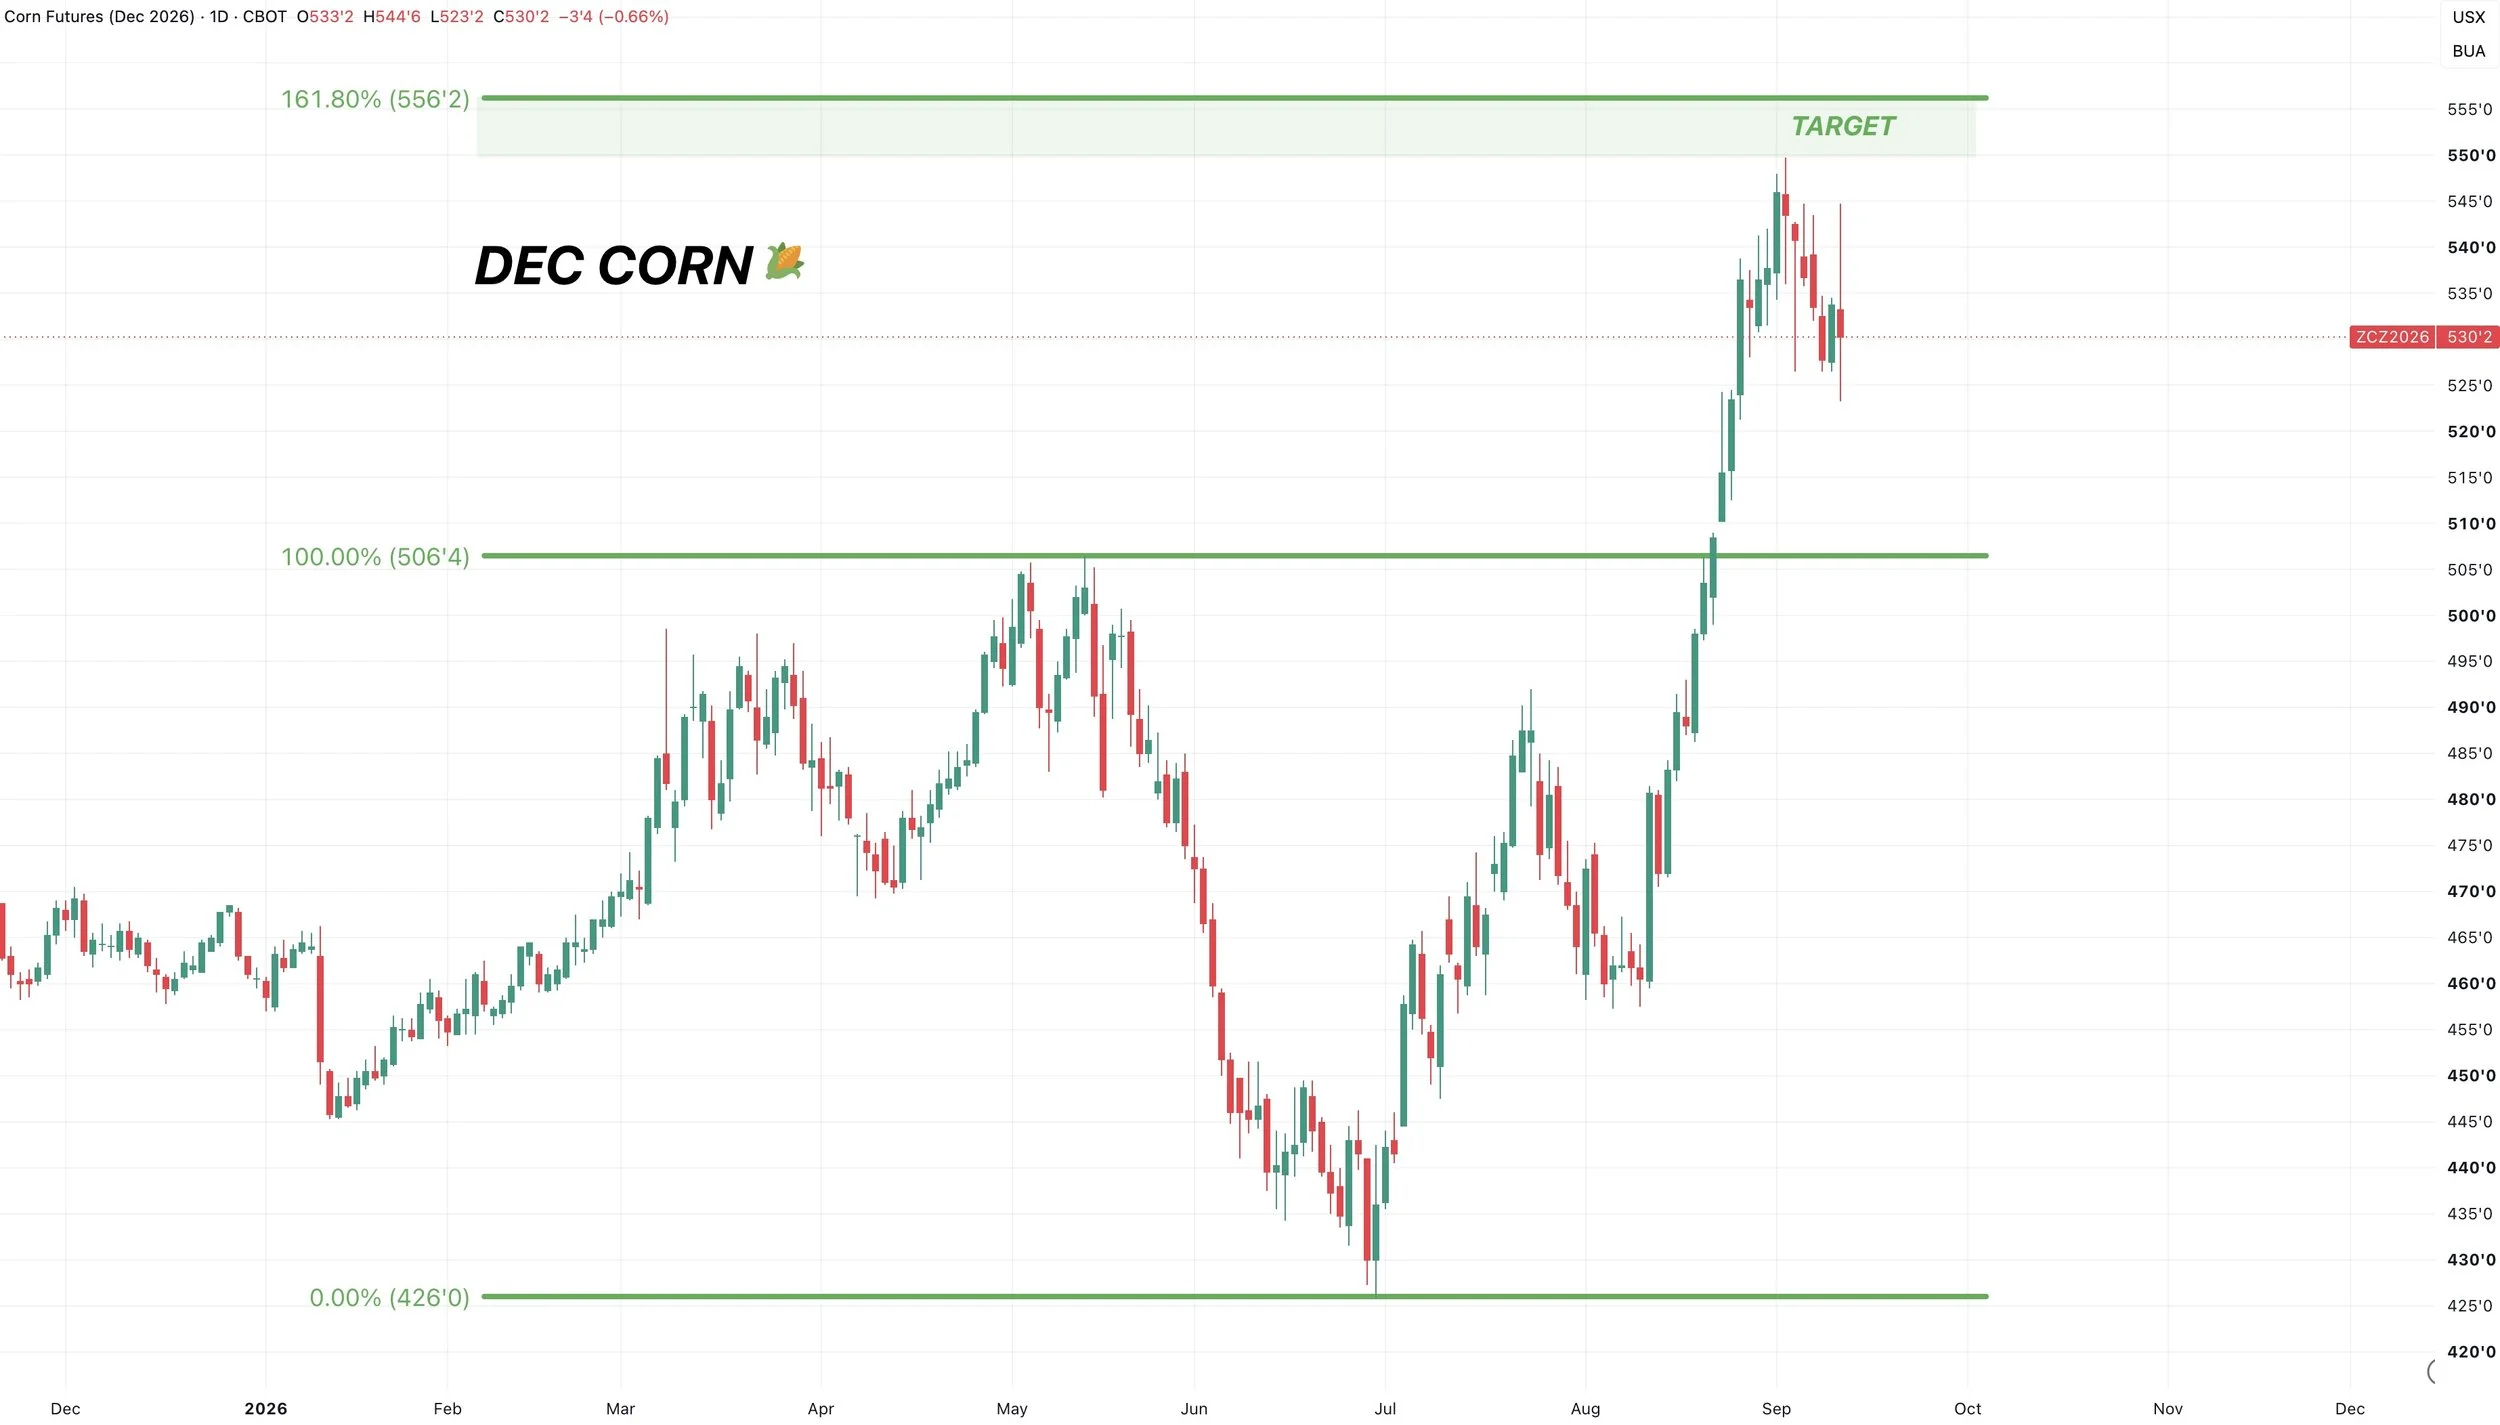
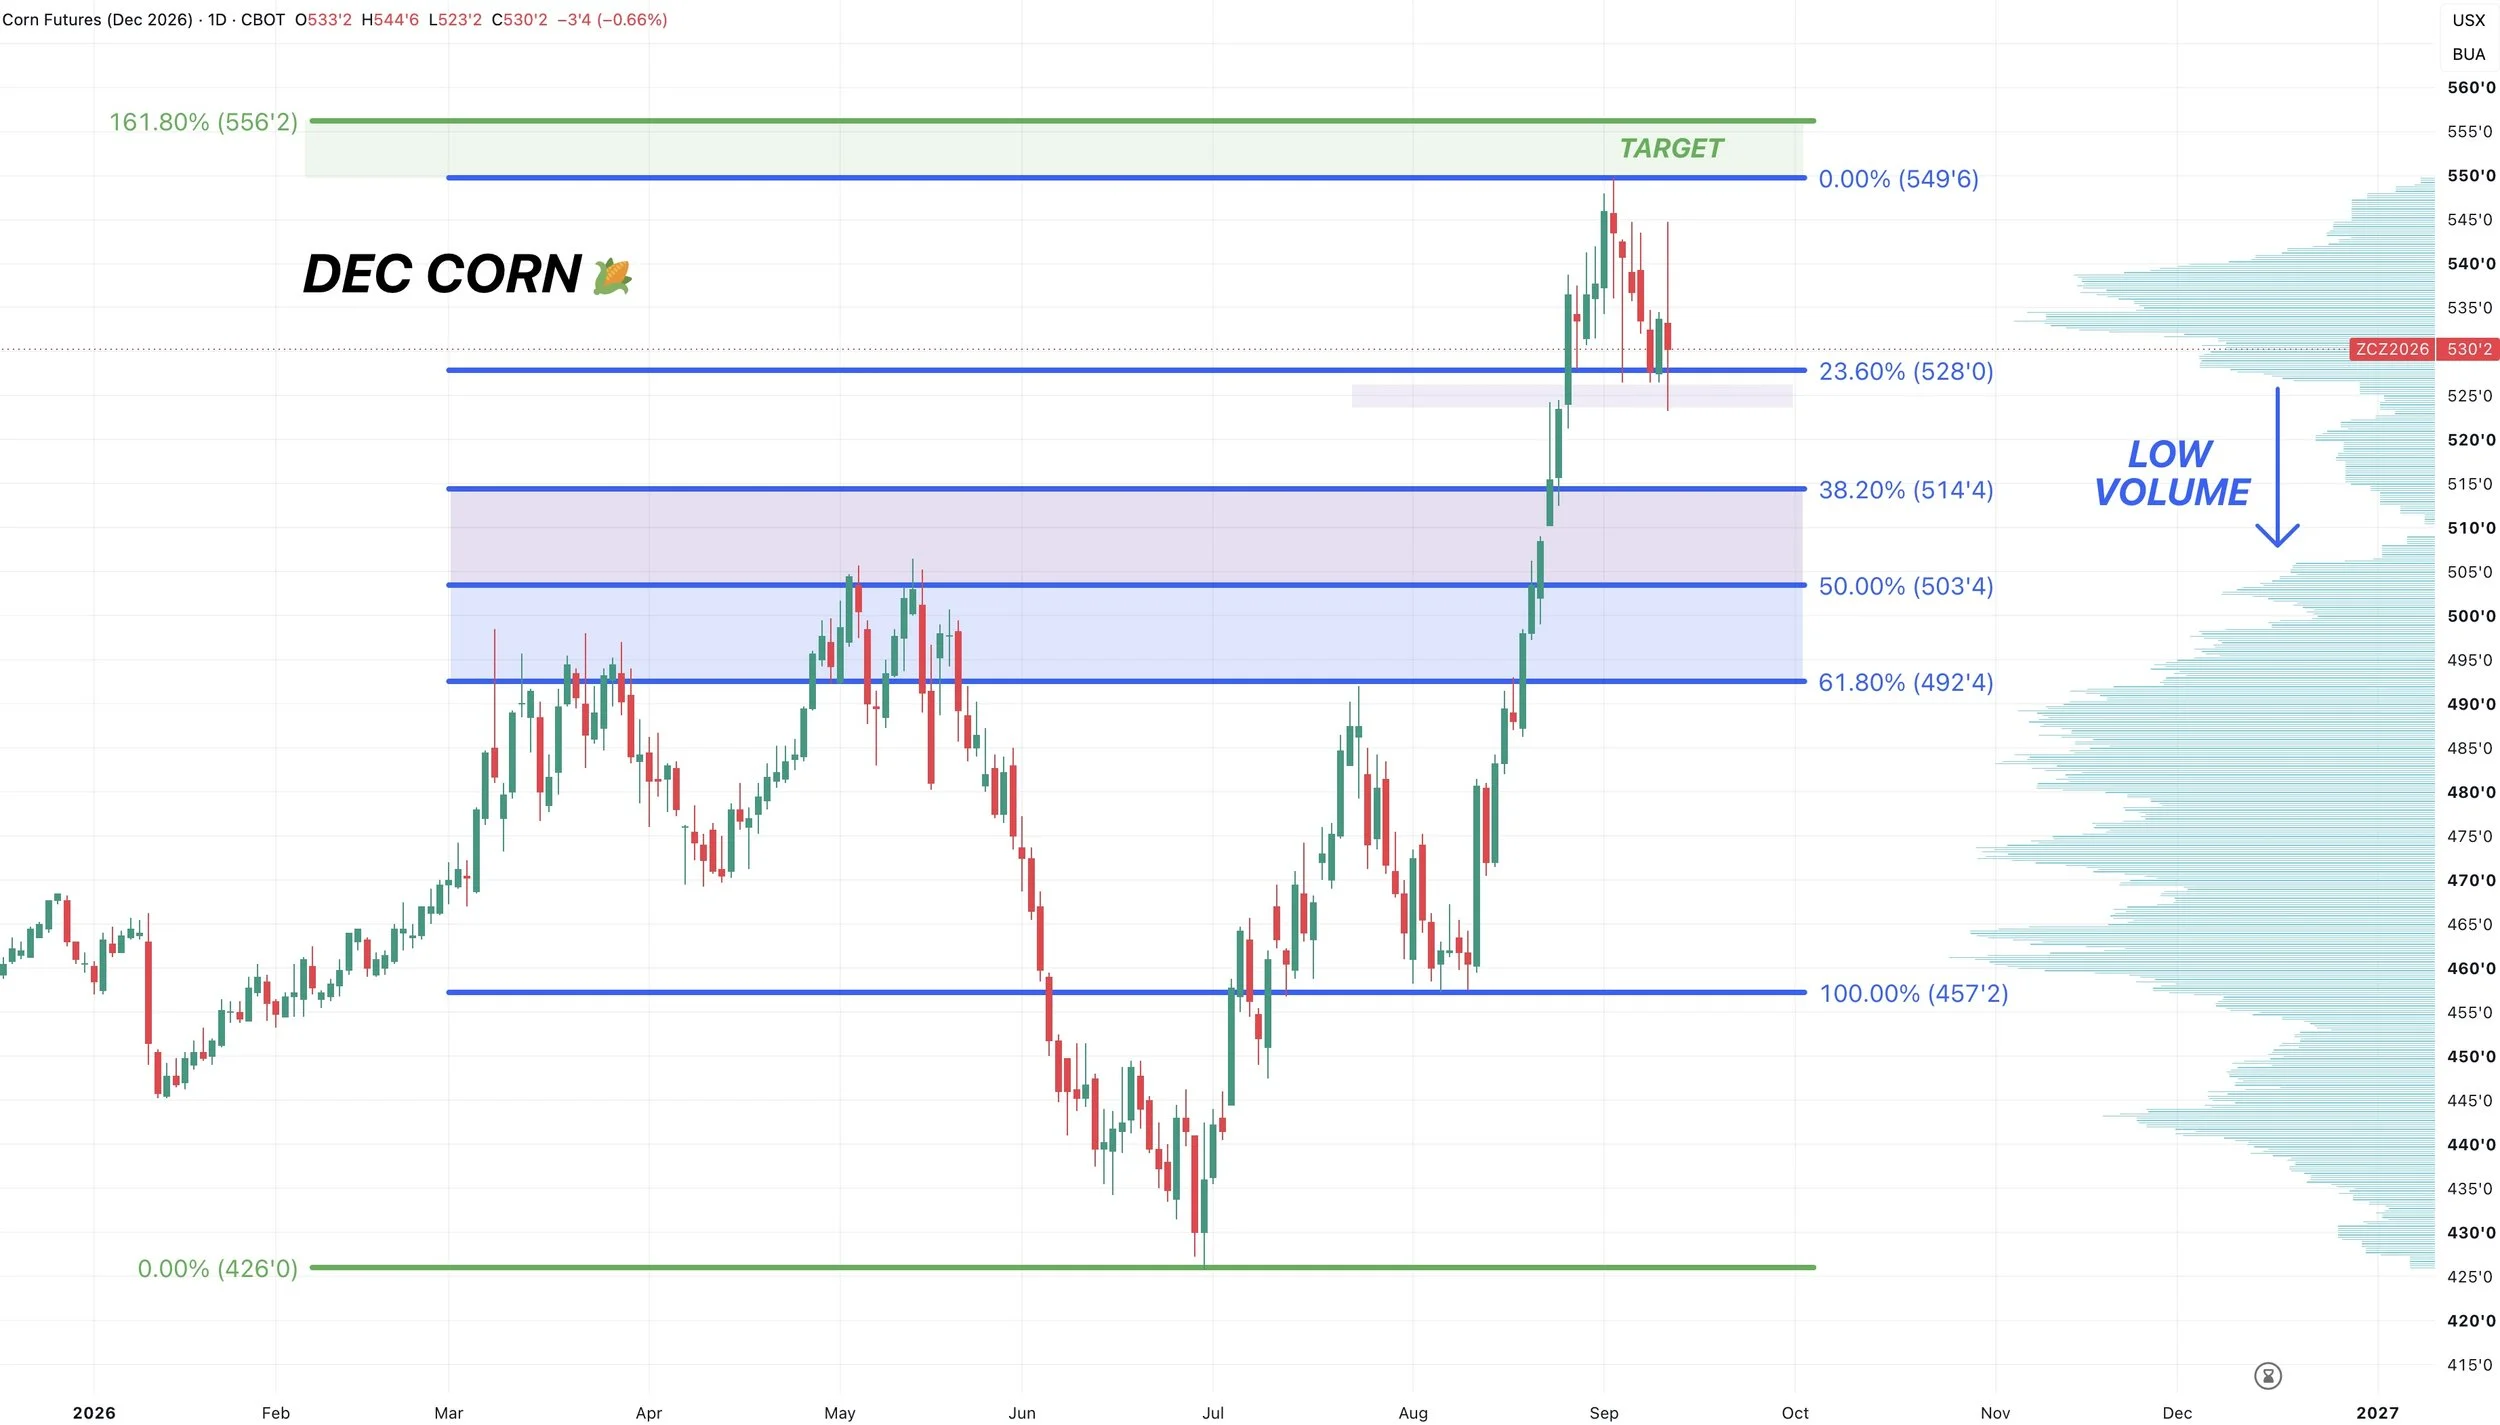
Dec Corn Daily Chart:
We hit that $4.50 target.
Today's price action was disappointing.
Right after the report, we went from down -8 cent to up +11 cents.
The market then digested the report, and we finished the day down -3 1/2 cents.
We had a huge range today. So today's highs and lows will be important. Whichever direction we break first probably decides the next leg and if it's higher or lower.
Indicators: Suggest Pullback?
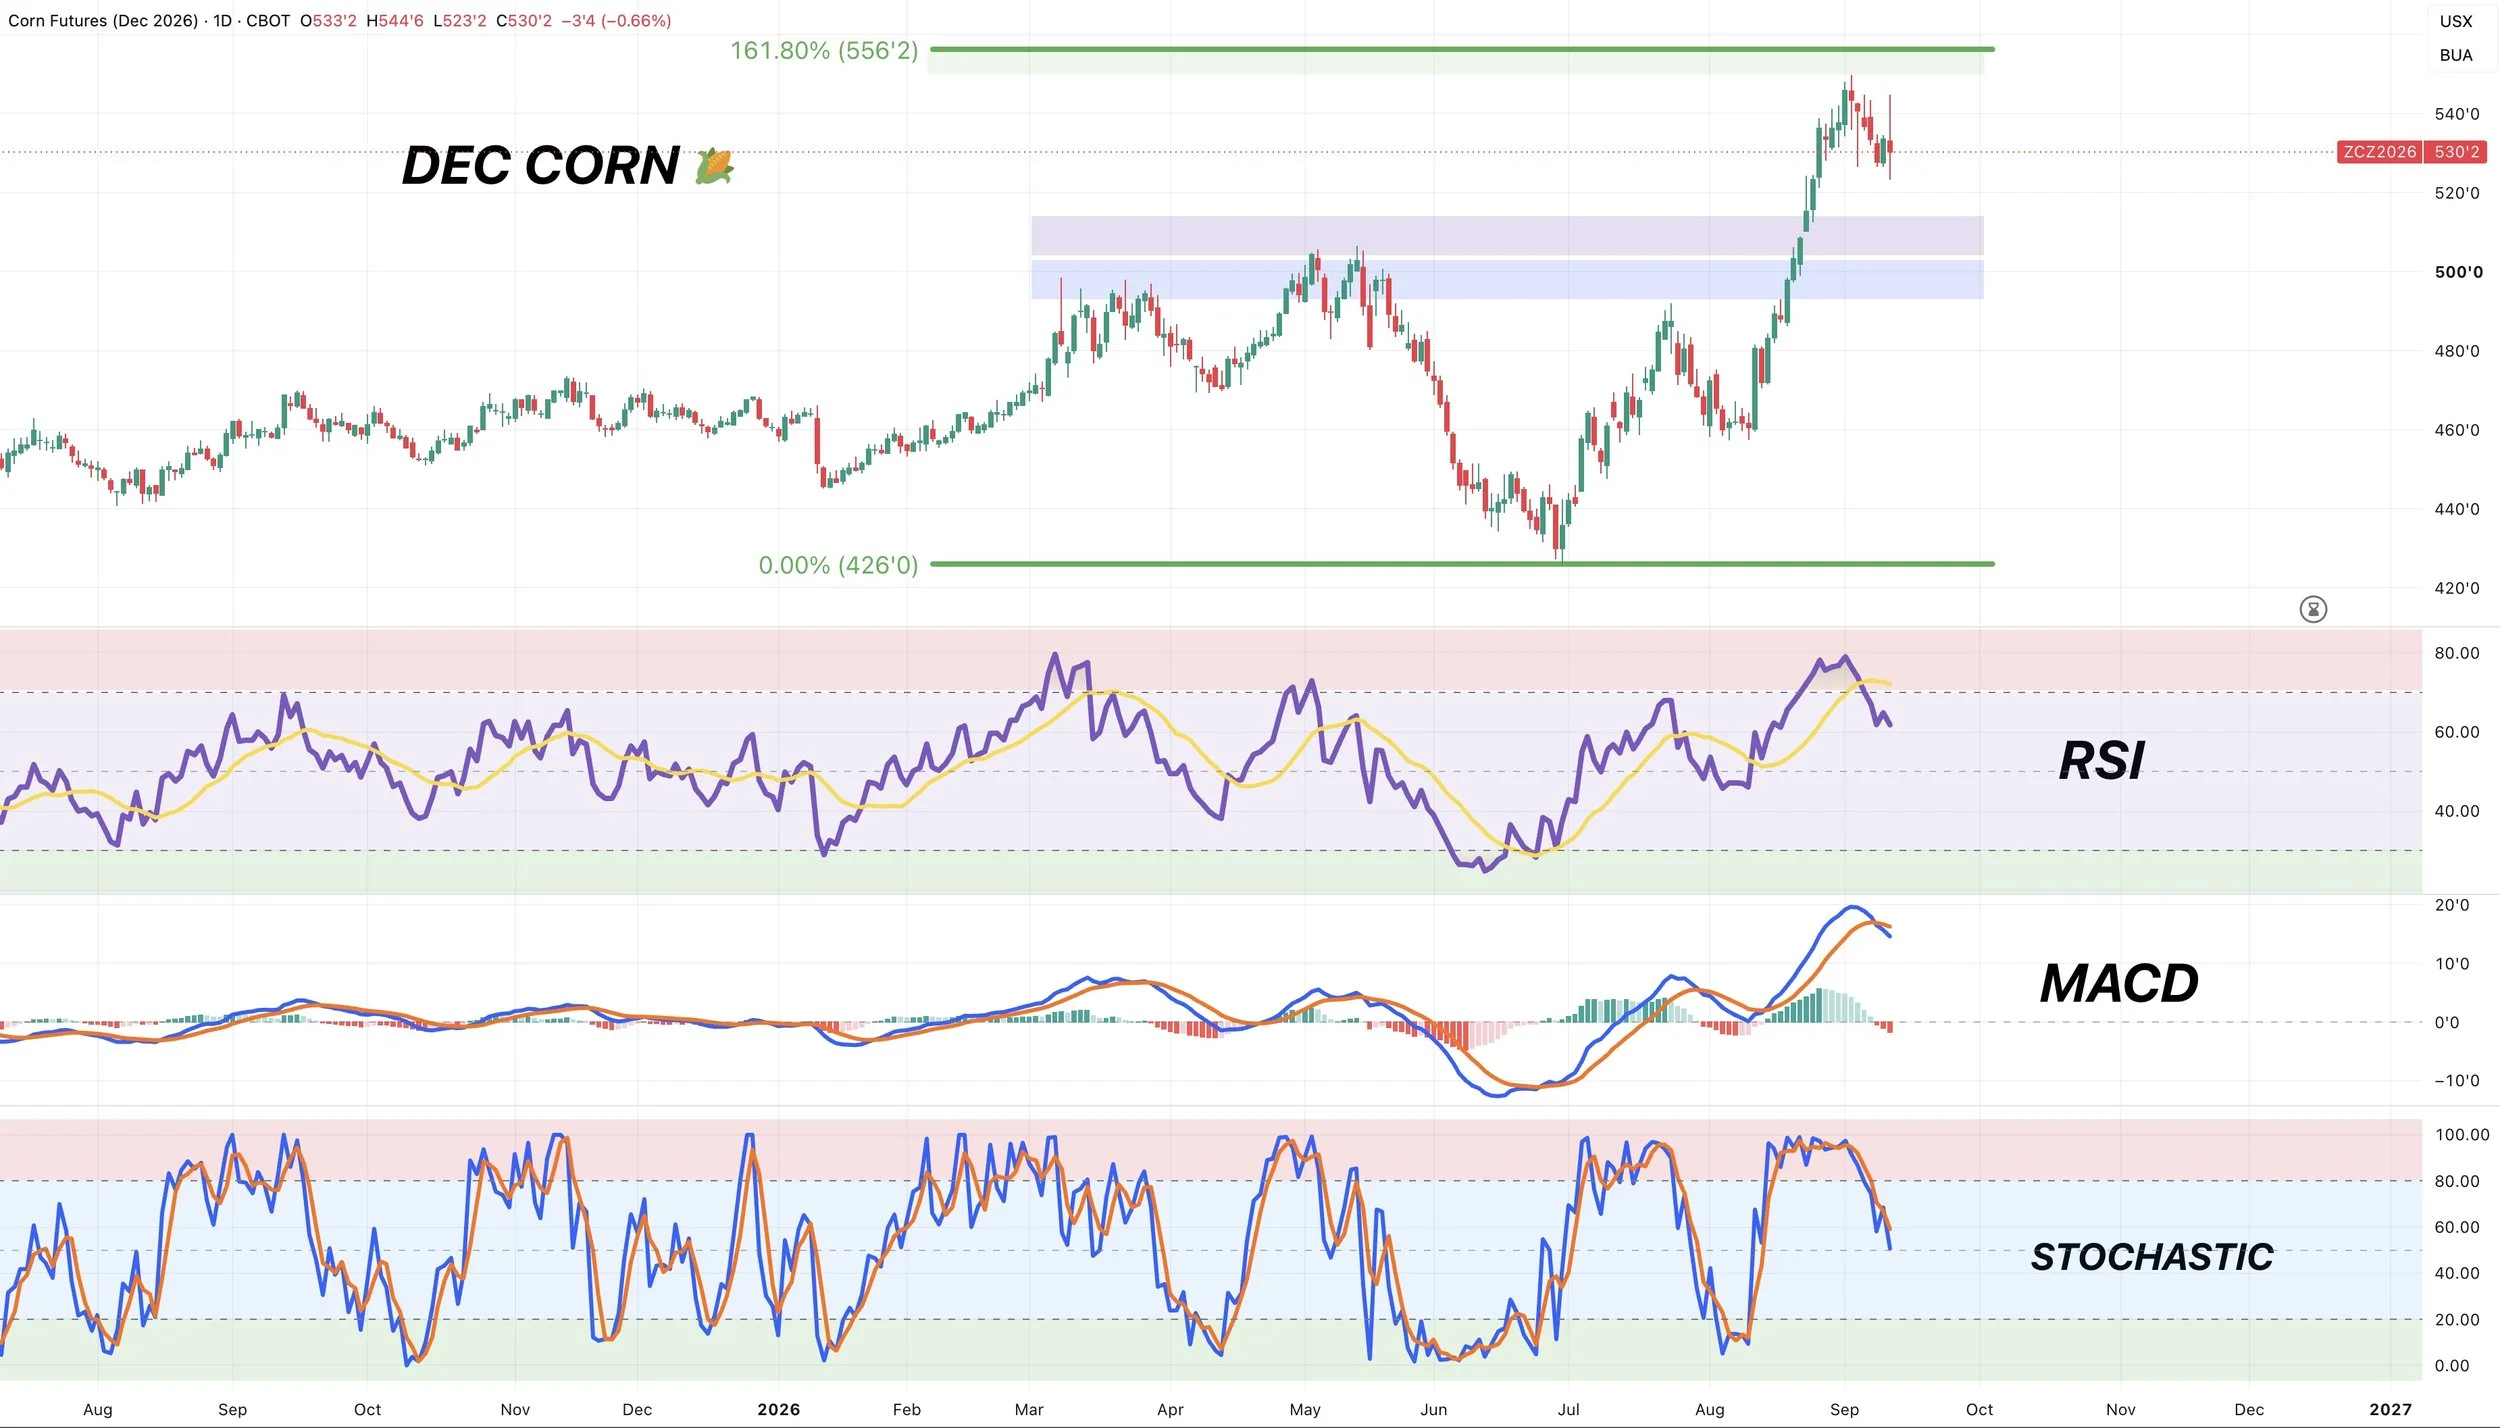
The indicators are something we talked about in last few updates as well.
The MACD crossed bearish. Suggesting mometum may be lower for now.
The market tends to make big bottoms when the stochastics are bottomed out. Right now they are not bottomed out, currently about half way there.
So that's something I will be watching when trying to hunt for a bottom.
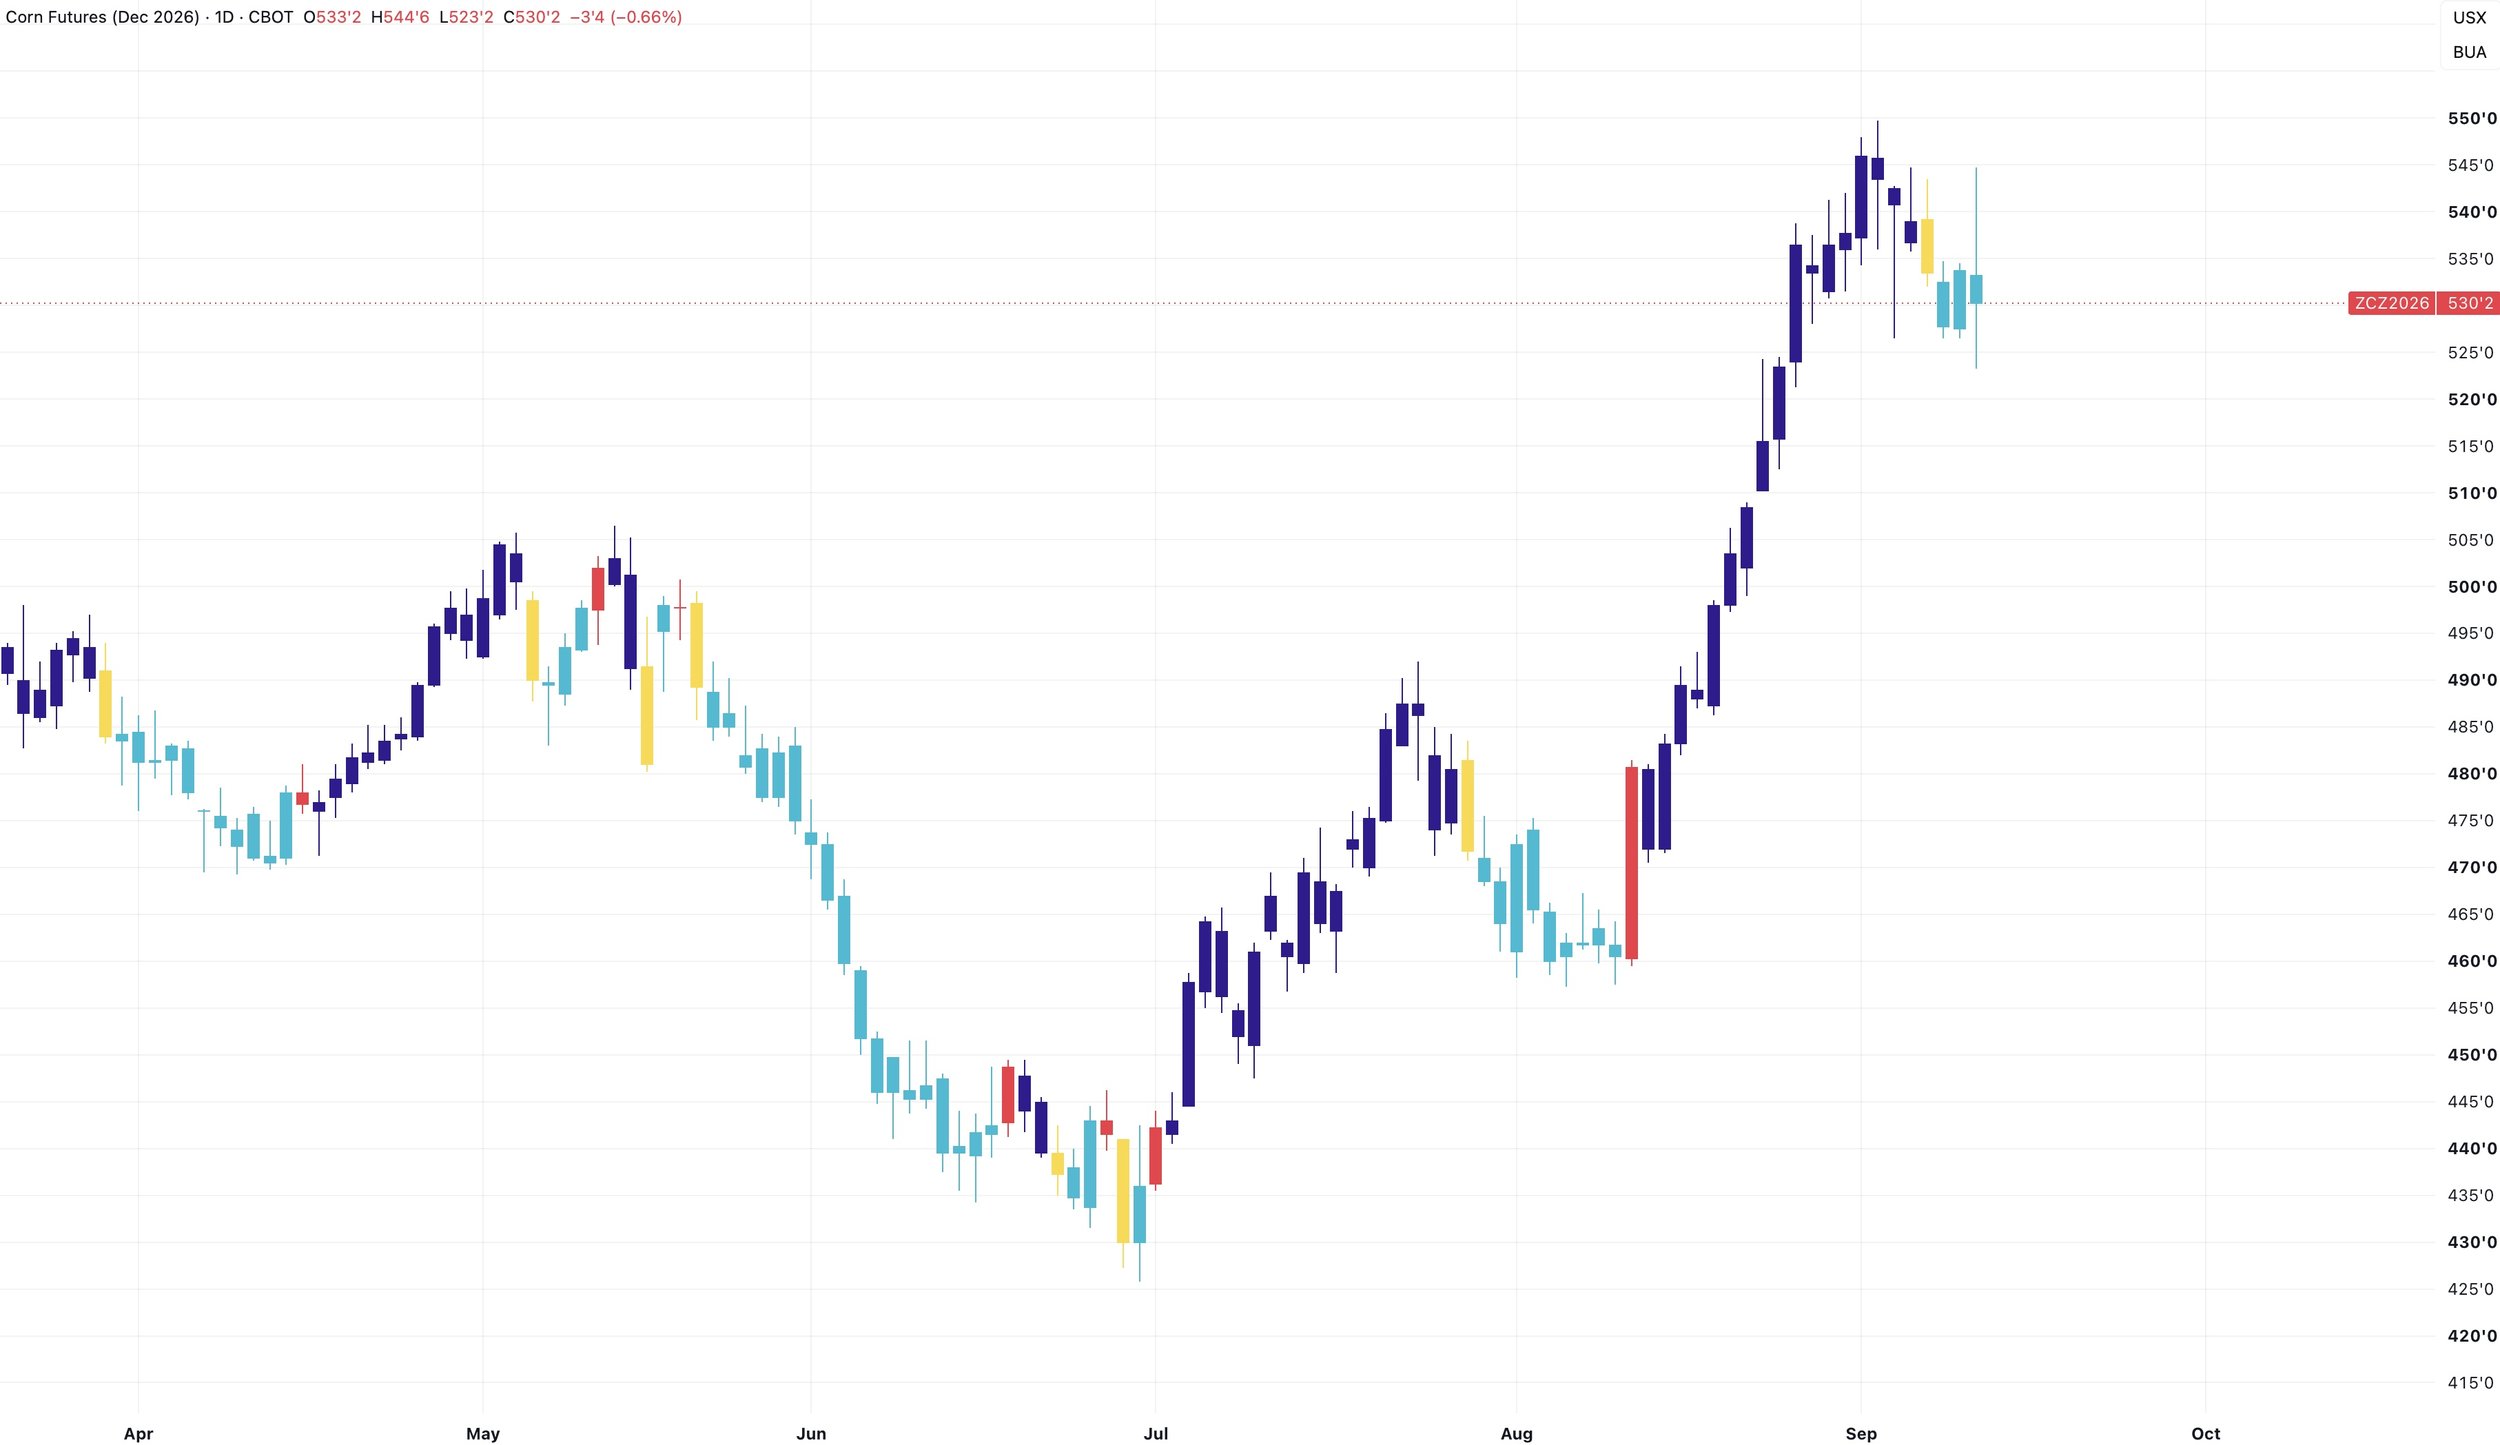
Here is an update on the bearish and bullish candle indicator I showed you guys earlier this week.
Again:
Red Candle = Bullish Trend
Dark Blue Candle = Bullish Trend Continuation
Yellow Candle = Bearish Trend
Light Blue Candle = Bearish Continuation
Of course this is not a perfect indicator by any means, but currently we still have a bearish trend following that yellow candle earlier this week.
Which was the first yellow candle since before the August pullback.
Where could we pullback to?
Of course we do not have to pullback further, but I am just saying I would not be surprised if we do.
Today's lows are going to be a key level to watch.
If we break them, I am looking for a bottom around $5.04 to $5.14
Which is the 38.2% to 50% retracements down to the August lows.
I lean more towards the 50% level, as that level would align with a perfect re-test of those highs from May.
I think that would present a great opportunity to look at some re-ownership if it comes.
There is also pretty low volume if we break below this current level. So bulls would like to hold here or it could spark further downside.
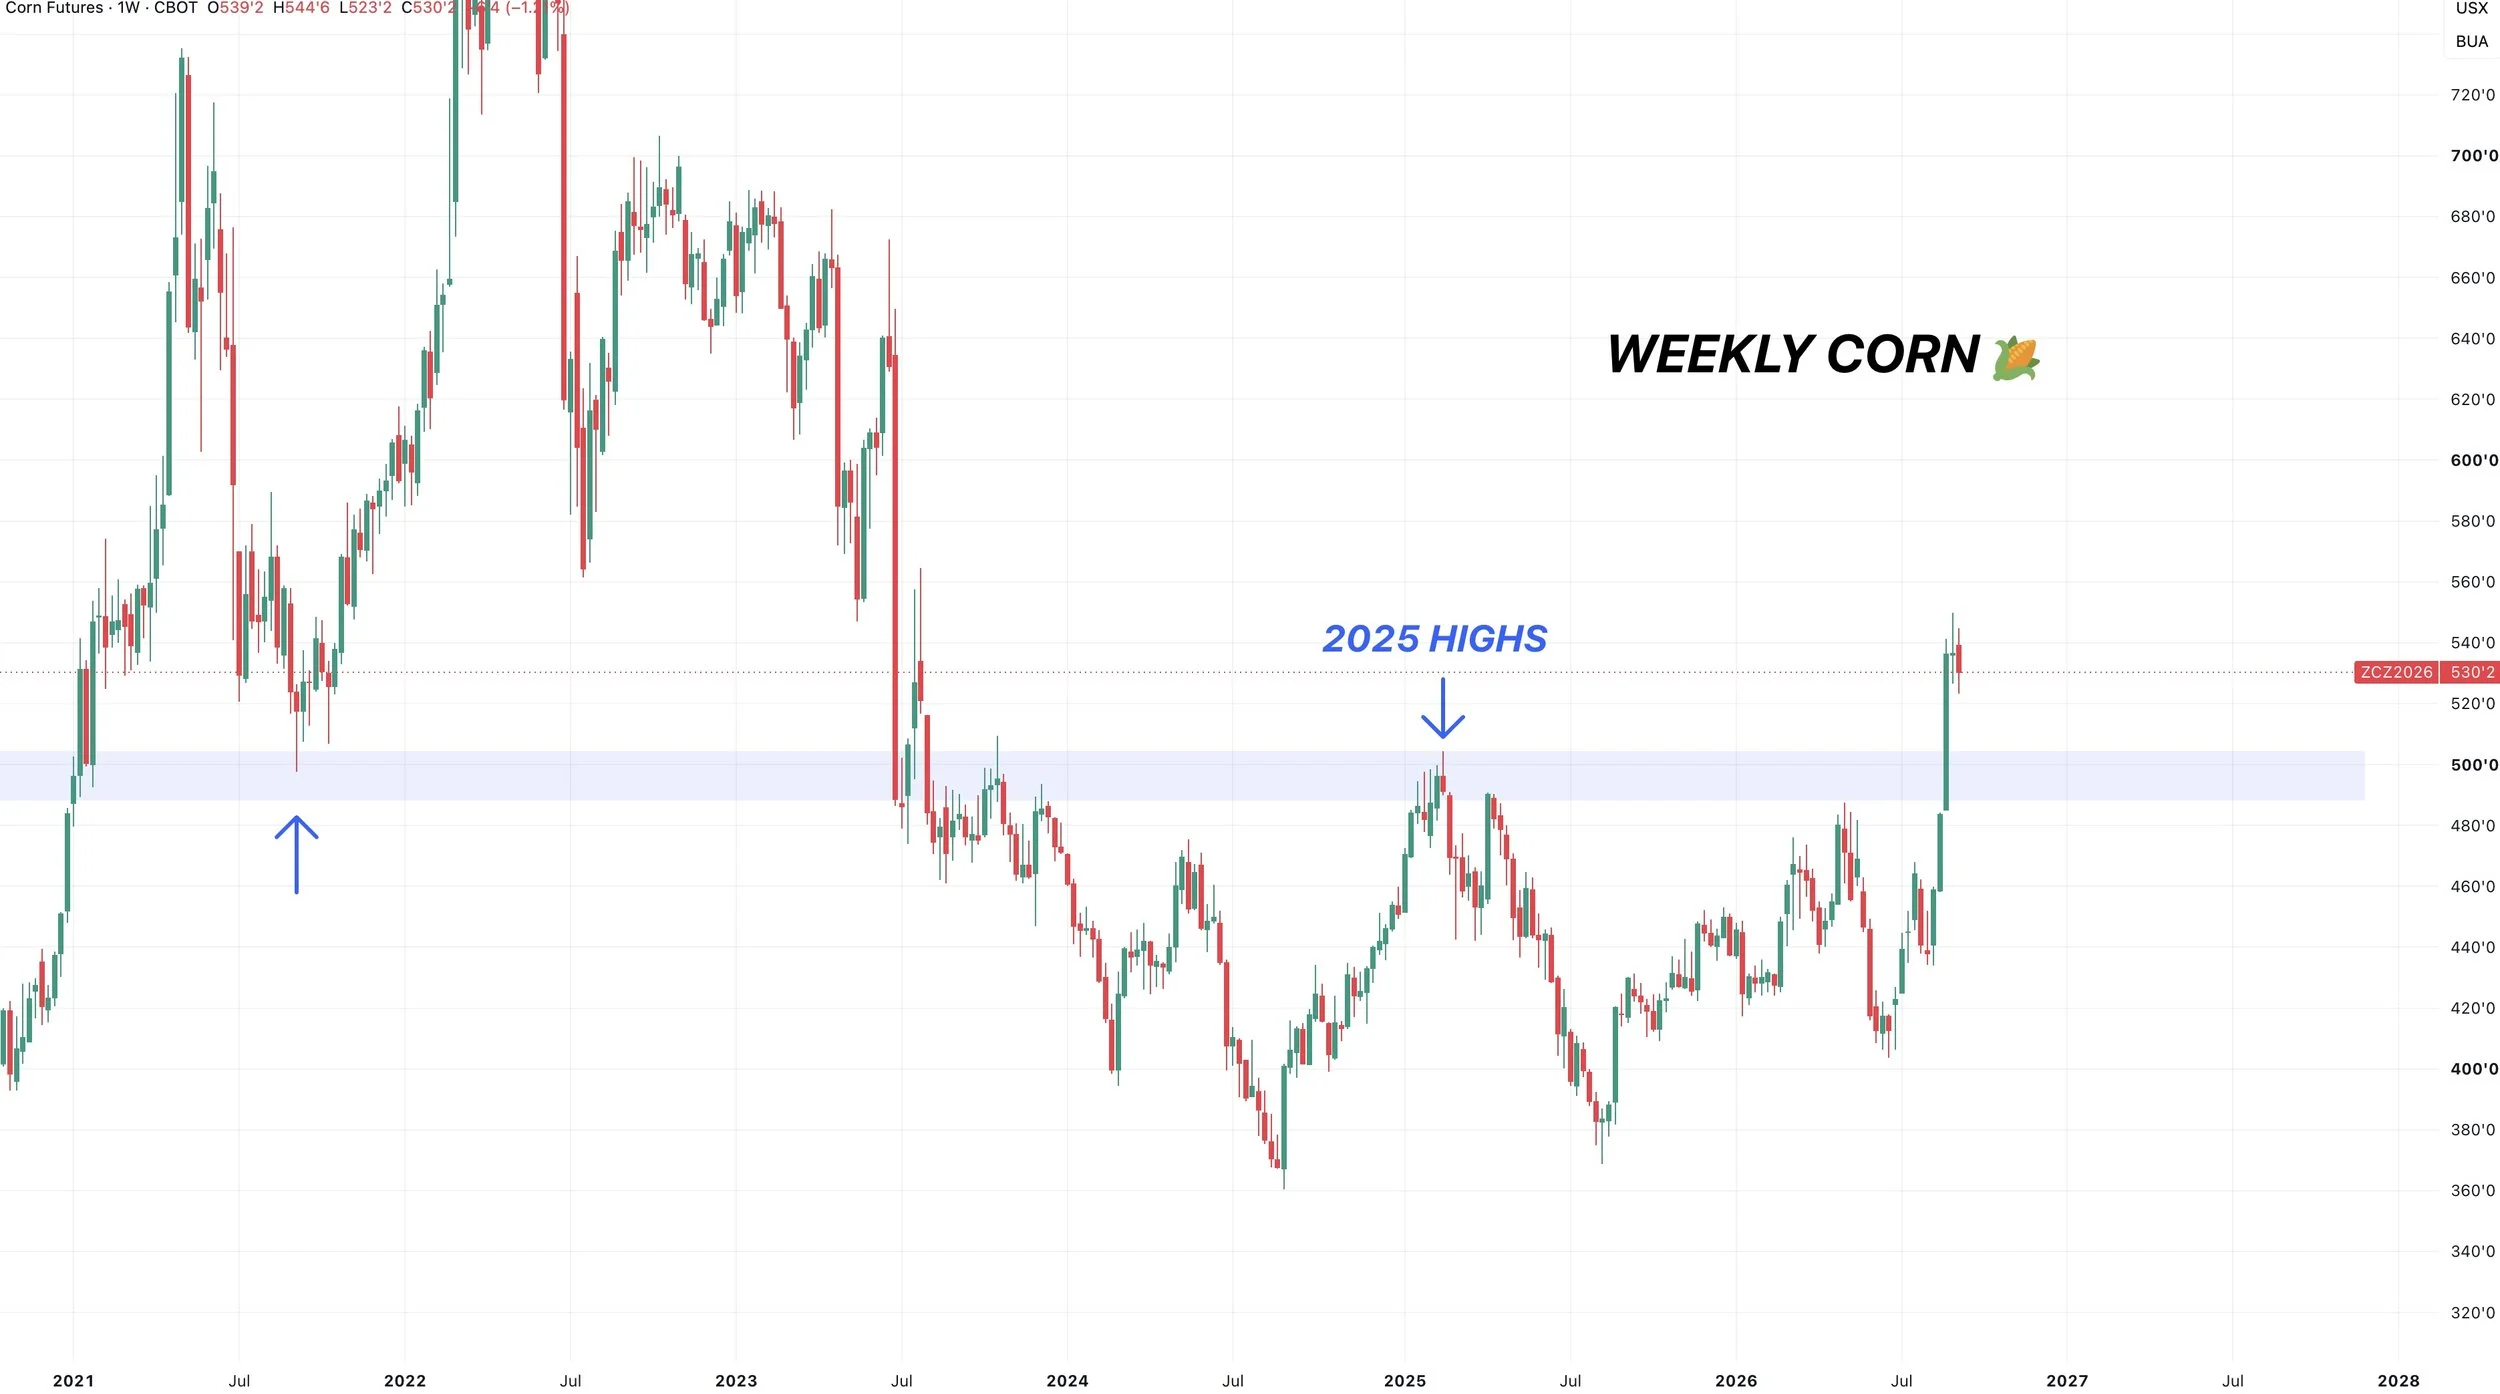
If you look at the weekly chart.
We got a clear breakout.
The highs from May also just happened to be at $5.04
So a re-test of the point of breakout would perfectly line up with that level here as well.
Making it another point of interest and another reason why it'd make sense to bounce there if we get there.
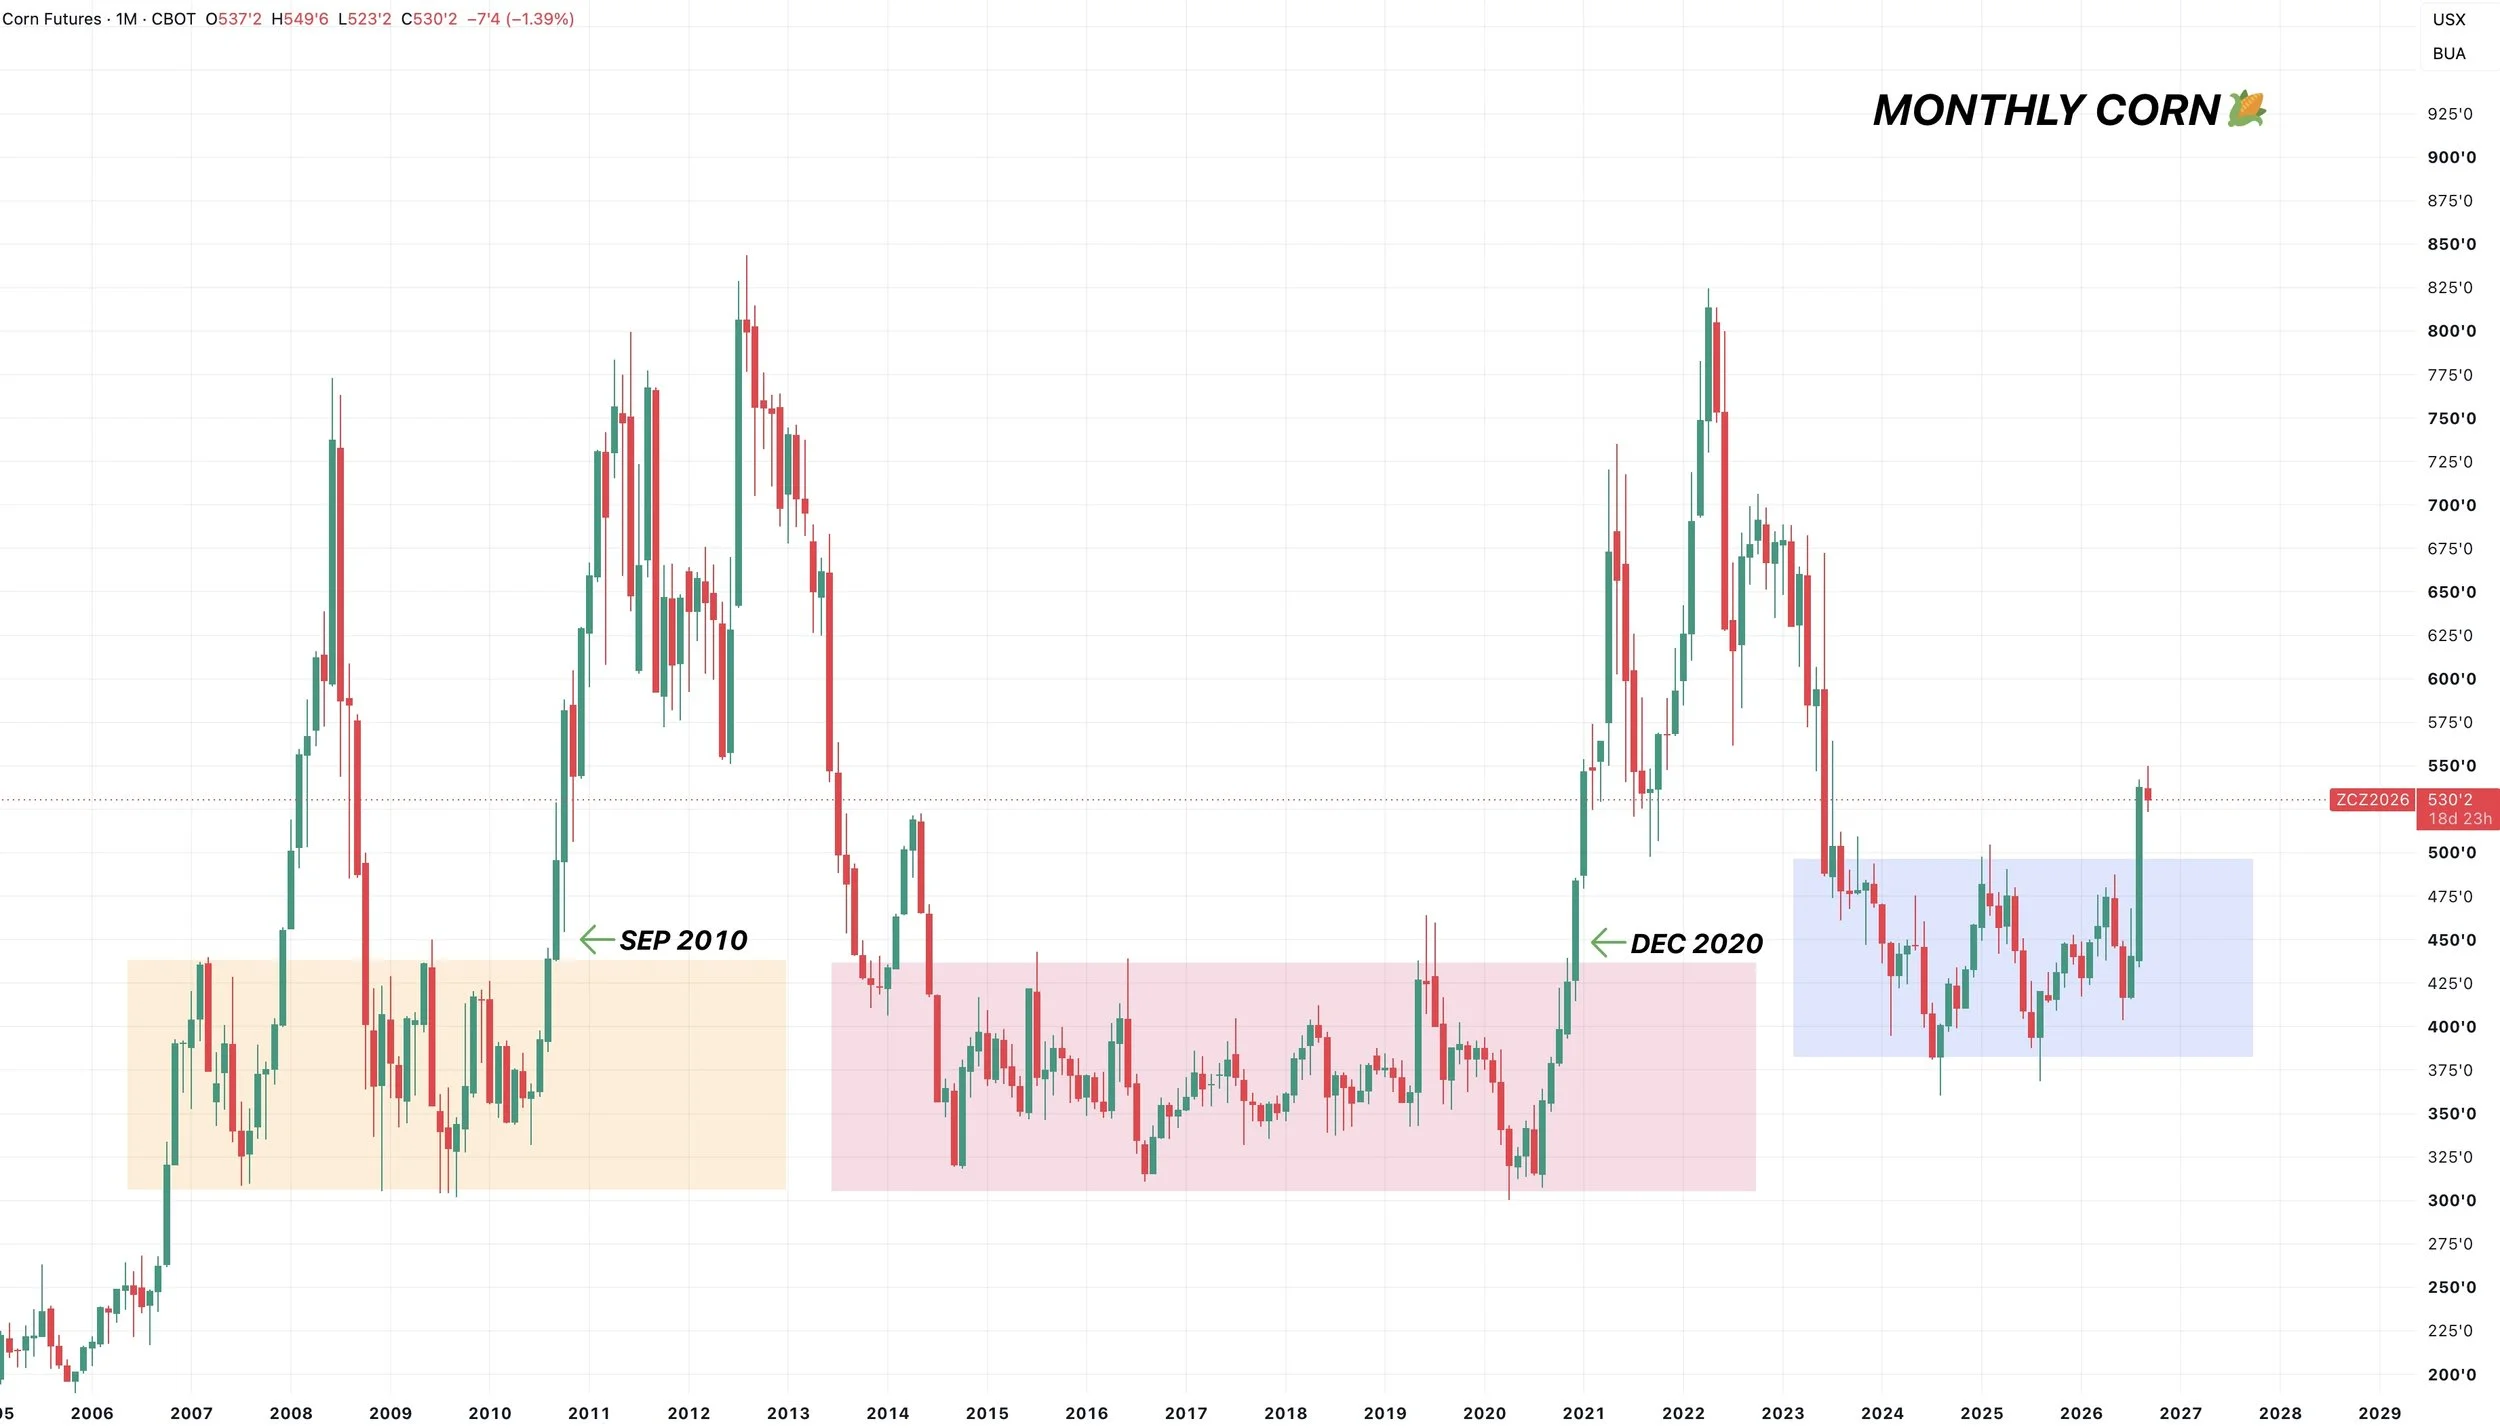
Monthly Chart: Breakout
Big picture the corn chart looks phenomenal.
I think this thing has plenty of upside long term.
We just had a monthly breakout from a multi-year range.
The last two times we saw that happen was 2010 and 2020.
Seems like a big deal.
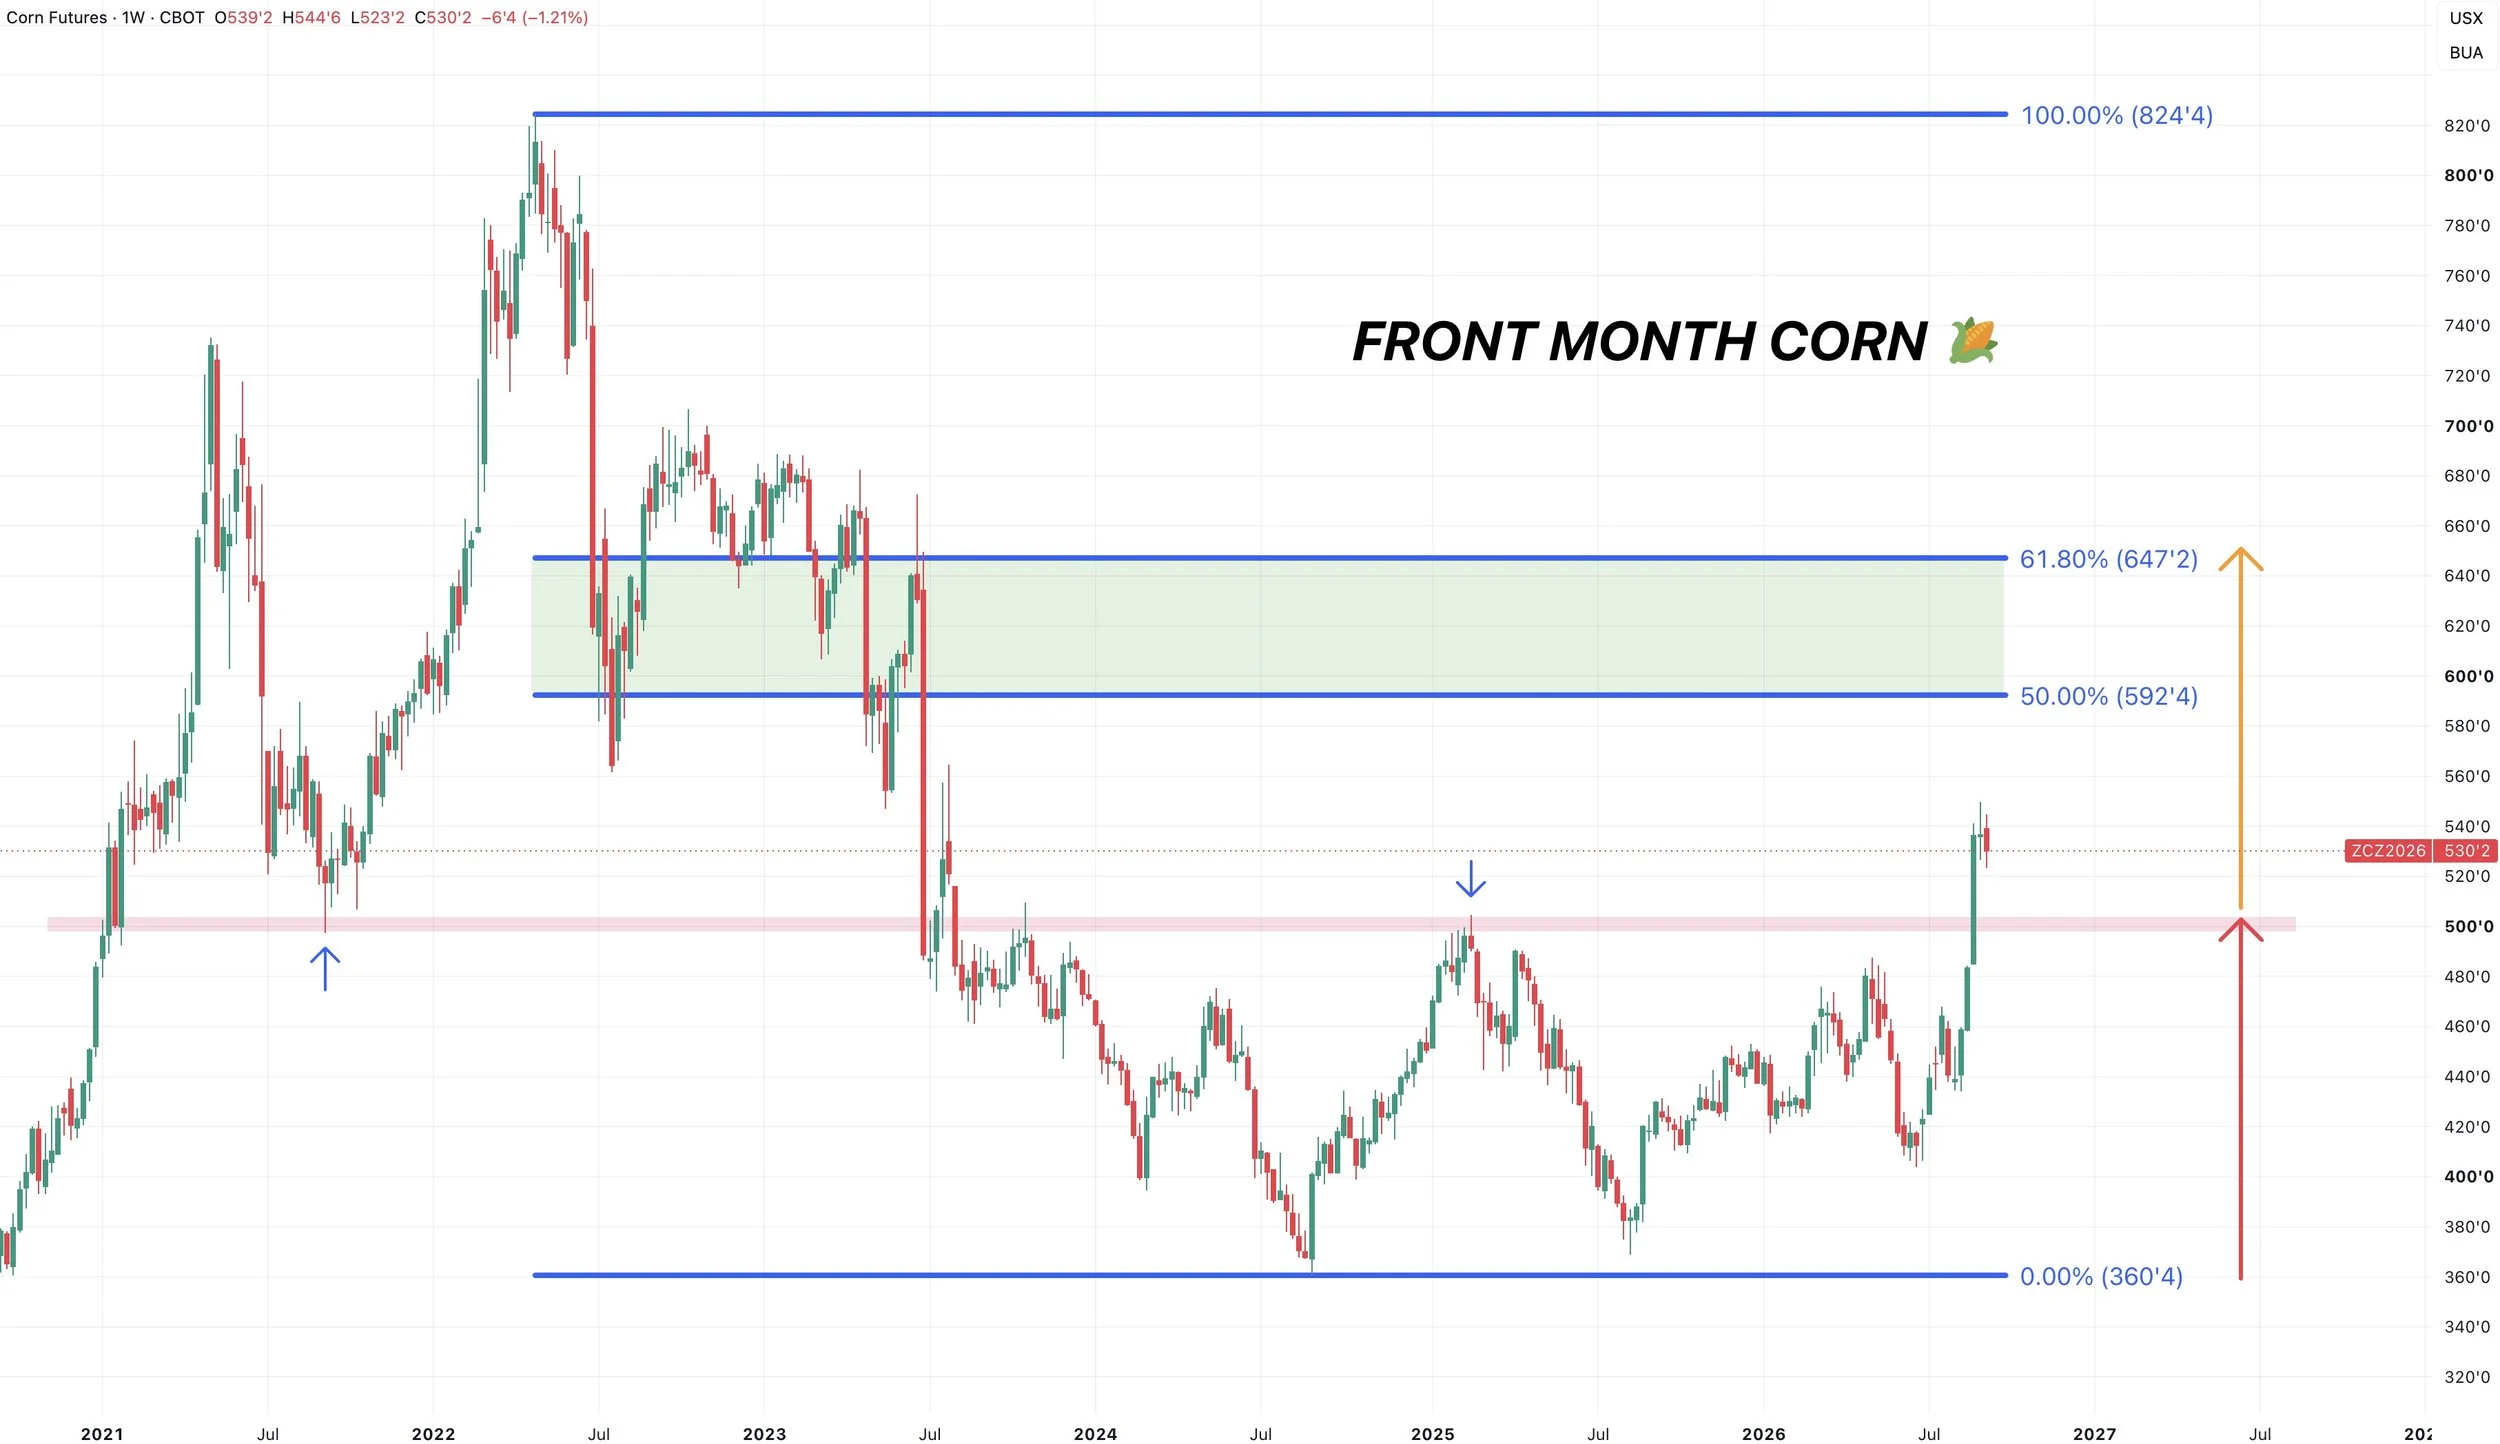
Weekly Chart: $6.50 Corn?
I think corn has a shot at $6.50 longer term.
But that doesn’t mean it's going to be a straight shot higher. And it doesn’t mean we have to get there at all. But I think it's realistically possible eventually.
If you take the range we've been trapped in for 3 years, and add it on top of the range, you get $6.50
$6.50 is also 61.8% of the 2022 highs.
Soybeans
USDA mean anything?
The report didn’t provide any big changes.
The crop was bigger than the market was expecting.
Corn and beans had the same weather. Yet corn yields are way down, meanwhile bean yield are up. Makes you scratch your head a little. So I think the yield could ultimately come down a little.
The USDA did bump our exports.
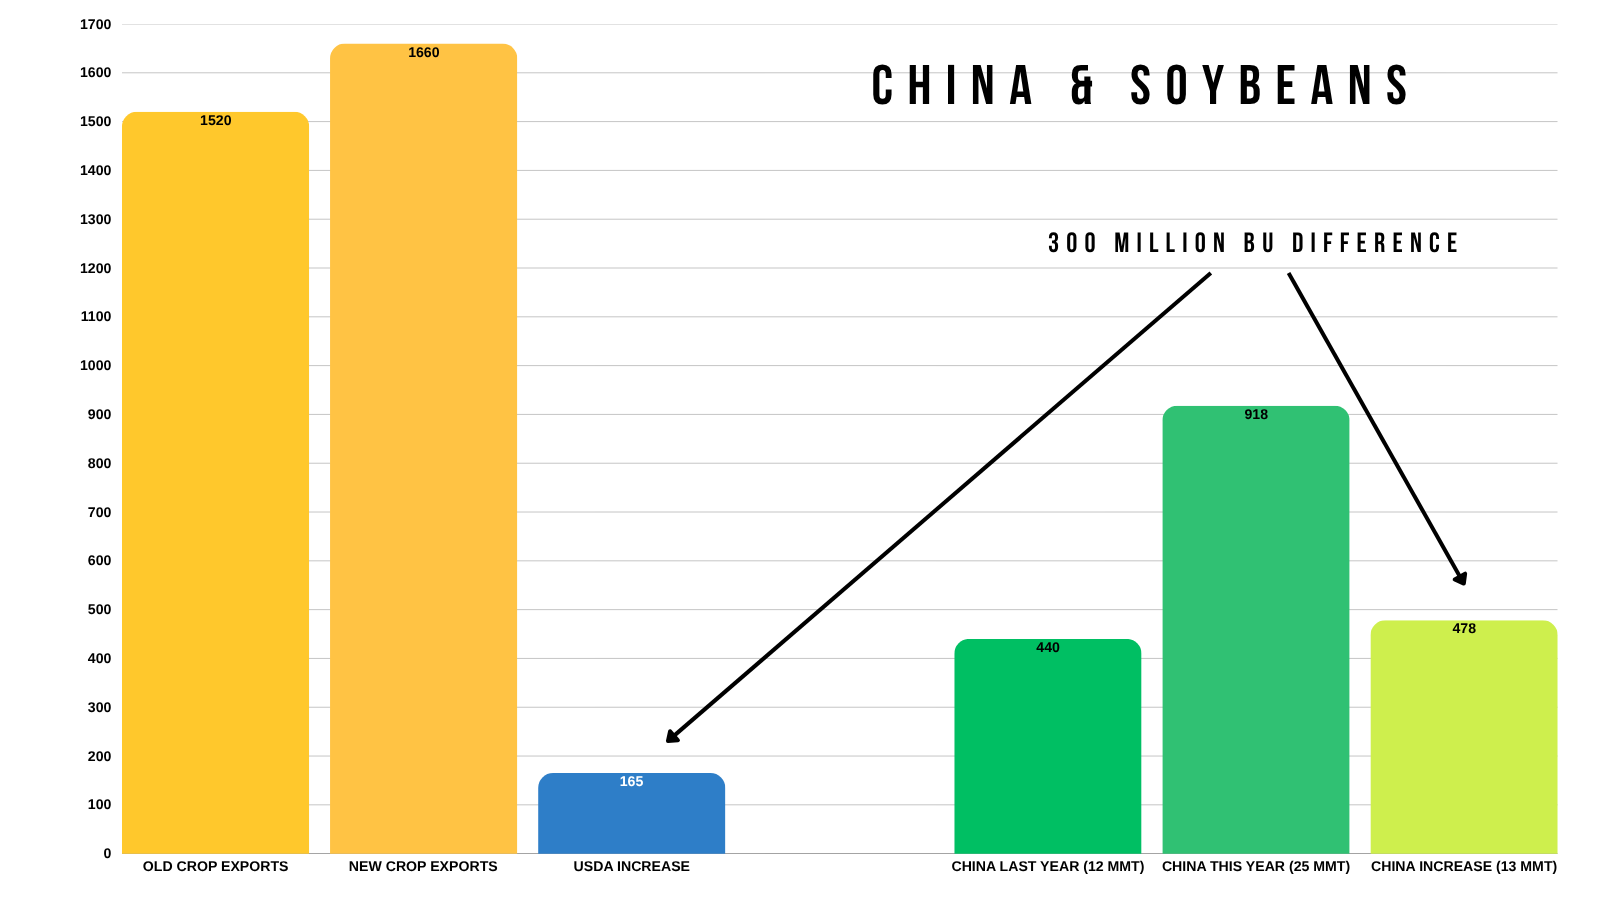
China has already bought half of their 25 MMT goal.
If you've seen my past updates, you probably know that the USDA is not accounting for all of the business to China that they agreed to buy.
The USDA now has exports up +165 million vs last year.
But wait.. China says they are going to be buying +480 million more than they did last year. So why the disparity?
The USDA seems to think that we are going to be losing non-China demand. But for us to lose that business, we might need to ration demand with higher prices.
Sorry if I sound like I'm beating a dead horse on this topic. But this is one of the most important factors.
Then you have Brazil.
Their weather season is coming up fast. And we have a Super El Nino that historically leads to some dryness that could cause some problems.
Brazil has continued to pump out record crop after record crop.
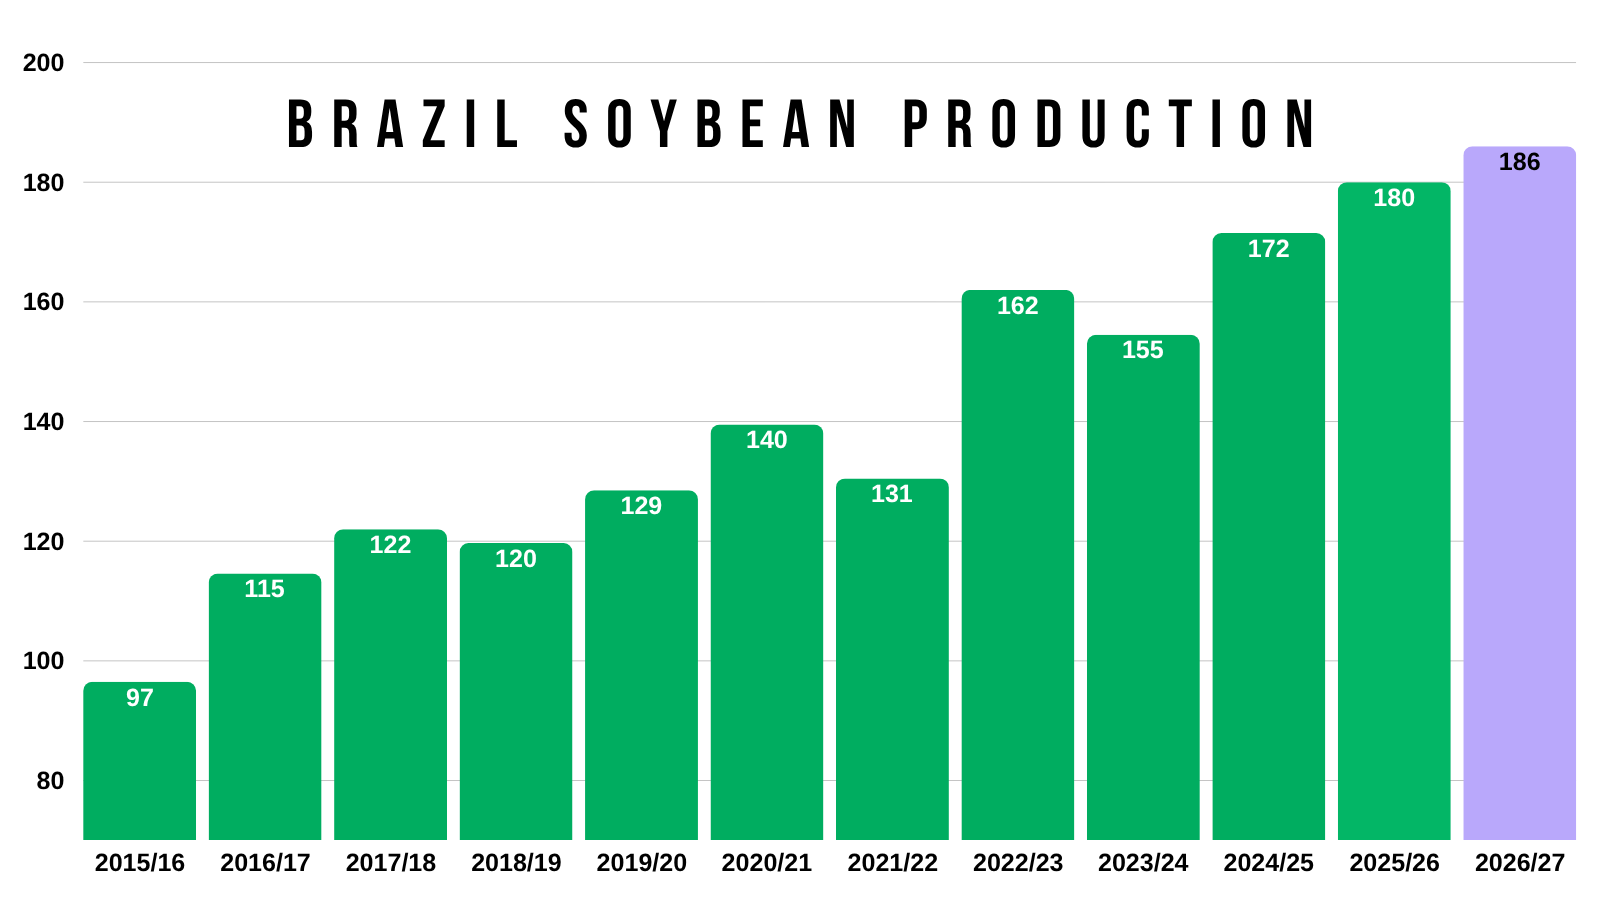
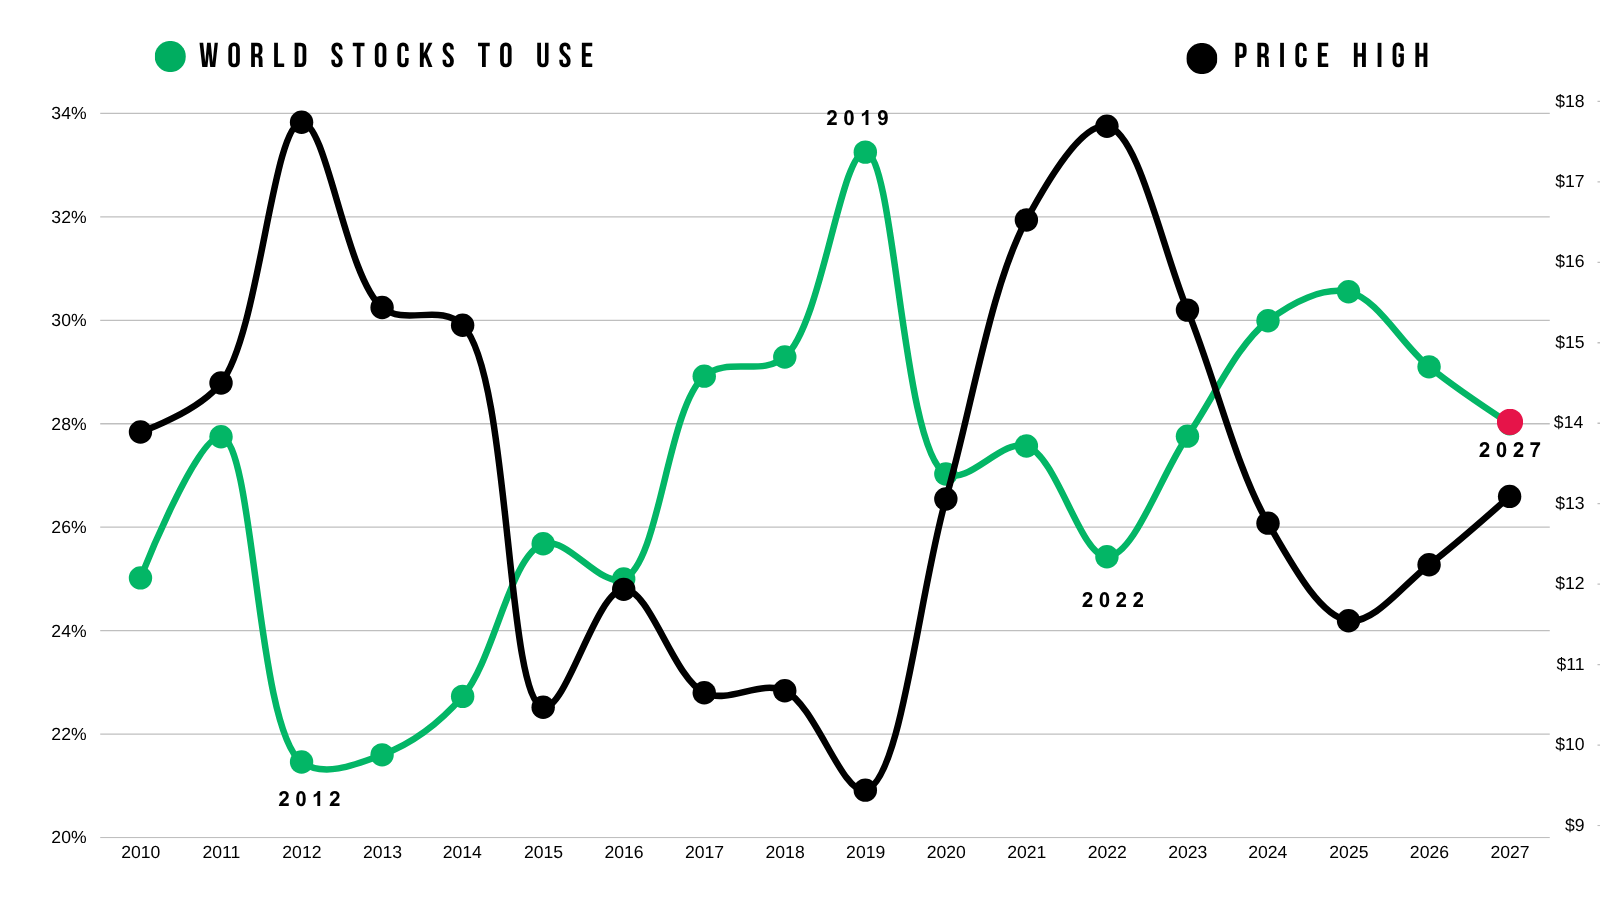
Yet the world situation isn’t getting any bigger.
It's at multi-year lows.
So what happens if Brazil actually has a hiccup?
The USDA thinks we are going to lose non-China demand. But what happens if the other player Brazil has an issue? Where is the world going to get all of their soybeans from? Well that business might have to come from the US.
So we have China demand that could very well be being under estimated.
The US crop is up for debate. Maybe it's smaller, maybe it's not.
Then we have the Super El Nino and Brazil, while the world situation is the tightest it's been in years.
If Brazil's crop is smaller, that world situation will undoubtably get even tighter.
I think there is a very good chance that the soybean market is going to have to ration demand at some point.
How do you ration demand? Via higher prices.
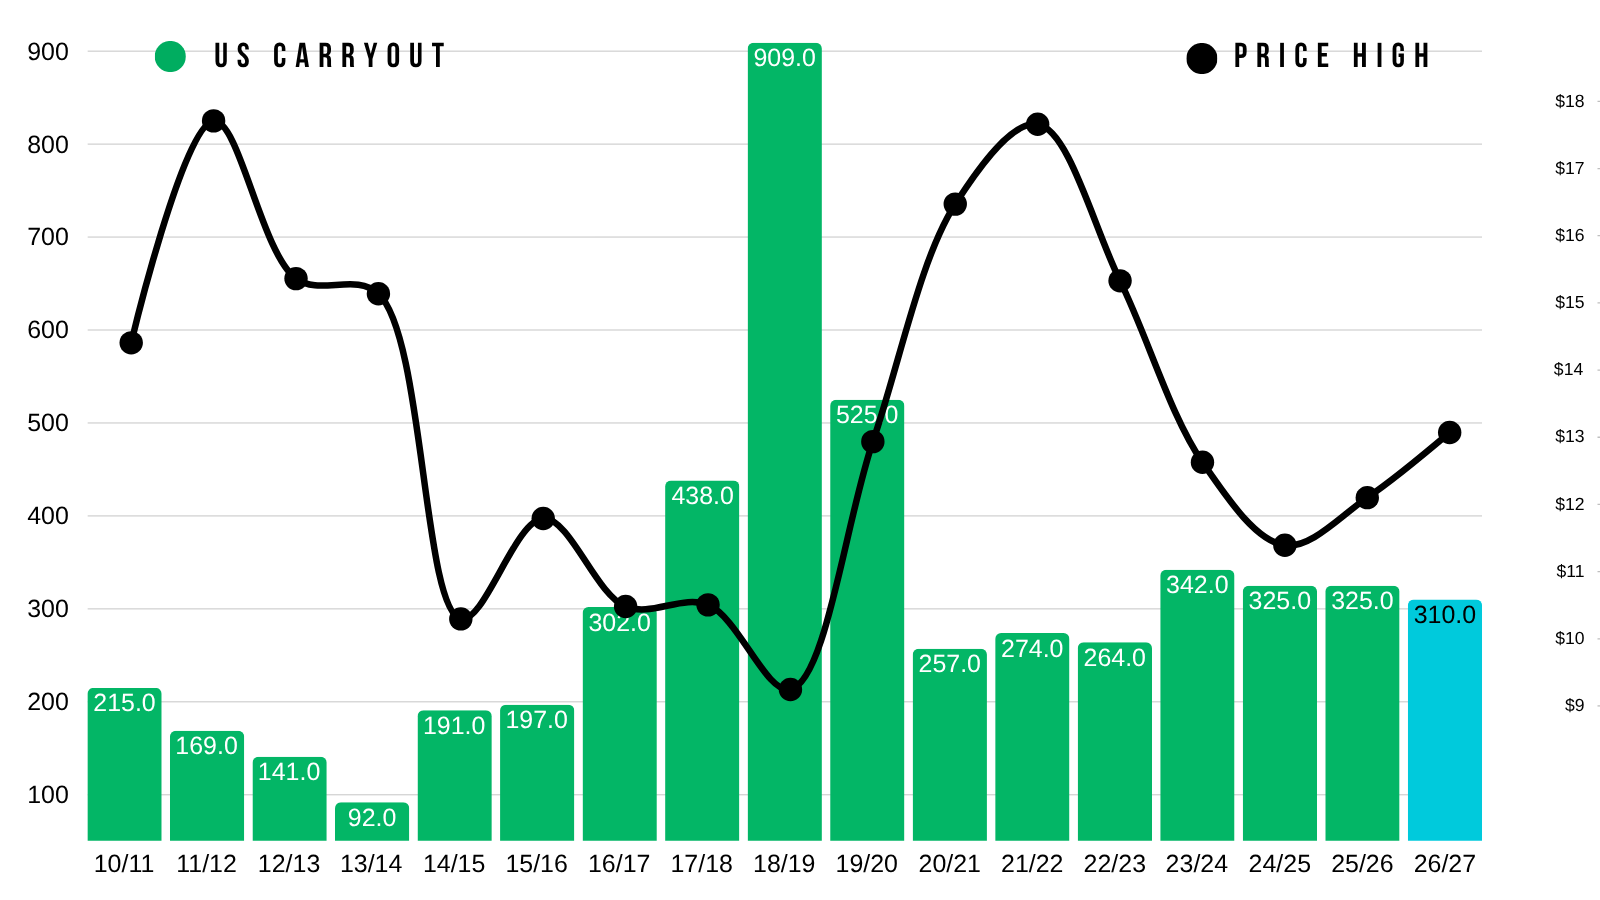
Here is the US situation vs soybeans highest prices.
Not as clear of a correlation here as there is with the world one.
We have a 310 carryout. The last bull market saw a US carryout below 300 million.
I do think the carryout could ultimately end up below 300 million due to demand.
Soybean Charts
Having said that.. just like in corn I think this market could be due for a breather and correction. As I have been talking about the last week or two.
Which is why we sent out that sell signal and hedge alert on September 1st.
Again, like in corn, this was mostly for those who need to be proactive. Those who simply lack storage or time.
If you missed the alert: Click Here to View Alert
Nov Beans Chart:
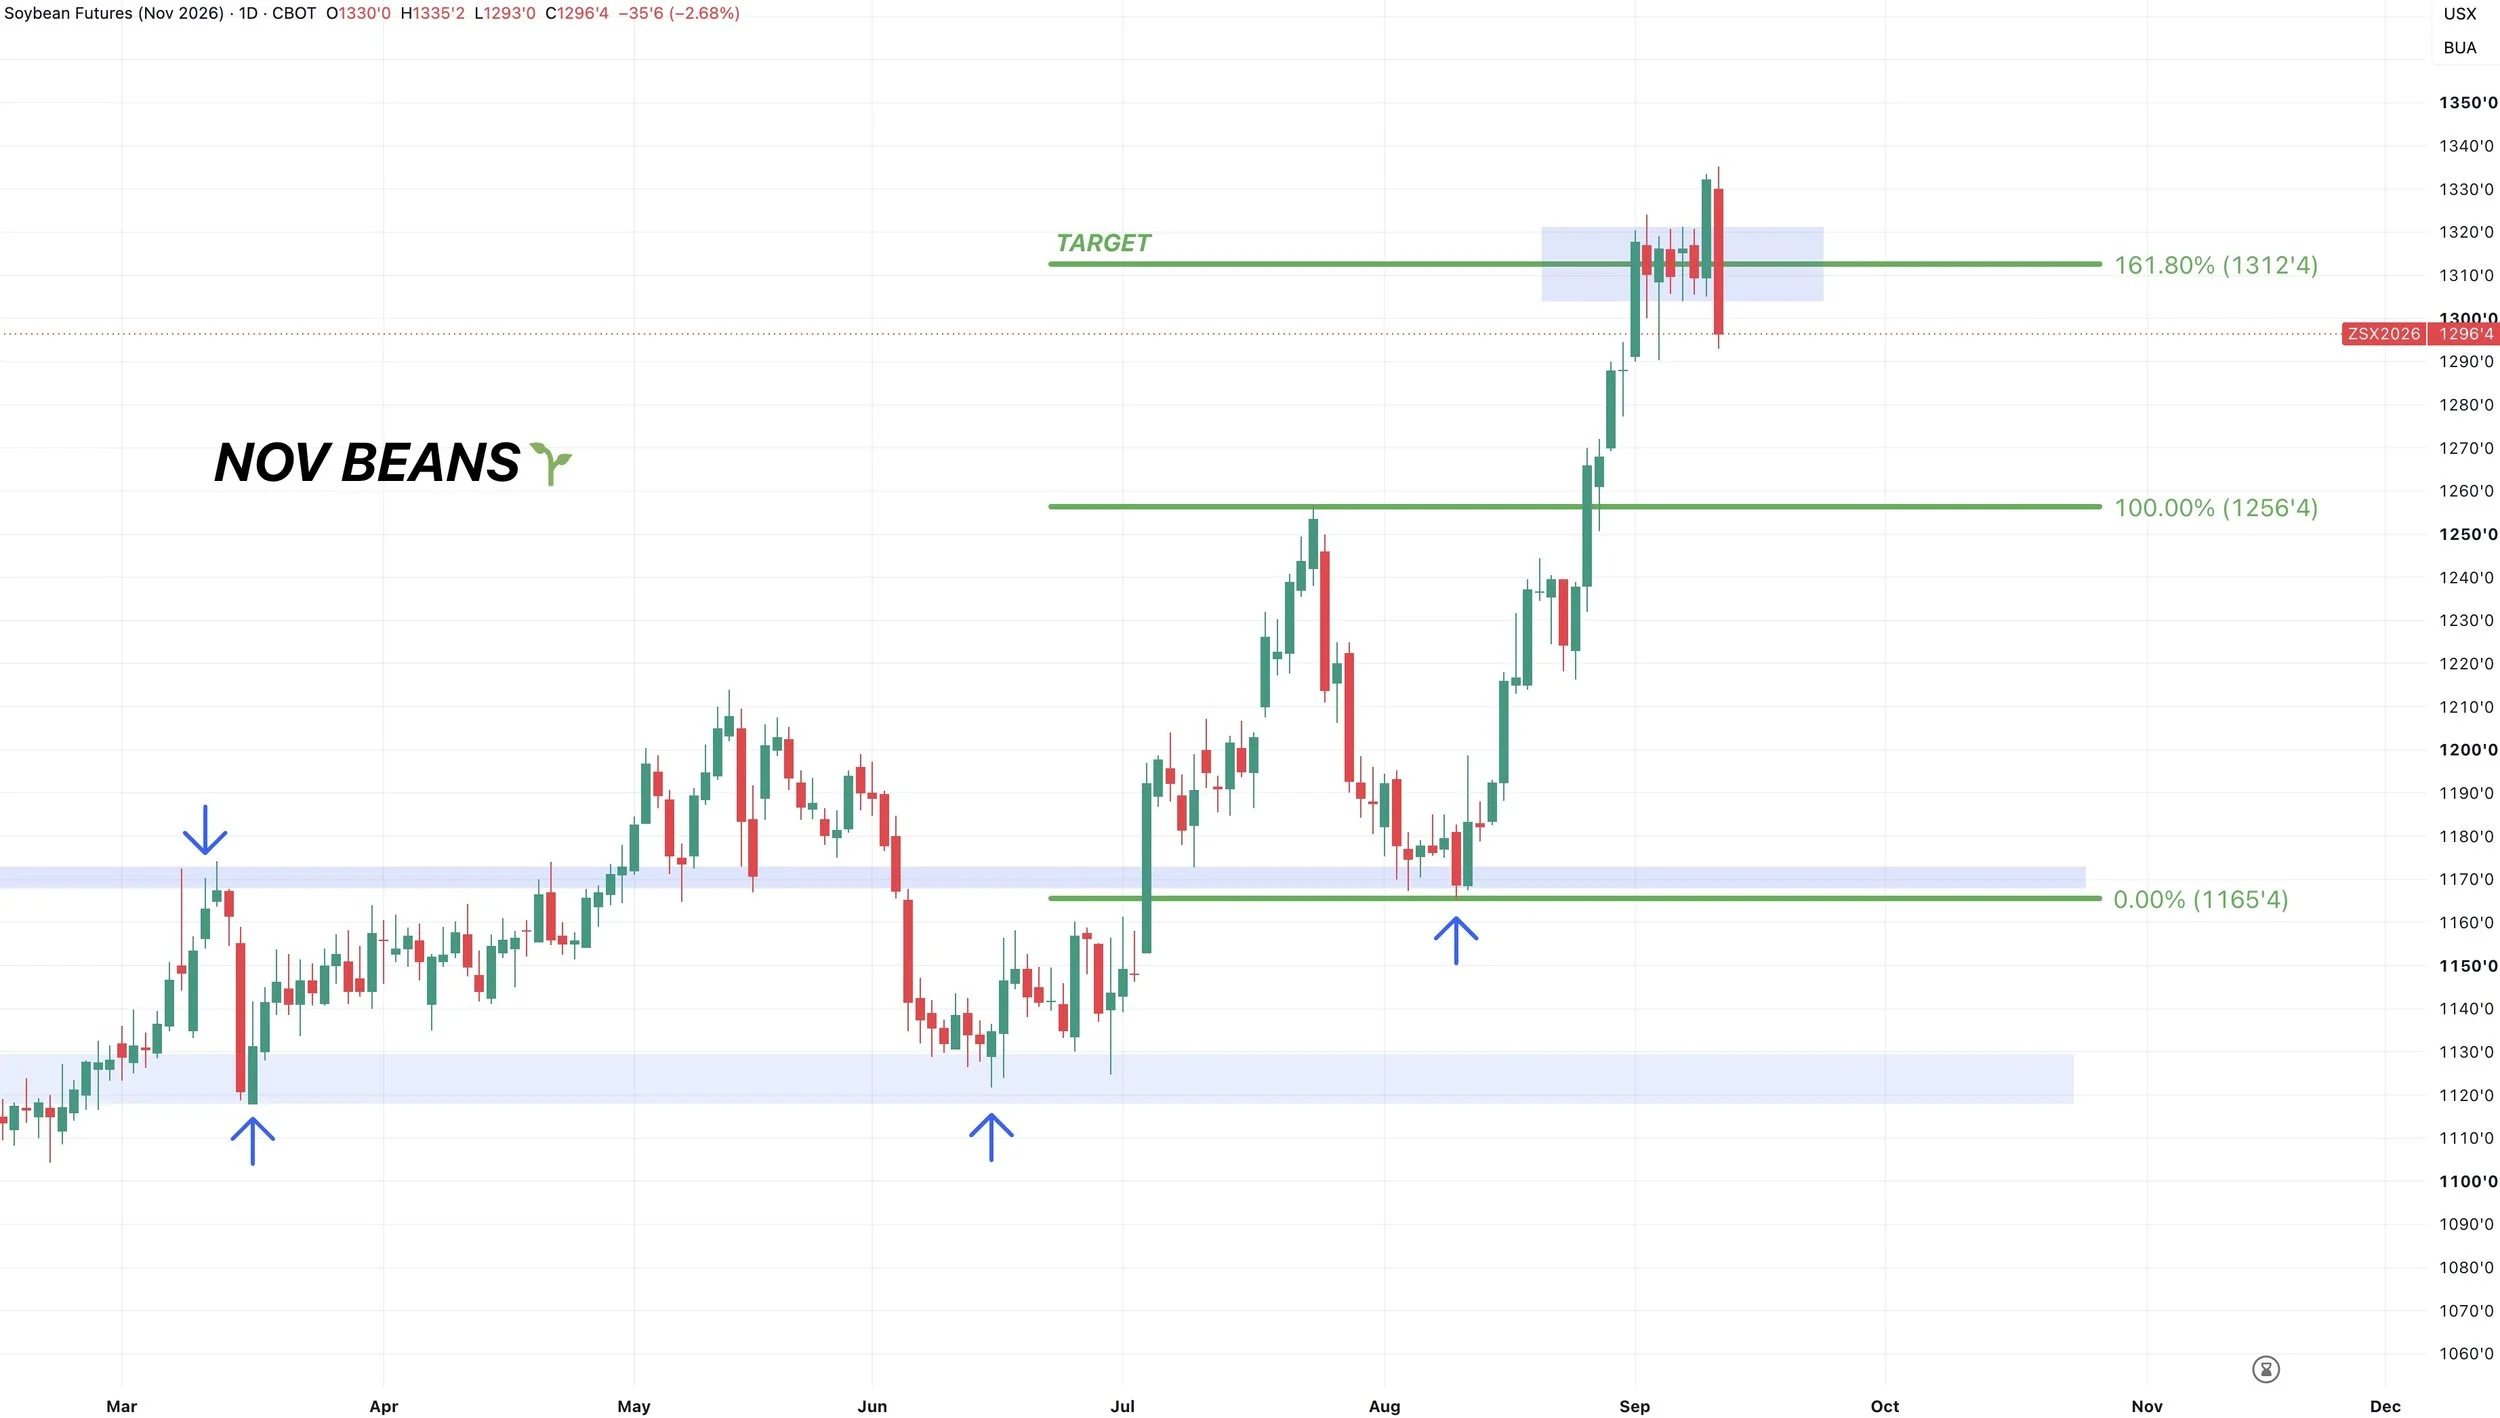
The reason behind the alert was that we hit the golden fib from the August lows up to the July highs. 161.8% of that move. A common spot for continuation rallies to stall in bullish markets.
We had been trapped in a completely sideways pattern the last 10 days.
Yesterday we broke out of the top of that range.
Today we gave it all back and broke through the bottom of the range.
So that looks like a possible failed breakout, but Monday's action might be telling. As it could likely tell us if this is just a head fake or if the correction is starting.
How far could we pull back?
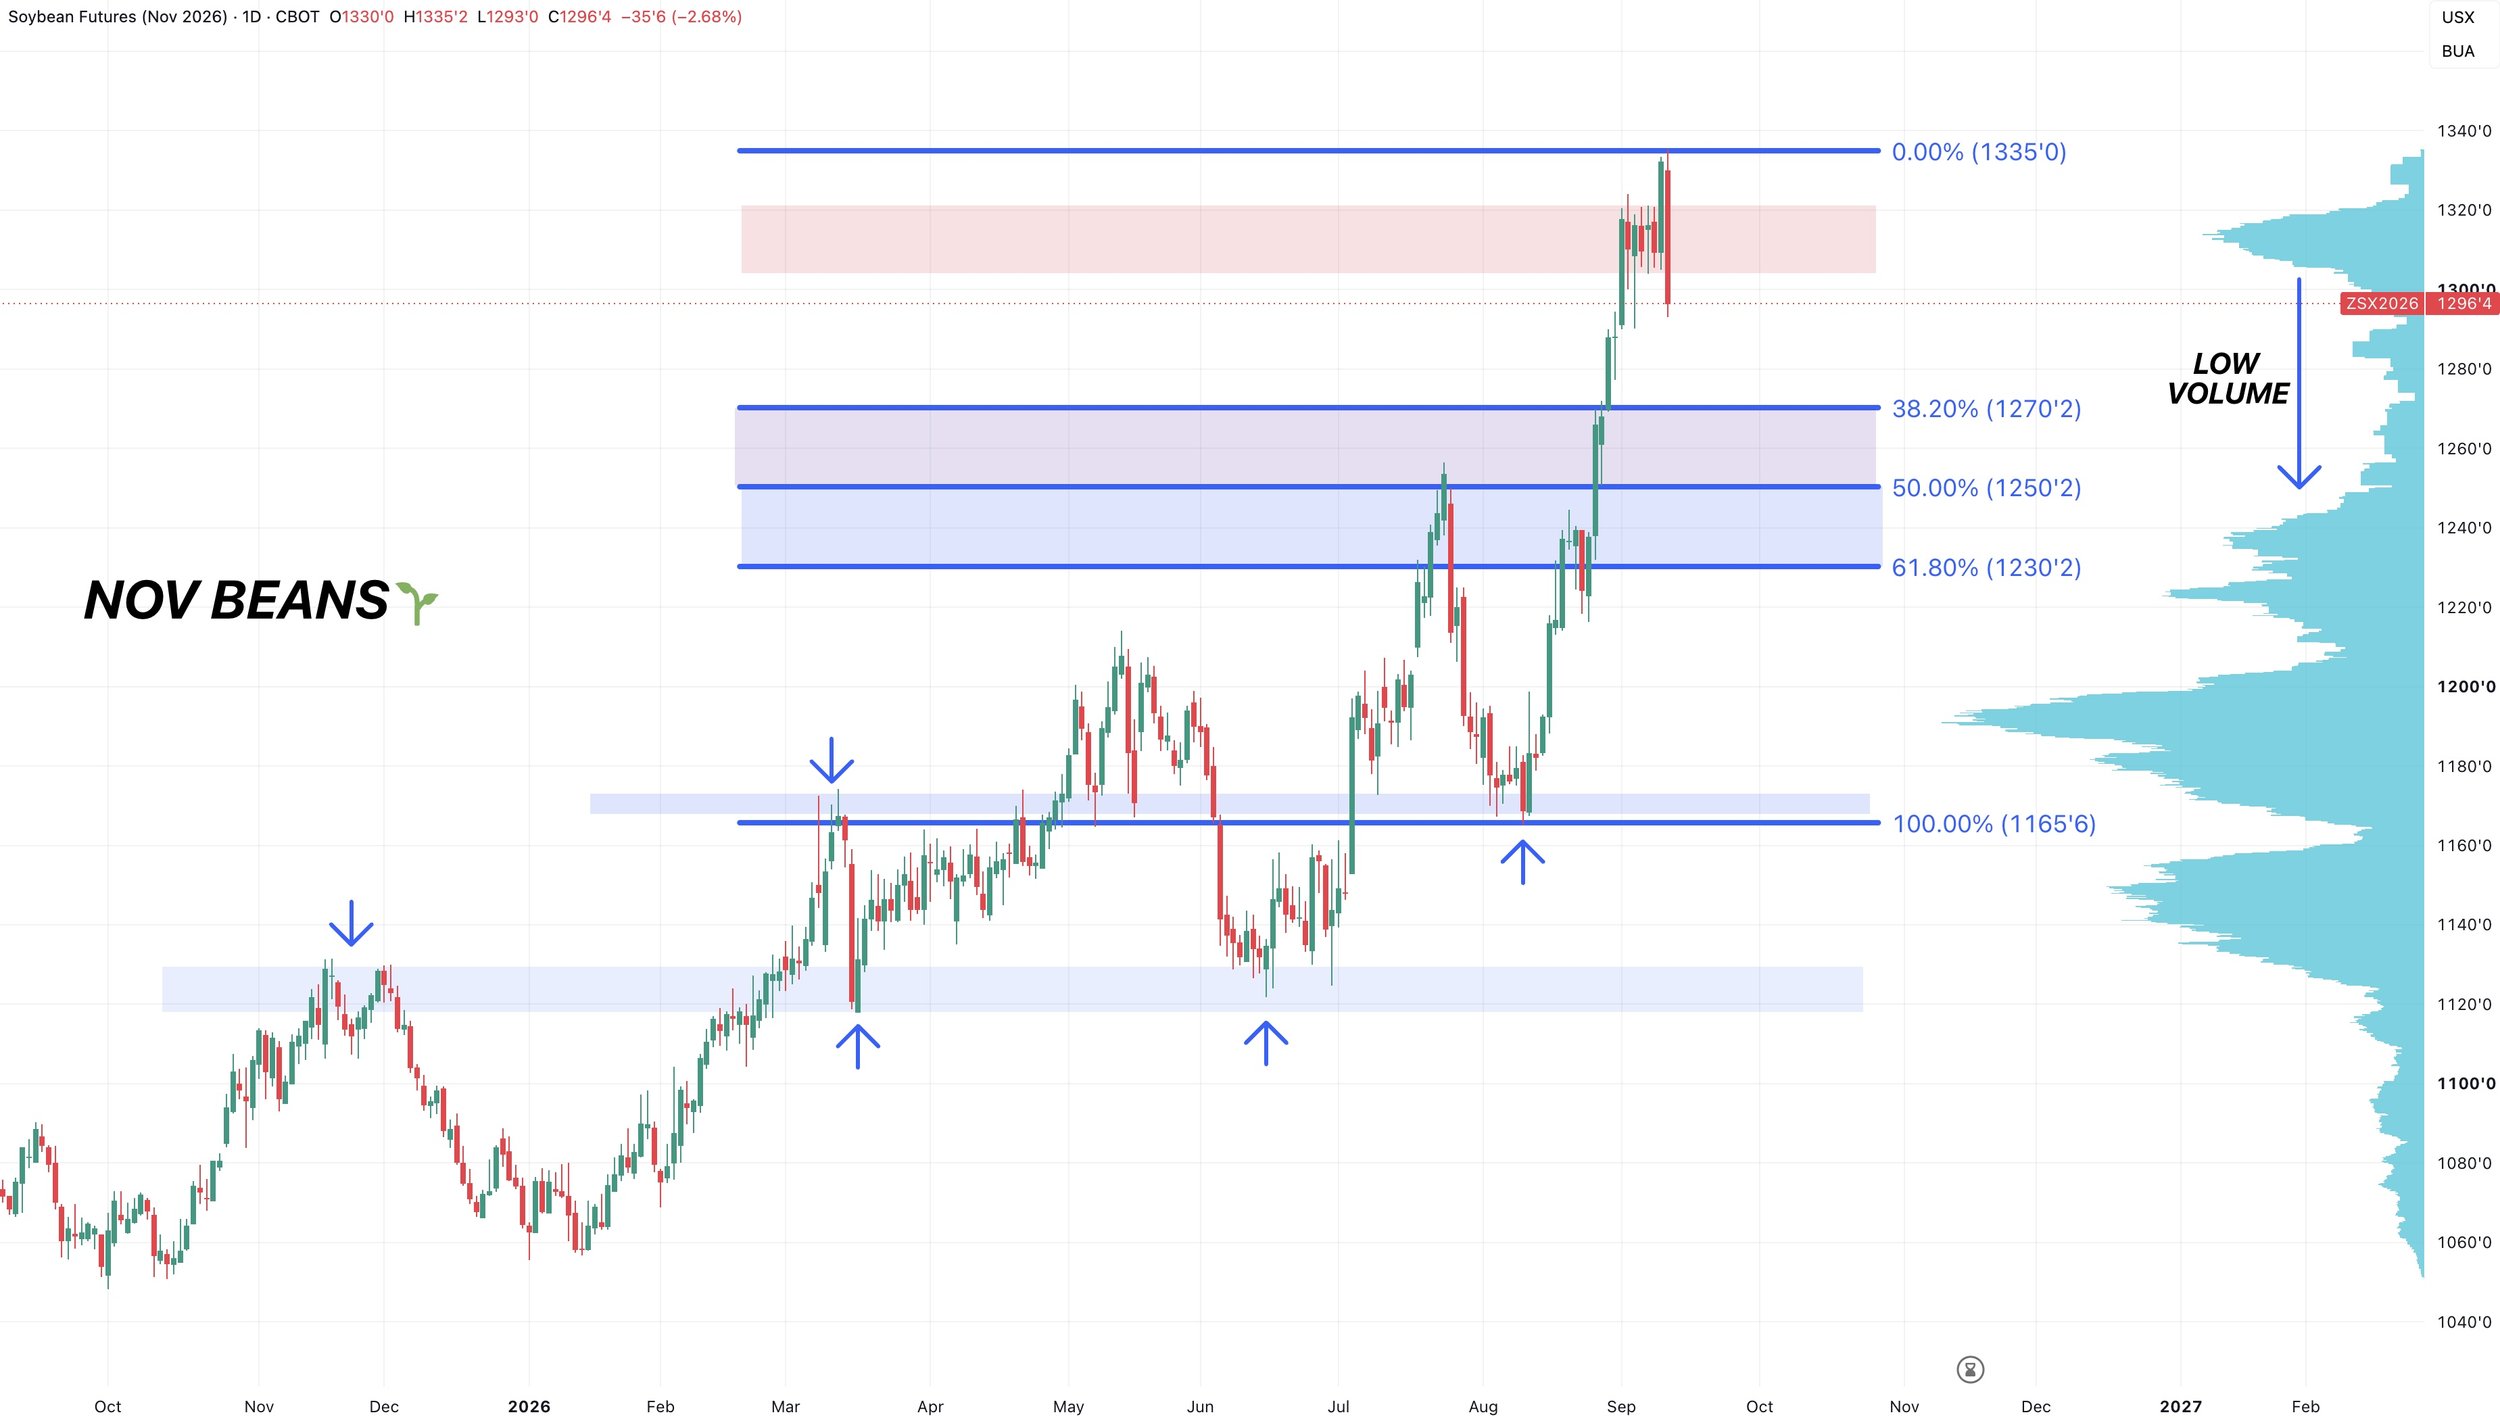
If this is the start of that correction we've been discussing, I am looking for a possible bottom around $12.50 to $12.70
That would give back 38.2% to 50% of the rally from August.
That 50% level lines up with a re-test of those highs from July.
The soybean market has a pretty solid history of breaking out, then coming back to turn the old highs into support.
If you notice there is not very much volume and support below this level if we decide to pull back. Because we ran straight up, leaving little support.
Indicators suggest pullback?
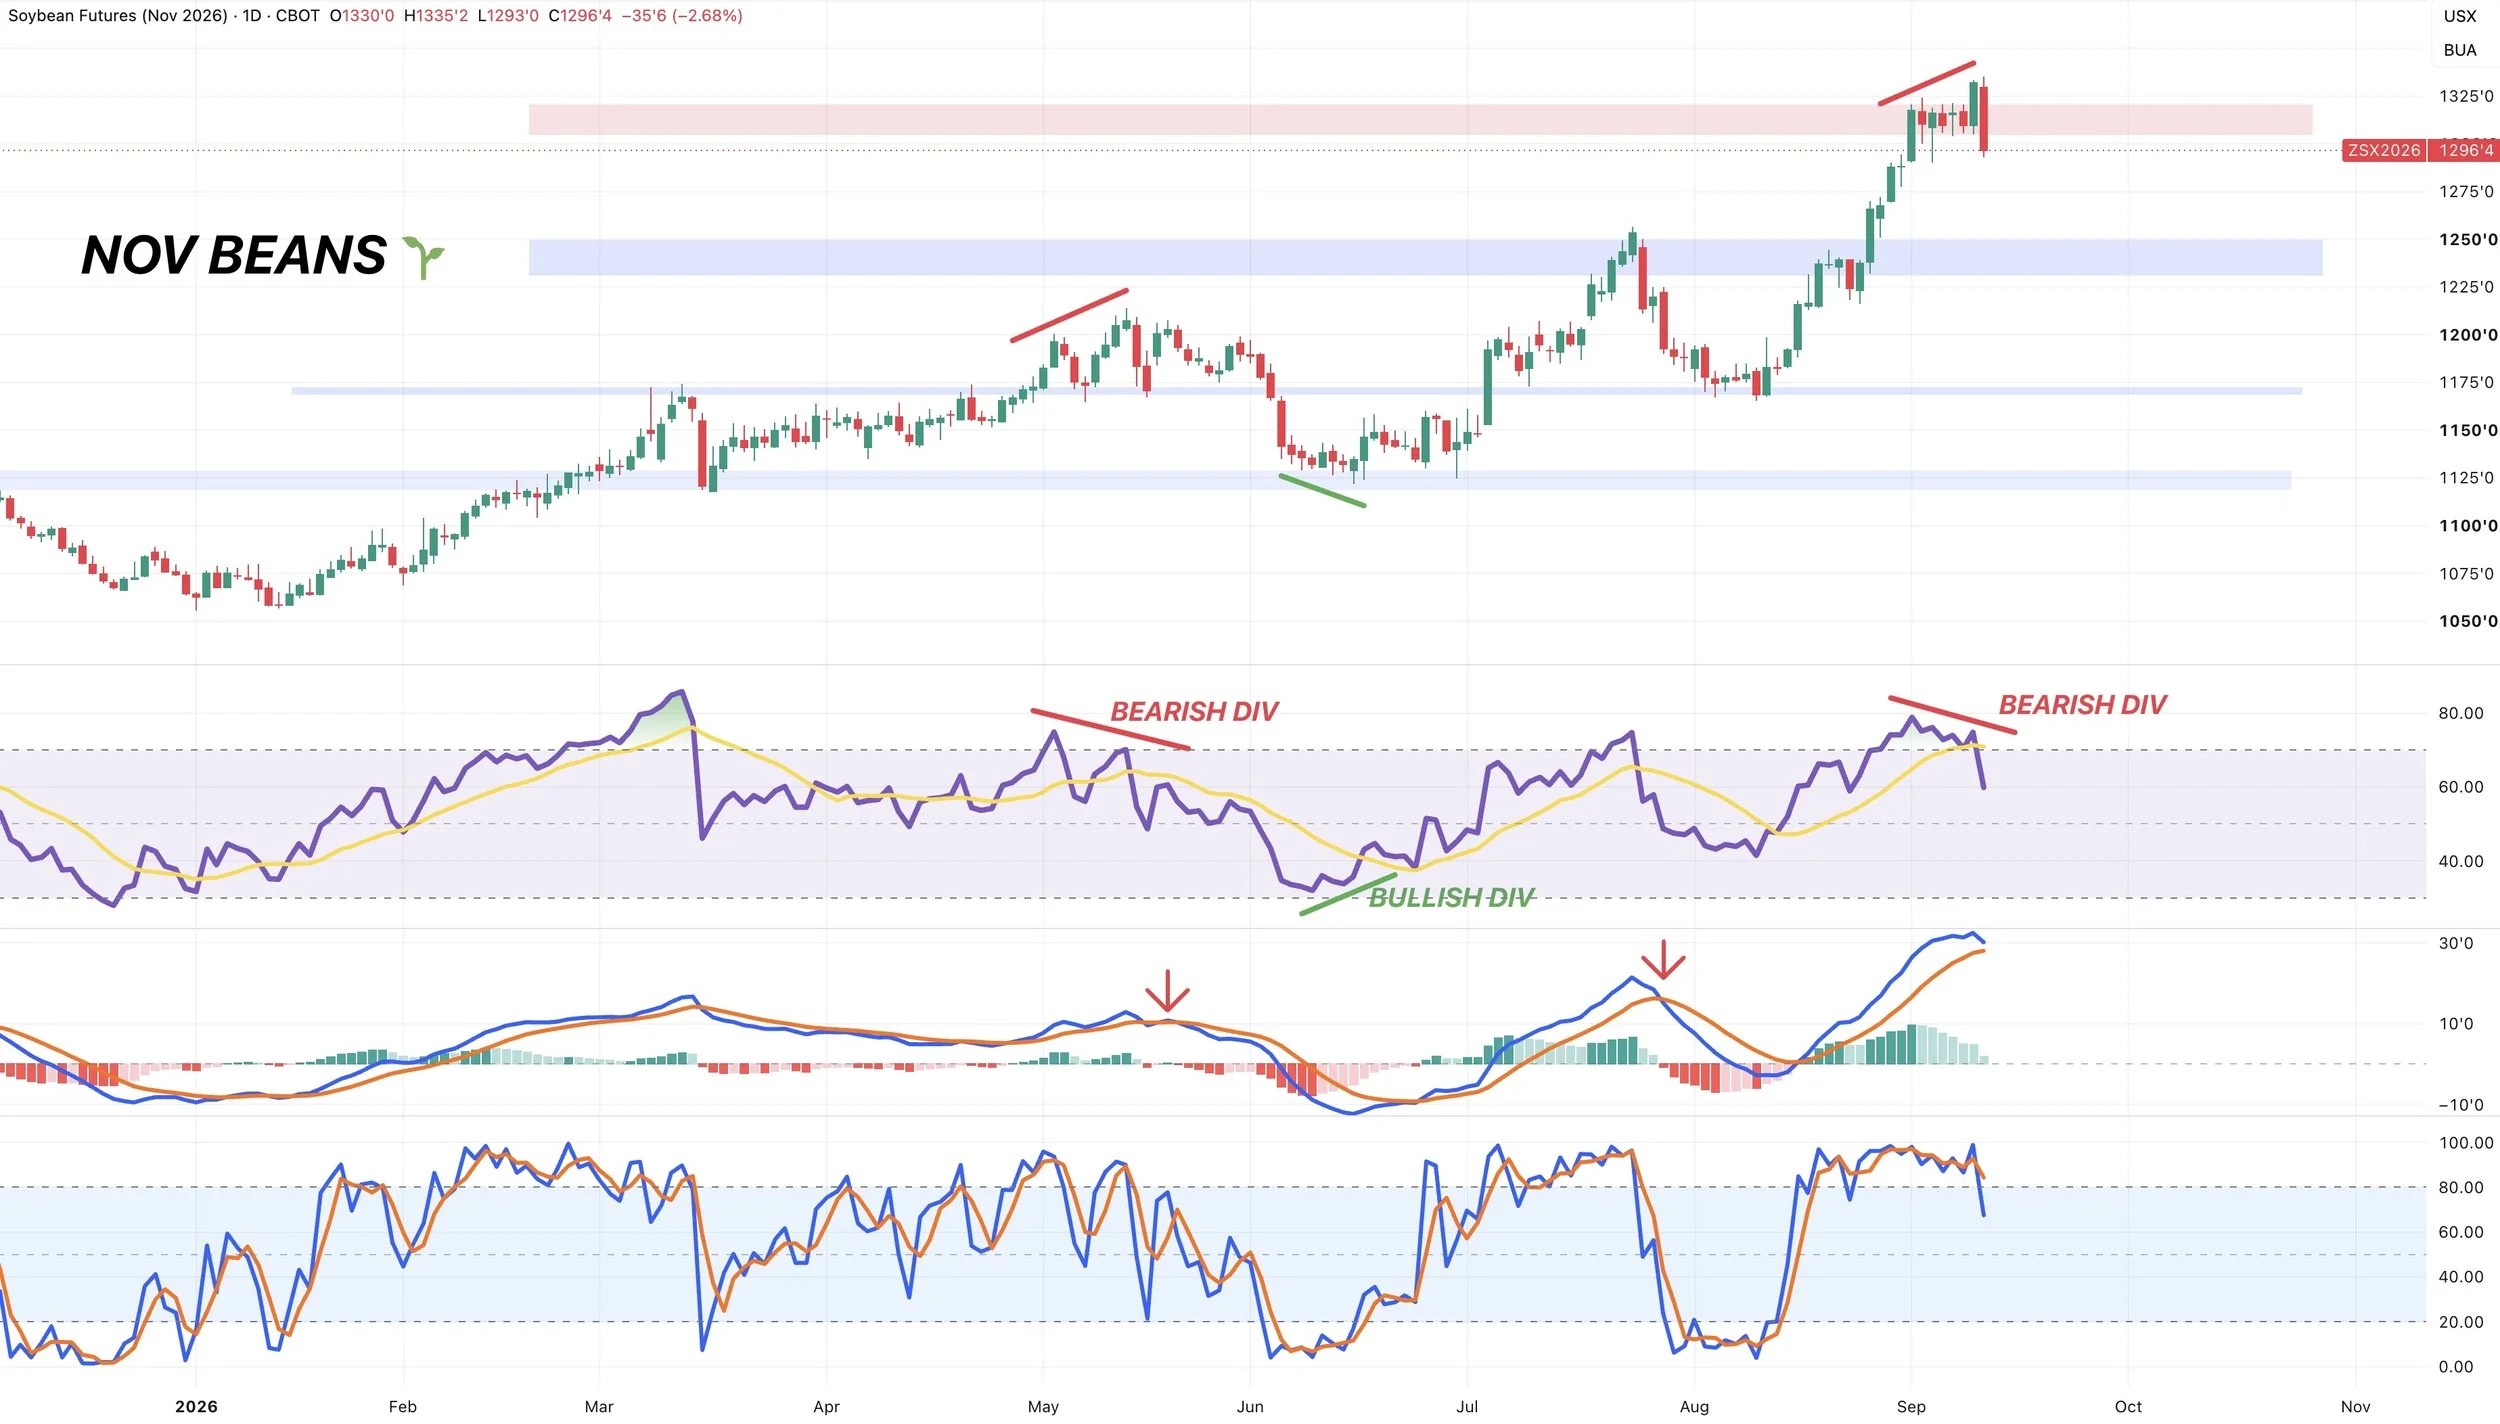
The indicators also suggest we could be in for some further weakness short term.
We had bearish divergence on the RSI yesterday which is playing out today.
Prices made new highs. The RSI did not.
The MACD is curling lower, looking like it may want to cross bearish from here.
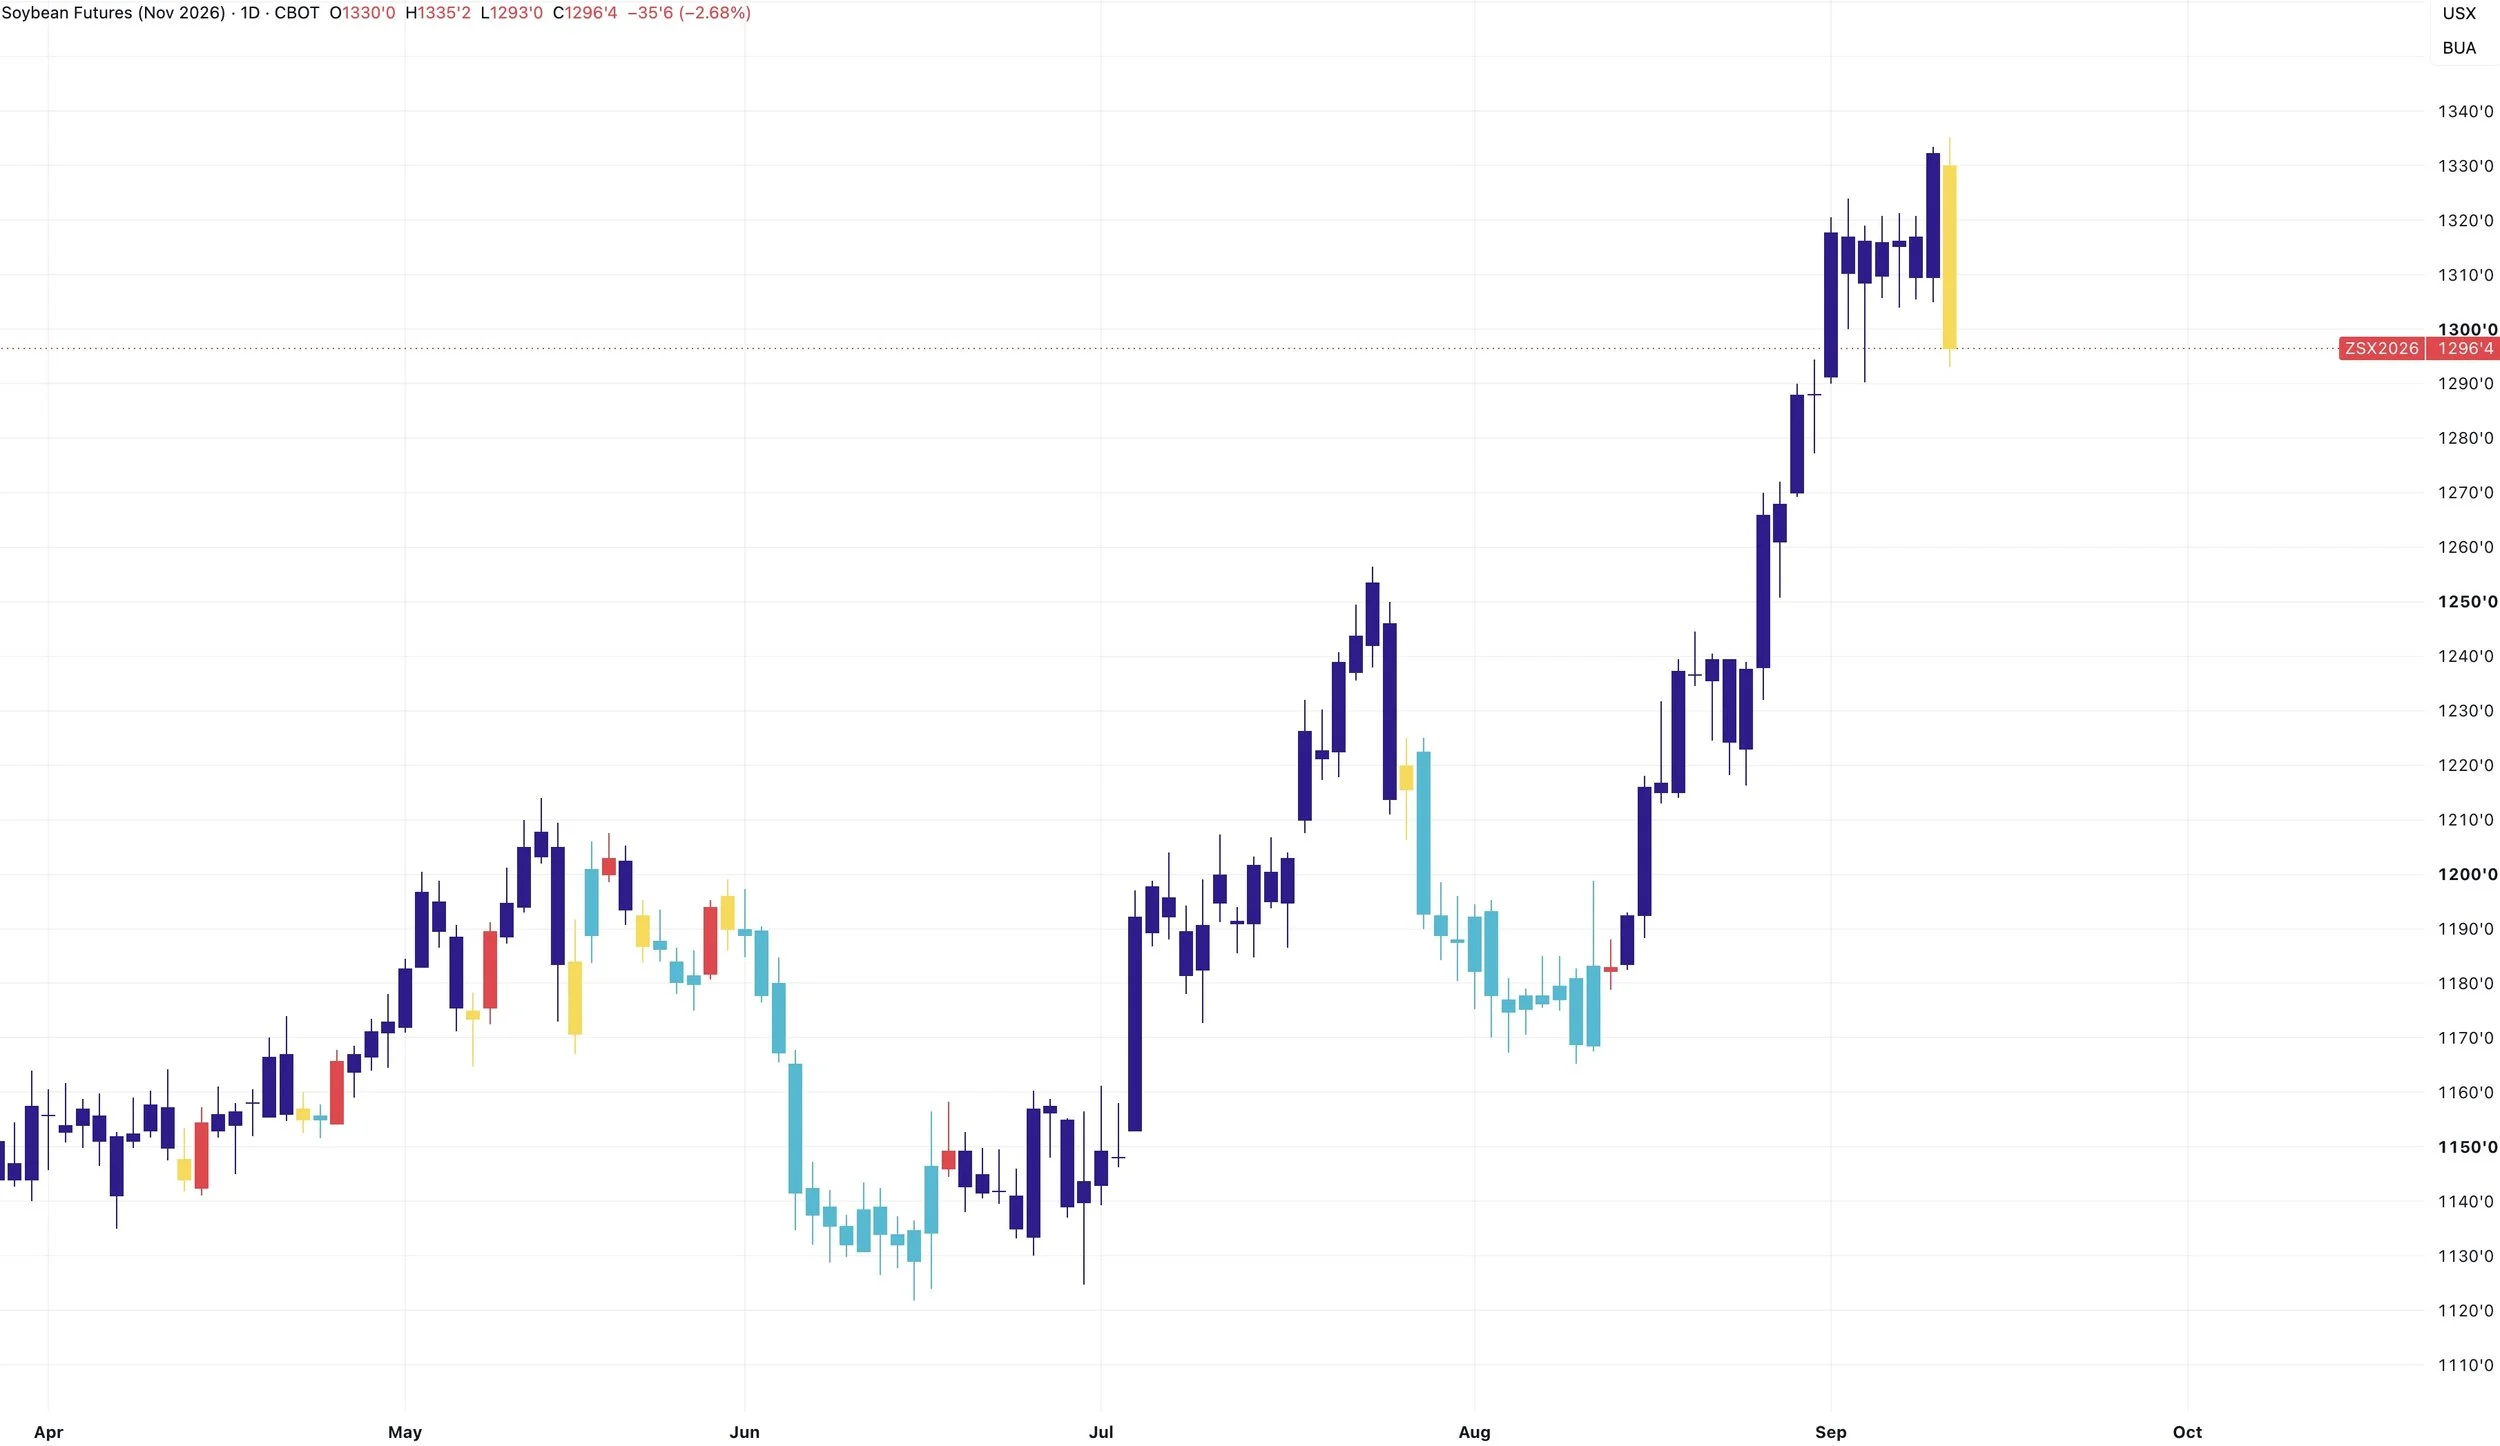
Here is the bullish and bearish candle indicator.
We just got our first yellow bearish candle since right before that August pull back.
Obviously doesn’t mean we "have" to continue lower. Simply another reason why some further downside would not be a surprise.
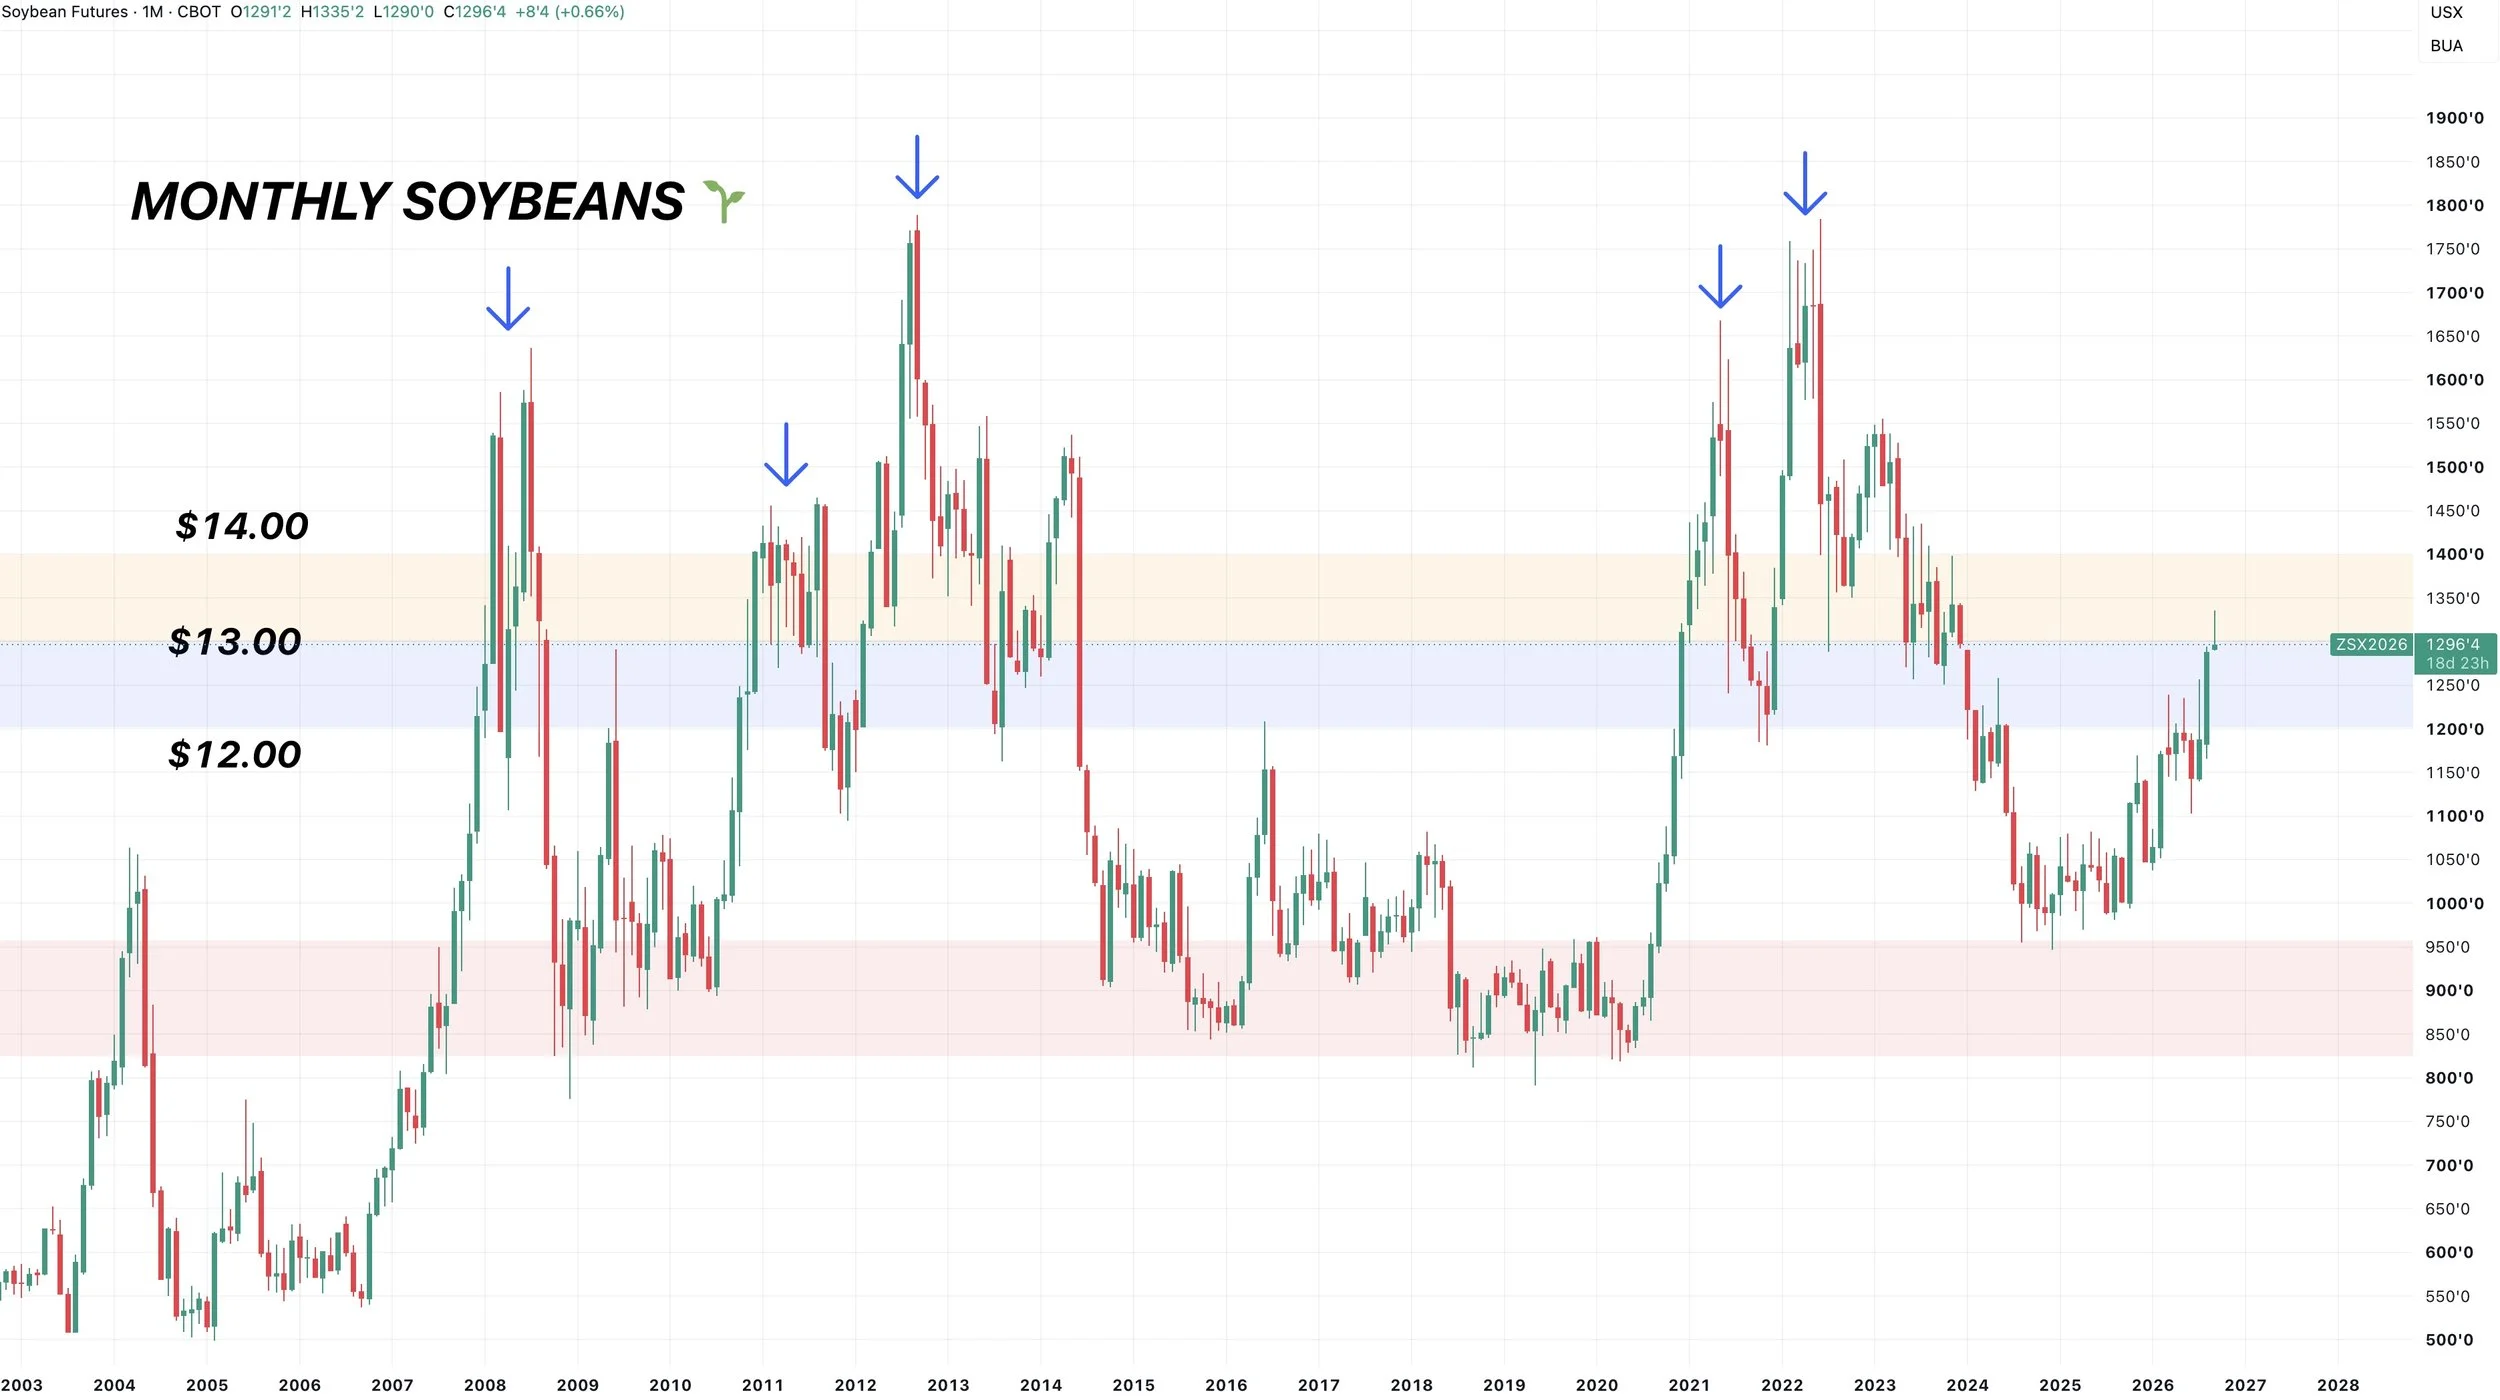
Eventual $14 Beans?
Every single time soybeans have seen a monthly close above $12.00, we have eventually ran to $14.00
We could go lower first, but I think there is a chance we see $14.00 at some point.
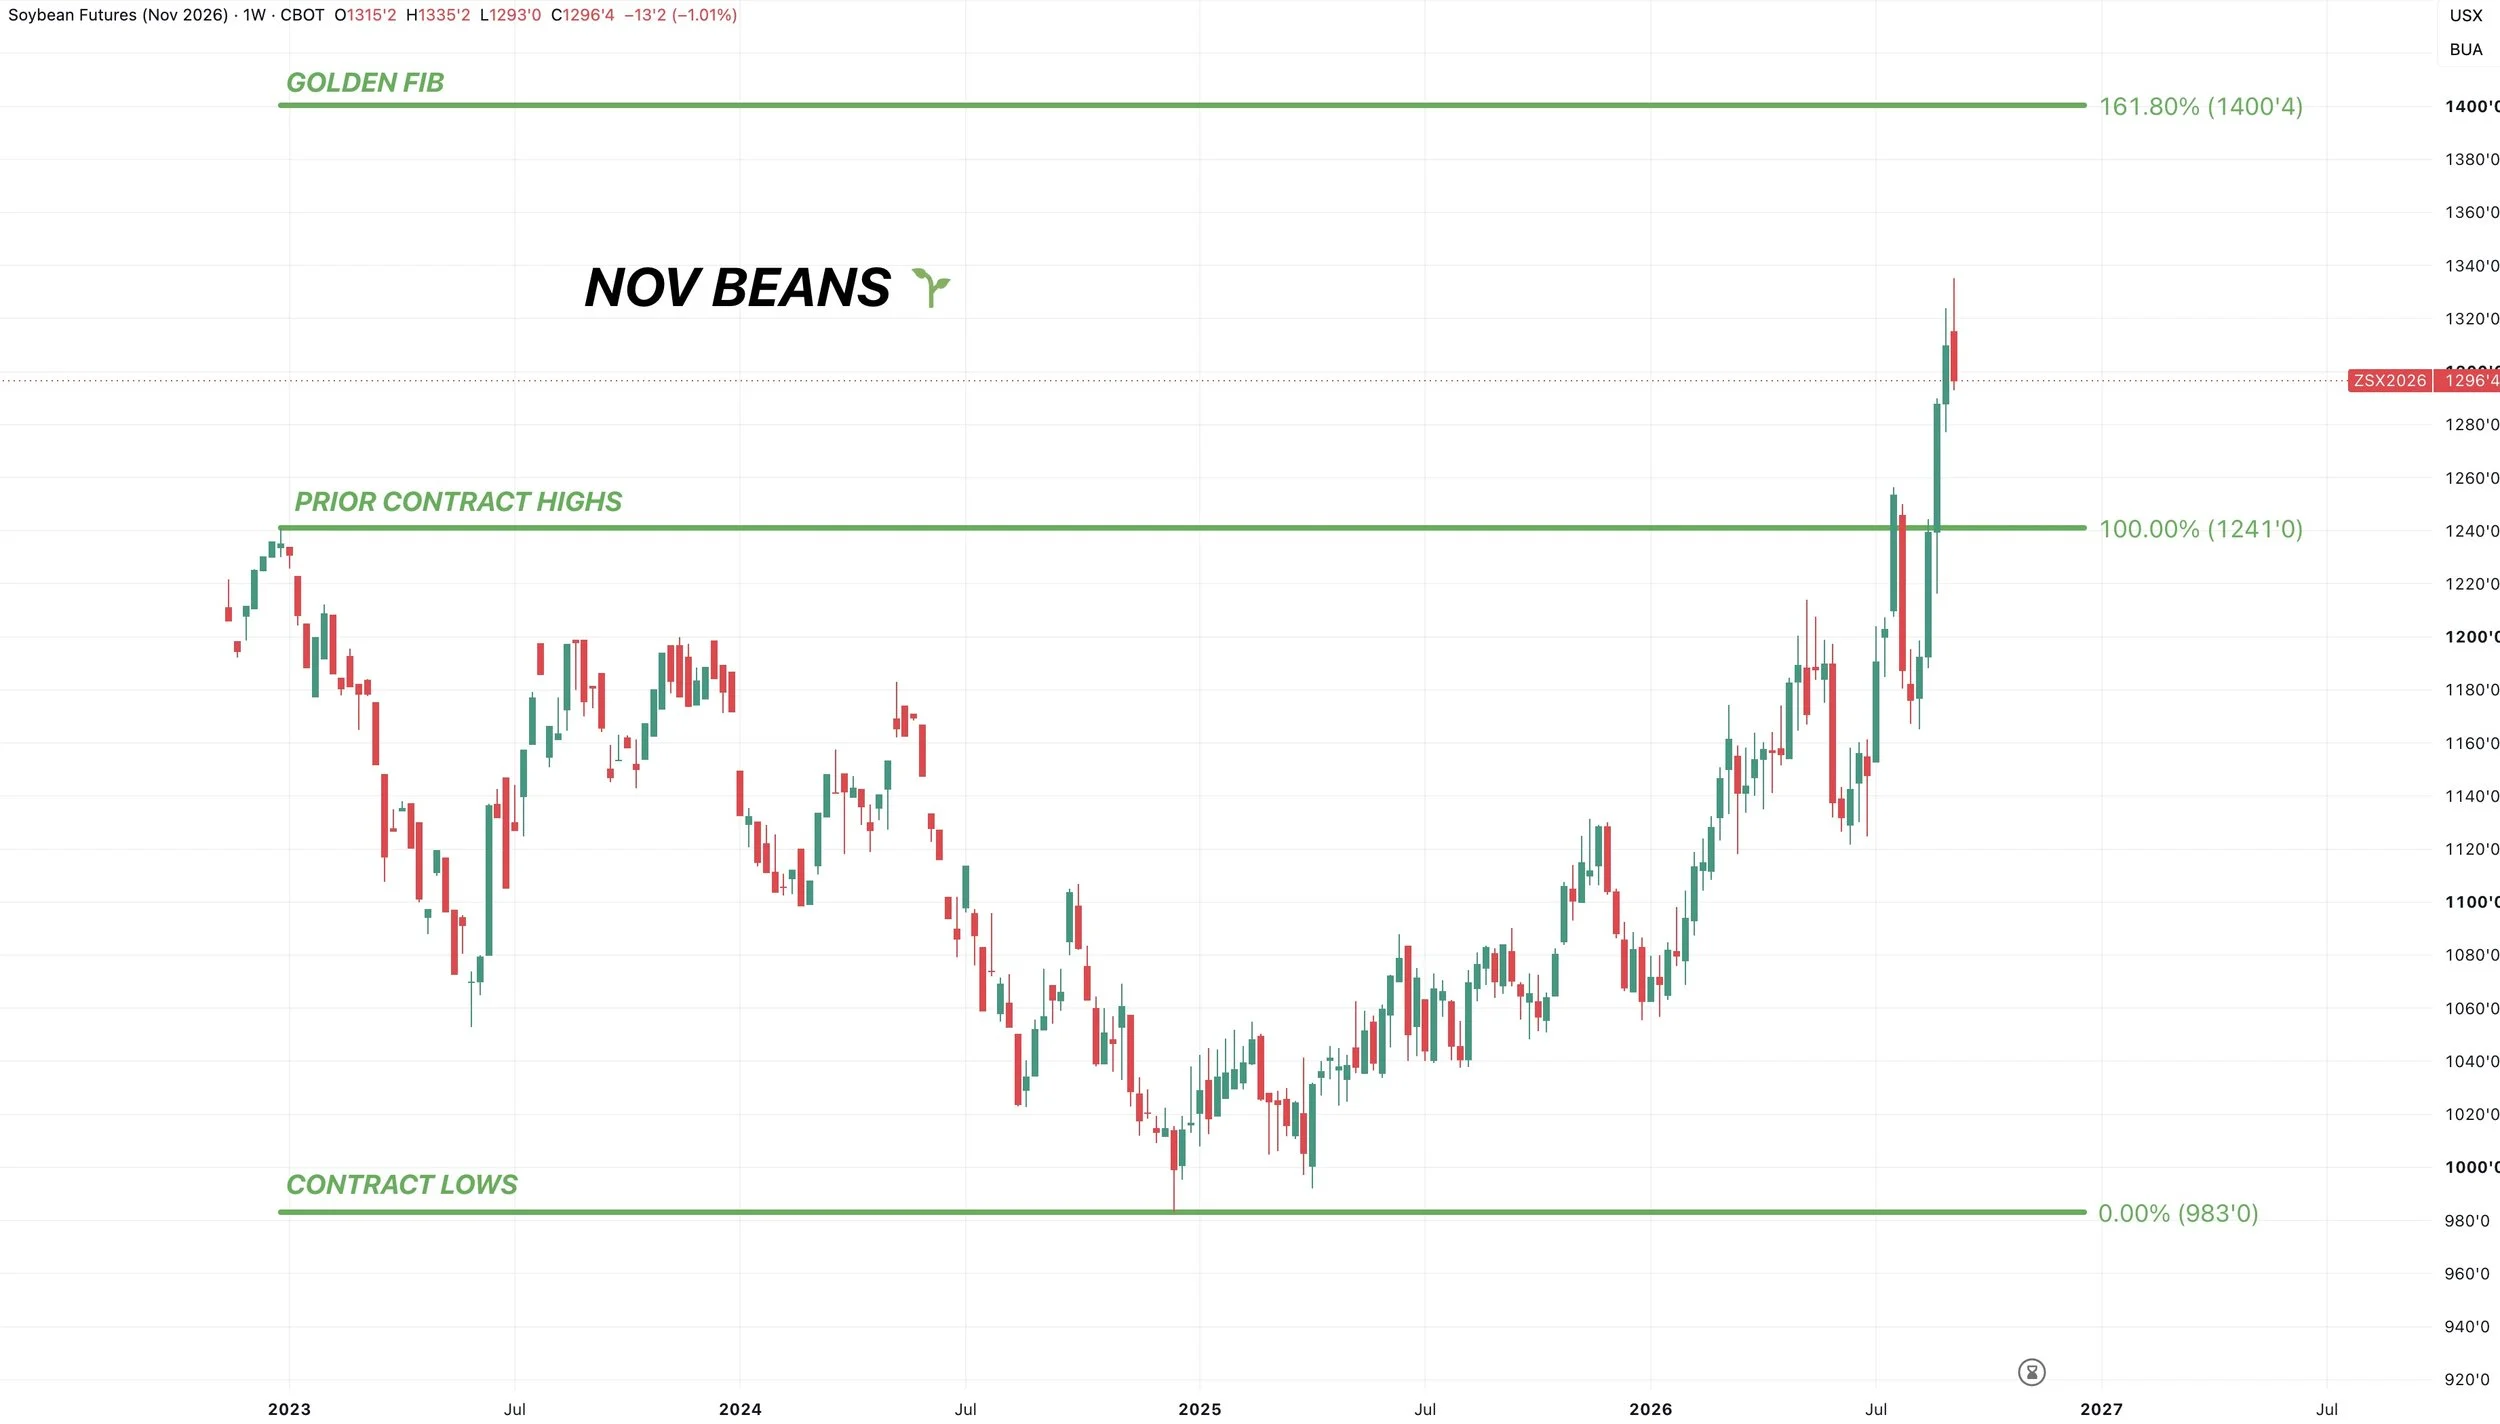
If you look at the weekly chart for Nov beans.
The golden fib from the contract lows up to the previous contract highs also sits right at $14.00
Meaning $14.00 is 161.8% of those contract lows, up to the prior contract highs.
So that is going to be why this is a possible long term target.
Wheat
The report didn’t change much. The US situation as unchanged.
The world situation was a bearish surprise. We have the Black Sea issues, but that's not actually a supply issue. It's more of an issue of getting the supply to move. If that continues, it could still definitely cause some issues.
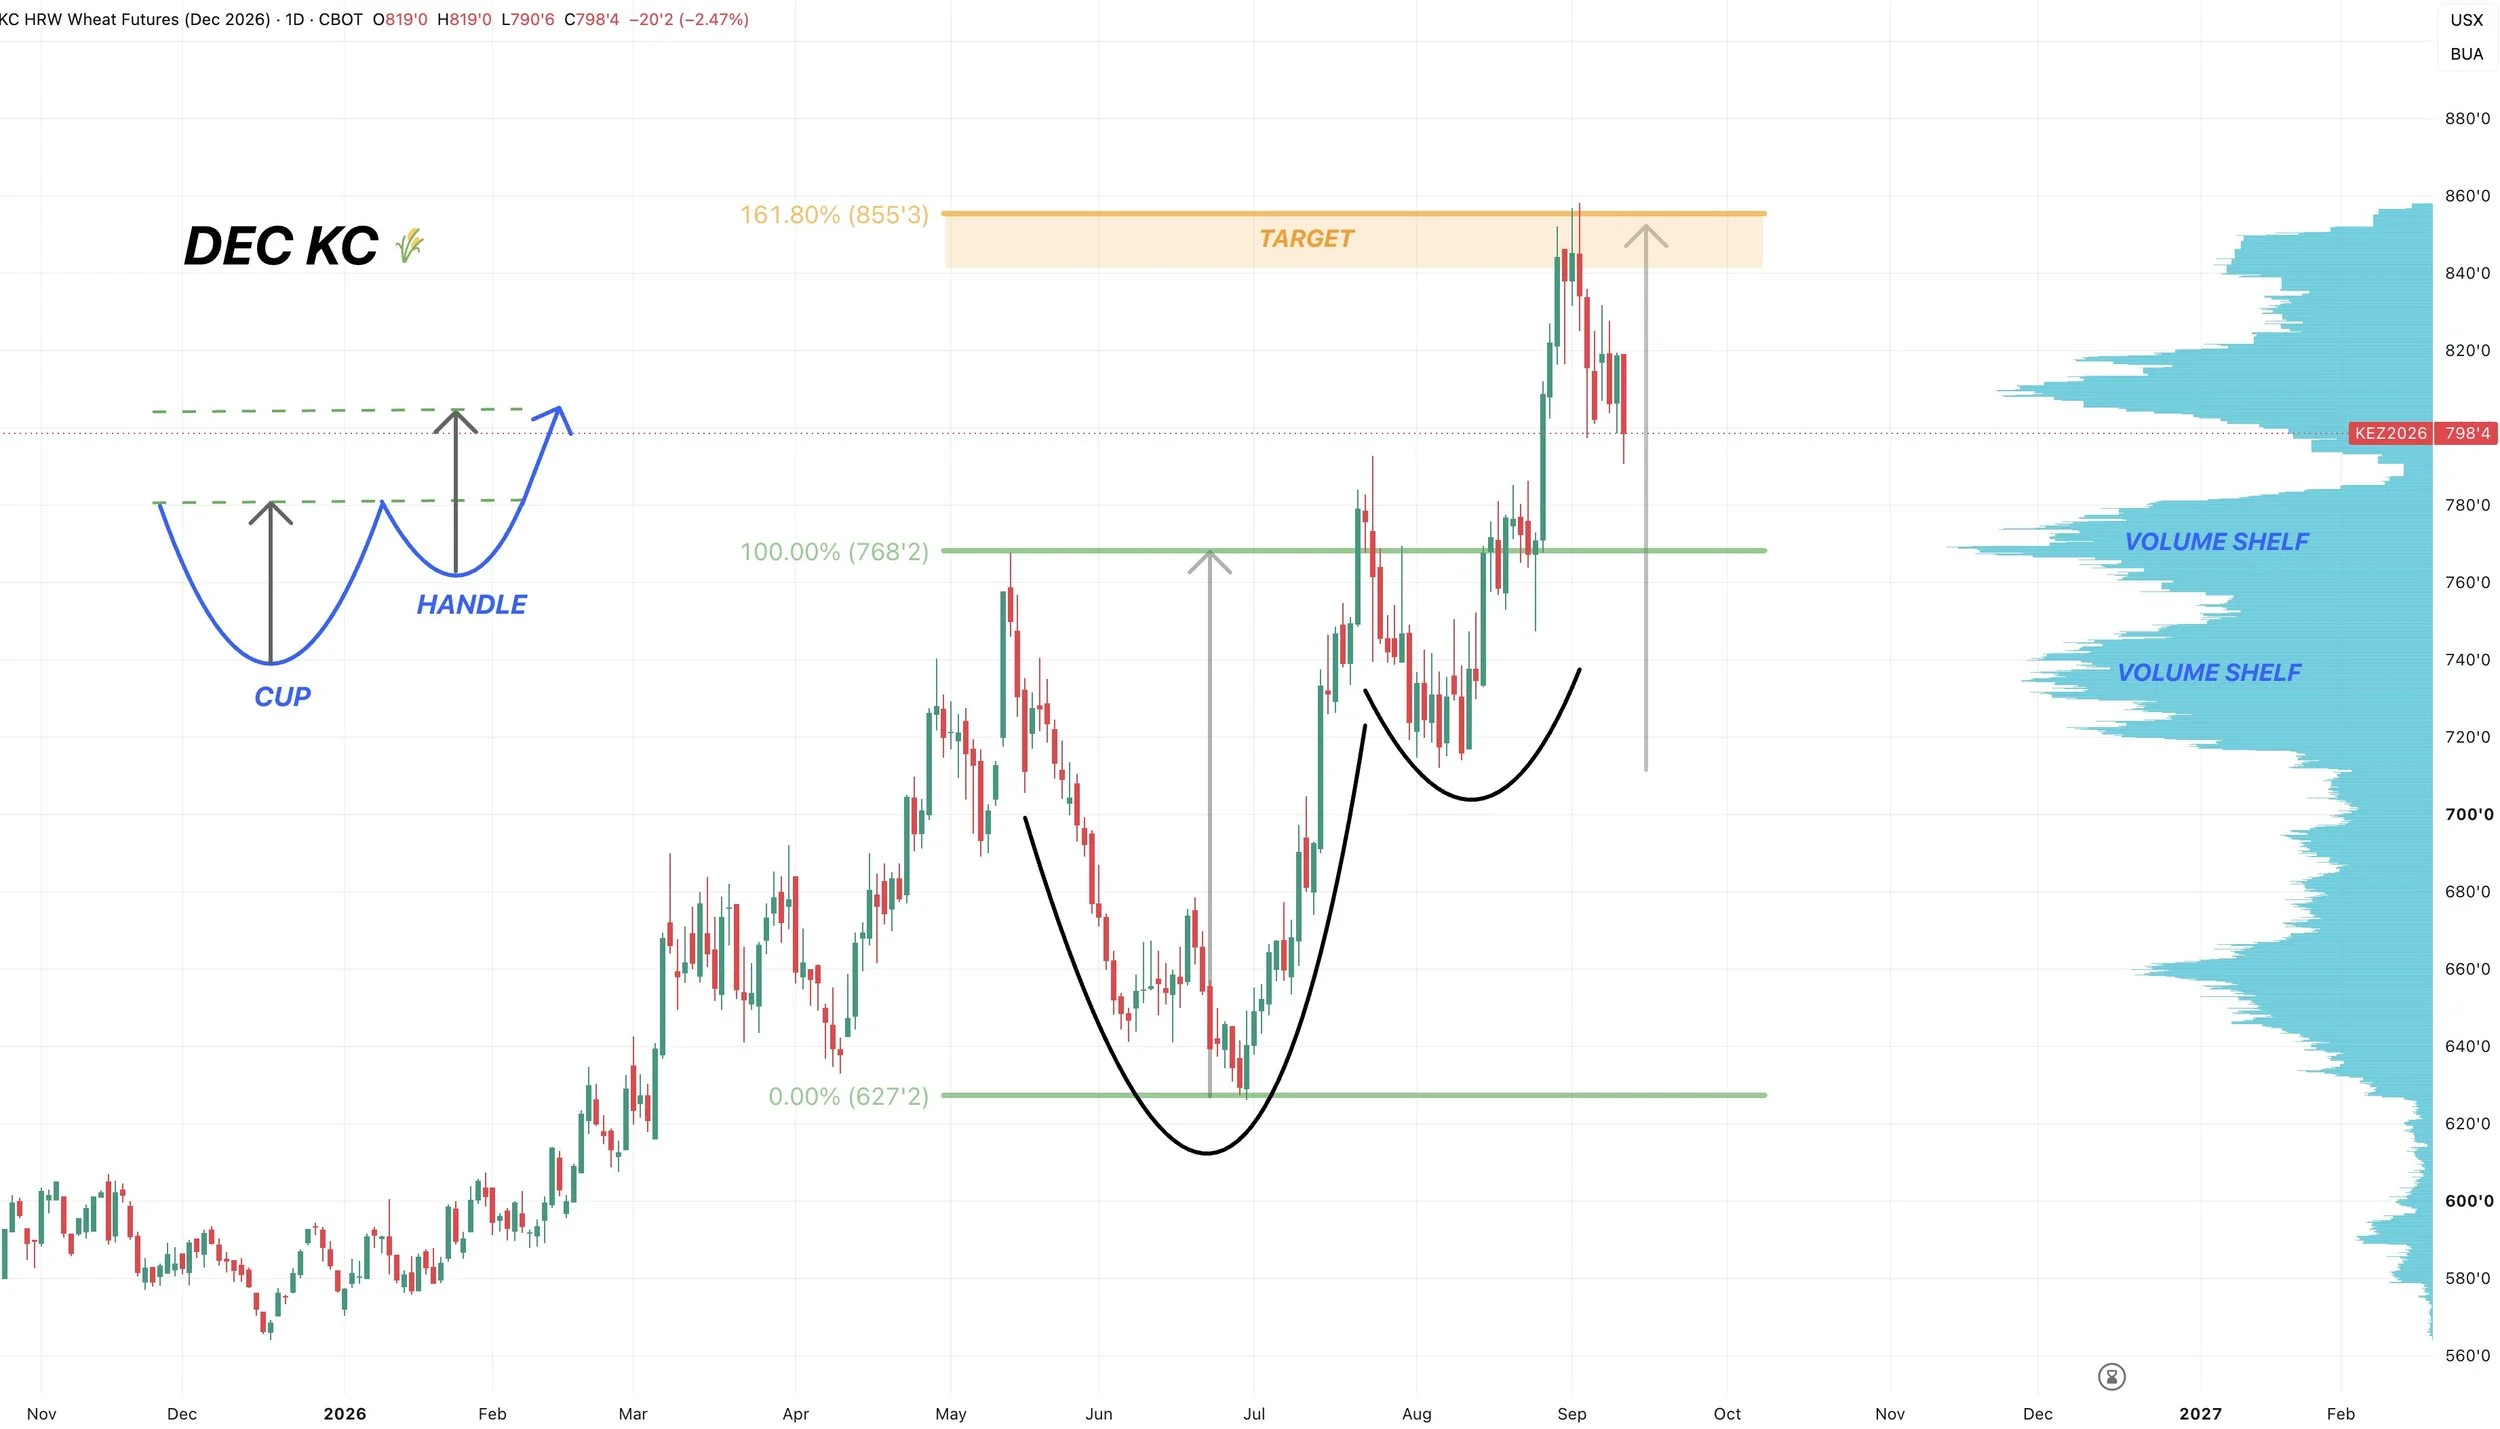
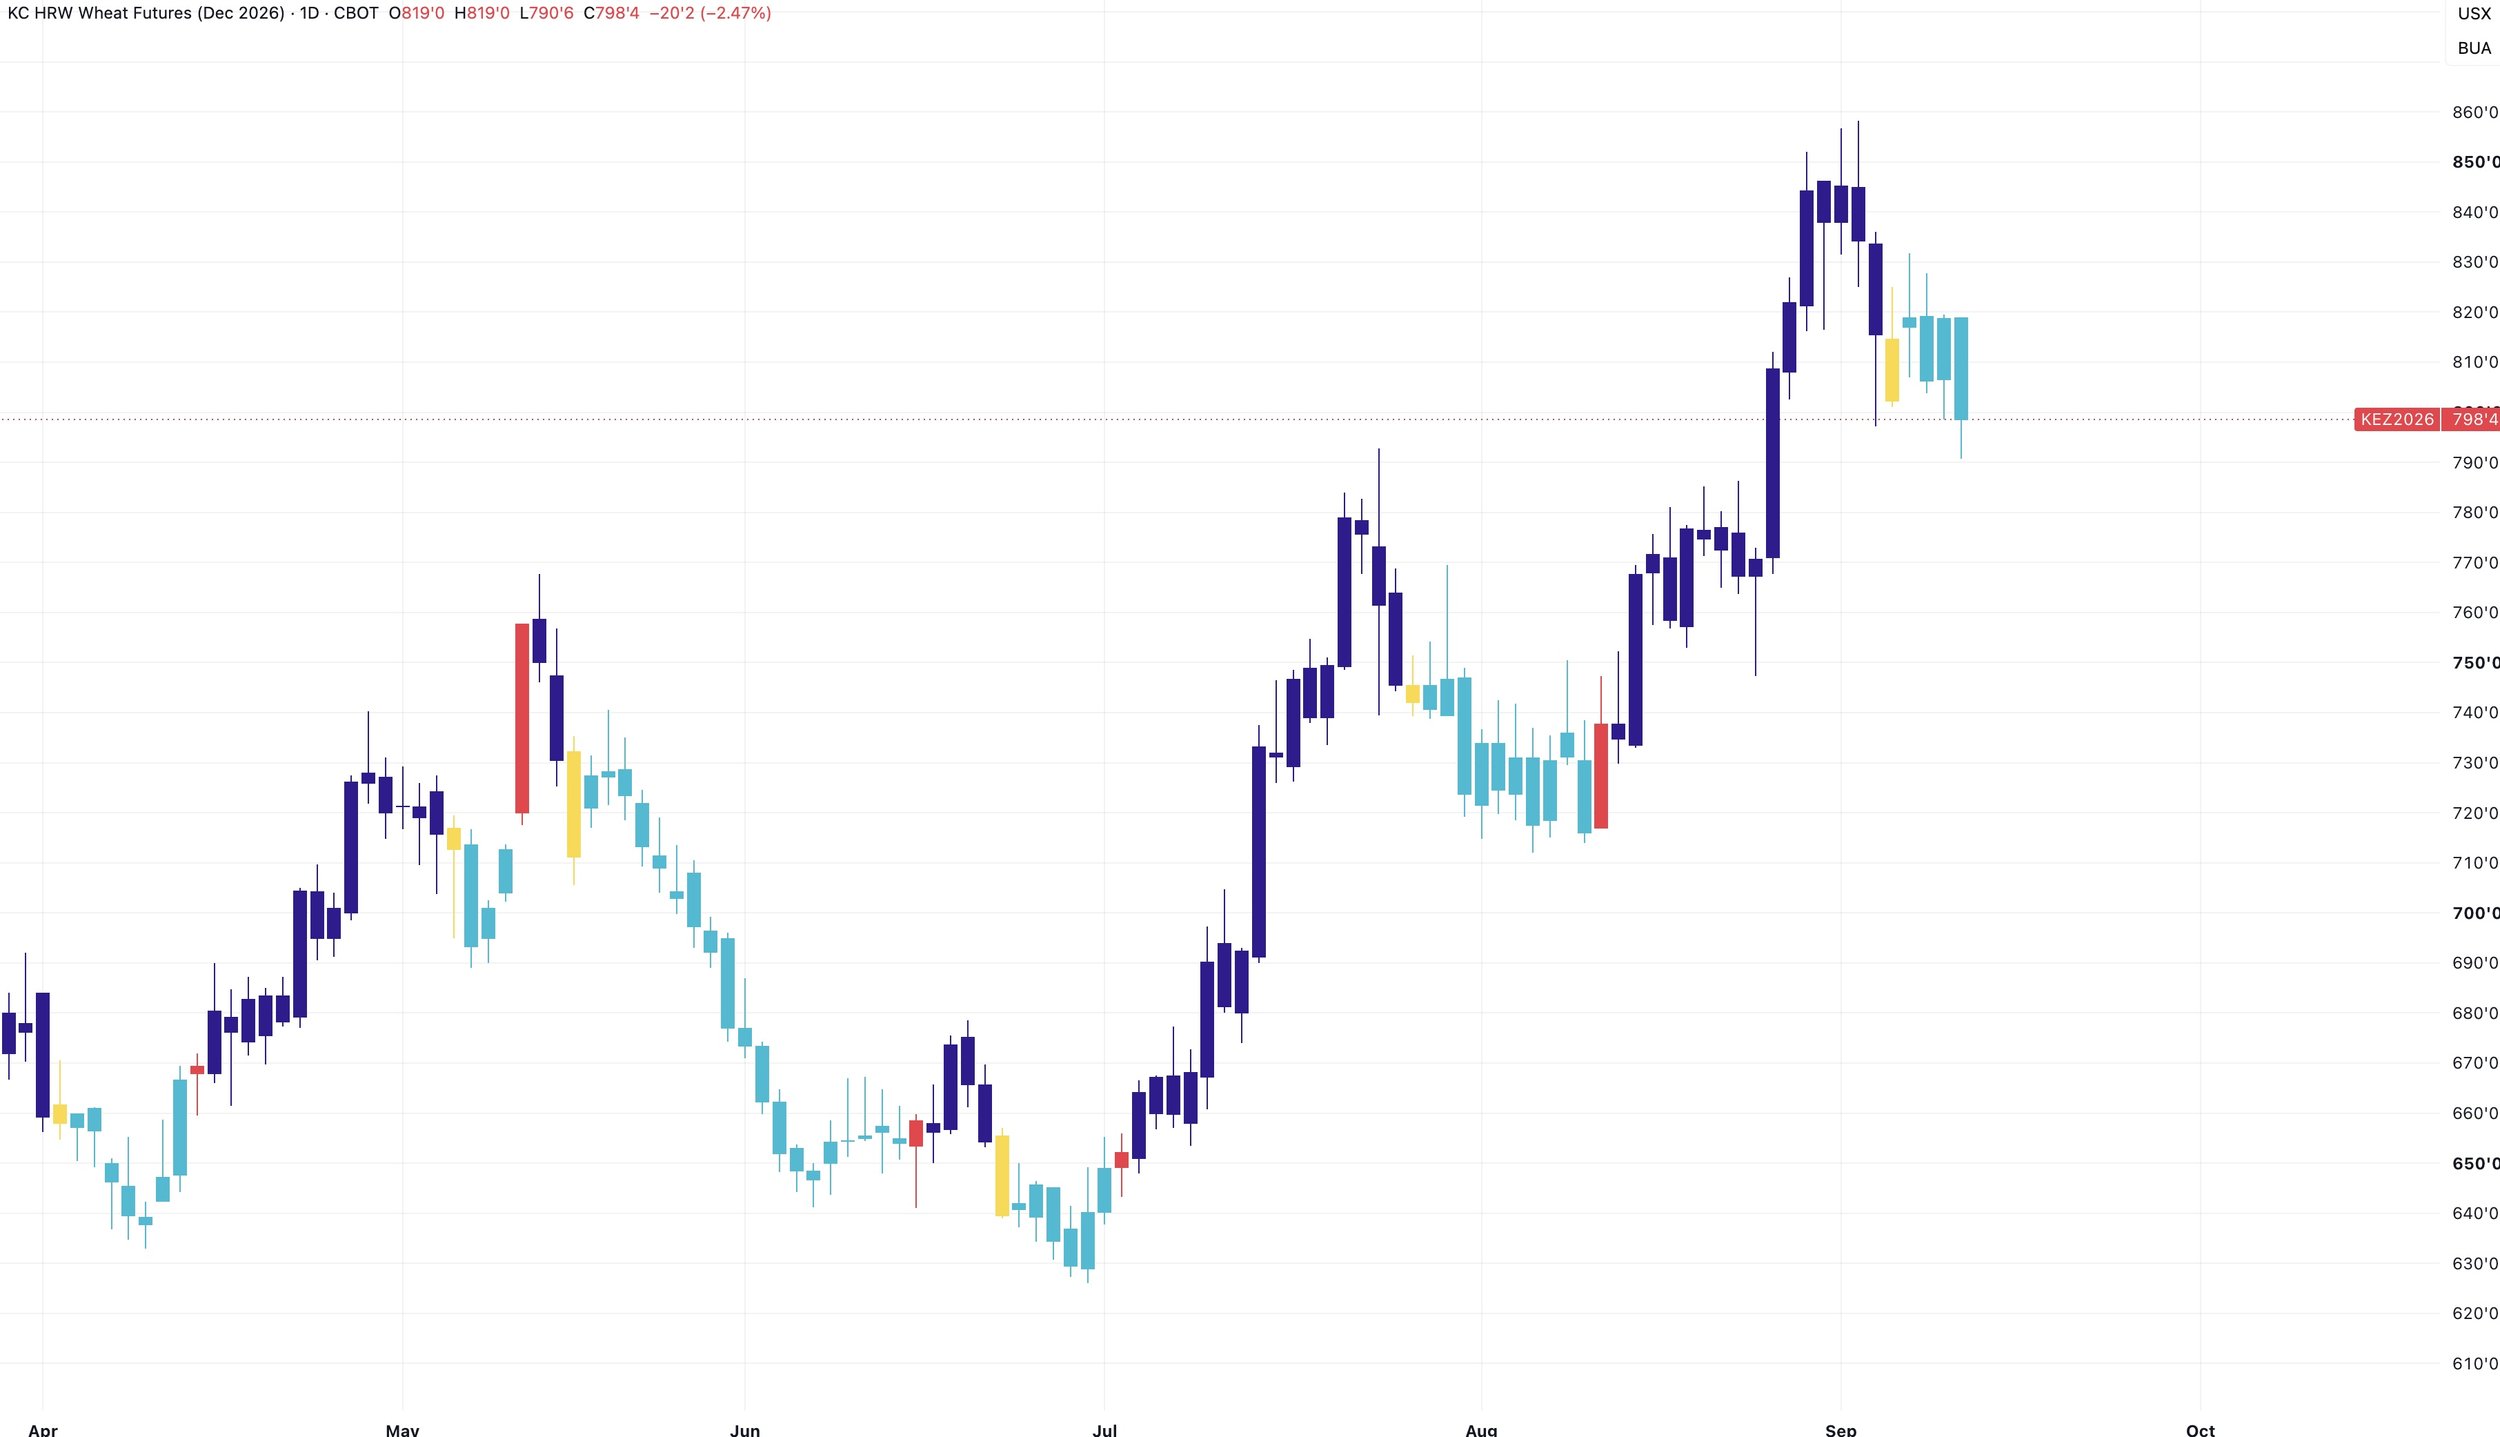
Dec KC Chart:
We rejected right off that target and where we issued that sell signal and hedge alert.
If you missed the alert: Click Here
That target was the golden fib. 161.8% of the June lows up to the May highs. A very common continuation target in a bullish market.
That same level was the exact implied move from the cup and handle pattern we broke out of.
We are now seeing that expected pull back.
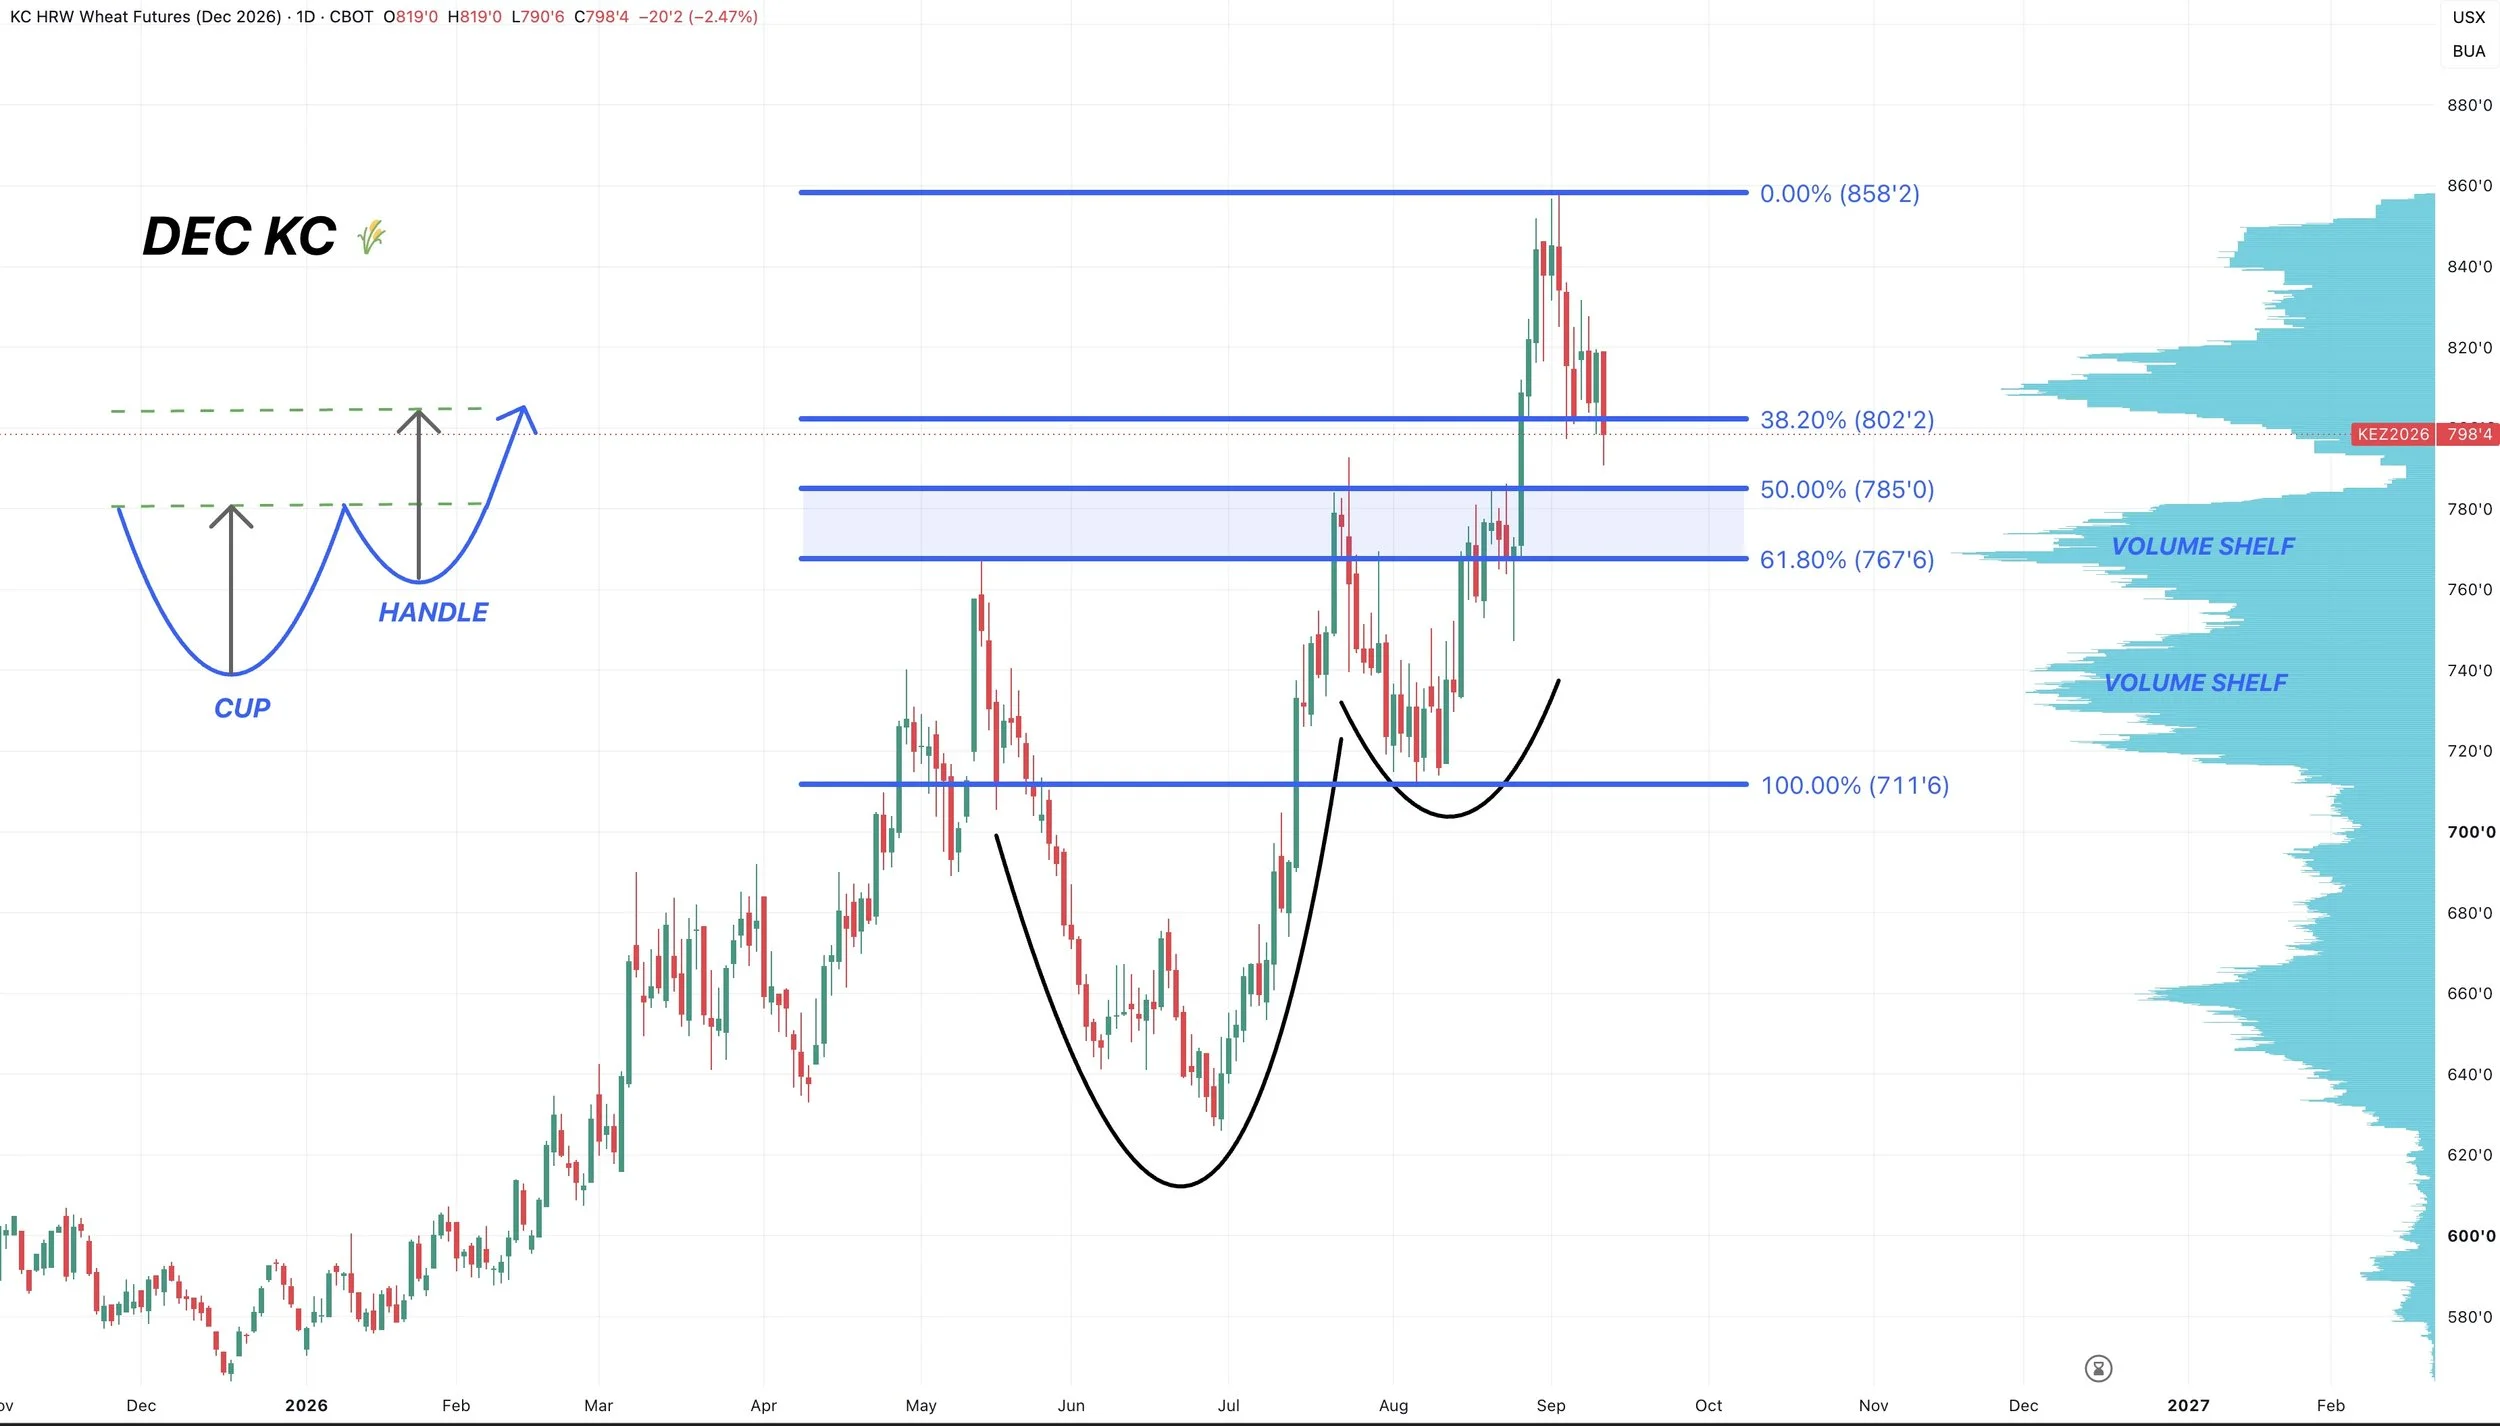
Where could we bottom?
I am still watching that golden zone.
$7.68 to $7.85 gives back 50% to 61.8% of the rally from August.
That would also be a perfect re-test of the prior highs. Turning that old resistance into new support.
Not only that, but there is a massive shelf of volume sitting right in that zone.
Areas of high can volume are often magnets for prices.
Here is an update on the candle indicator.
We had that yellow candle. Now still seeing bearish continuation.
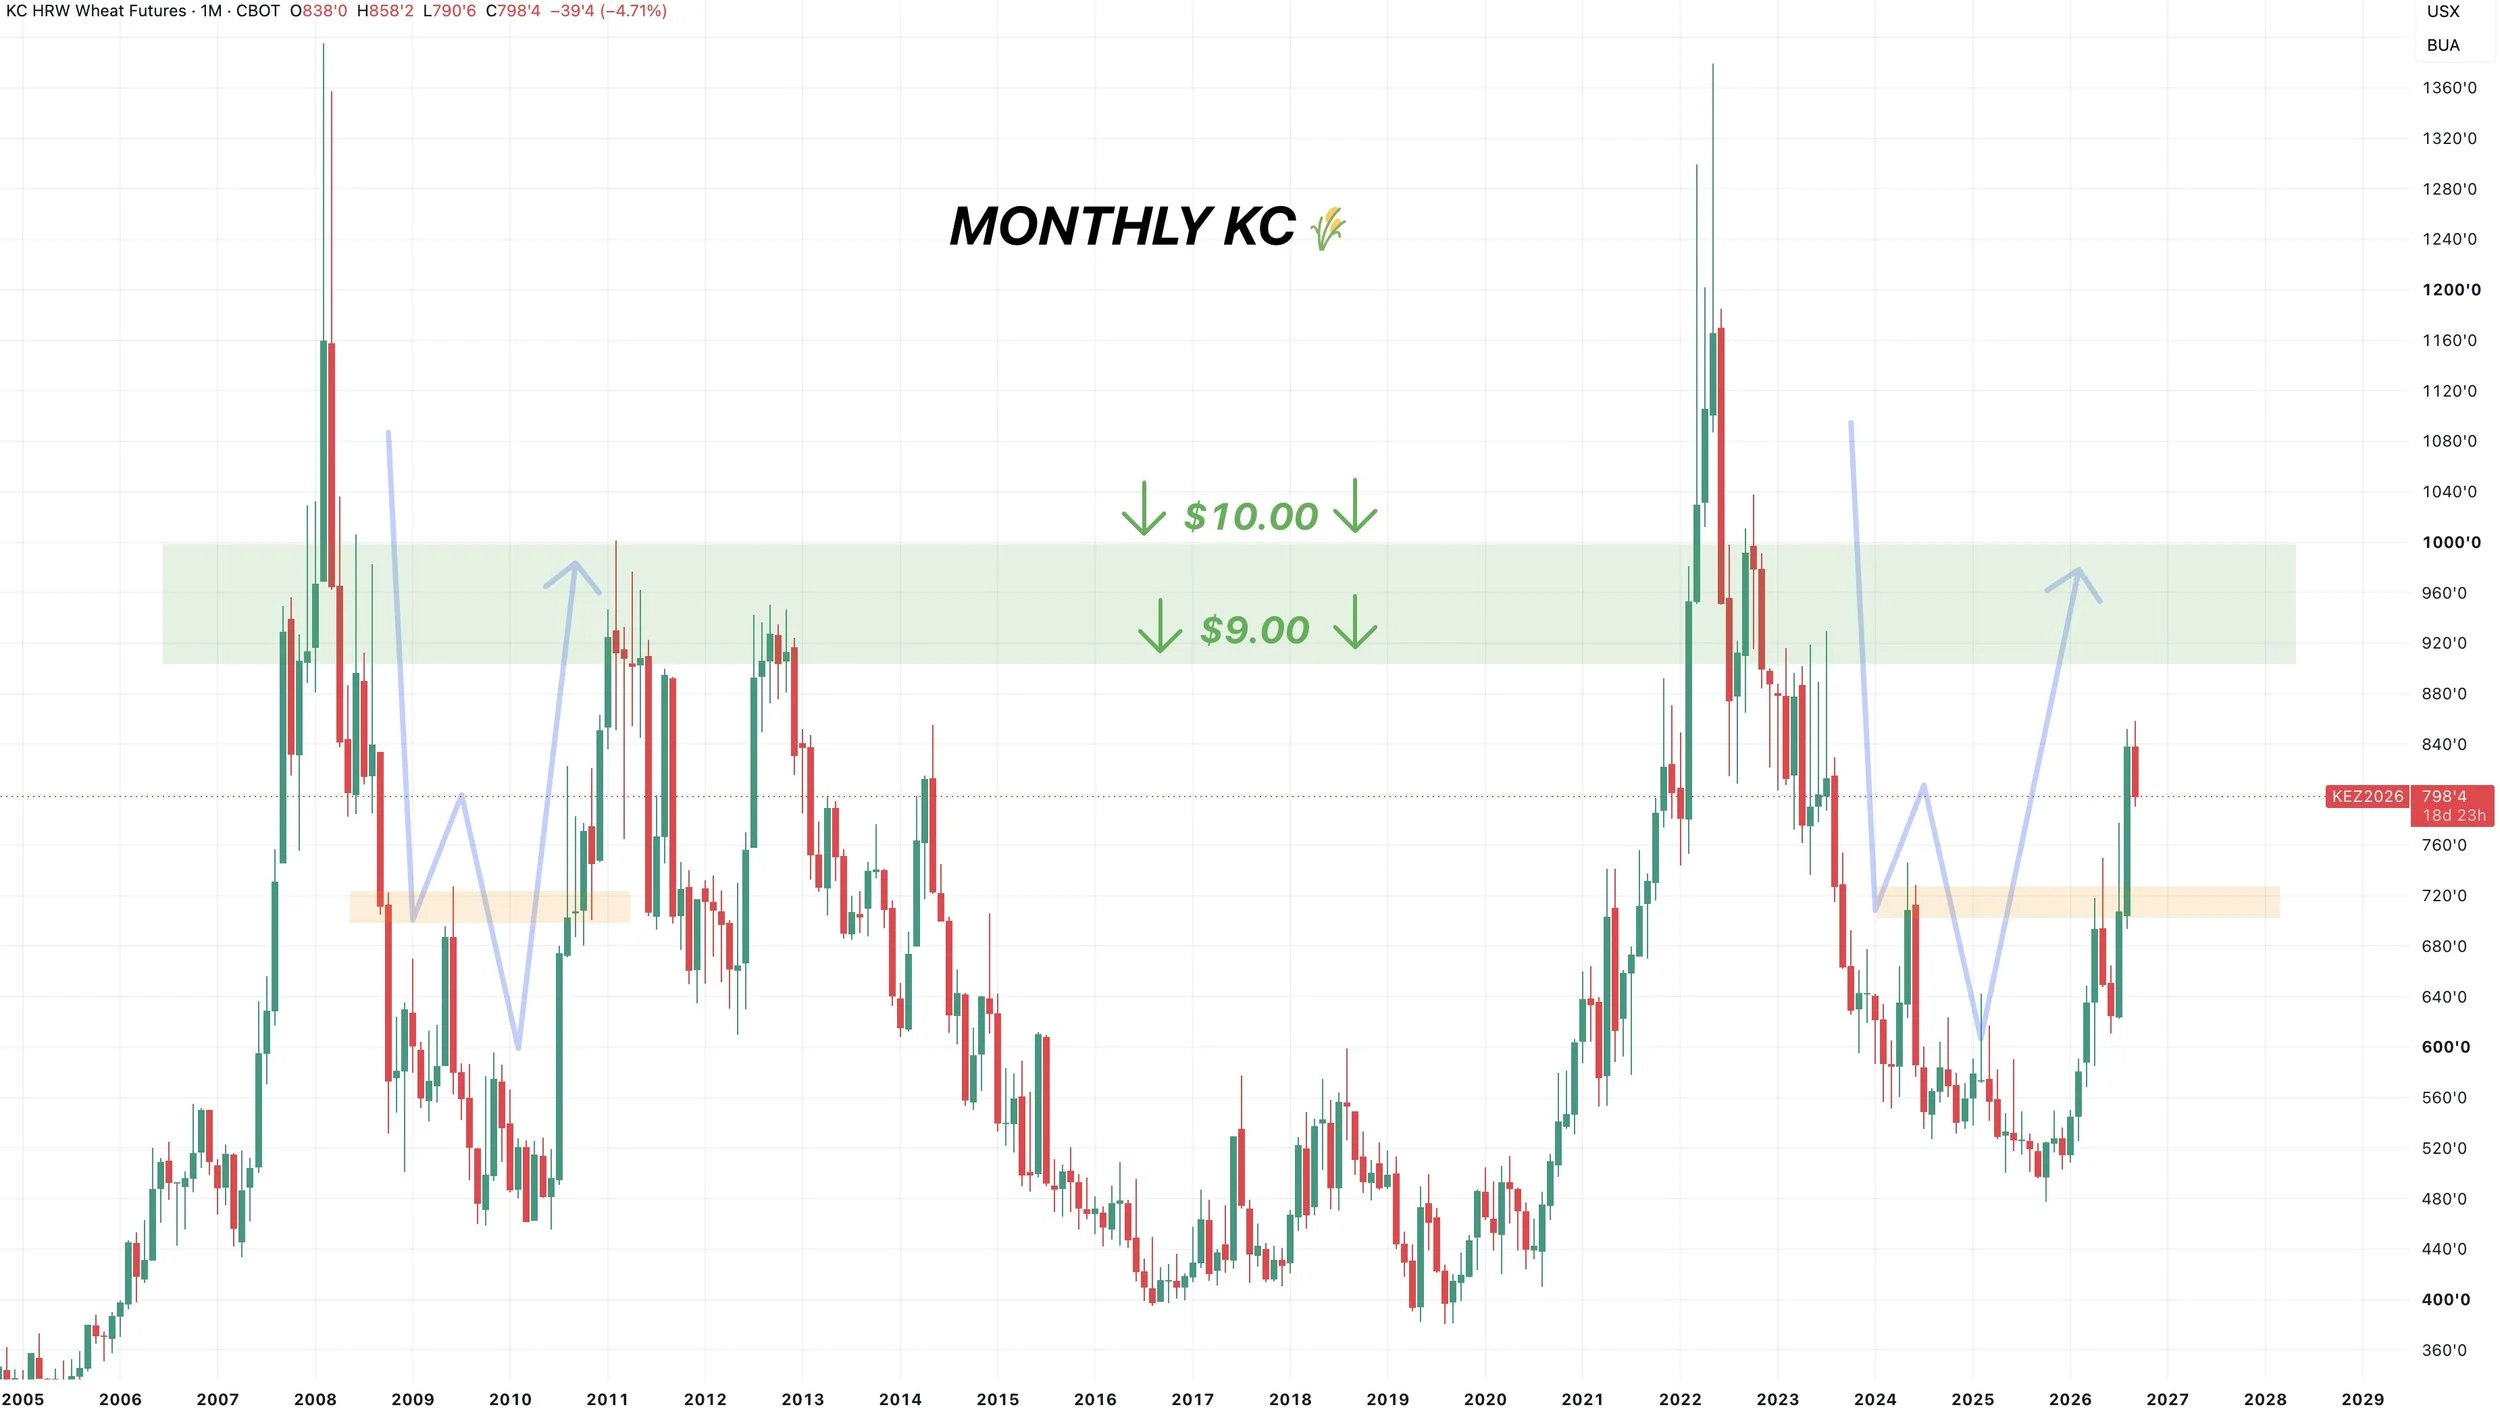
$9 Wheat?
I did want to point out that every single major rally in the wheat market has at least led to $9 to $10.
So I'd say it's absolutely possible we get there long term.
However, if it happens, I would probably be extremely aggresive.
Do you know how many months the wheat market has closed above that green box?
4 months in the entire history of the wheat market.
This rally does still look extremely similar to that one we saw in 2011.
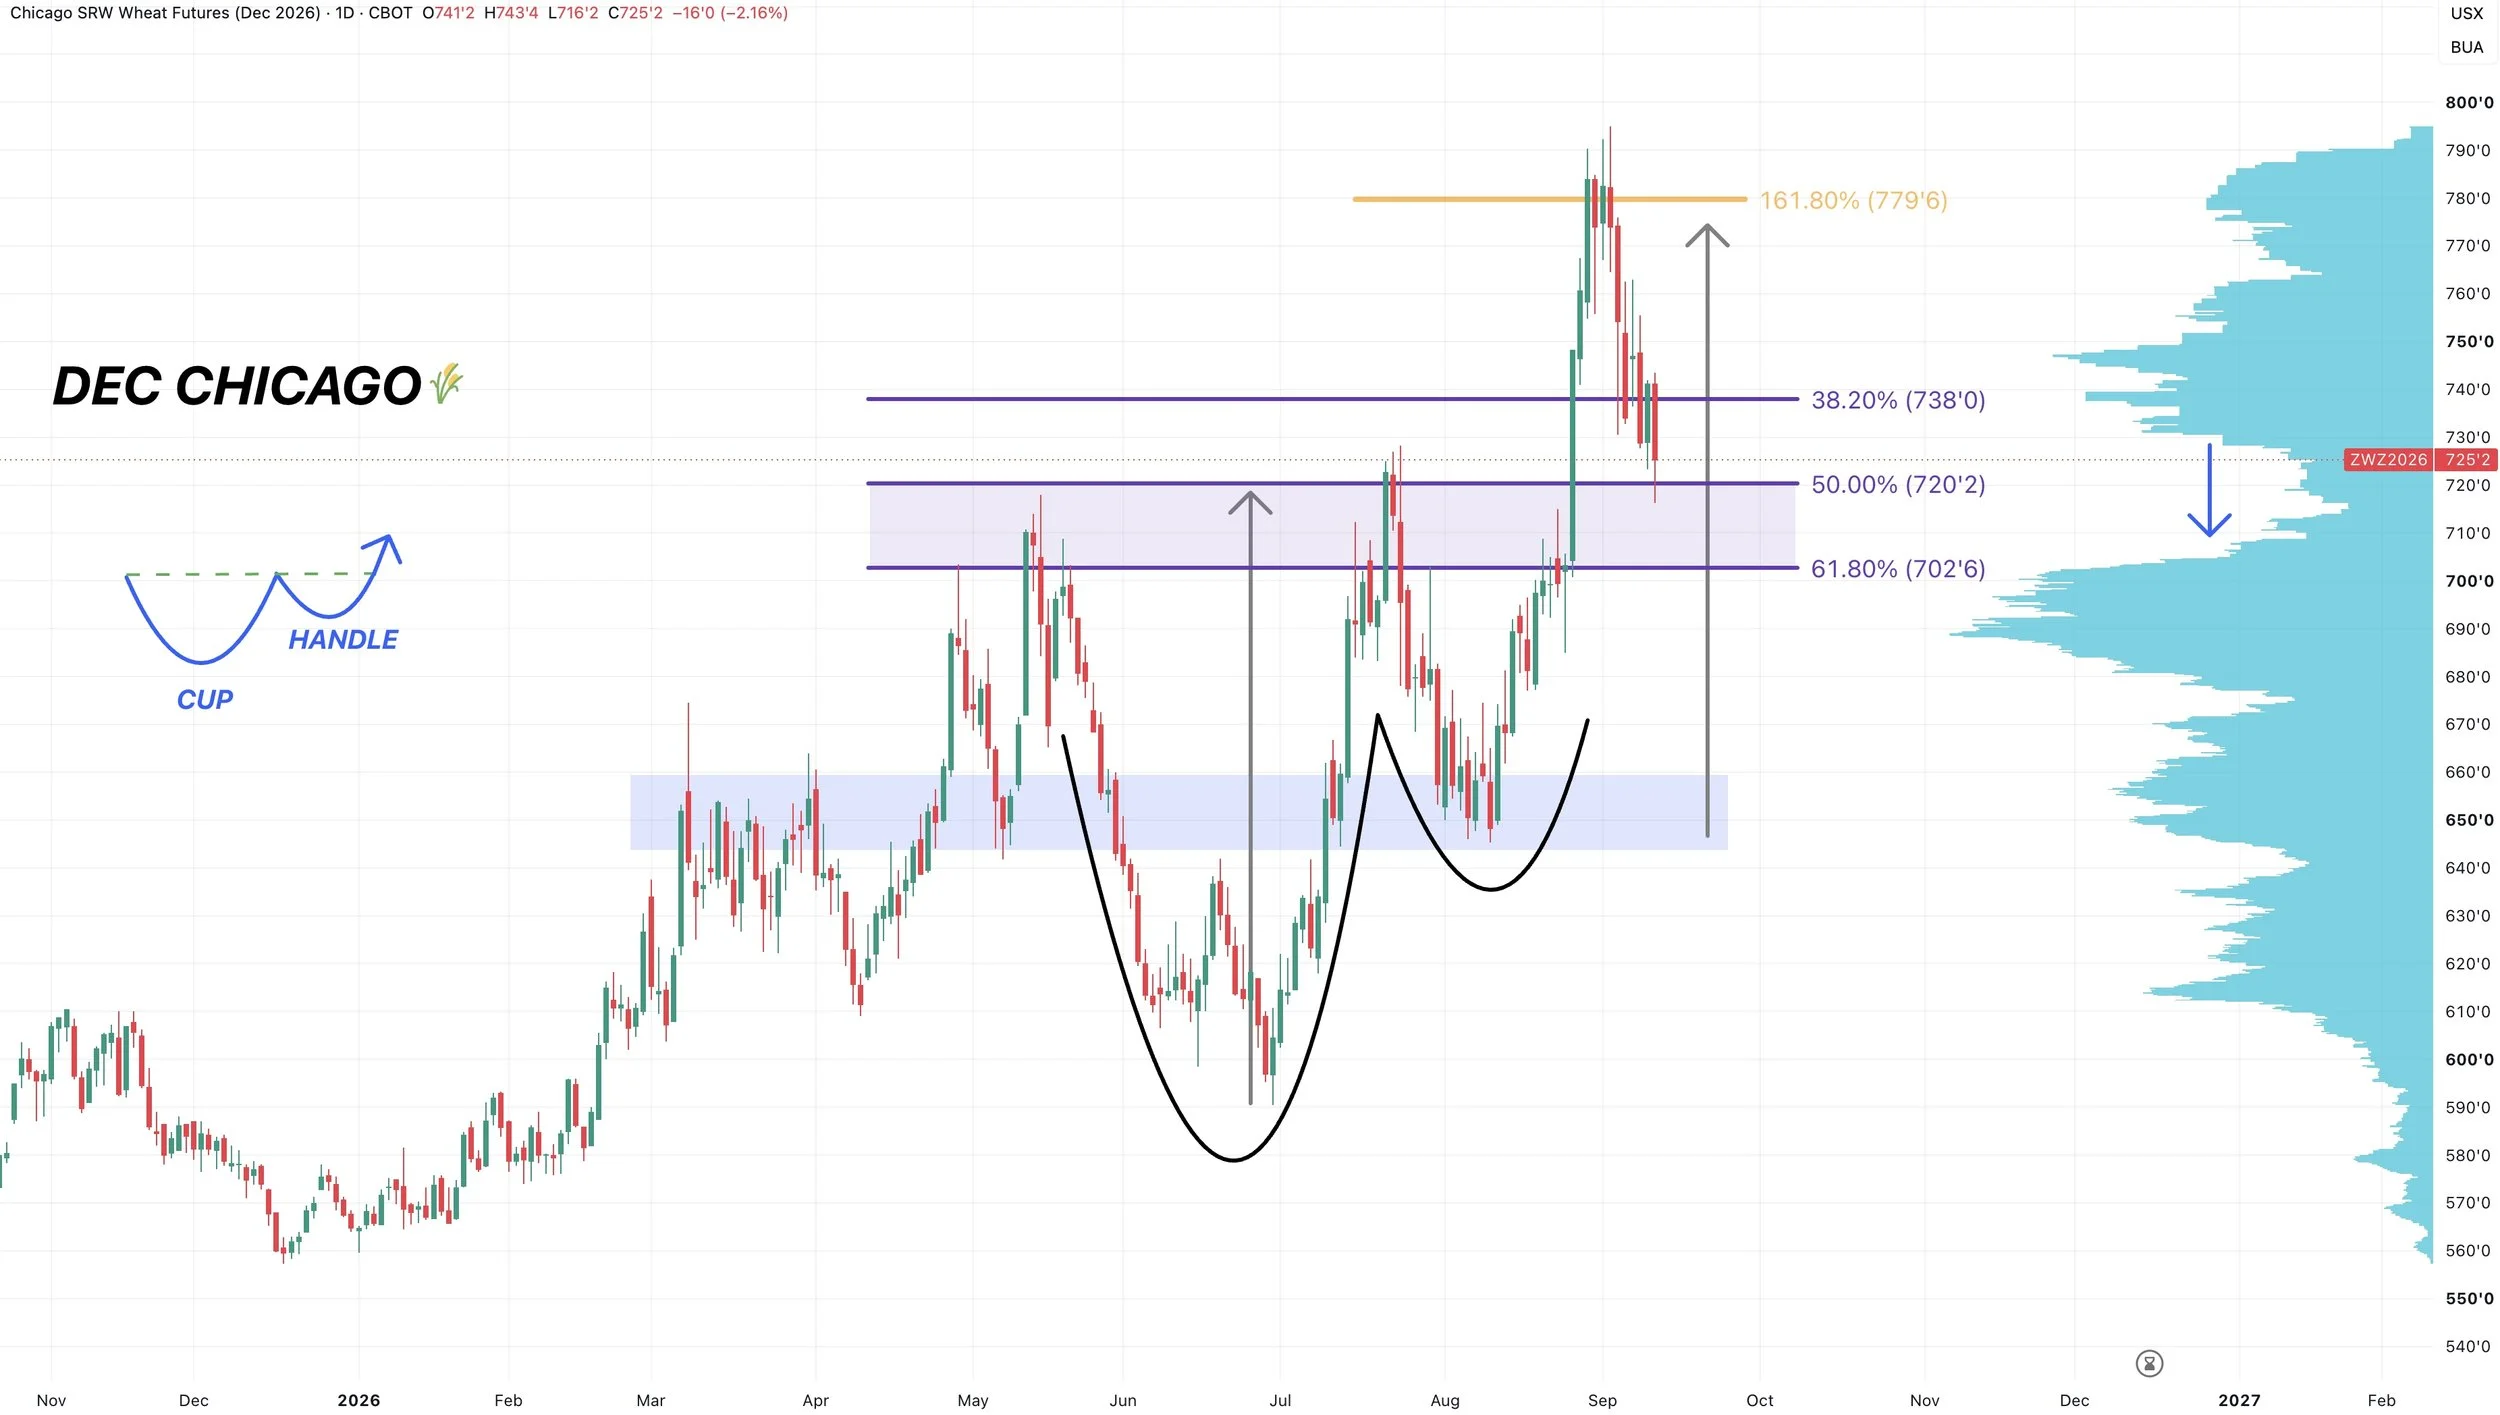
Dec Chicago Wheat:
Nothing to update here.
We rejected off the golden fib and cup and handle pattern target.
We are now entering the golden zone.
We want to hold that 61.8% retracement at just about $7.00
This zone is also a re-test of the old highs. We do also have a volume gap down to the 61.8% level to be aware of.
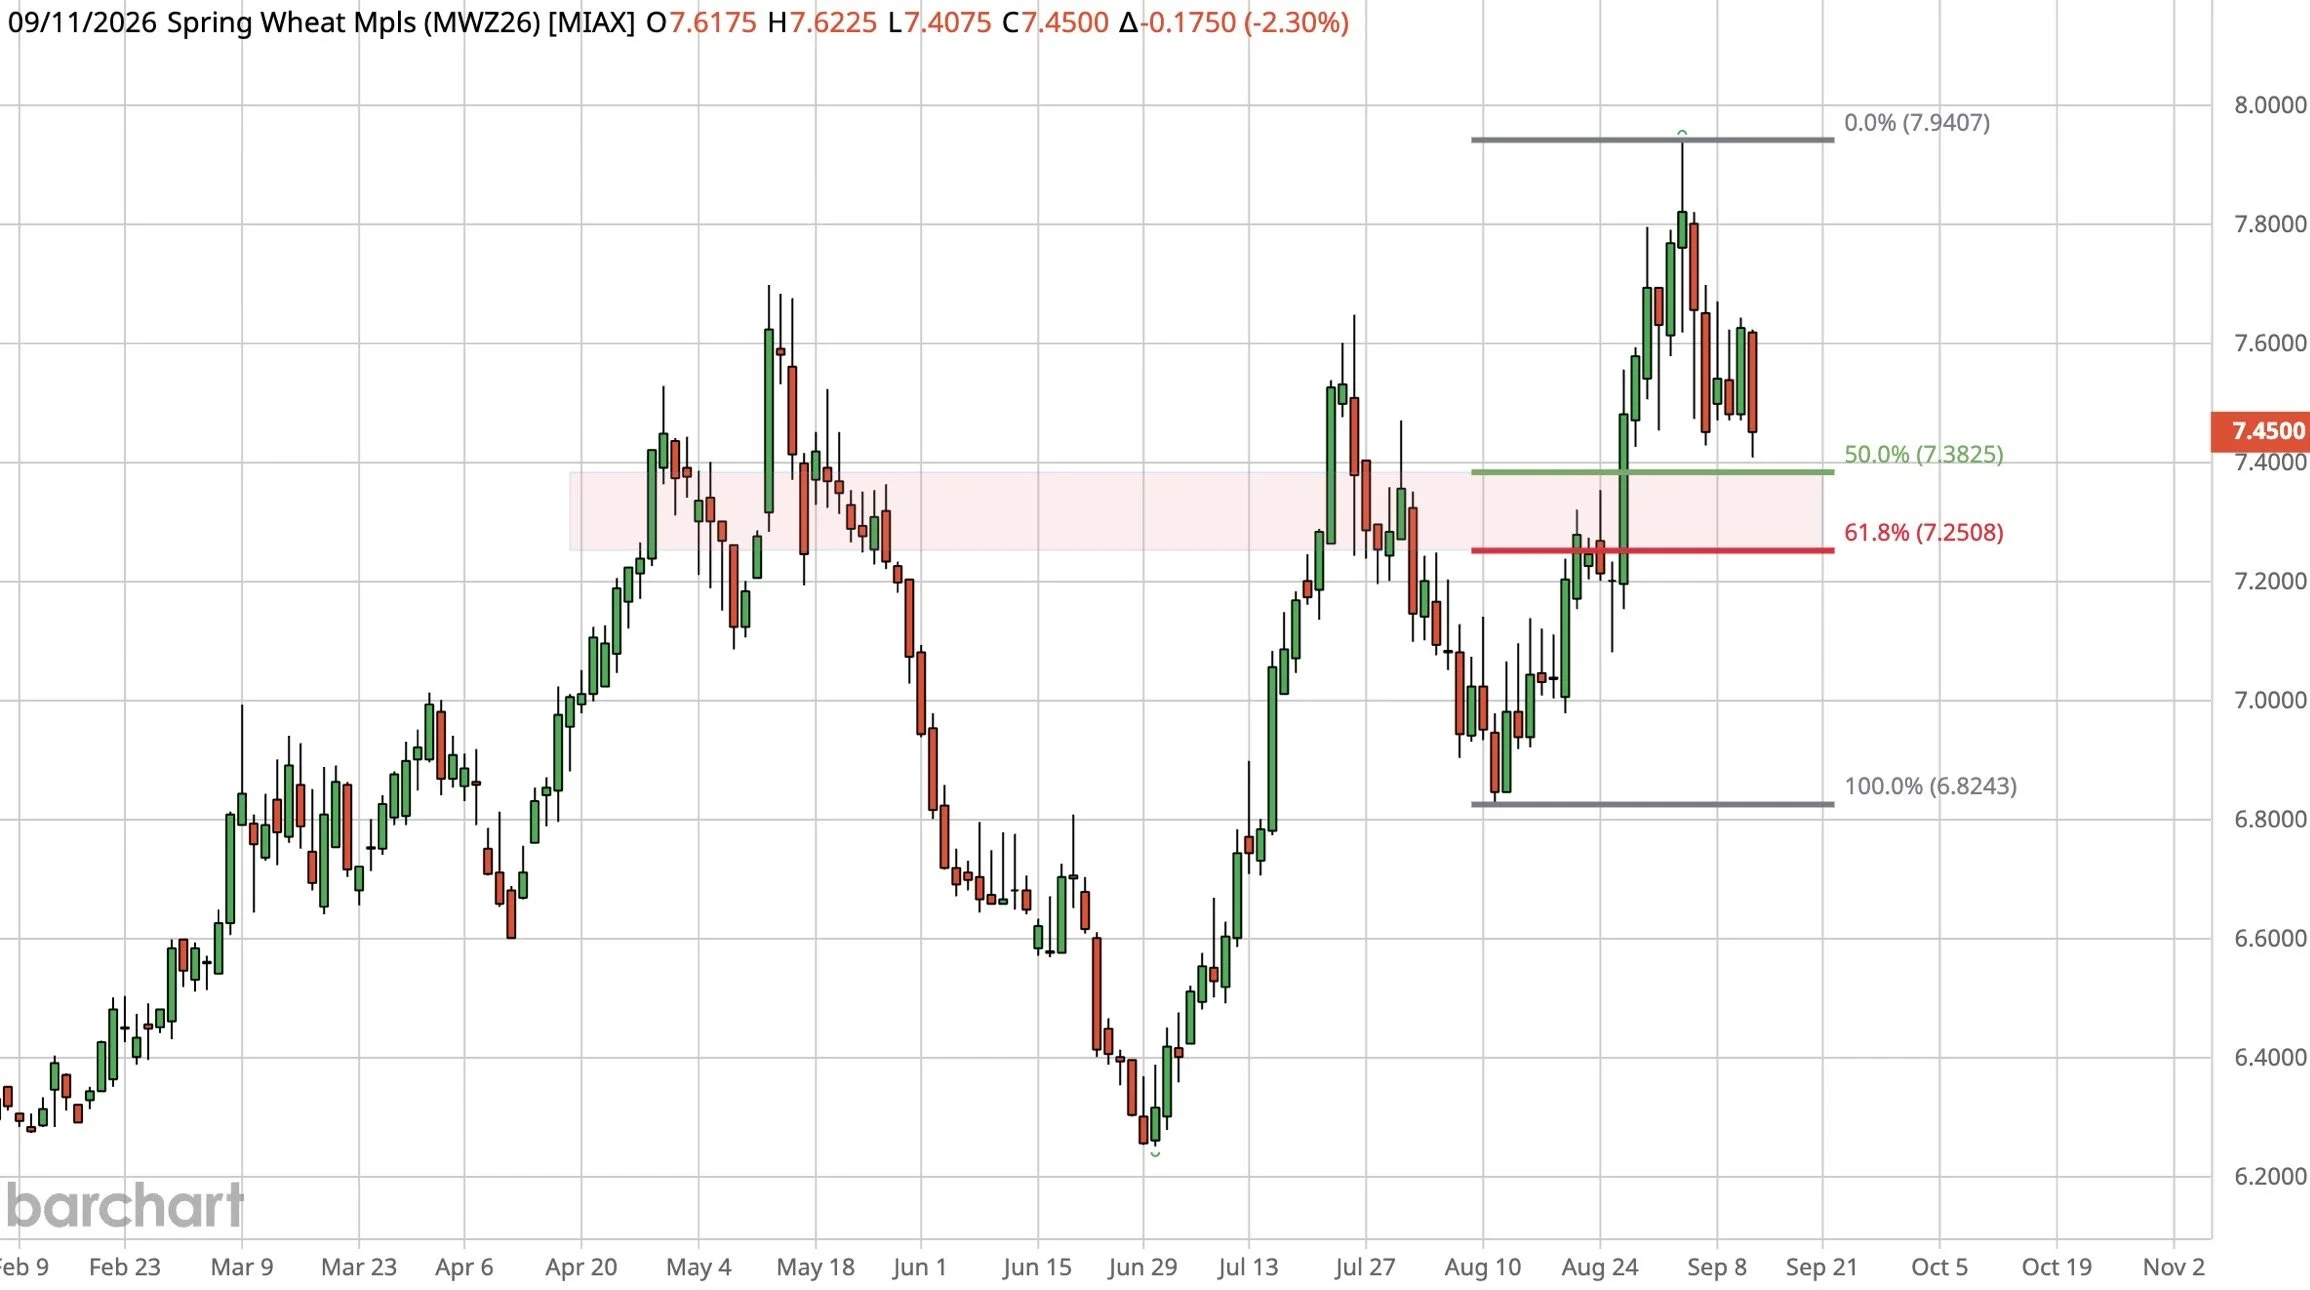
MPLS Wheat:
Nothing to update here either.
We want to see us hold that 61.8% retracement at $7.25
That would be a level where we'd look for a bounce.
Cattle
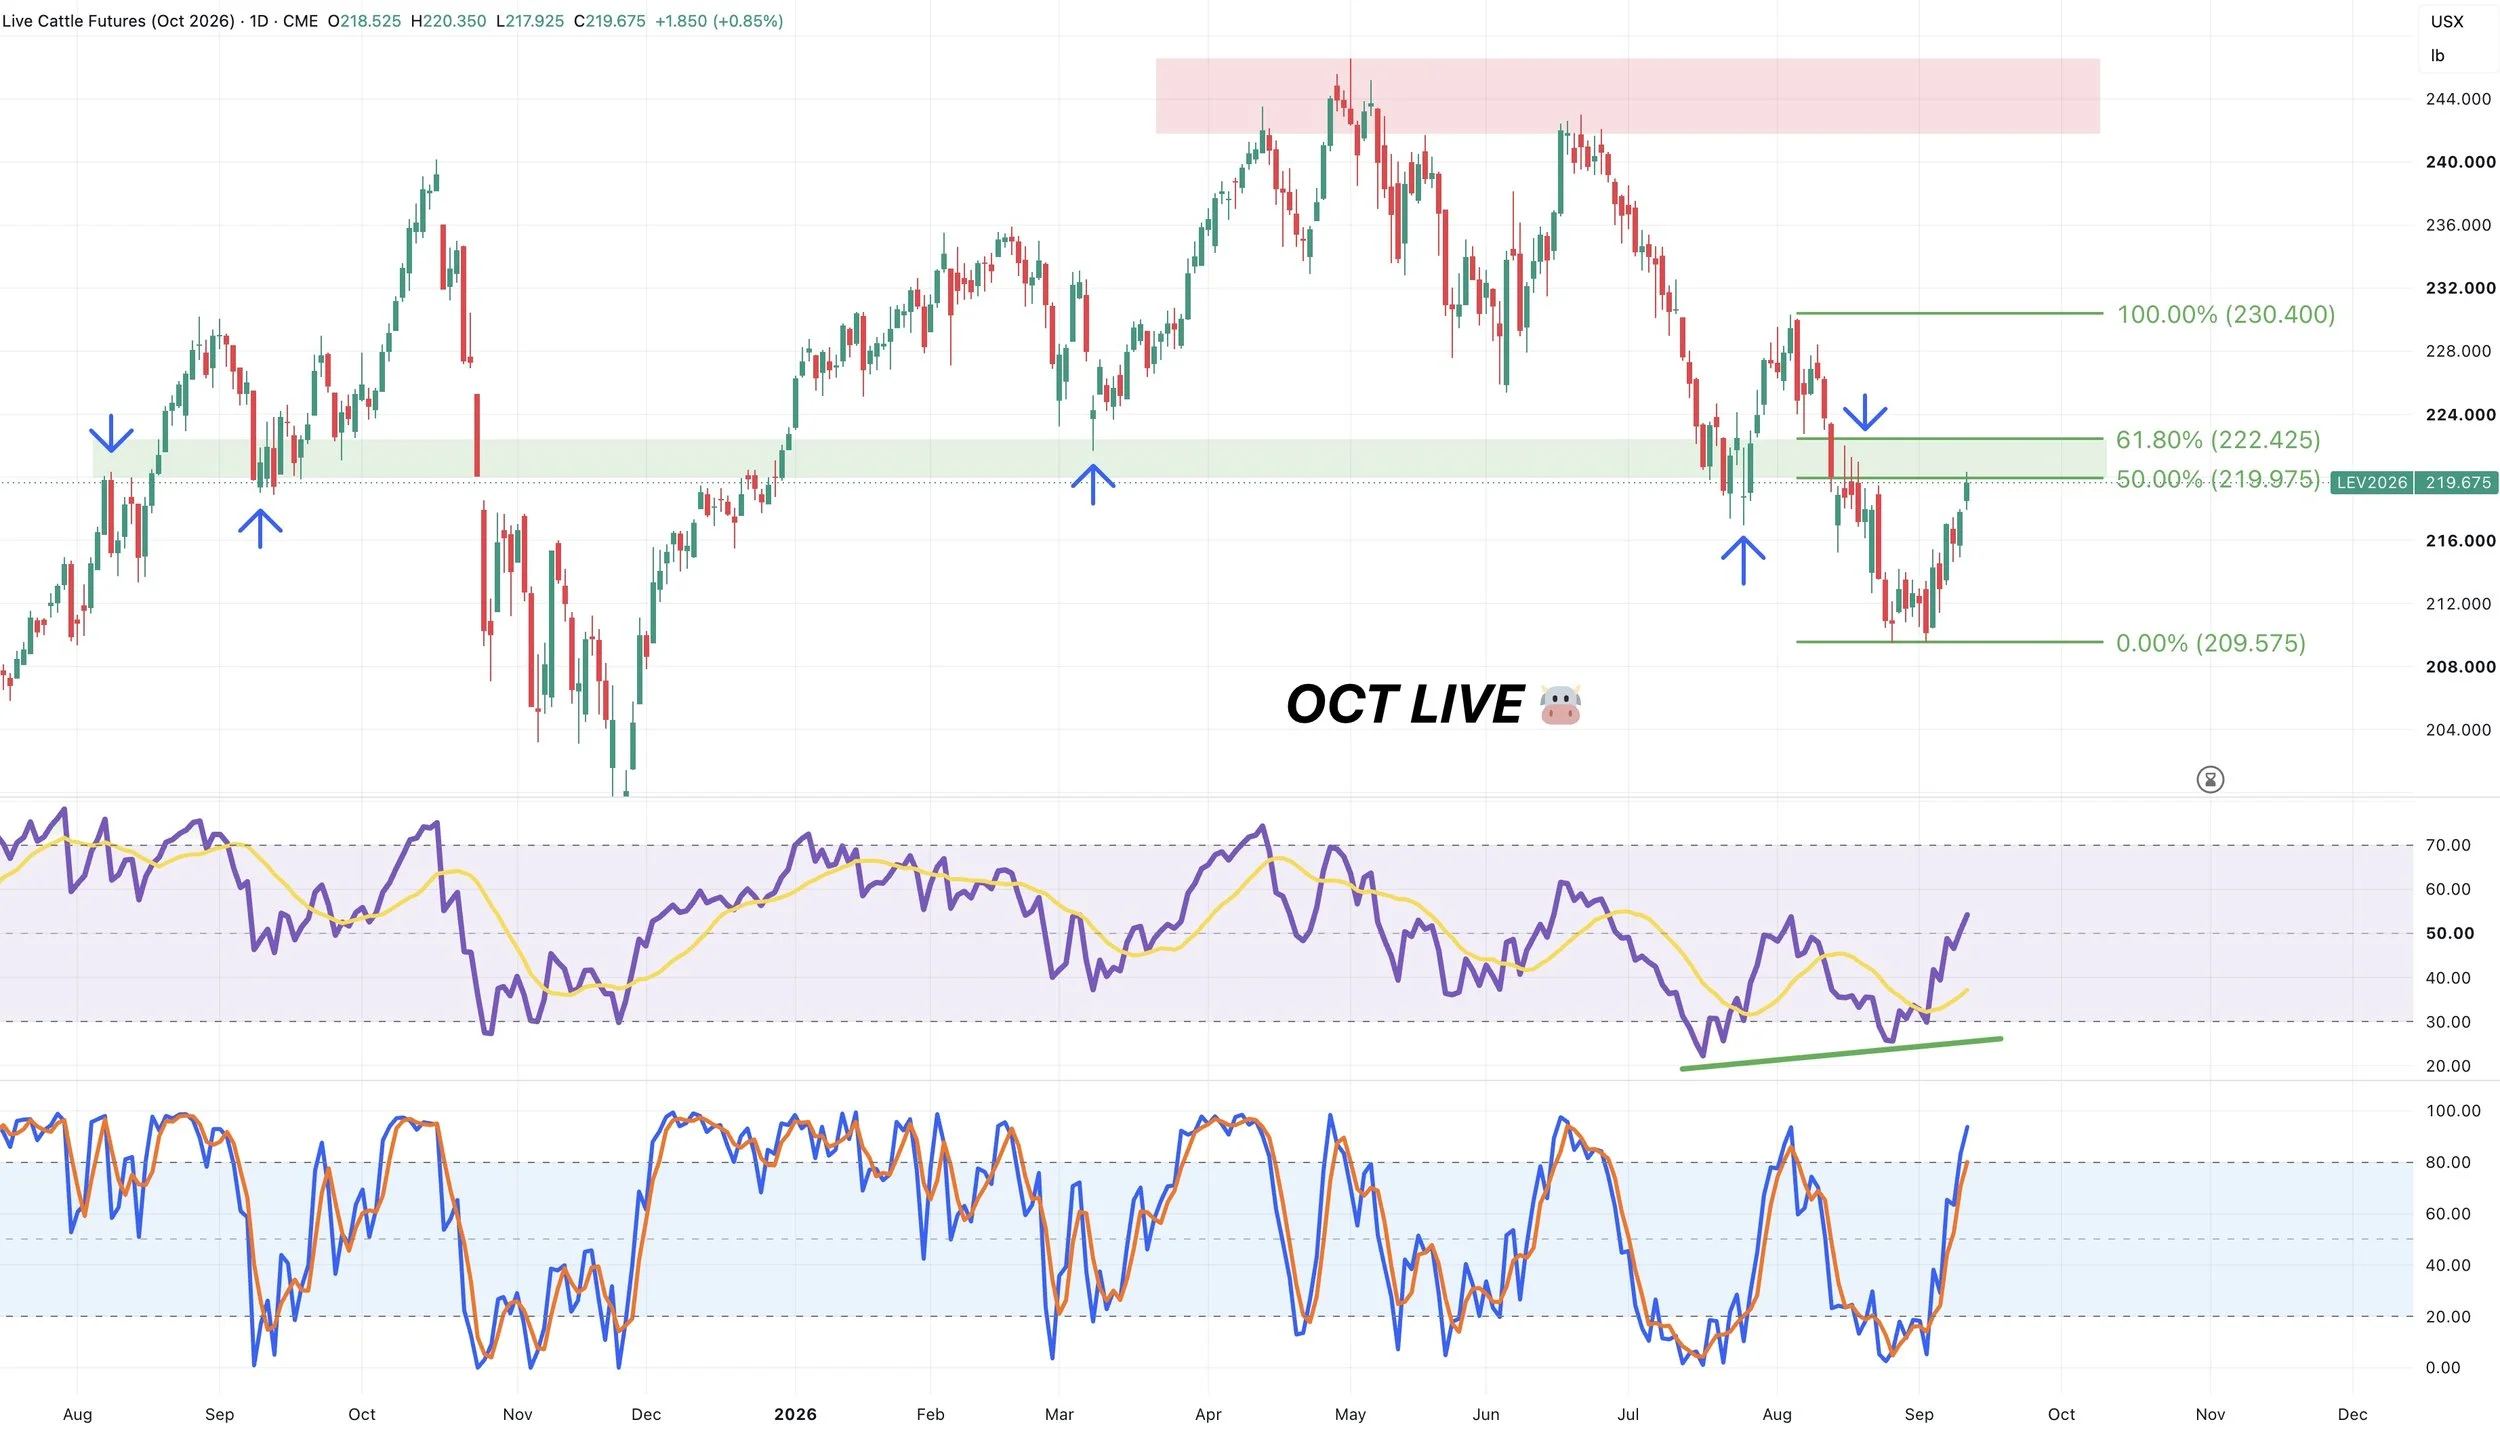
Oct Live Chart:
We had that bullish divergence we had been talking about.
Now putting together a nice bounce.
However, we are entering into an area where we could find resistance.
We've clawed back 50% of the August highs.
Between 220 and 222 would be a good area to get some hedges on in my opinion.
This golden zone is also prior support, so could act as resistance.
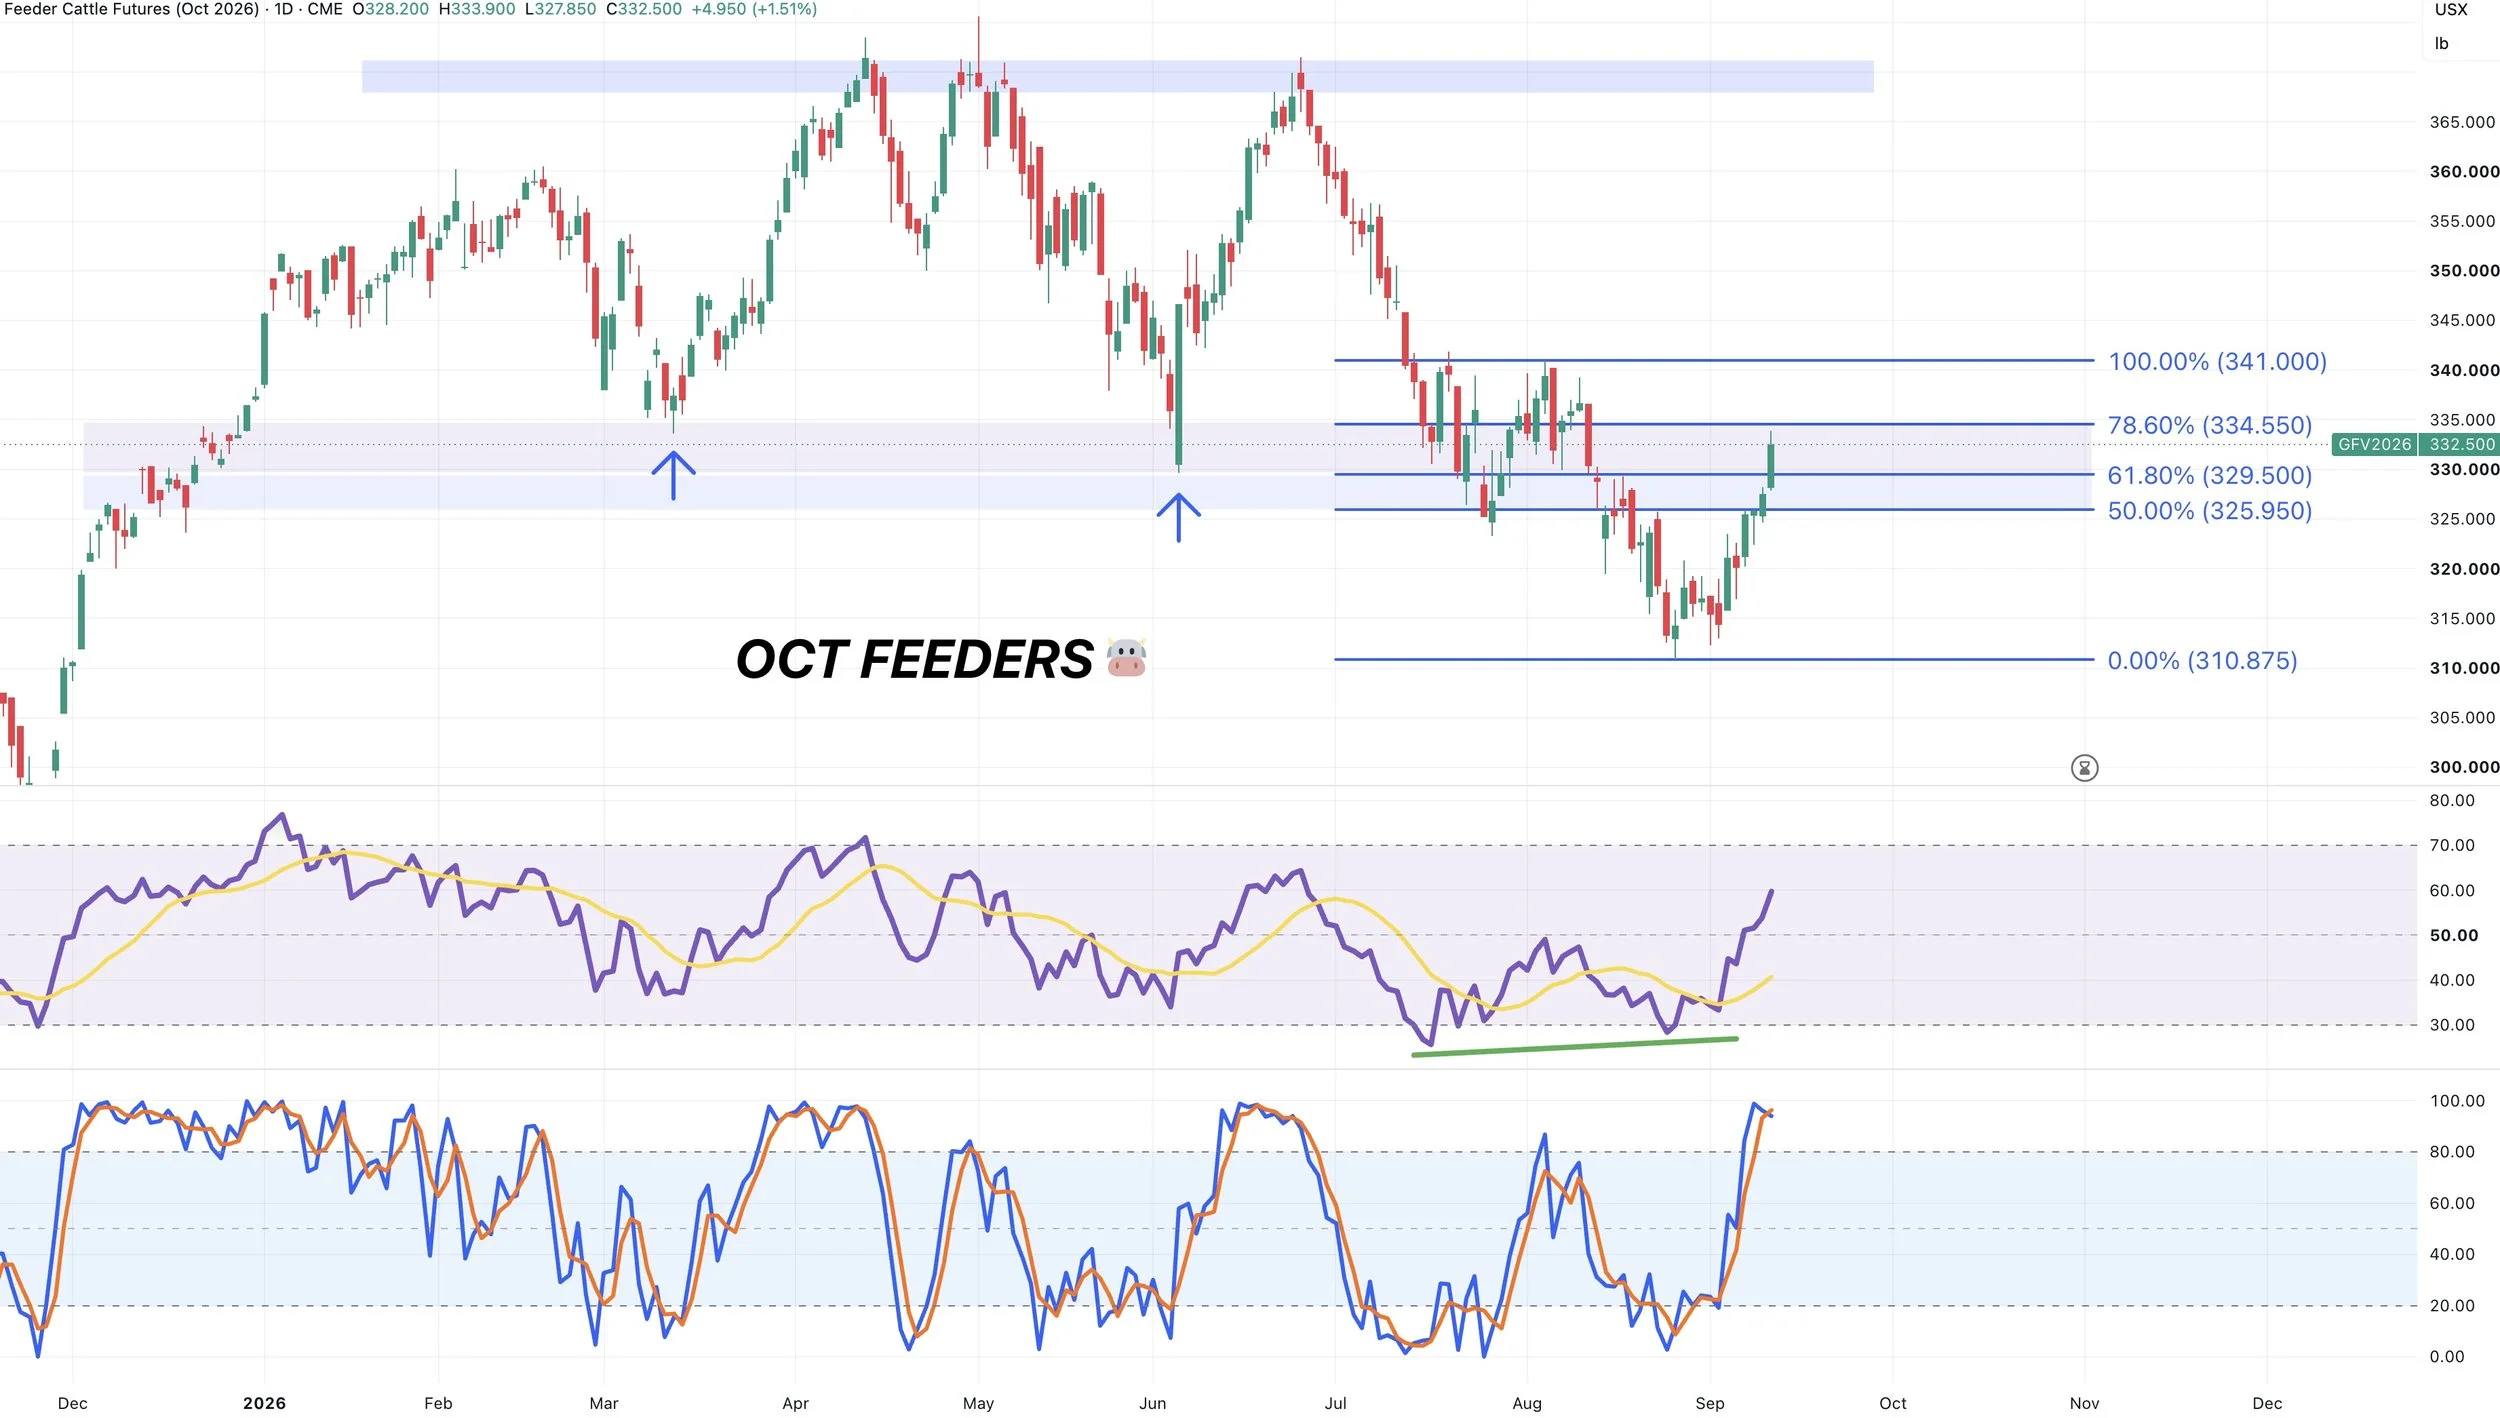
Oct Feeders Chart:
Feeders also seeing a nice run after that bullish divergence. As prices made new lows but the RSI did not.
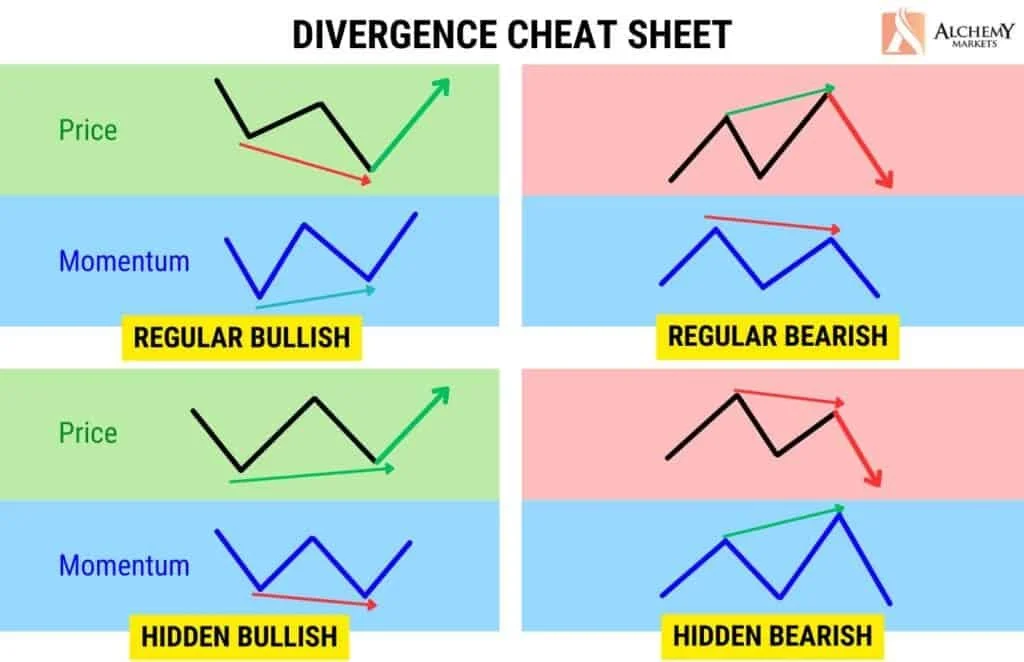
Now something to be aware of is that we are showing hidden bearish divergence.
This happens when the RSI makes new highs, but prices do not.
I attached an RSI divergence cheat sheet below this chart.
This would be an area where I would not be surprised to see some resistance.
We clawed back 78.6% of the August highs. Running right up into that old support which is now possible resistance.
So like in live cattle, I think this is a good area to be managing some risk.
If break above those August highs then this chart opens up further. But for now, we want to treat this as just a relief bounce.
Want to Talk?
Our phones are open 24/7 for you guys if you ever need anything or want to discuss your operation.
Jeremey & Office: (806)484-1214
Sebastian: (605)280-1186
Email: sfrost@dailymarketminute.com
Hedge Account
Interested in a hedge account? Use the link below to set up an account or give us a call.