
MARKET UPDATE
You can scroll to read the usual update as well. As the written version is the exact same as the video.
Timestamps for video:
Overview: 0:00min
Corn: 2:20min
Beans: 5:00min
Wheat: 12:00min
Cattle: 15:35min
Want to talk?
Office: (806)484-1214
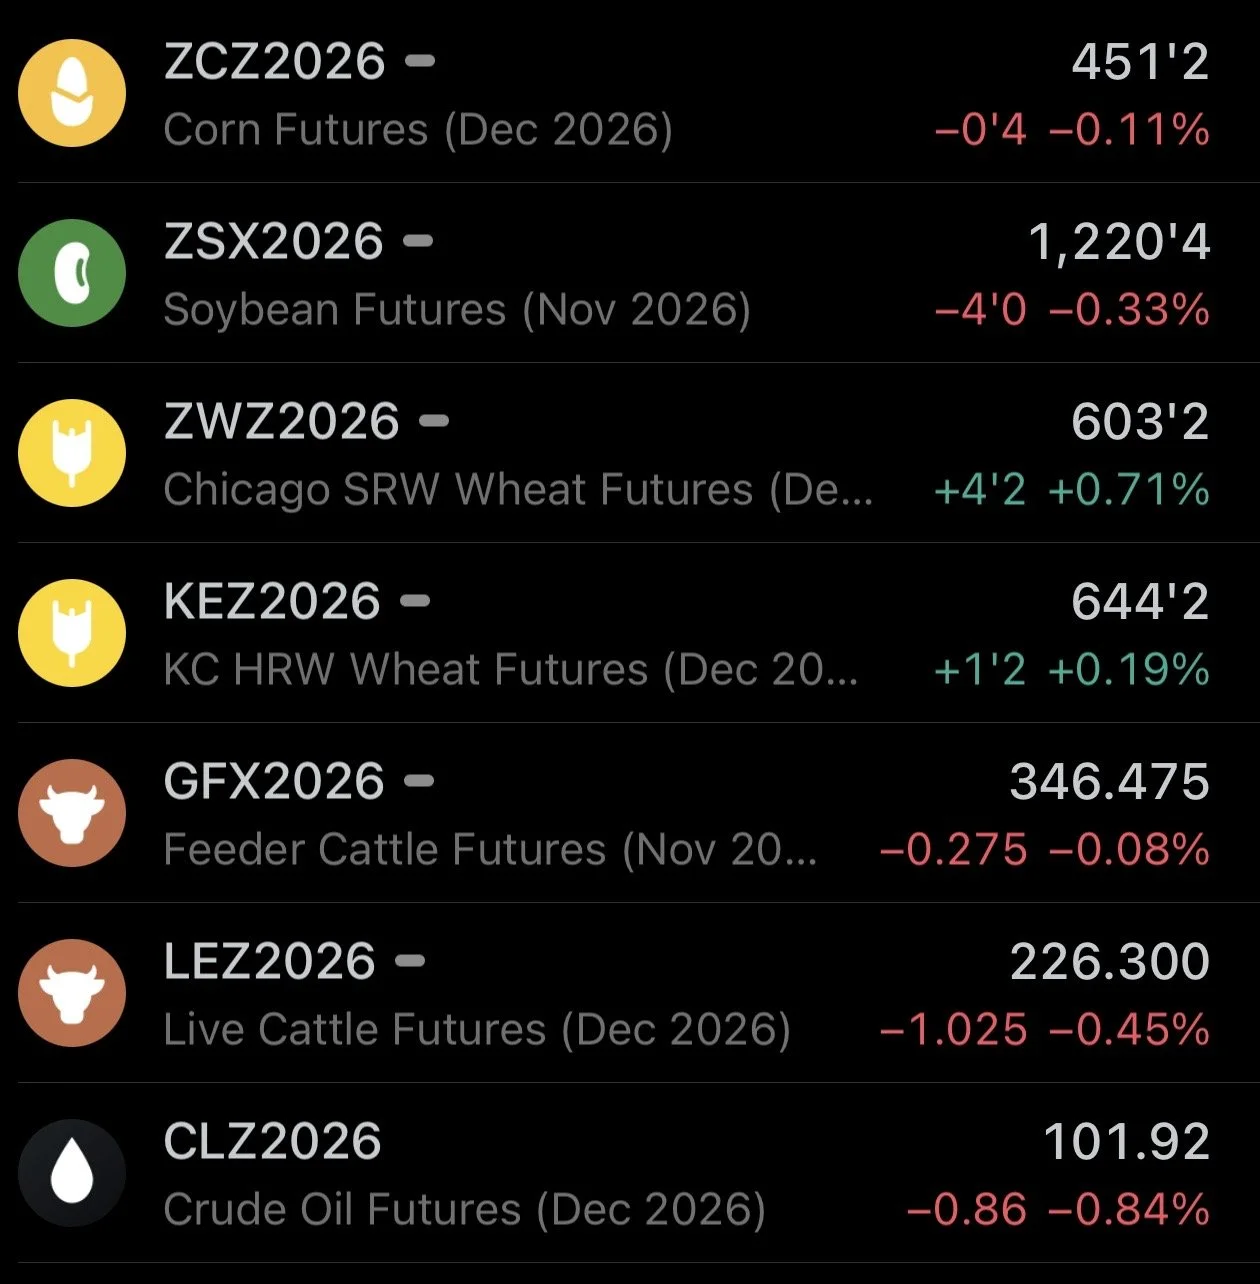
Futures Prices Close (1:30pm CT)
Overview
Grains mixed with wheat higher and soybeans lower.
Cattle specifically live cattle continues to take a hit, as it's down pretty big the last few days. Meanwhile feeders continue to hold up better.
There was some news about a screwworm case in Arizona.
We saw more peace news over in the Black Sea. As Russia announced they would be opening up a passage way, although it's only suppose to be open for two weeks.
Despite the news, wheat got it first day higher after dropping for 10 straight days. Led by some China news and nice exports which I'll touch on soon.
Wheat has been lower for 9 weeks straight. I believe that is the longest weekly losing streak ever.

China Sniffing Around for US Wheat?
It was reported today that China did indeed inquire about buying US wheat.
If this happens, it would be very bullish for the wheat market. This is something we've talked about as being a possibility for a while. That wheat was a dark horse for some China business.
I guess we'll see what happens.

There is a lot of concerns that China is not going to live up to their goal for the non-soybean ag purchases. As they have lacked behind by a lot.
Everyone was also concerned that China wouldn’t meet their soybean goal. But they have completely lived up to the goal. As they've done exactly what they said they would.
Why wouldn’t they live up to the non-soybeans?
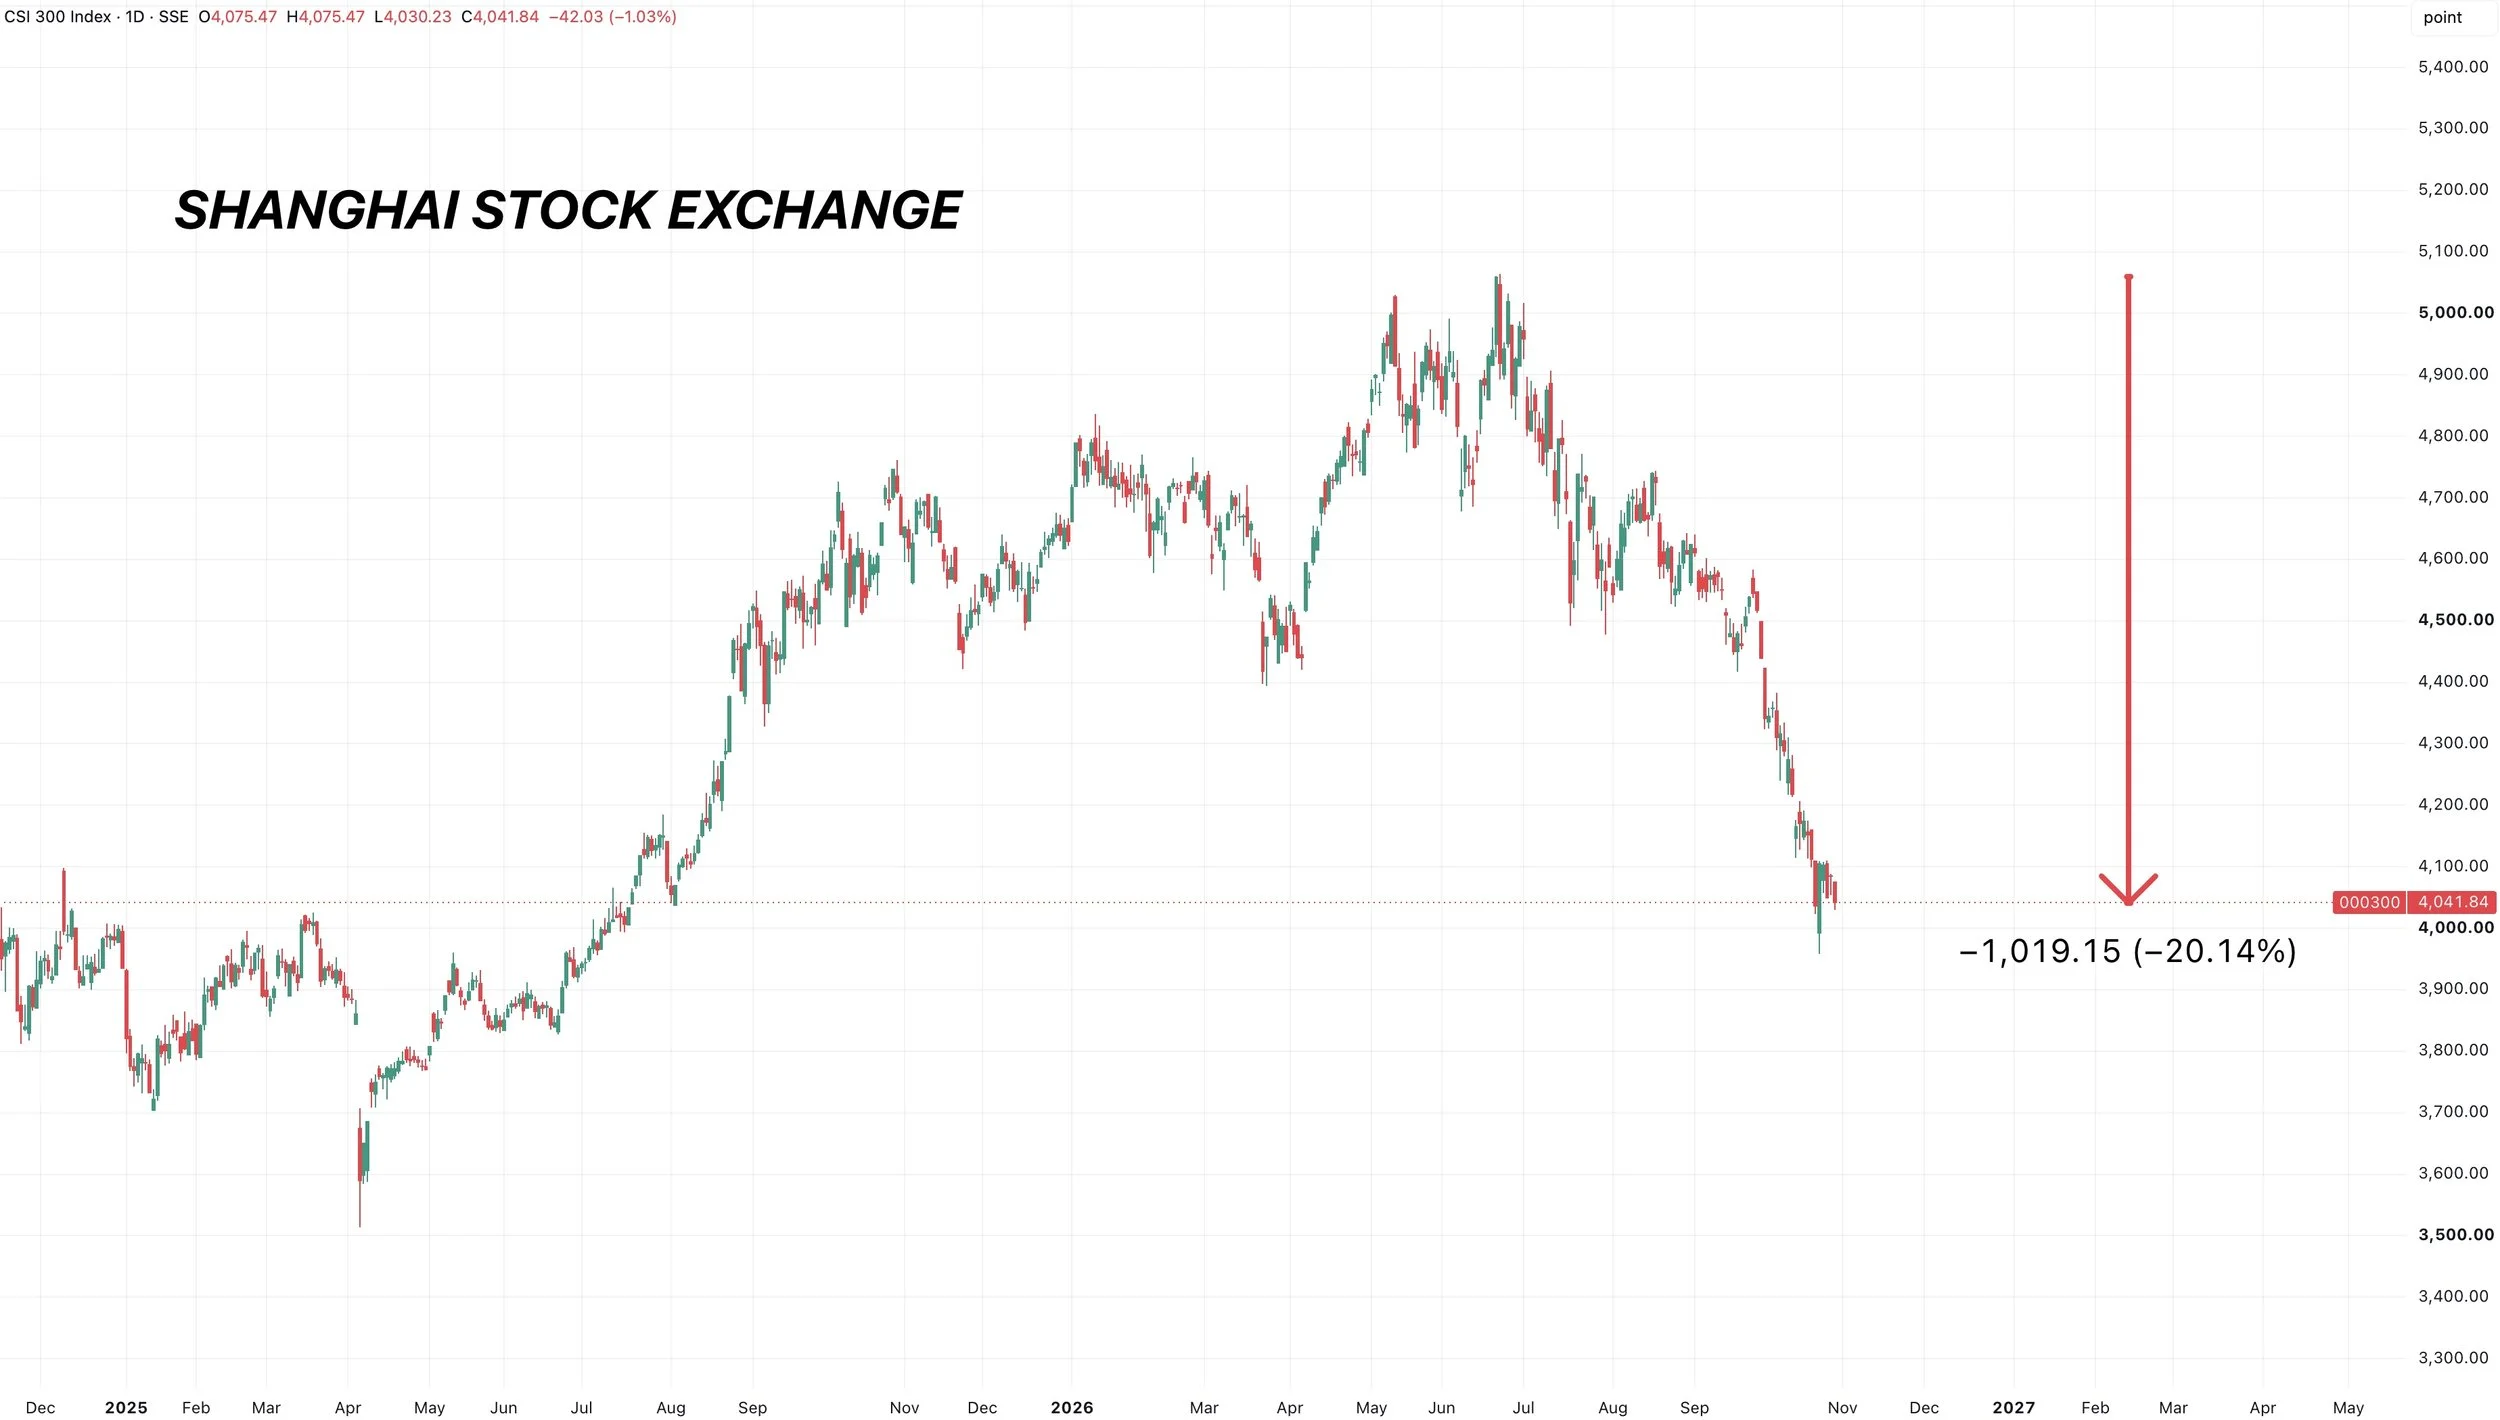
One other possible factor is China's stock market. It has been struggling heavily.
China's stock index is 20% off it's highs from June. You would have to assume they would like to keep the US happy and follow through on their agreements.
Some US grain is a small drop in the bucket when it comes to the larger parts of protecting their economy.
One of the biggest things that has been weighing down the wheat market is the lack of demand. It's be awful.
The Black Sea exports are cut off, but it has resulted in zero extra demand for the US.
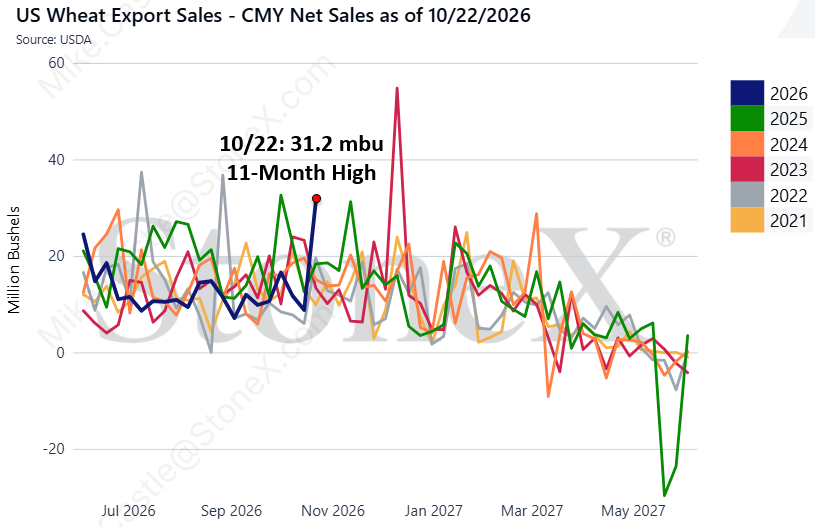
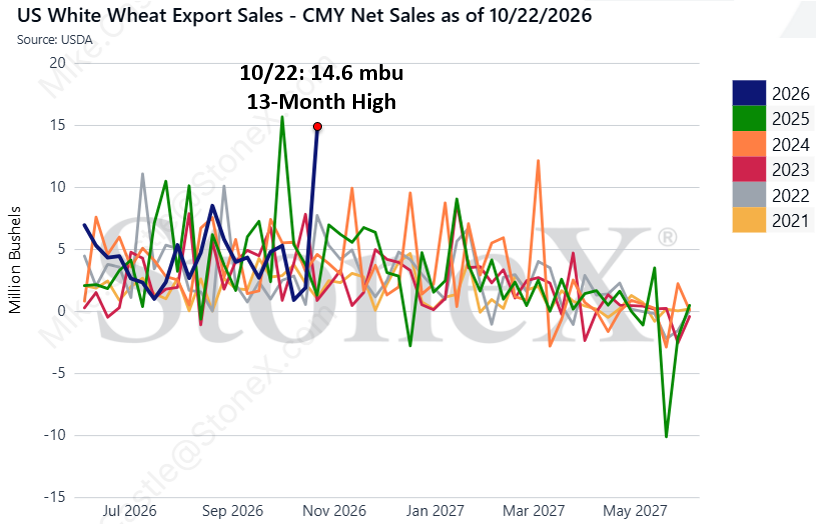
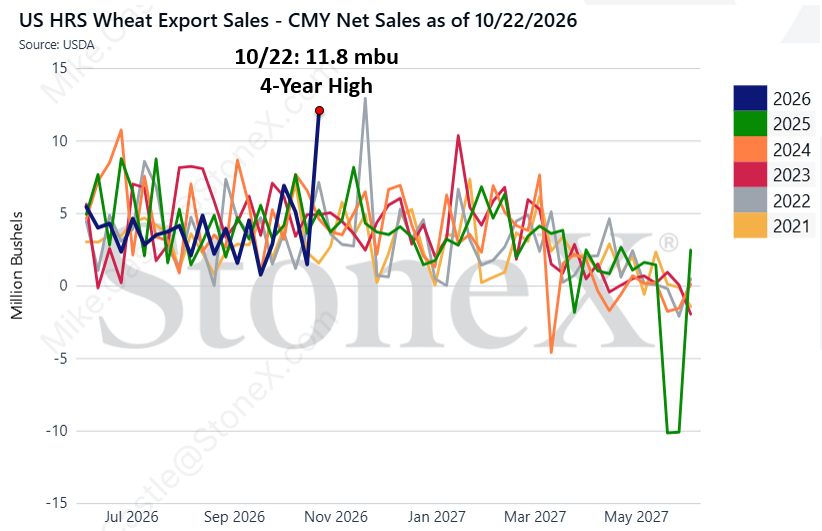
However, today export sales came in rather impressive for wheat.
As they came in at marketing year highs.
All wheat was an 11-month high.
White wheat was a 13-month high.
HRS wheat was a 4-year high.
So it seems like the market is finally finding some value for business down here after the nasty sell off we've seen.
*Credit to Mike Castle of StoneX for the charts.
Todays Main Takeaways
Corn
Fundamentals:
There is not much fundamentally to update in corn.
Fundamentally I do think corn is getting undervalued down here. And I think that most of the carage is over, so I would expect us to at least stabilize soon whether the bottom is in yet or not.
We've gone over why we think yield is overstated, but the market isn’t trading that today.
We've took all the premium out of this market, and clearly priced in plenty of bearishness. So if yield does end up coming down in November or January, the market will have to price it in.
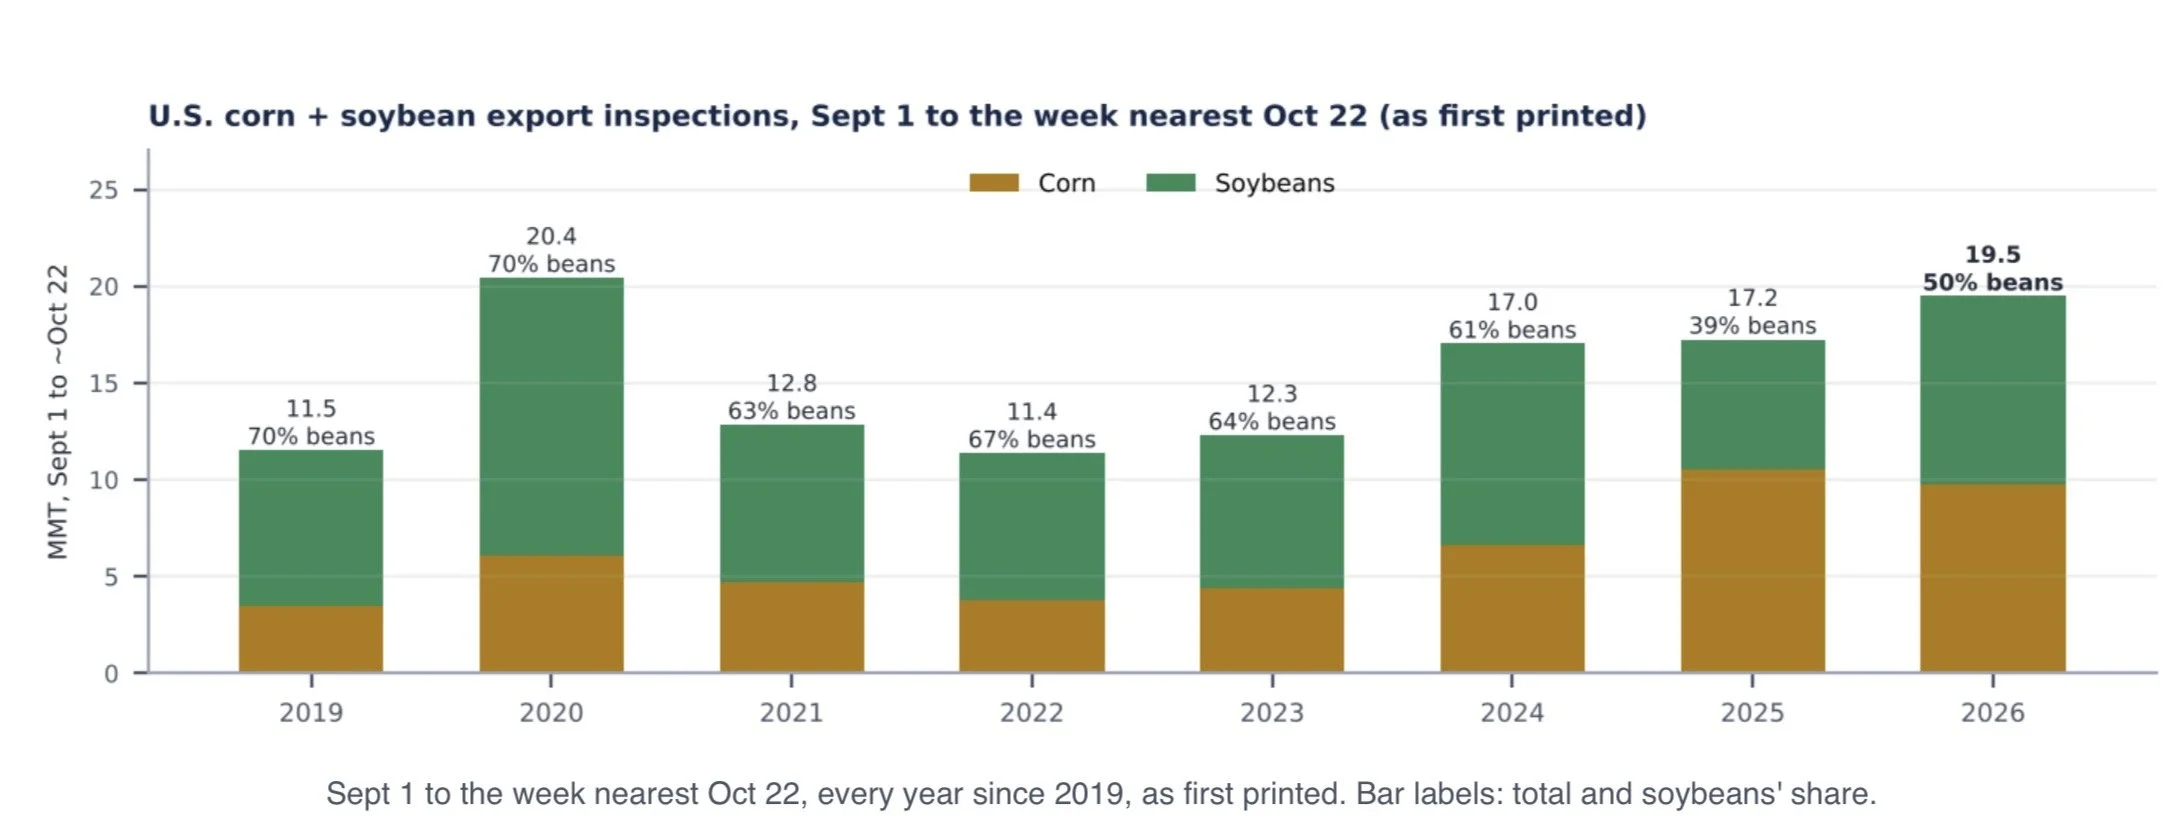
People are concerned about the export pace. For starters, I still think it's more of a timing thing vs the fast start last year. Given soybeans were dismal at the start last year.
Below is a chart that shows corn and soybean export inspections. Corn exports have partly been slow because we are shipping so many beans. Corn inspections are still the 2nd best they've been.
We're also now at prices that certainly aren’t going to be leading to us losing demand down here.
Long term I think we have plenty of potential. Short term, just waiting to see if this market can finally stabilize. Which I'd like to see happen soon.
Charts
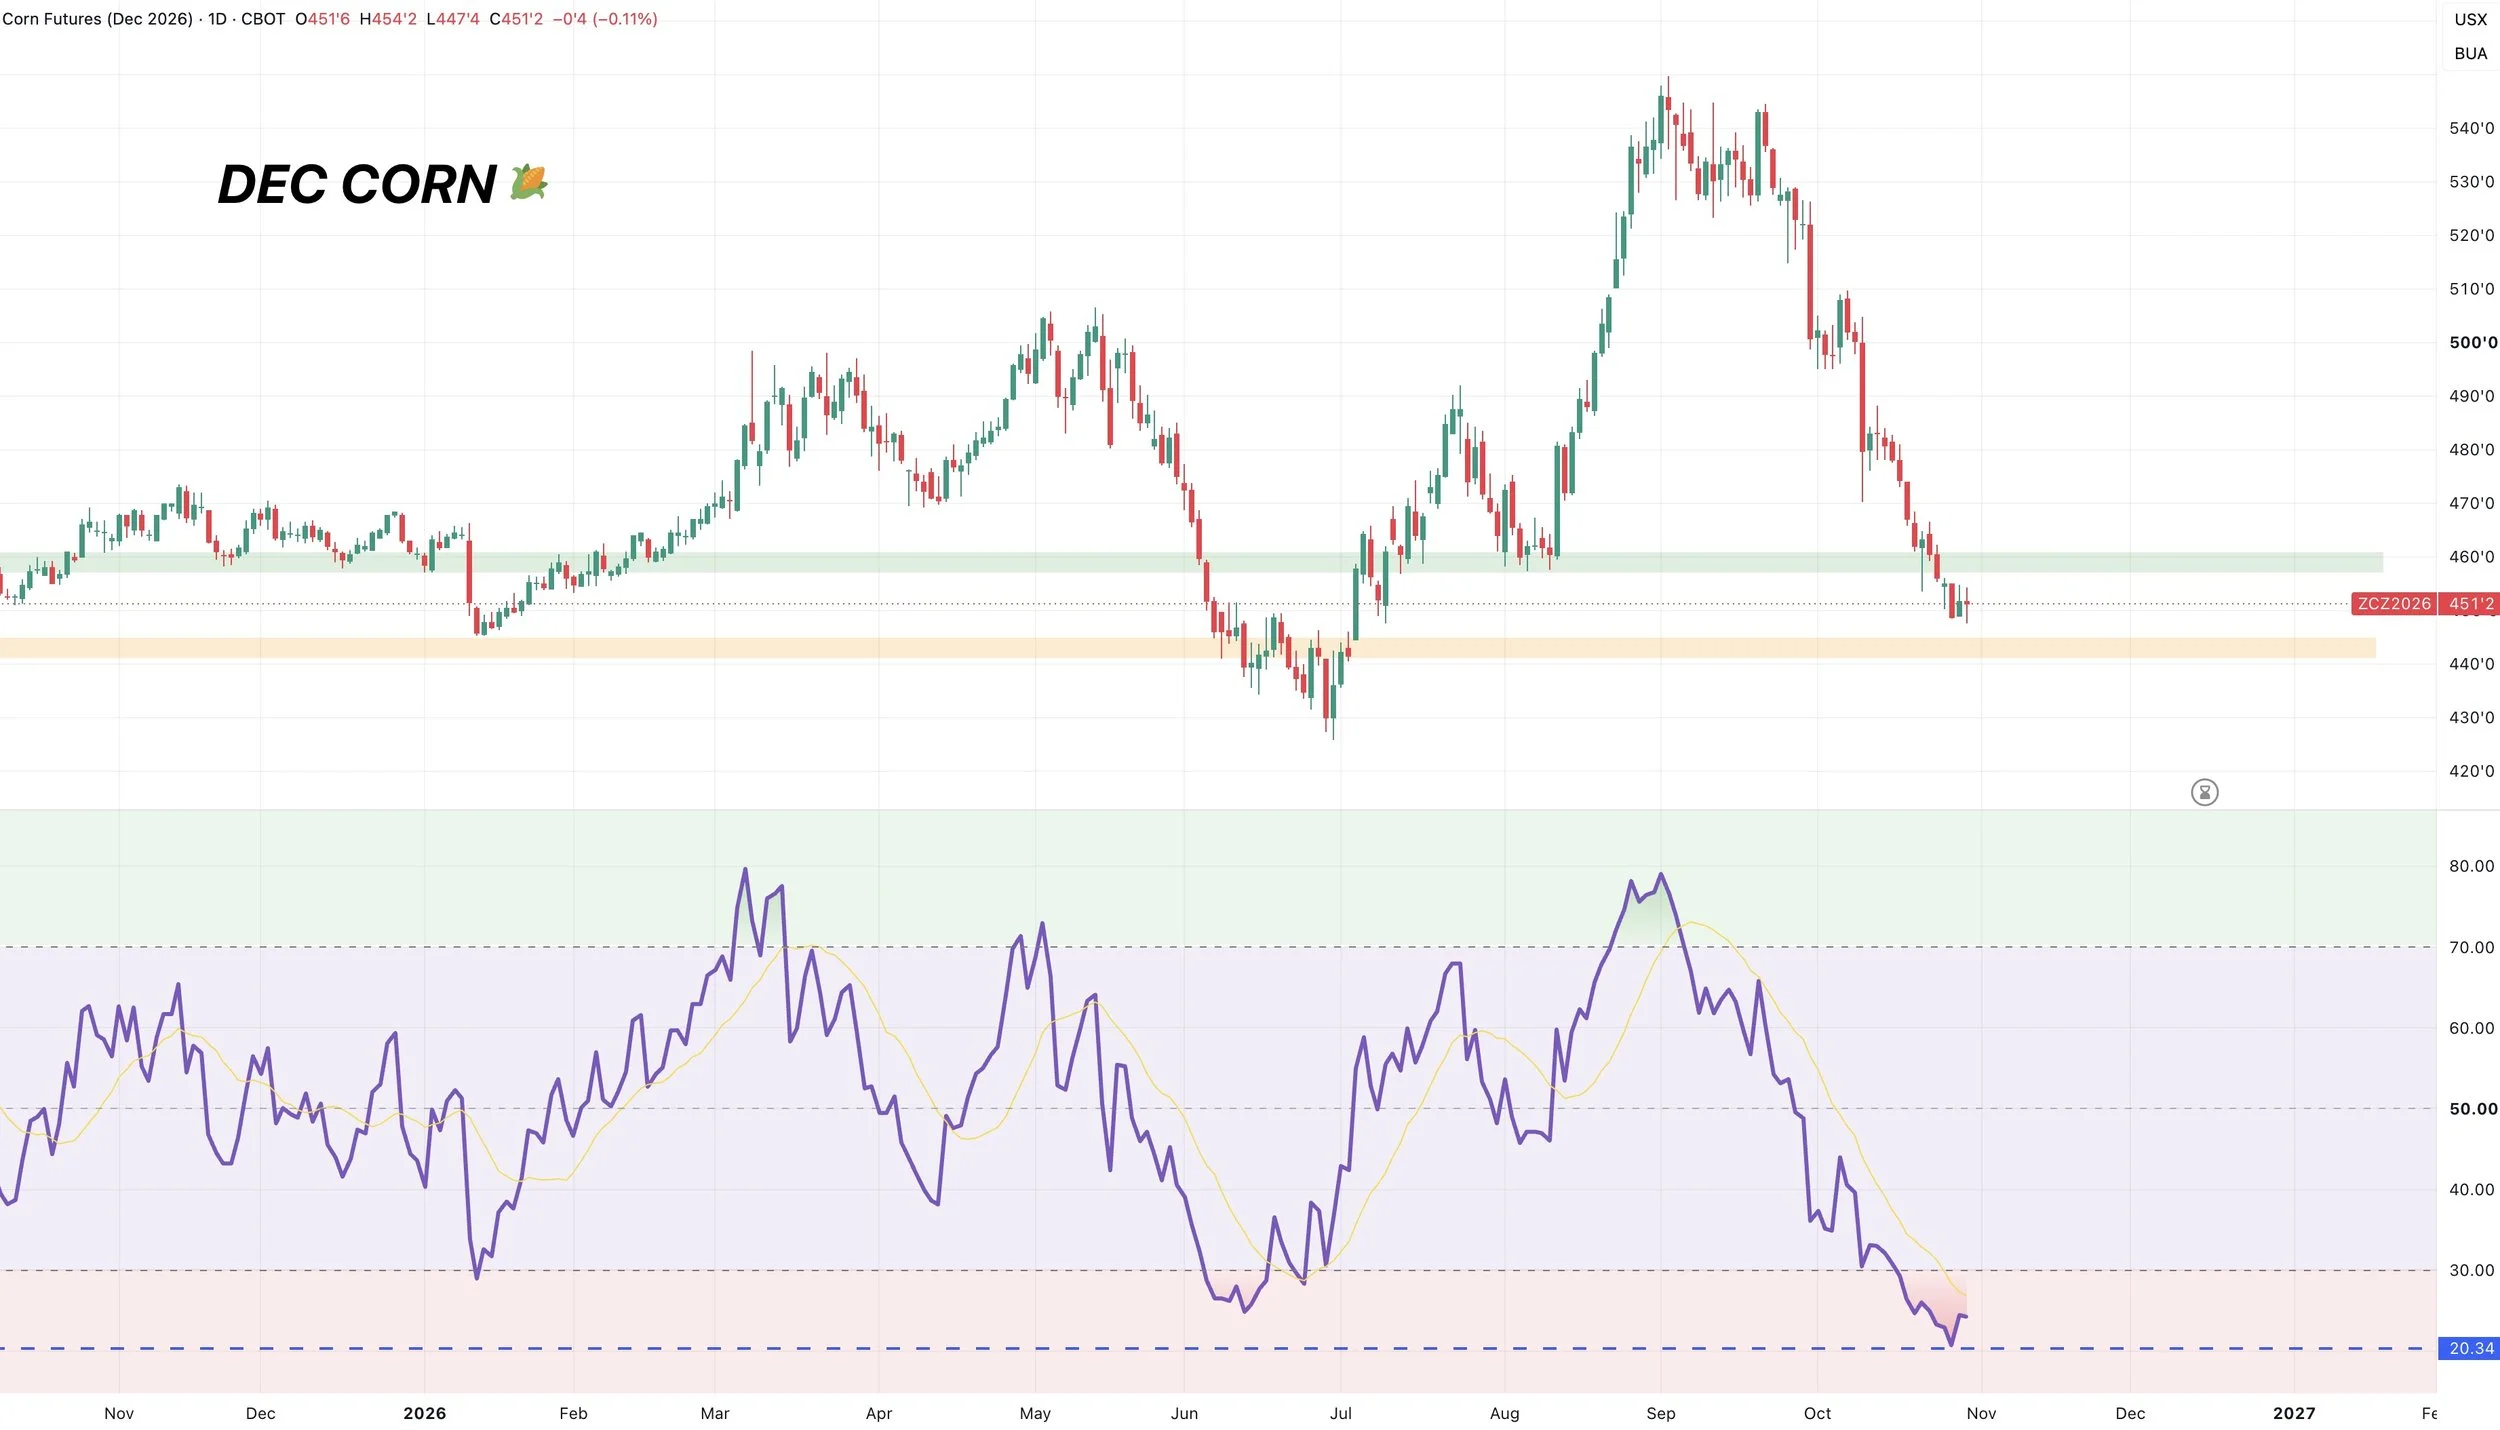
Dec Corn Chart:
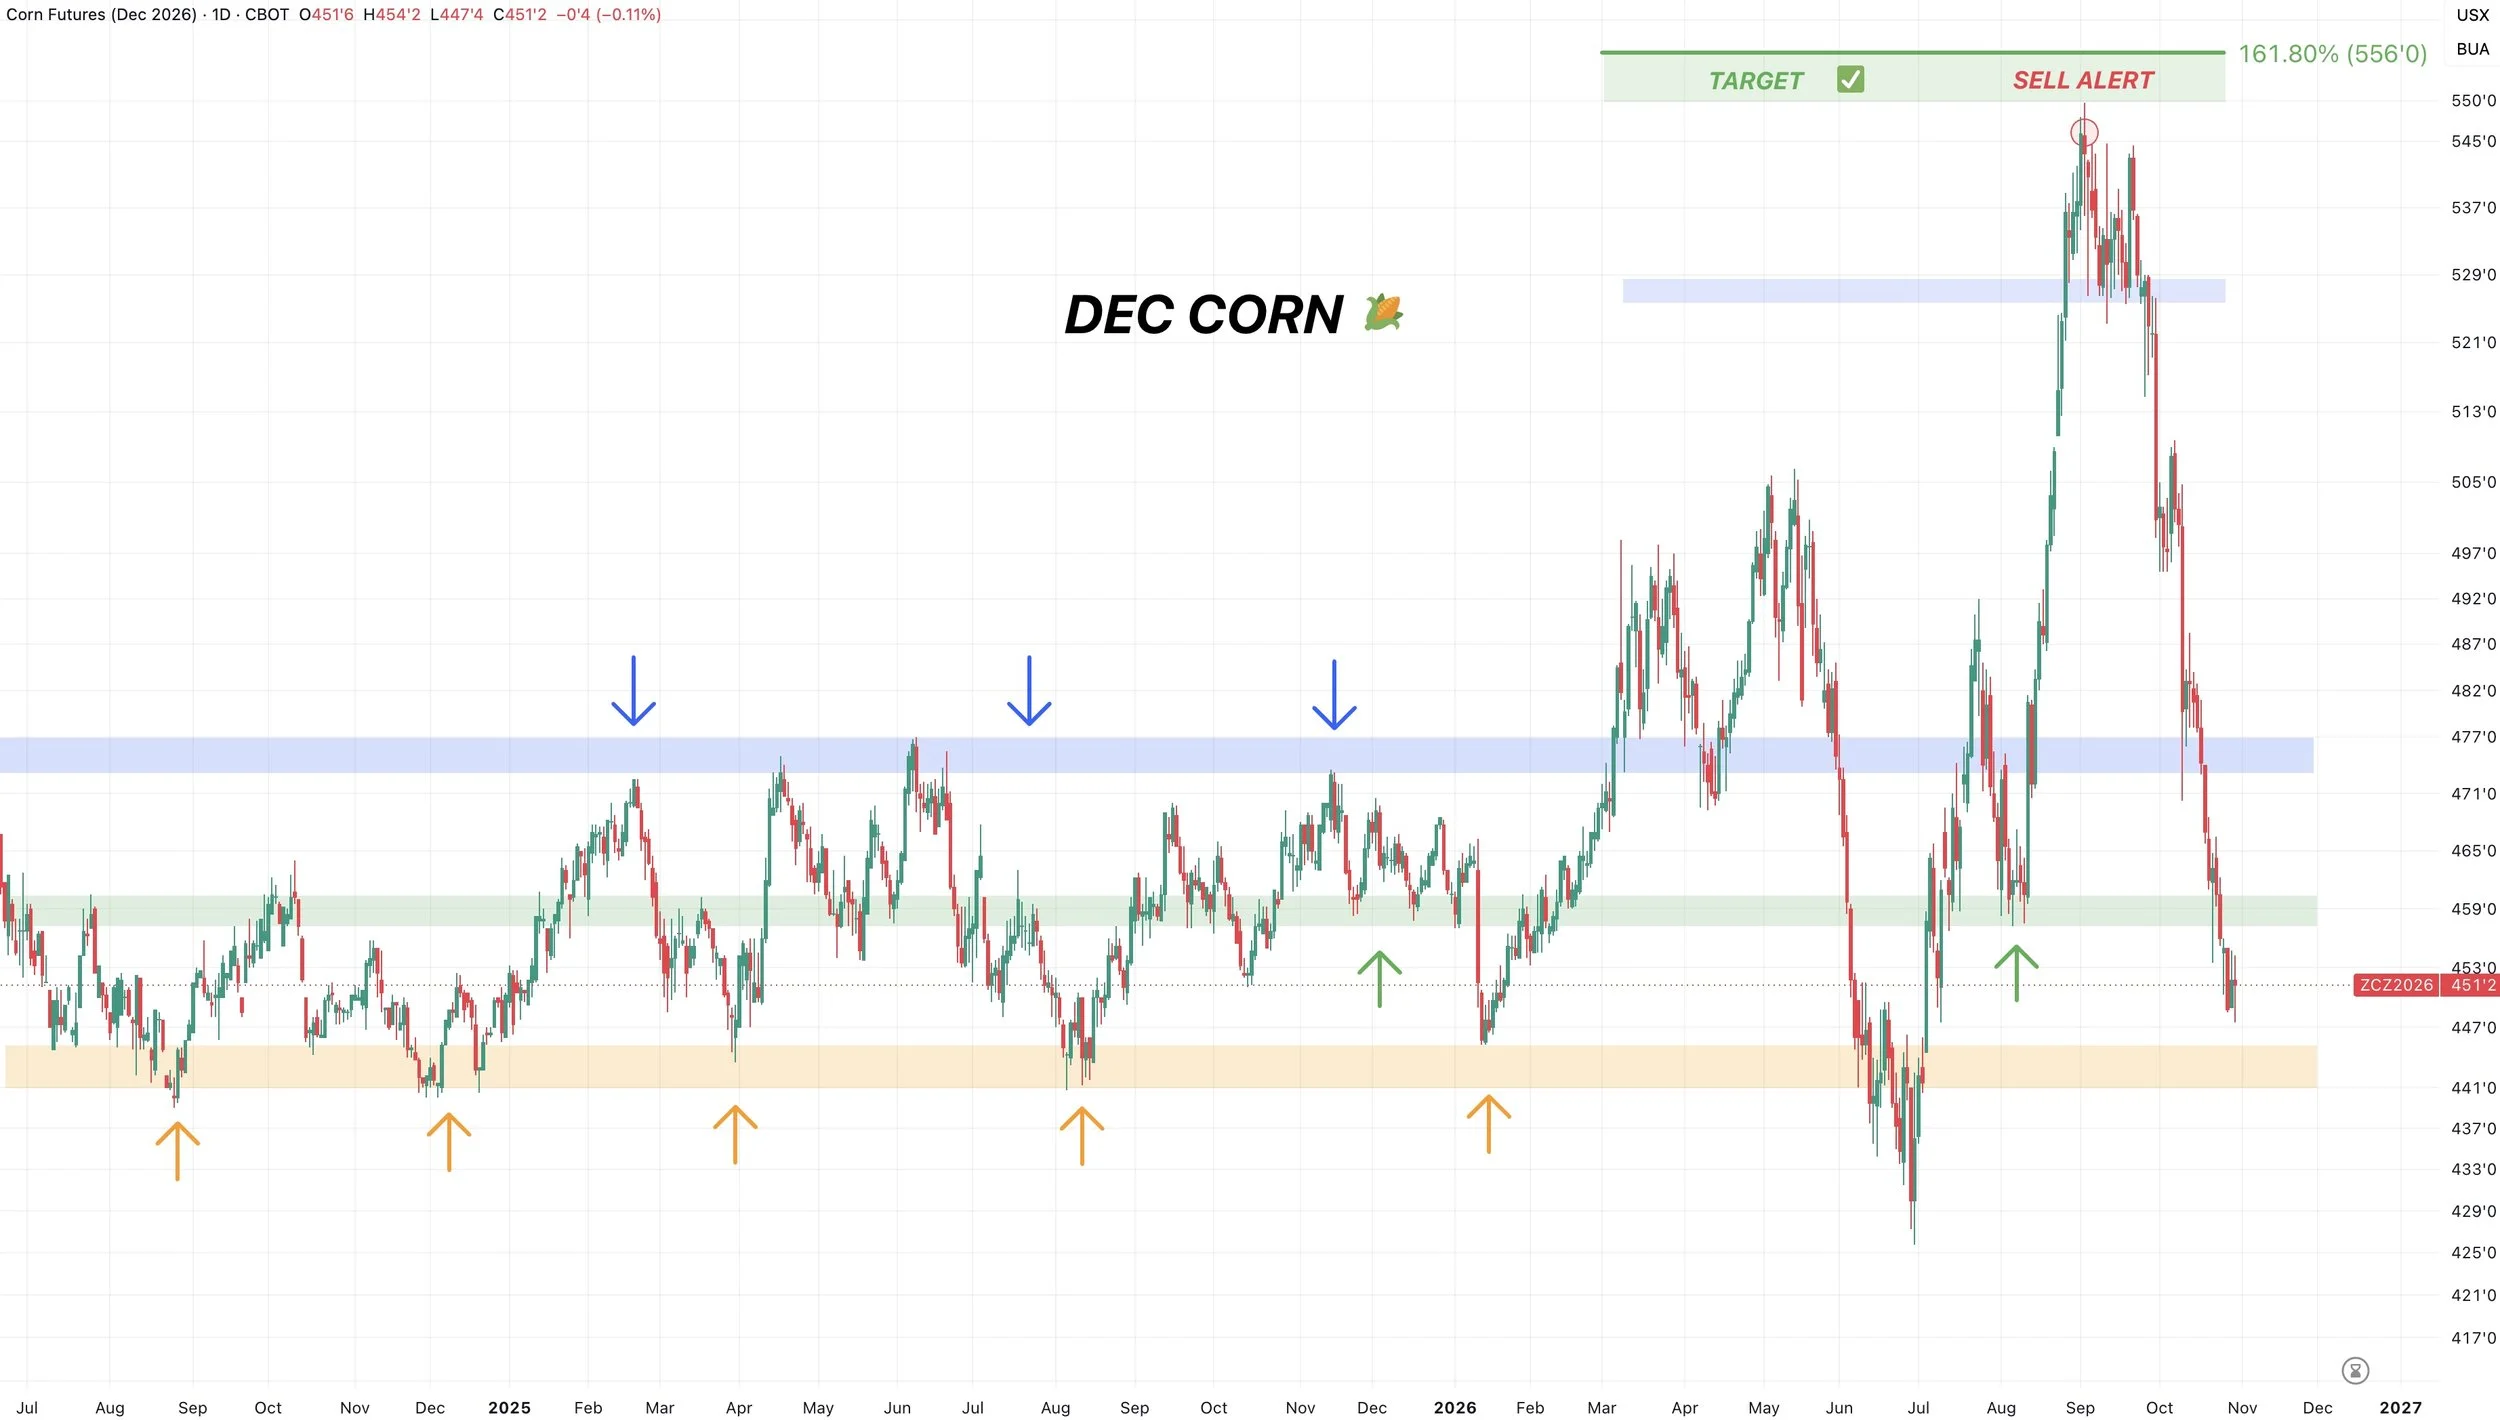
Still no confirmation of an absolute bottom for corn yet.
The big support we want to see hold is the $4.40 to $4.45 range.
That market has bottomed there on 5 separate occasions.
The only time we breached that level was those contract lows. But even then, we only spent a week below.
So I think that level is your risk from here, and I would like to think it would act as decent support if we get there.
Thus far we have continued to hold $4.50.
MACD:
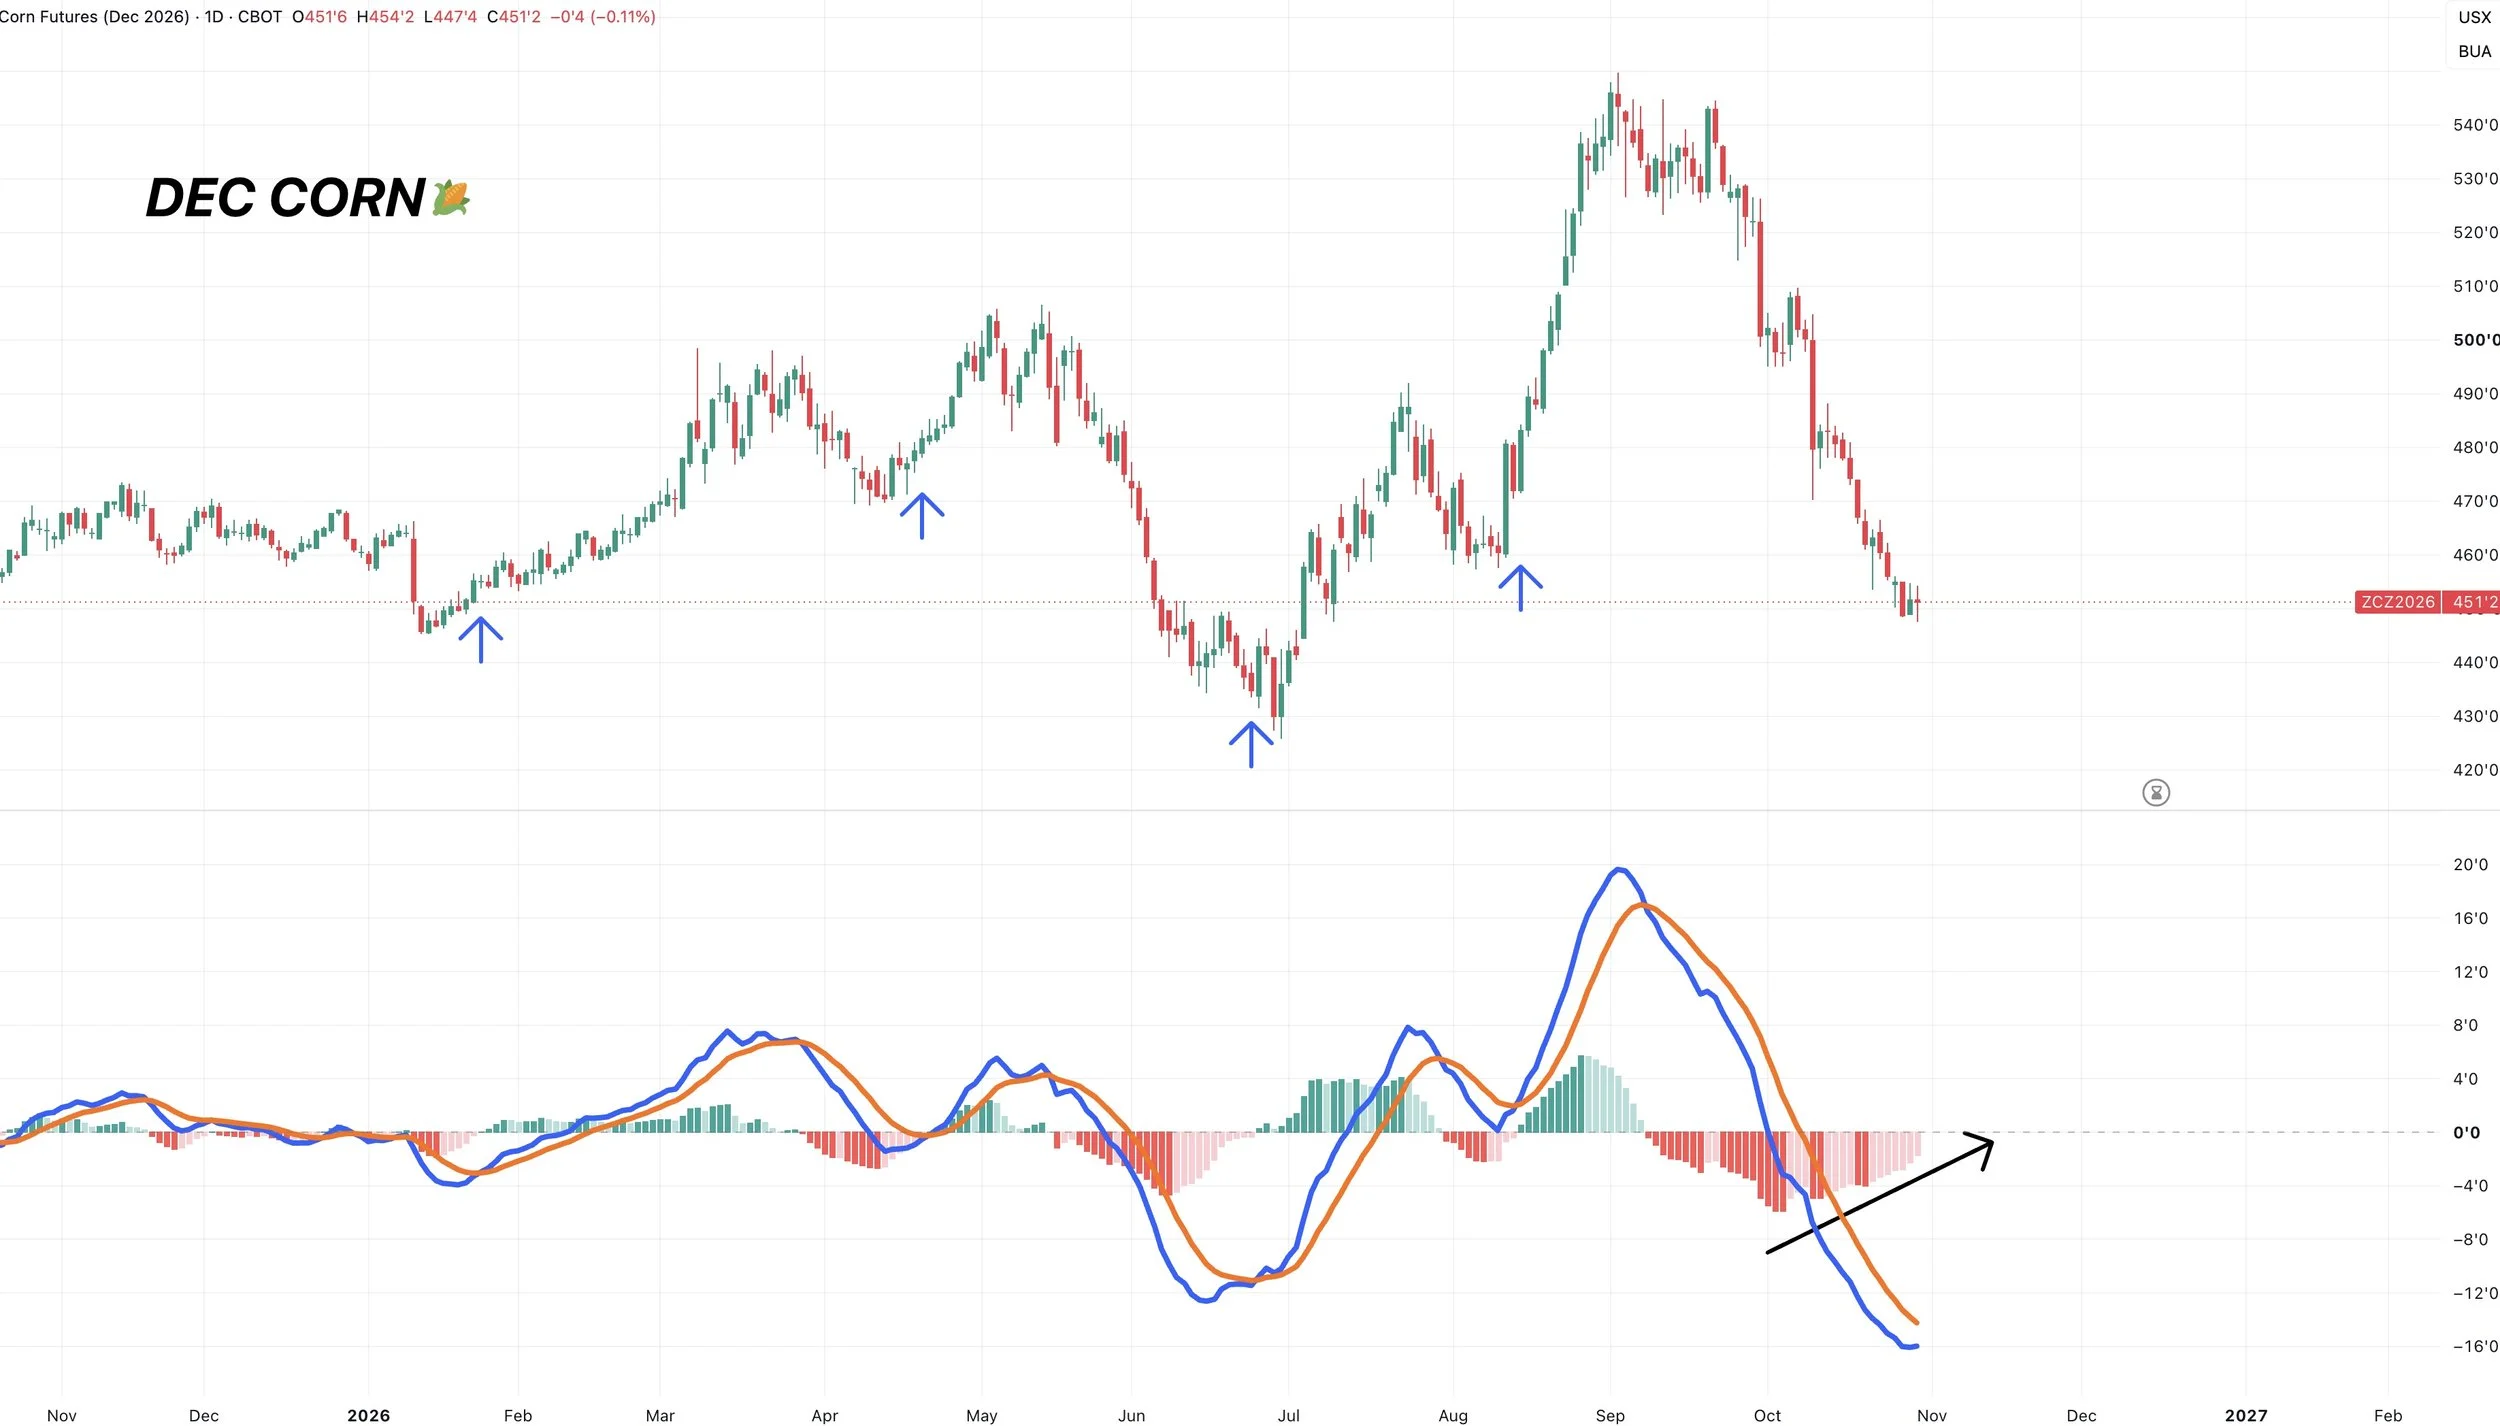
One thing I am watching is the MACD.
It has not yet crossed bullish, but looks like it's trying to do so here soon.
The last two times this crossed bullish, a bottom did closely follow.
Whether the bottom is in yet or not, I'd like to think we're close.
The MACD is essentially a momentum indicator. It's not perfect. But it could soon suggest the downside momentum is fading. As it is starting to curl higher.
RSI:
Dec corn is the most oversold we have been since 2023.
As we are sitting in extreme oversold conditions.
This alone doesn’t mean we have to bottom right here right now, but this market is clearly getting over extended to the downside.
So at the very least the blood shed should be over soon, and most of the damage should be done.
Fundamentally I do think this is a good area of value.
Options have become very cheap if you would like to re-own down here. I do like the idea of owning corn heading into next year. But that depends on your situation so reach out if you'd like to discuss.
Office: (806)484-1214
Soybeans
Fundamentals:
Soybeans continue to see pressure from the idea of better yields, which I agree could very well be true. Unlike in the corn market.
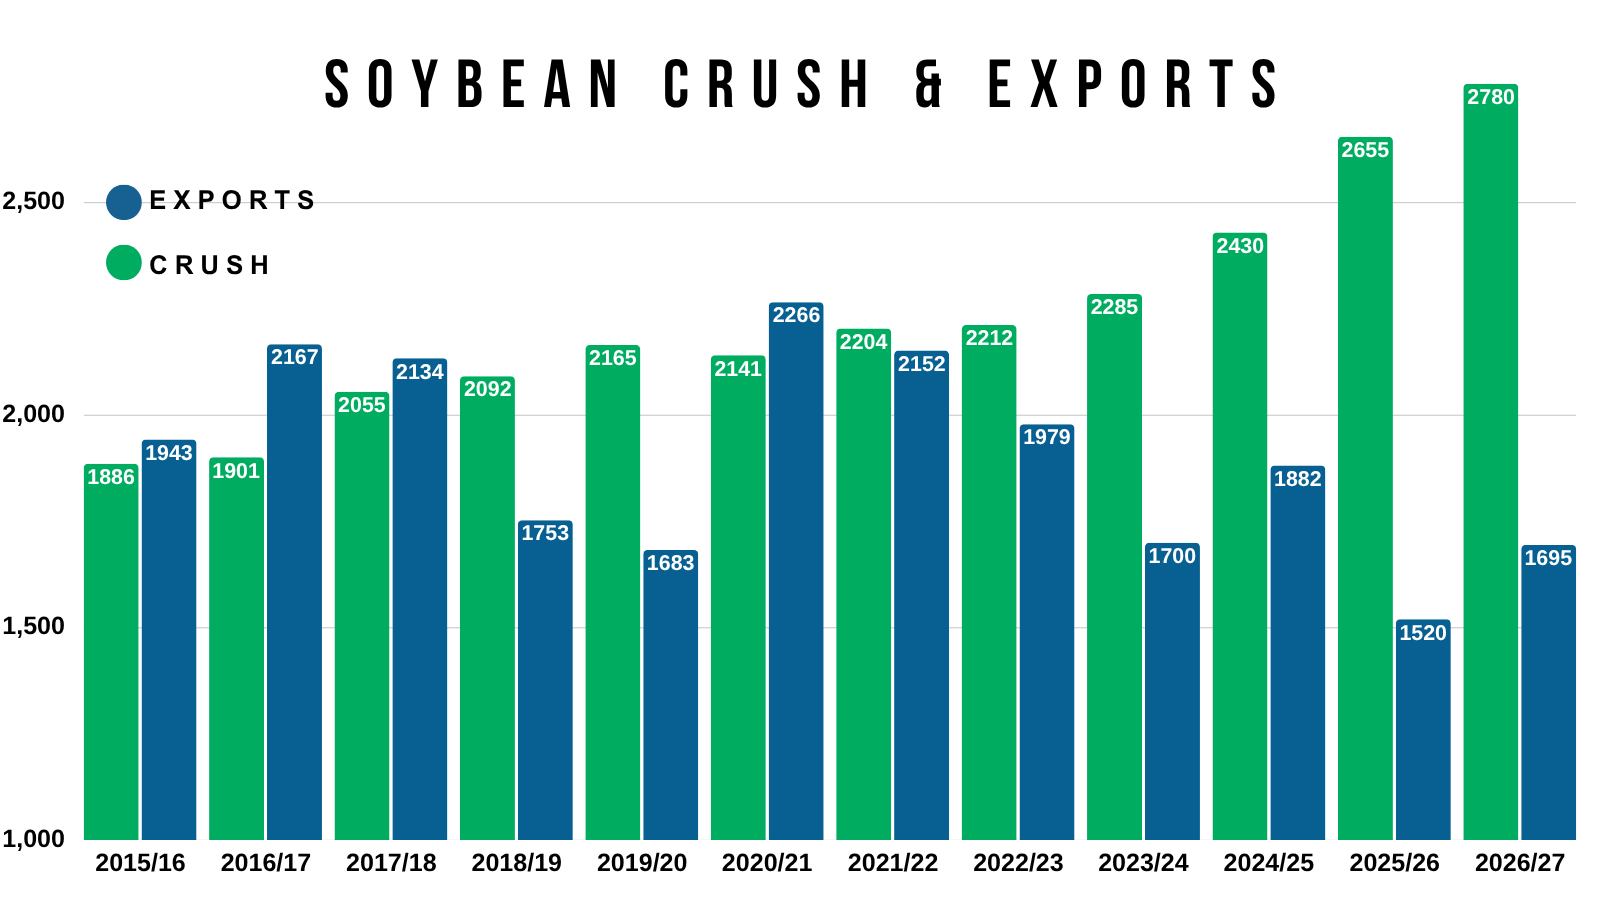
On the flip side, demand for soybeans is still stellar.
Look at our crush. Phenomenal.
Exports. Have drastically improved. China keeps buying.
Like I've said plenty of times before.
There is a reason the balance sheet is able to have far more acres than last year, yet not get bigger year over year. Demand.

We still have the Super El Nino in play.
The market hasn’t cared about this at all, because so far things are off to a good start down in South America.
But what happened the last time we saw an El Niño like this?
We had an El Niño year in 2023. But the last "Super" El Niño was 2015. This year's El Niño is suppose to be one of the strongest ever.
So what happened?
Let's take a look.
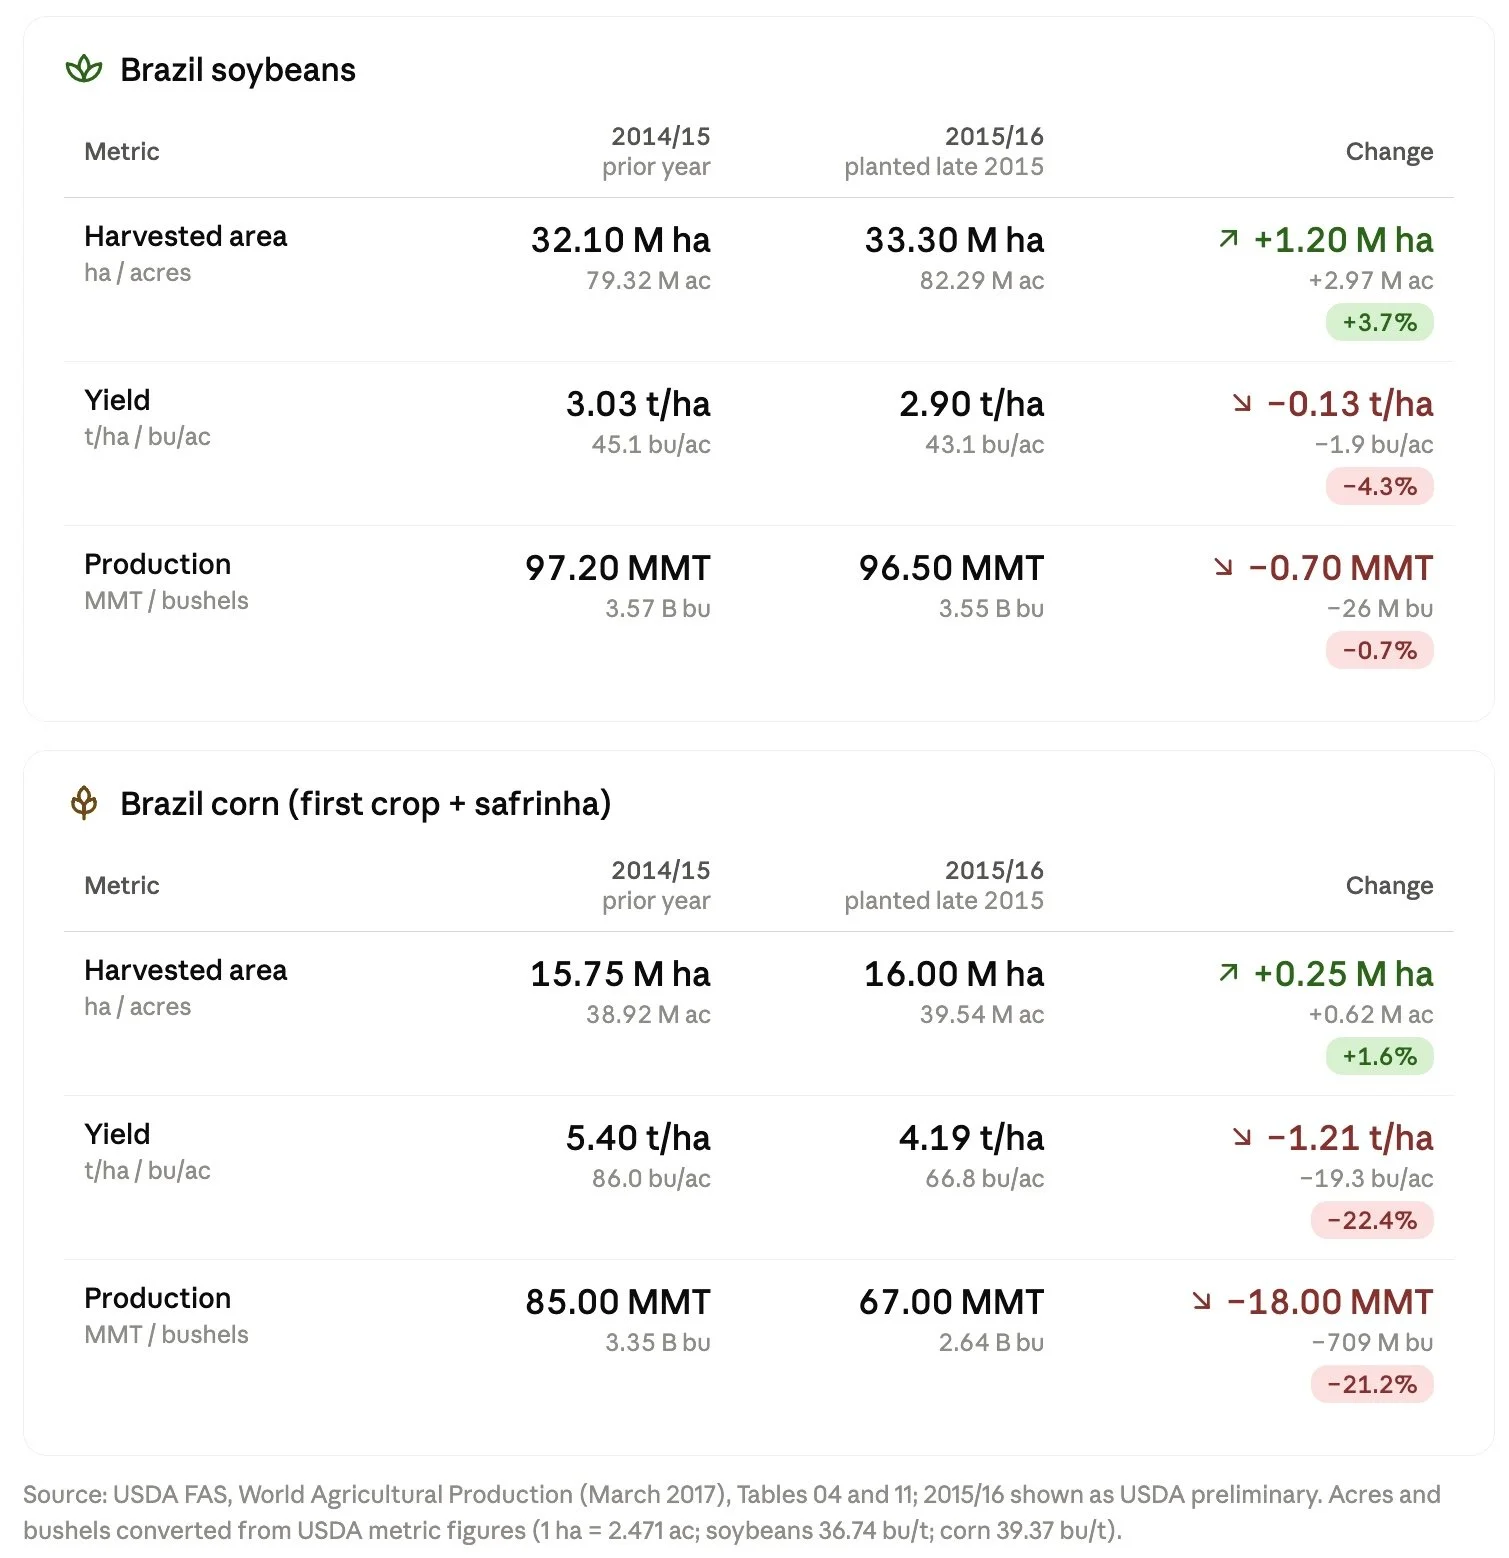
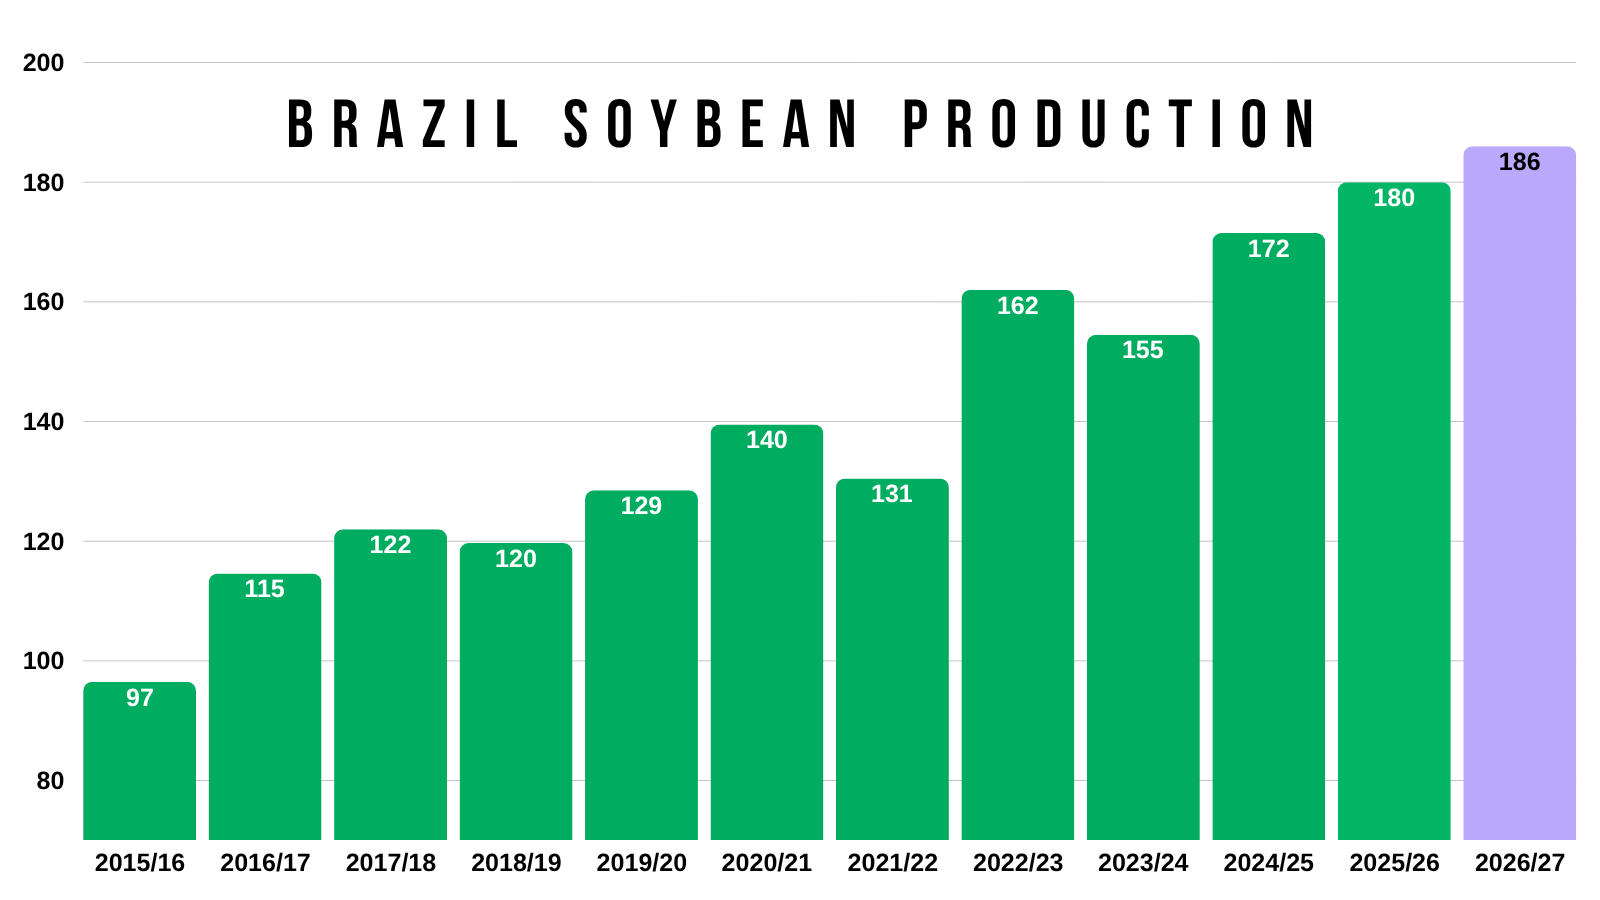
Brazil's soybean yield was down over -4% vs the prior year.
Production actually didn’t drop much though, because acres also jumped.
However, Brazil acres are projected to see their weakest growth since 2006 I believe. Which means we shouldn’t be seeing acres expand like they did.
Look at the safrinha corn numbers. Yield and production both dropped over 20% vs the year prior.
So this Super El Niño could definitely potentially impact things.
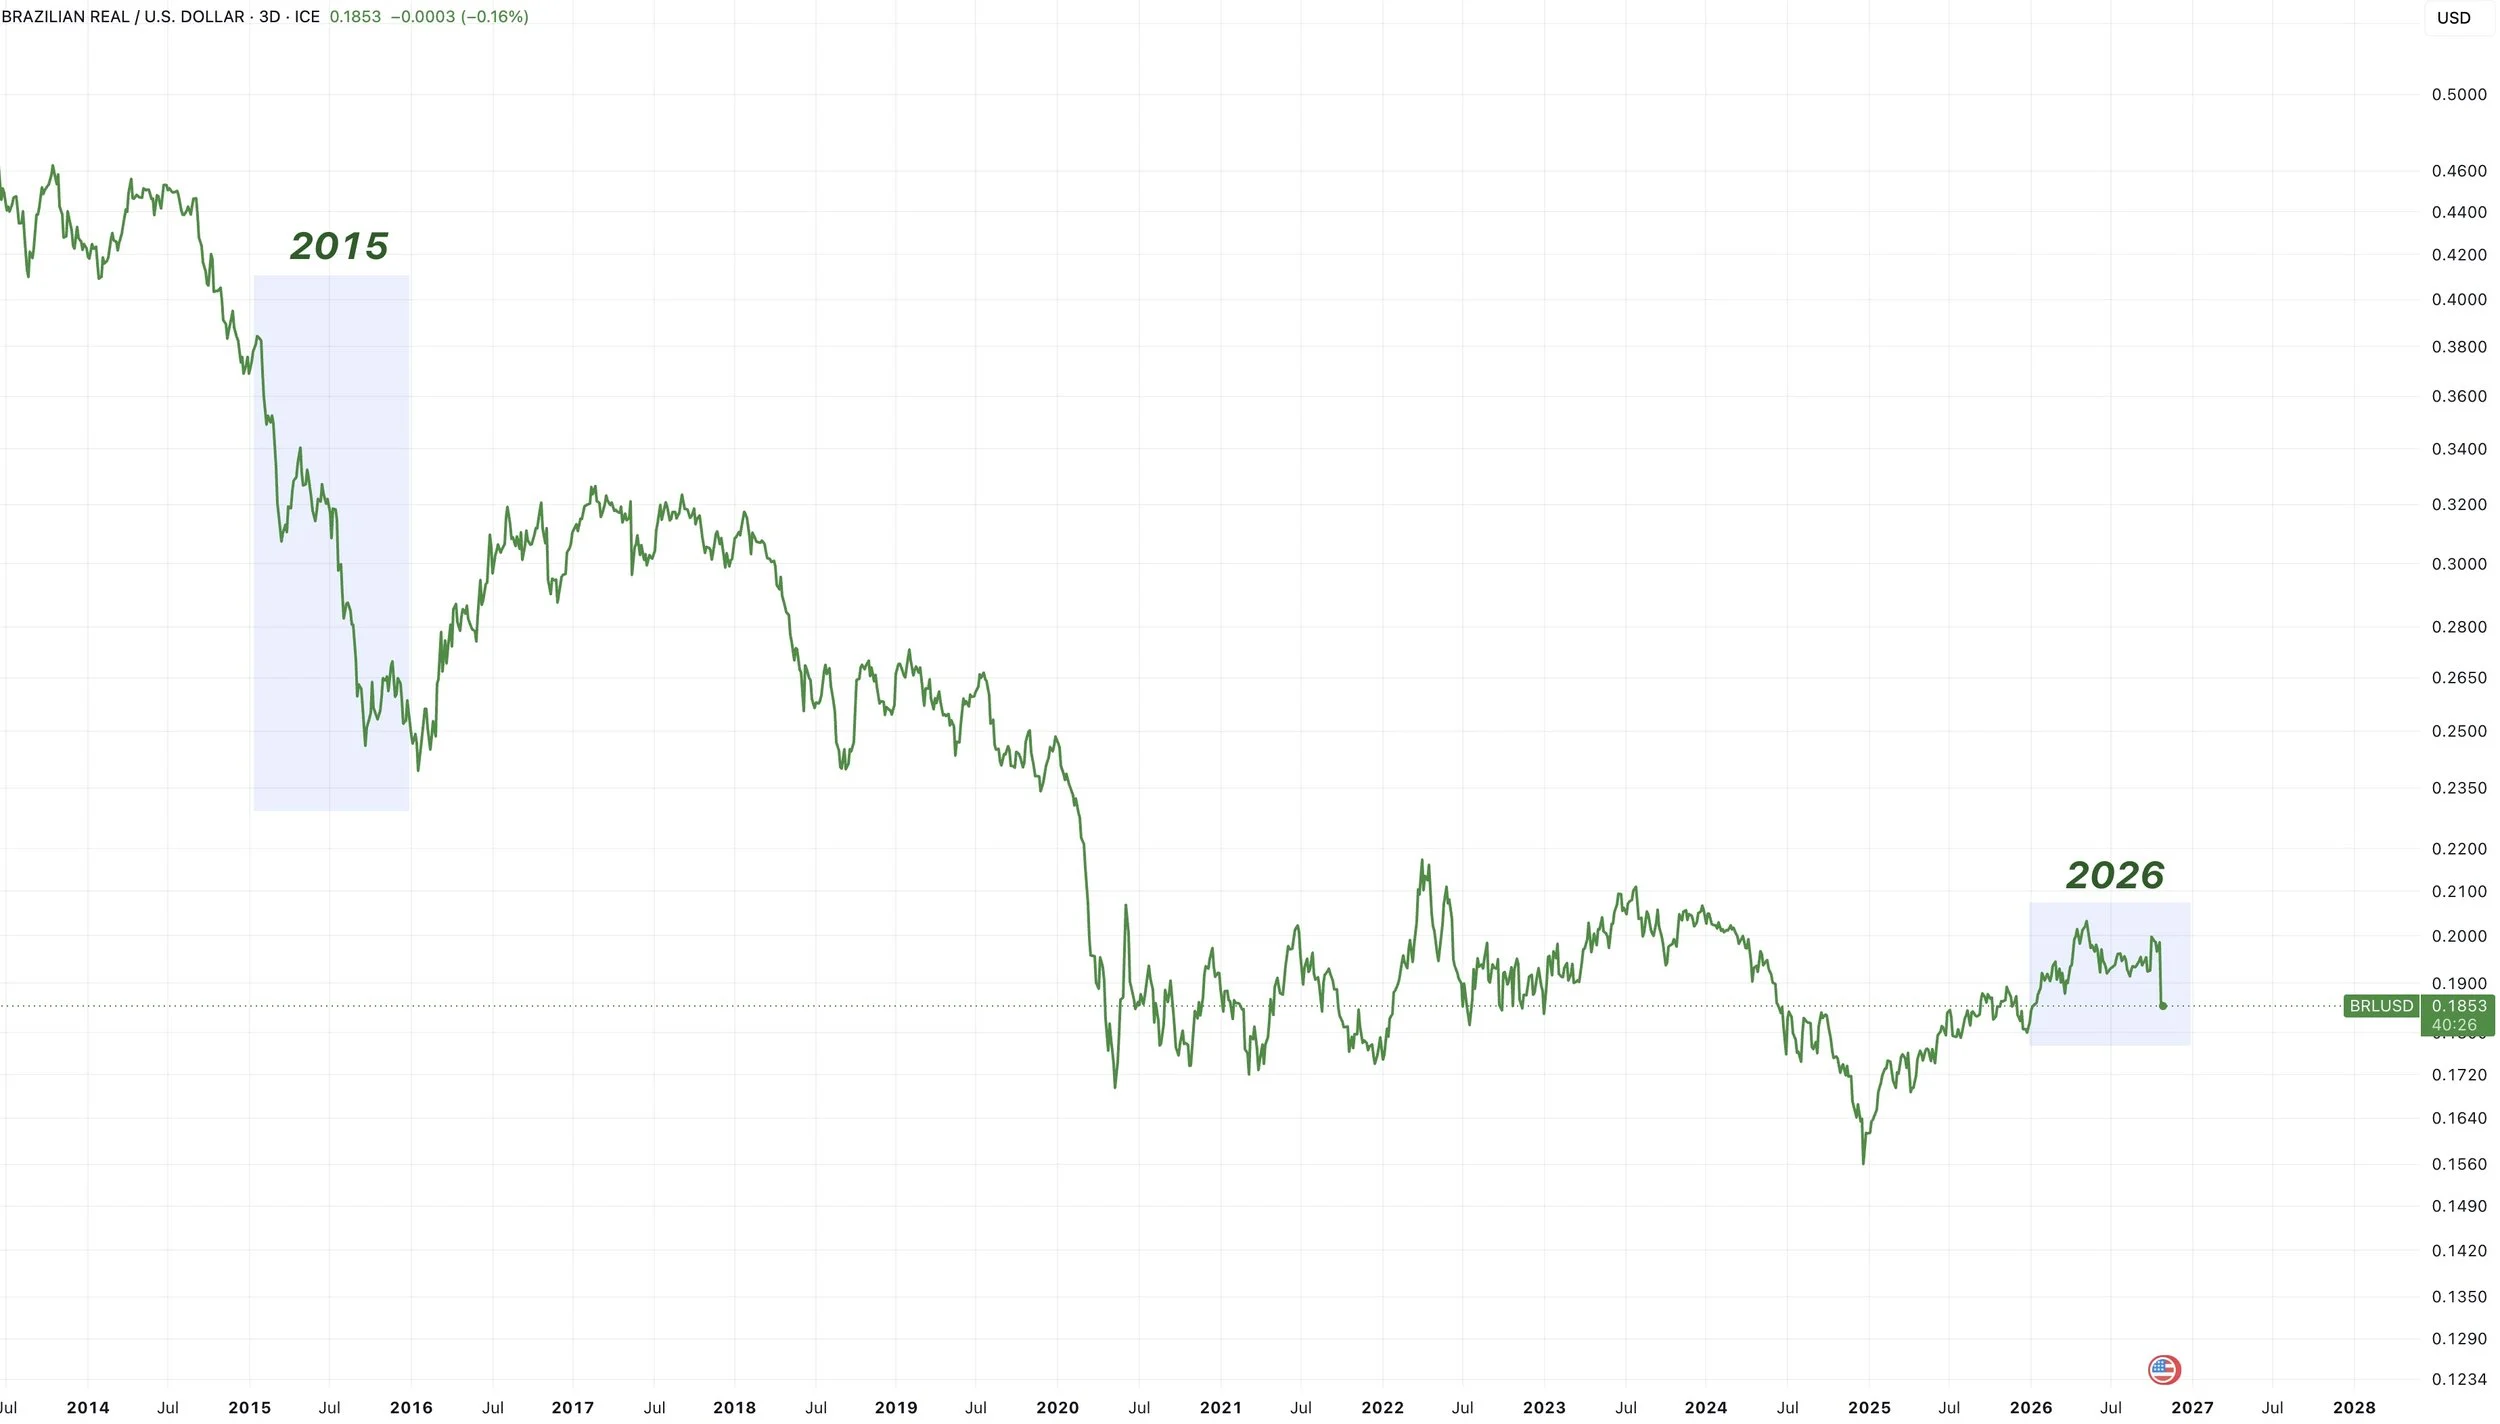
Back in 2015, we also saw the Brazilian real tank.
It fell 35% that year, which helped pulled in more acres.
Even with the whole Brazil headline we just saw, the real is actually still up on the year this year. And still well off the lows from 2024.
No one knows exactly how this one is going to impact things.
And it's still too early to make any bold assumptions. So far Brazil hasn’t seen any issues.
Right now the USDA has Brazil production pegged at a record 186 MMT. Up from last year's 180.5
What we do know is that this market has not priced in any sort of hiccup for Brazil.
As we've talked about many times before.
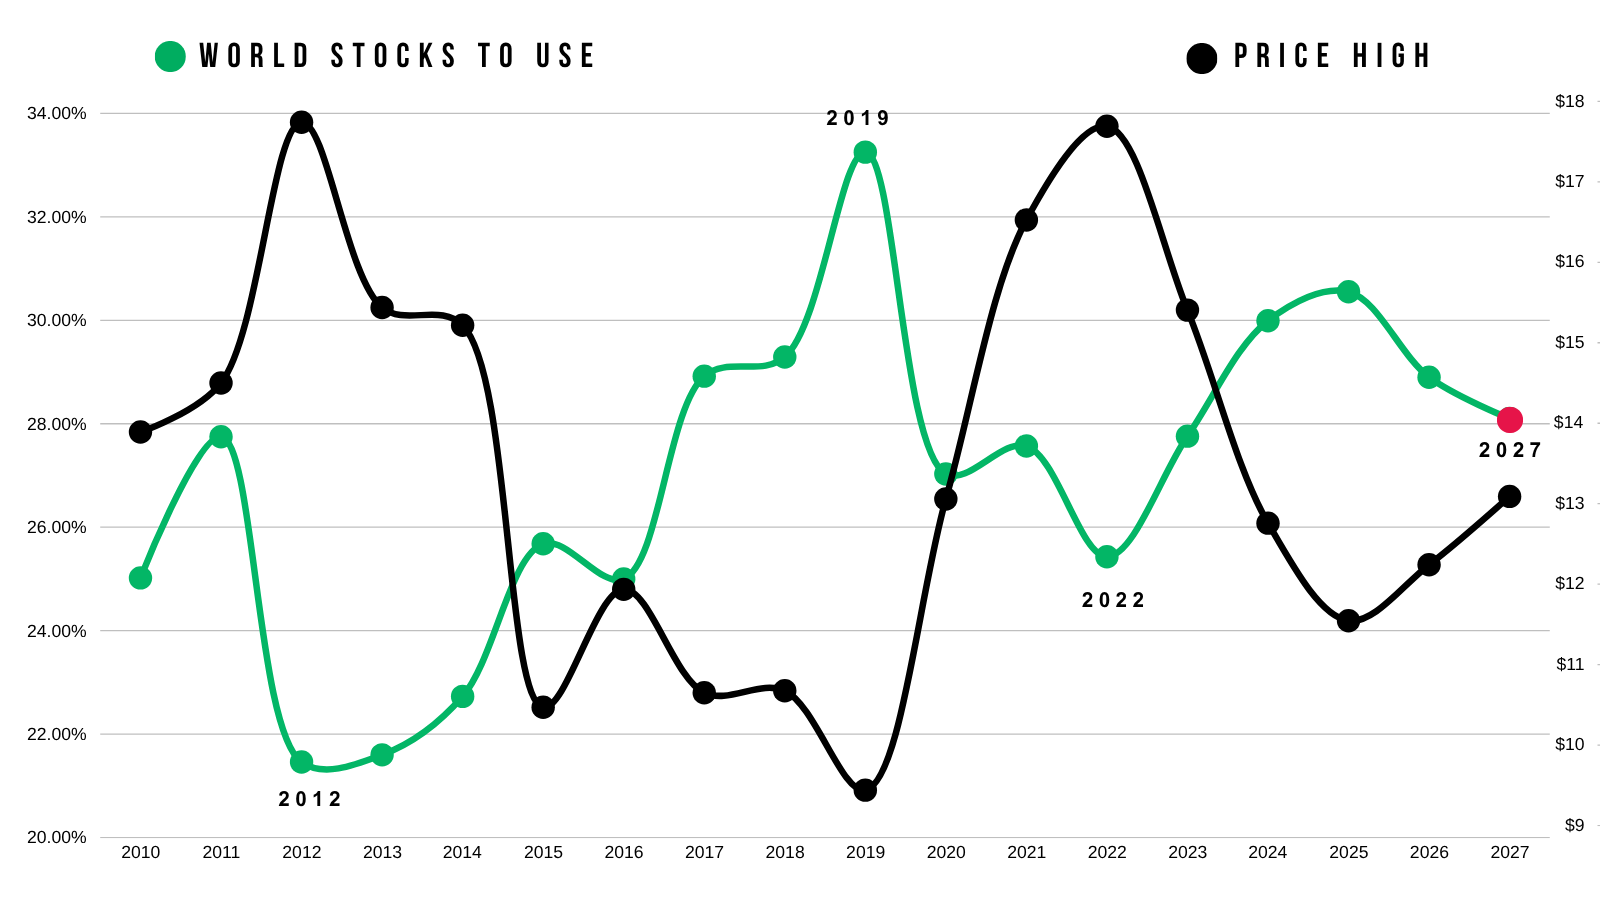
The fact that the world balance sheet continues to get tighter even with projected record crops in Brazil and the US is not a bearish item.
And if Brazil has an issue, this market will quickly price it in.
Again, it is too early to say Brazil is going to have any major problems. But historically, a Super El Niño can impact things, and the world balance sheet can’t really afford any issues because of how strong demand has been.
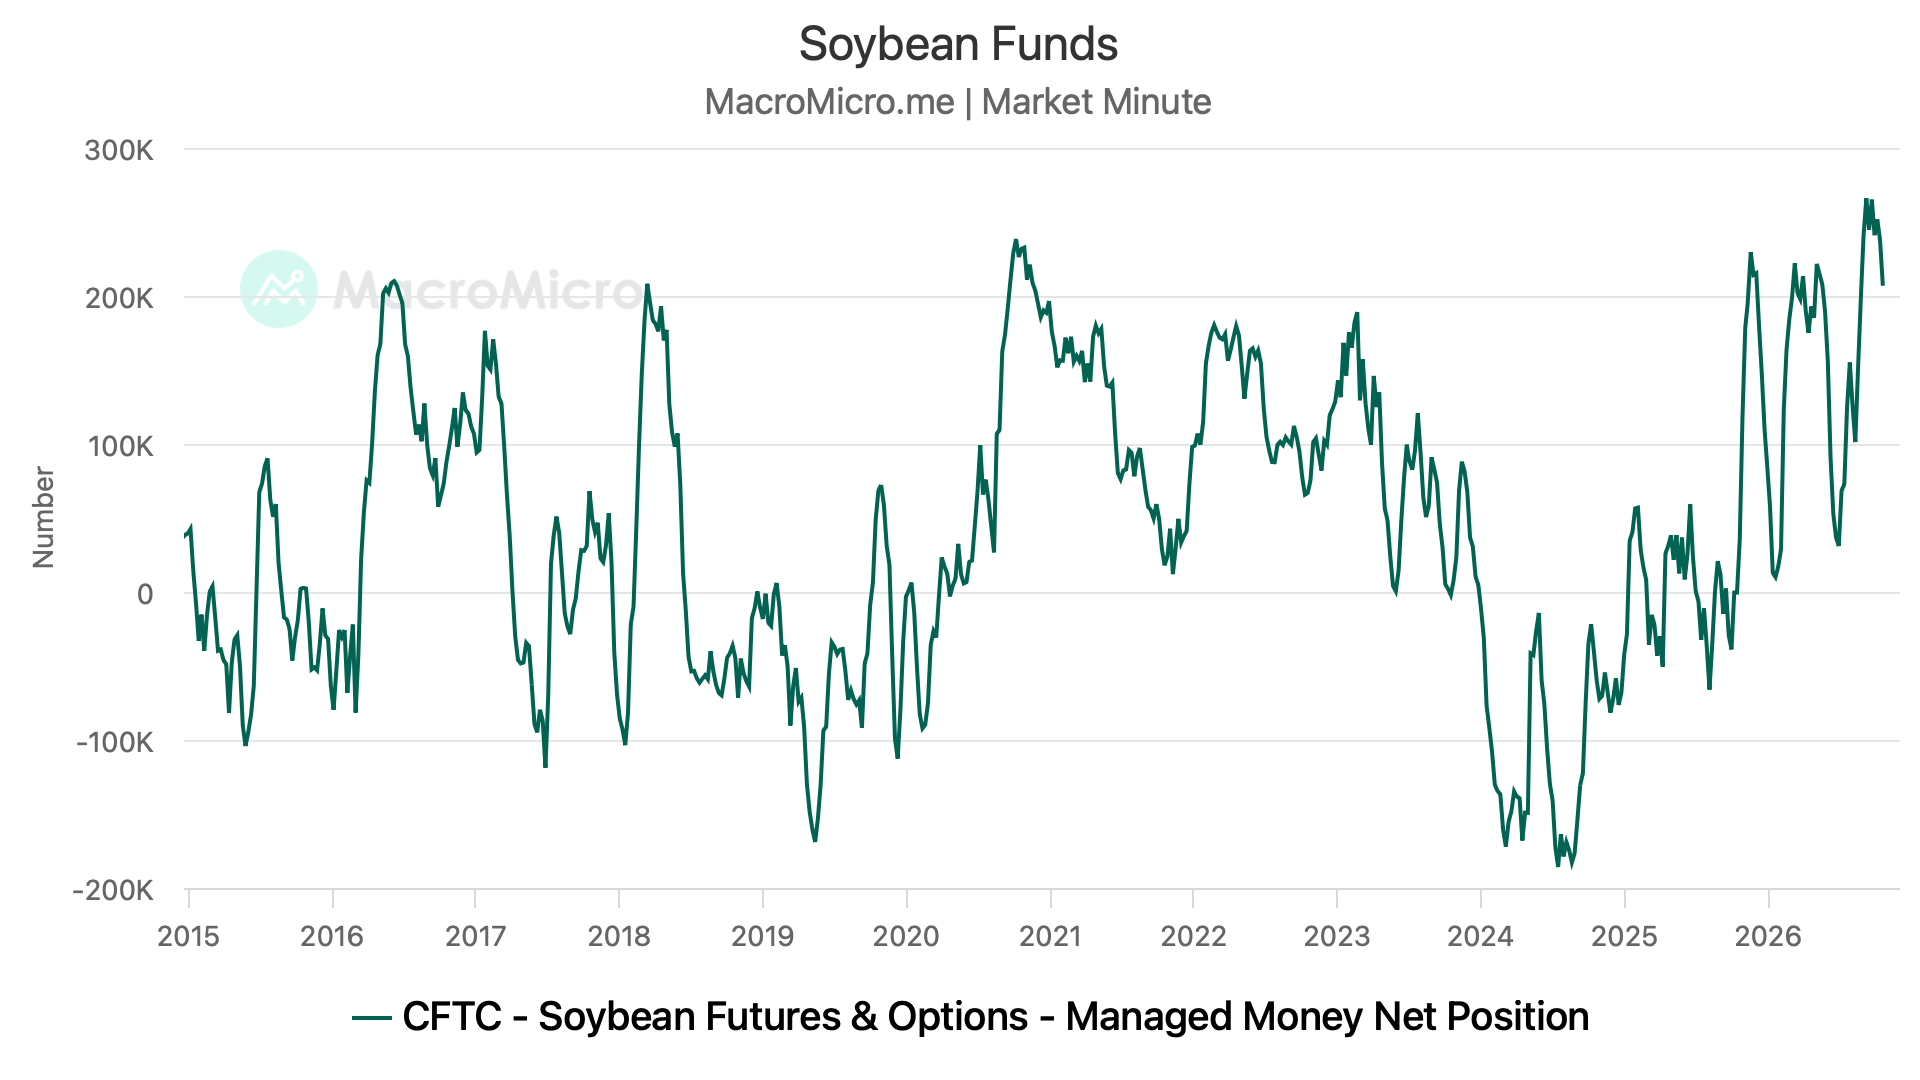
The funds continue to shed some length.
They are still pretty long, especially when compared to something such as corn where they've sold a lot more.
On one hand, you could argue this leaves the risk that they sell further. As they still have room to sell.
On the other hand, you could argue it's because they see a potential story. As they've held on to that position a lot harder than in corn.
The spreads are still going to be a key item to watch.
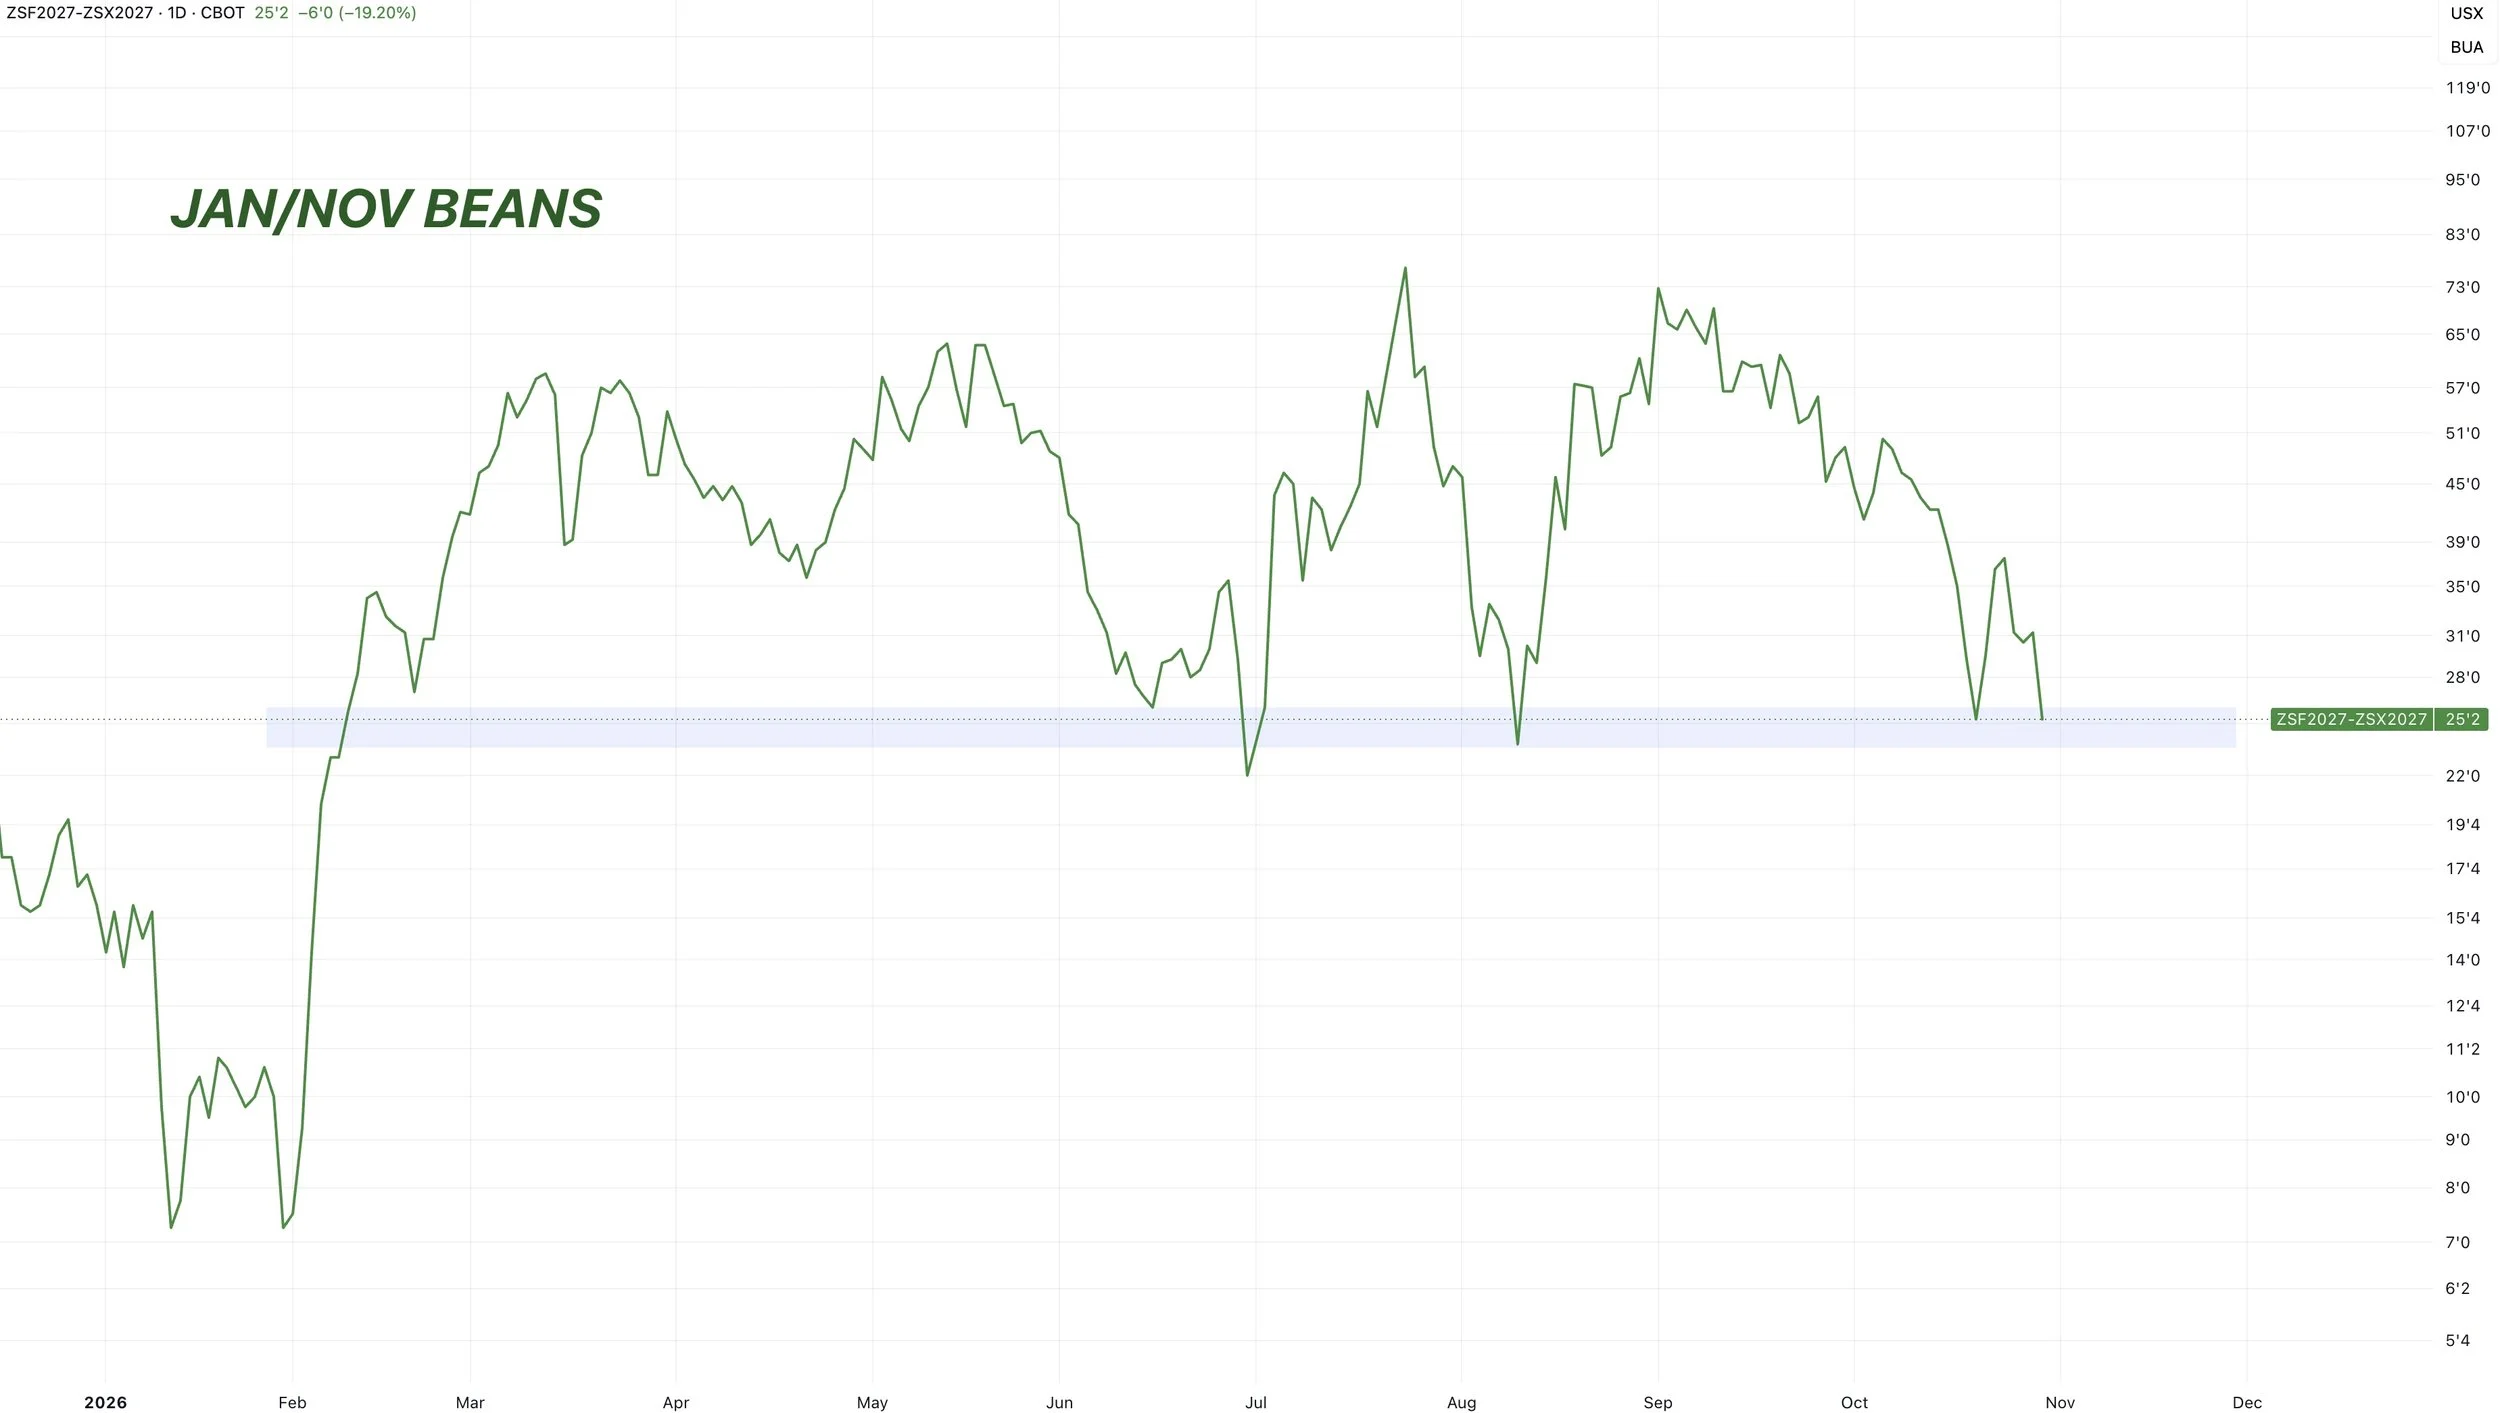
Here is the Jan to Nov spread.
This area has marked the last two bottoms for the spread and for soybean prices.
The spread firmed up nicely last week, but has nice given it all back.
If the spread firms up, it's a good sign.
If the spread goes and posts a new low, it could be a reason for caution.
Charts
Nov Beans Chart:
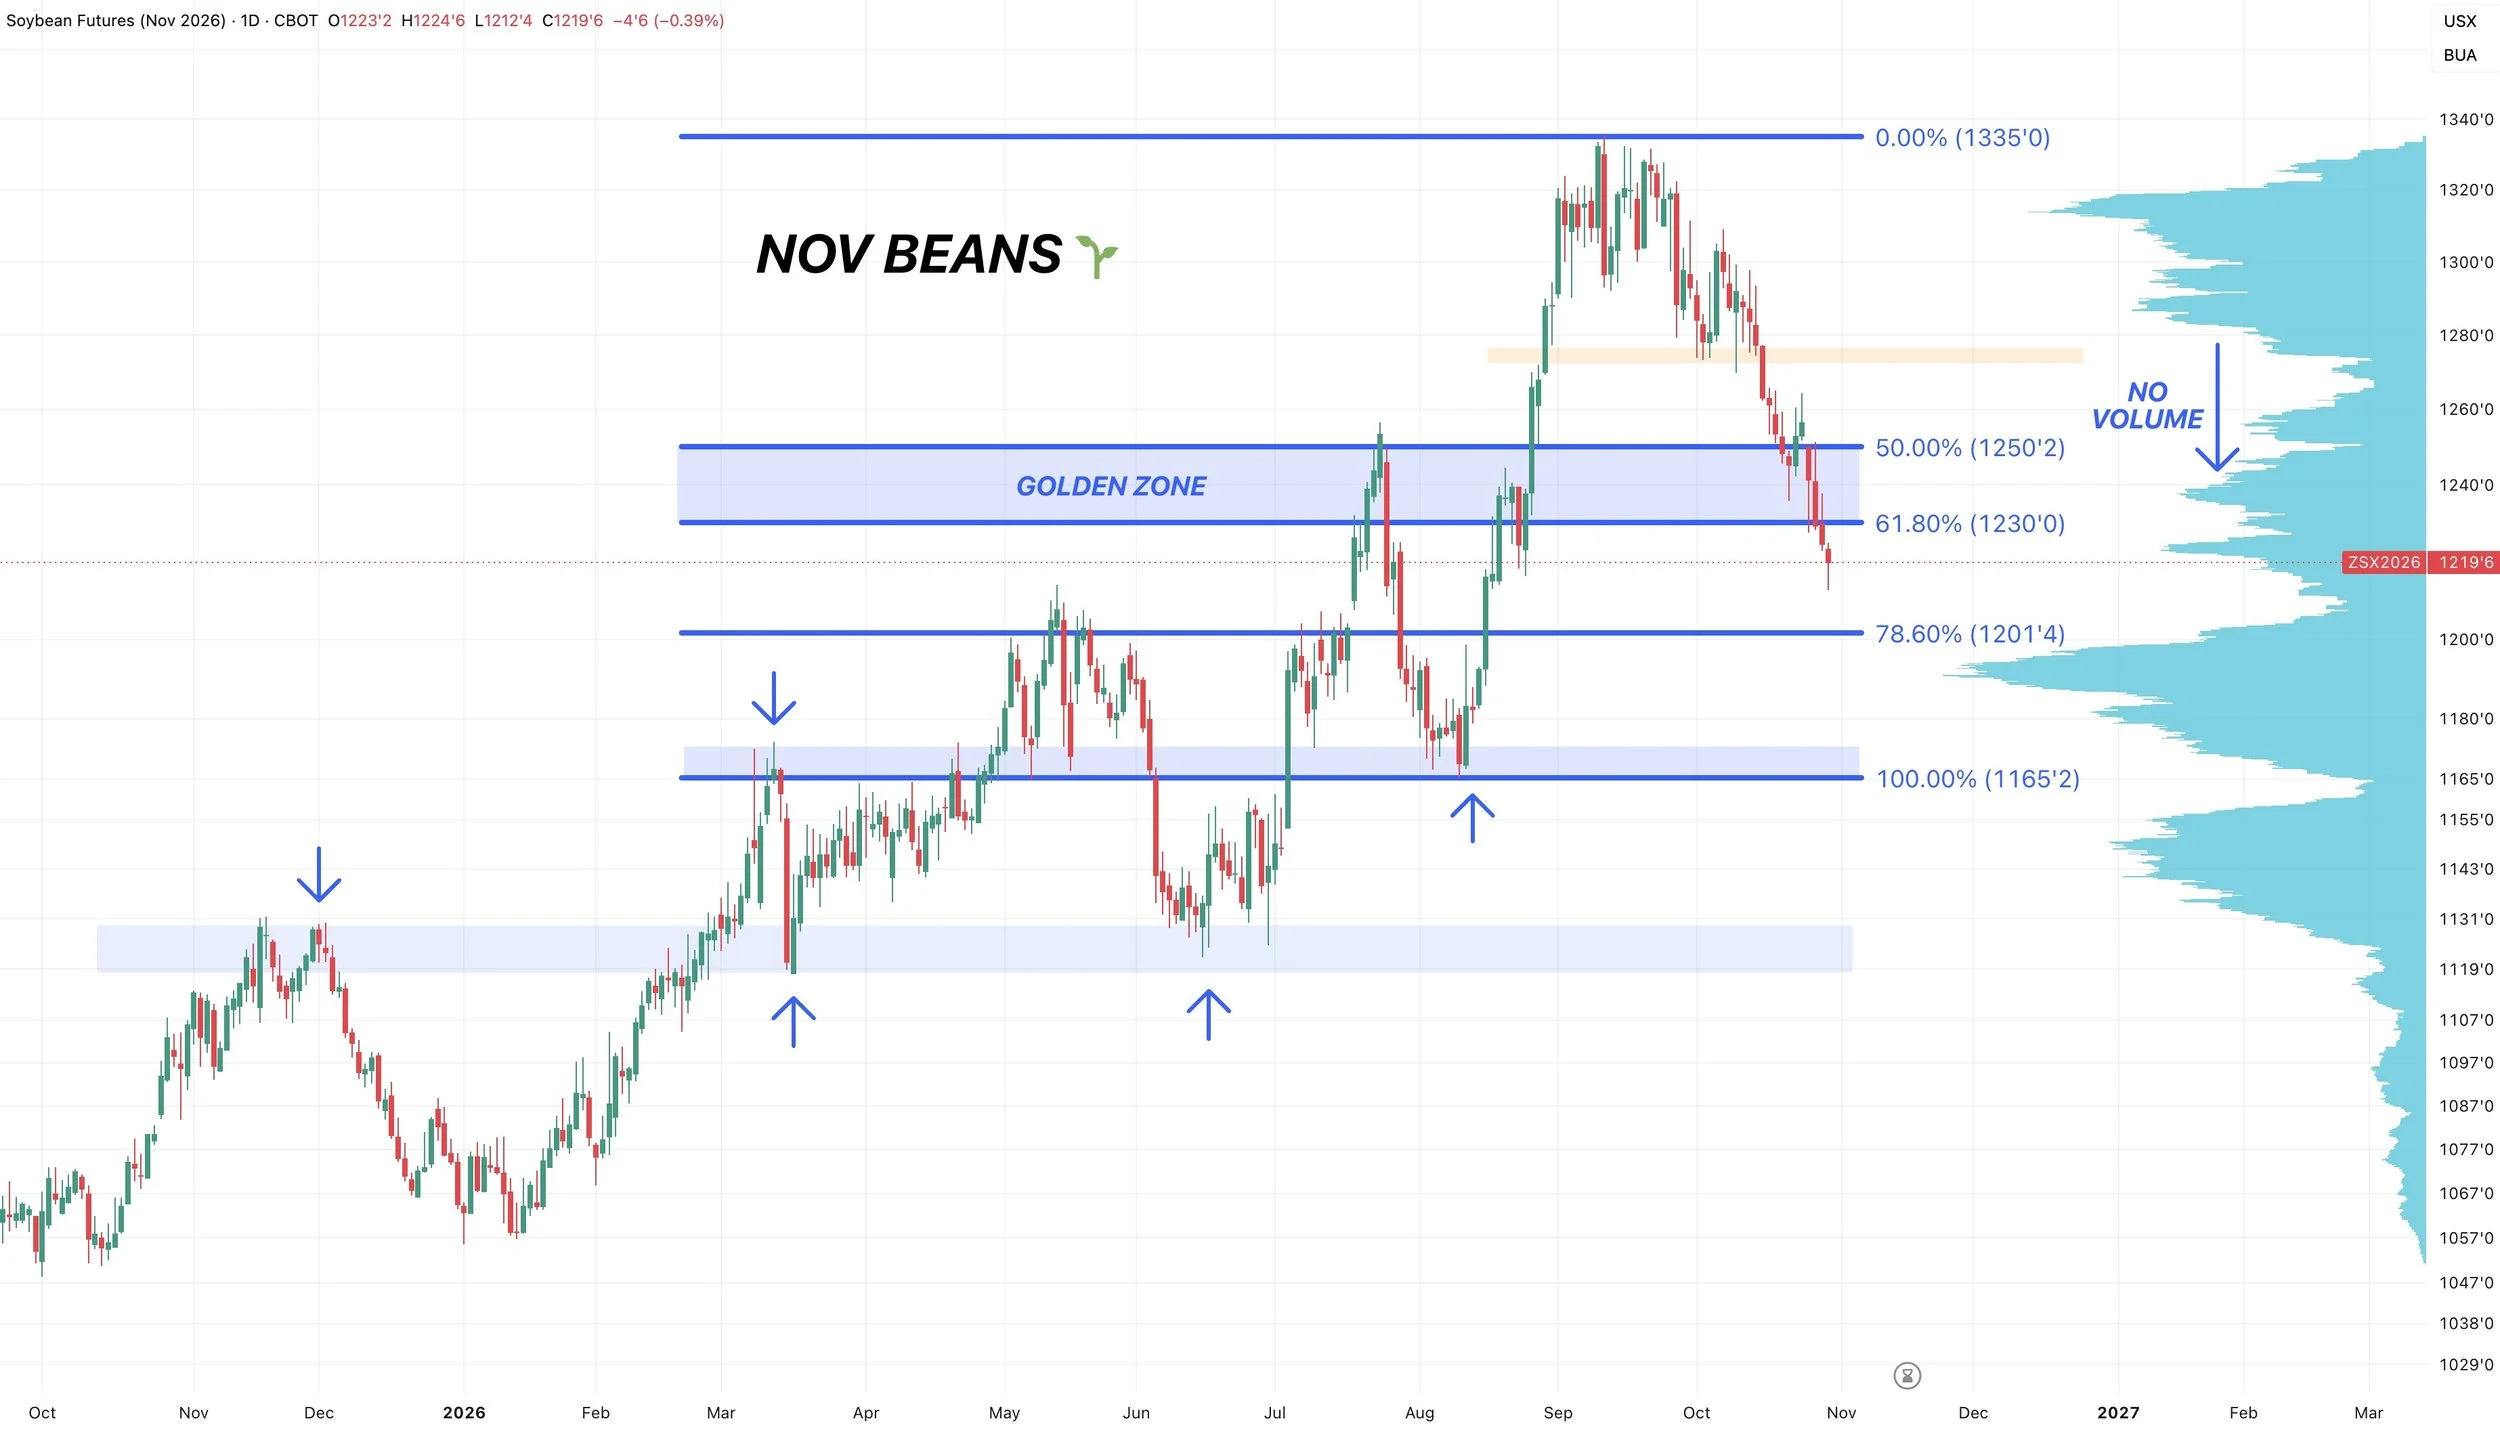
We failed to hold that $12.30 support, as a result we got a flush lower.
We had a nice close today, so you can’t hate the price action, but we'll need to see more confirmation before calling a bottom.
For now the risk is that we came down to the next support level.
I expect us to carve out some lows between here and that $12.00 range.
Since we broke the 61.8% level down to the August lows, the next level is the 78.6% level. Which also re-tests those highs from May.
We did perfectly tap the May highs today, but the risk is that we head a little lower towards that $12.00 support.
Jan Beans:
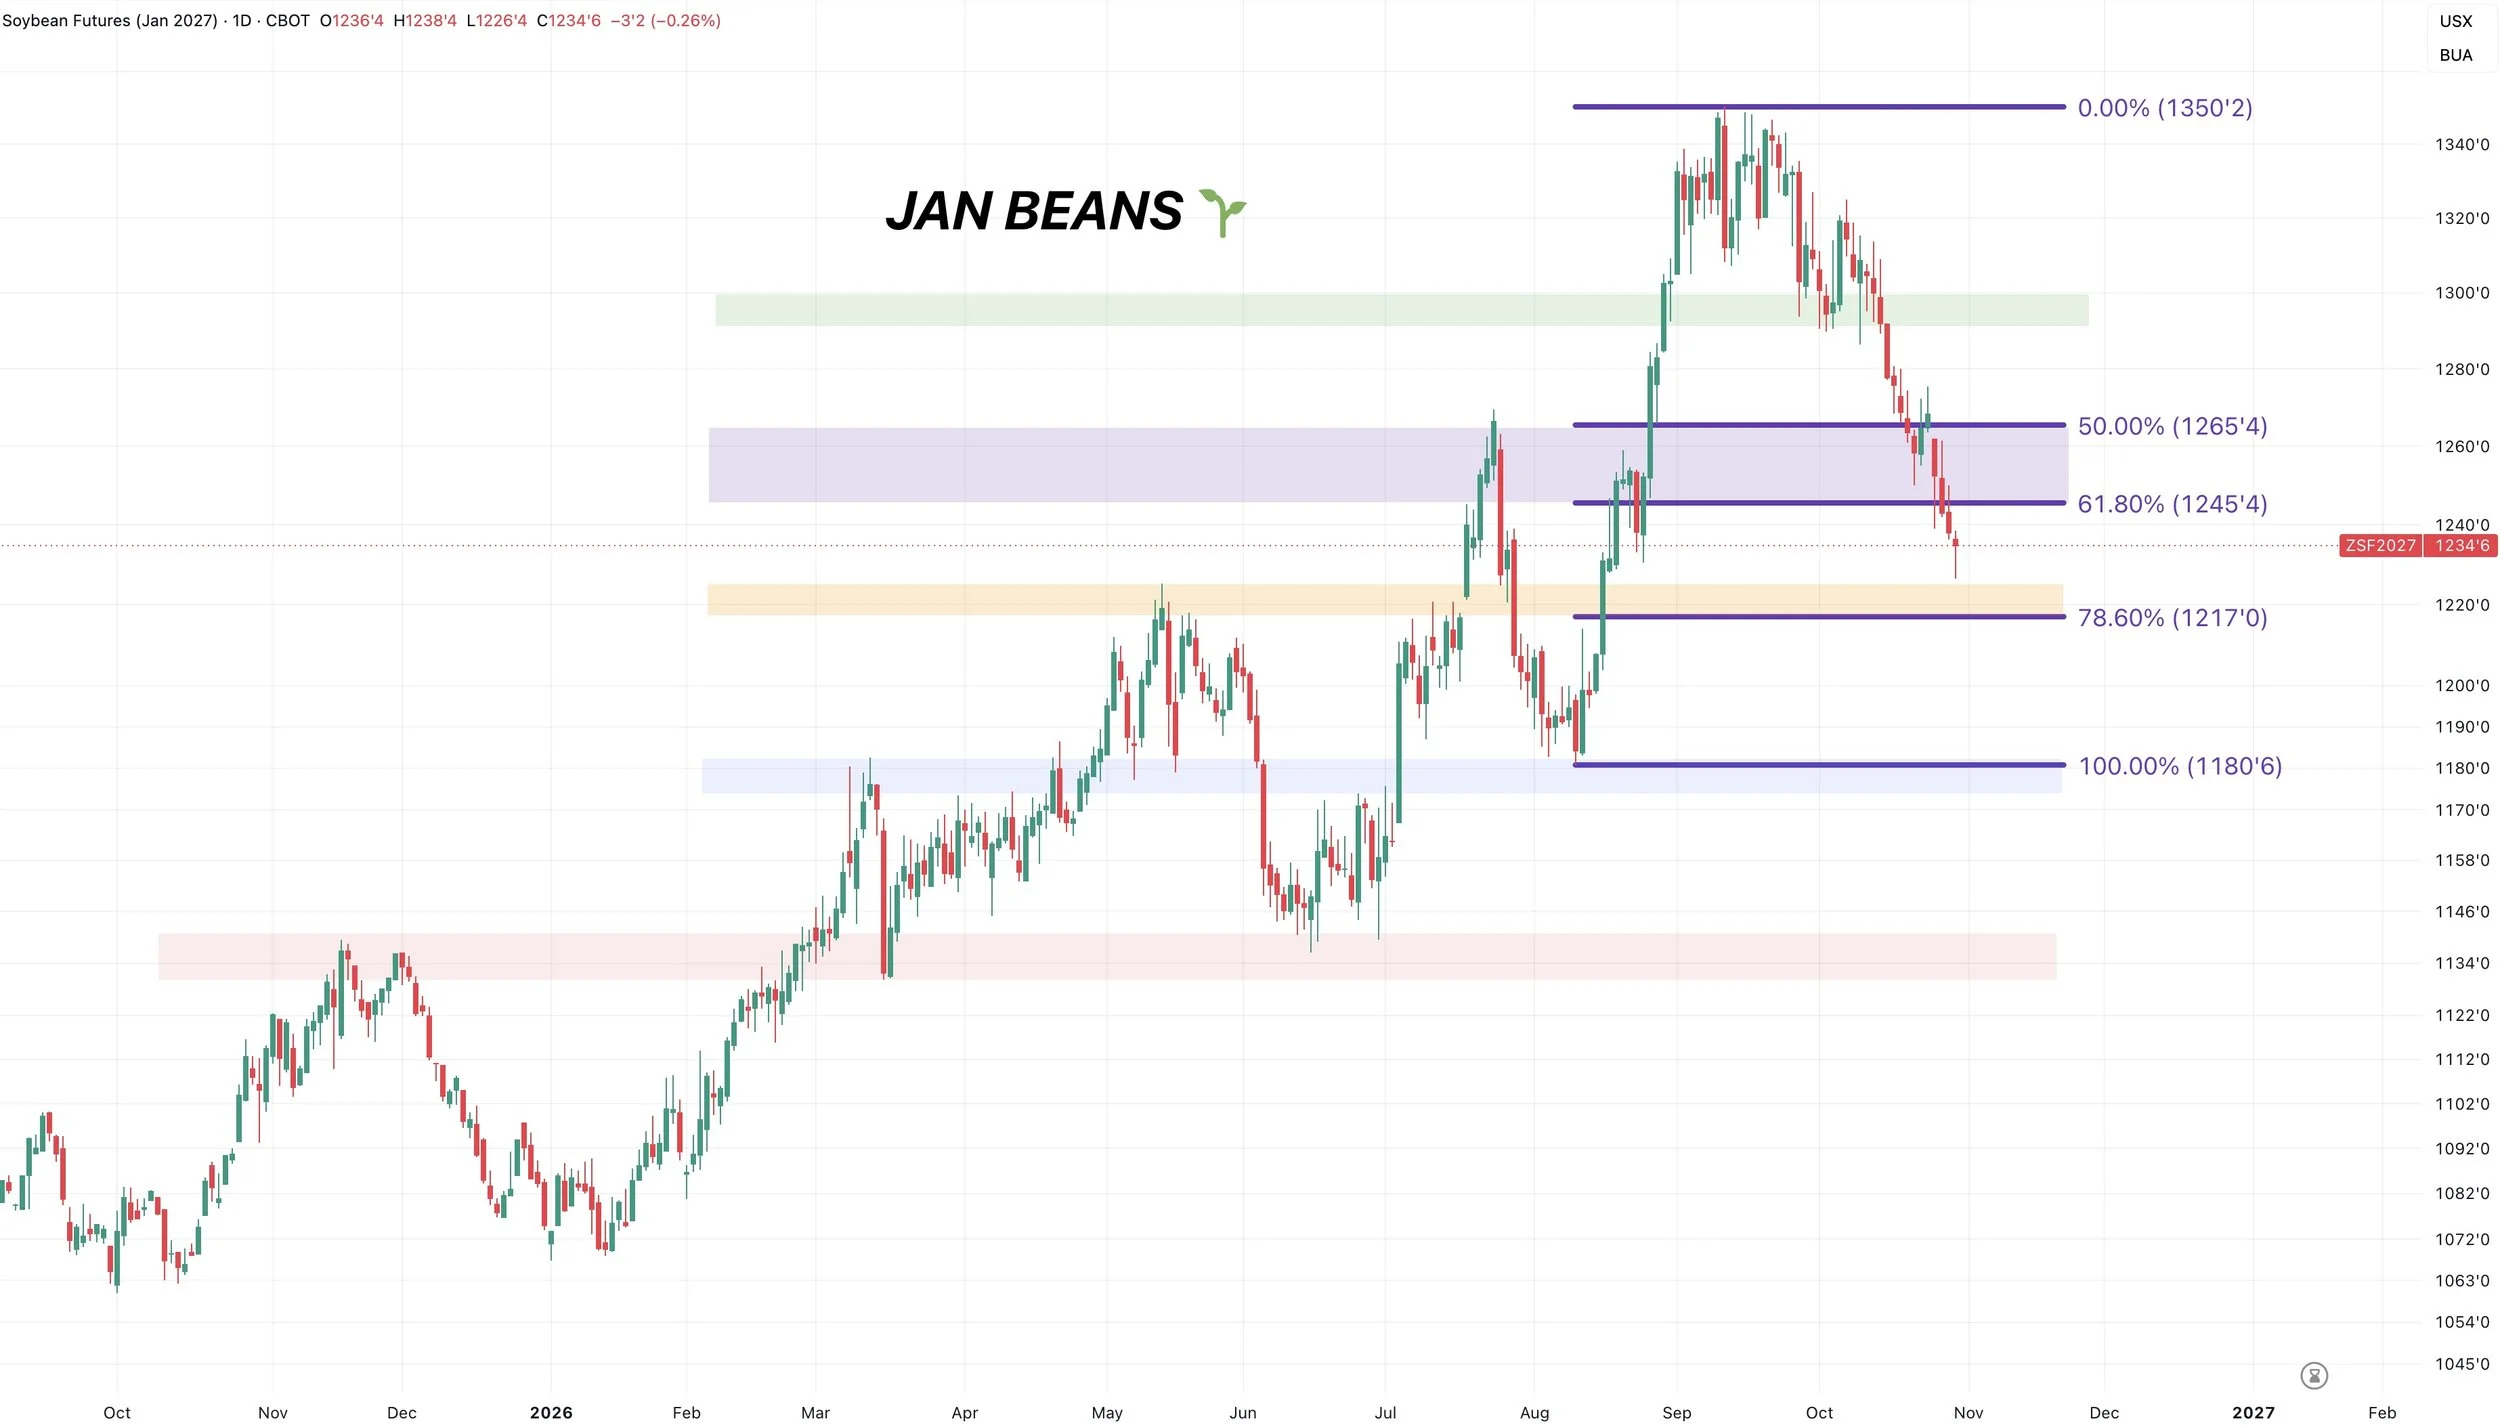
Jan beans are the main contract now.
Like in Nov, we did break some support.
As we failed to hold the 61.8% level to the August lows.
Which opens the door lower to test the next level of support.
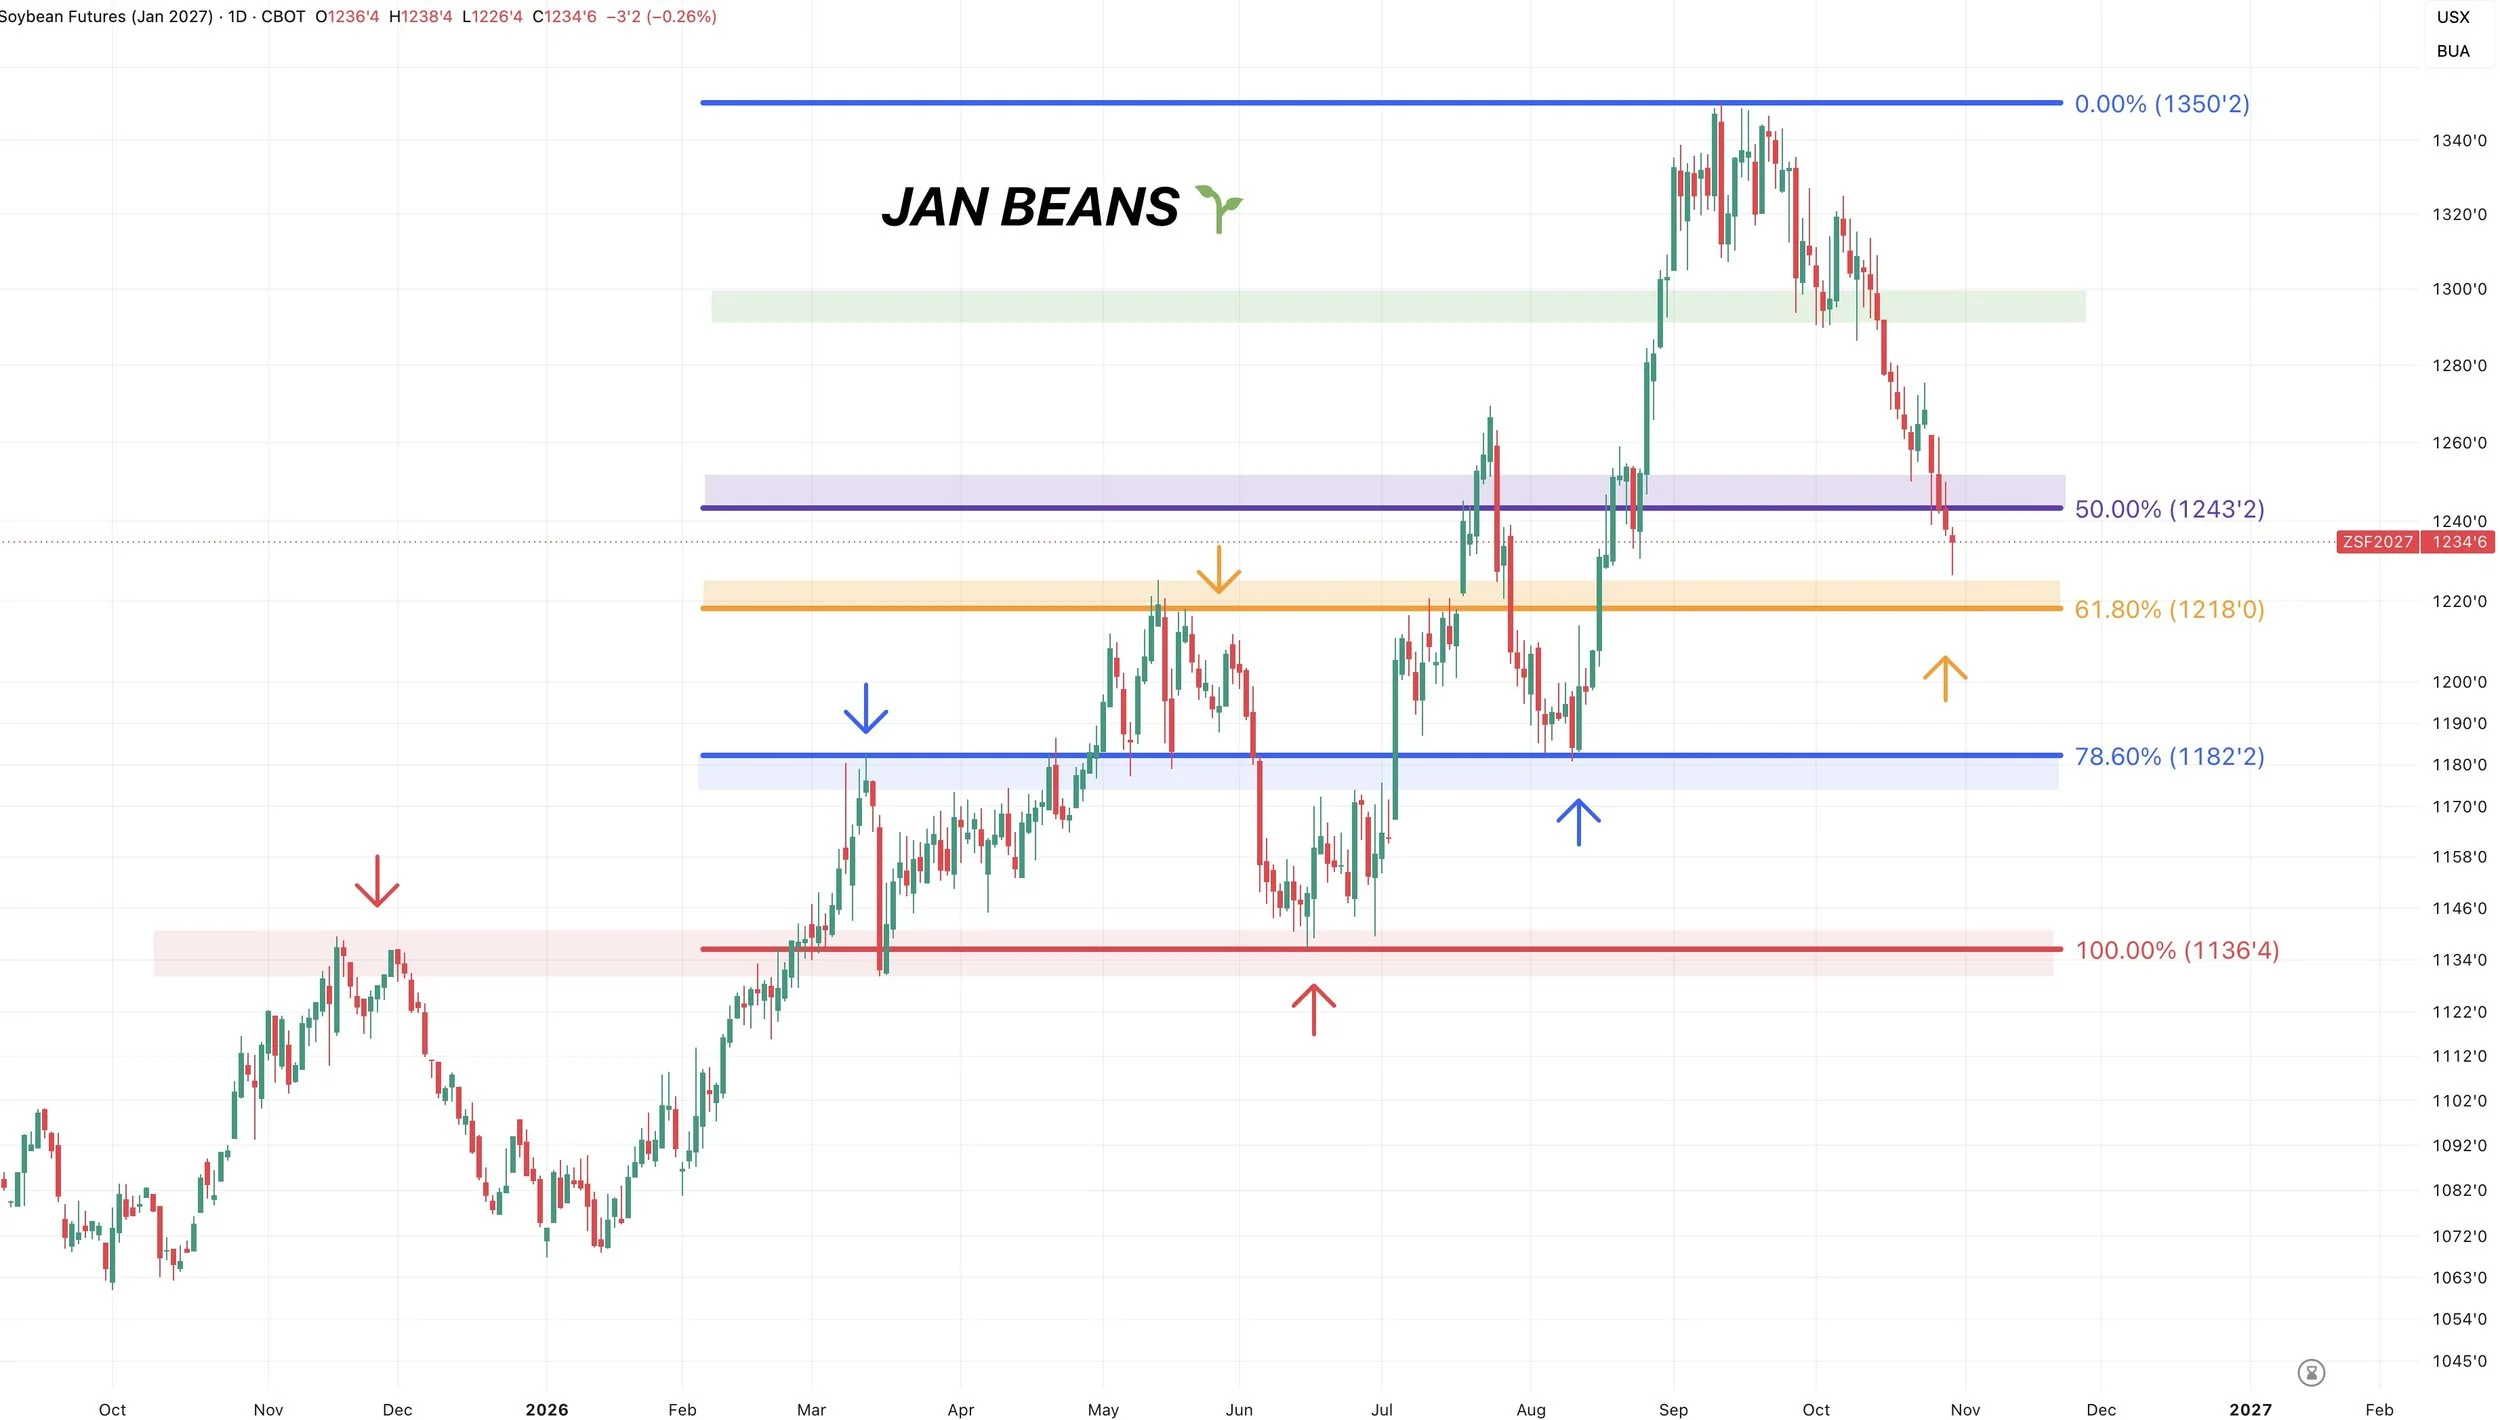
If you move the retracements down to the June lows instead of the August lows, the retracement levels all line up.
So instead of us breaking the 61.8% level on the first chart, we broke the 50% level on this chart.
The next level on the first chart is the 78.6% level. On this chart, it's the 61.8% level.
So the retracements are the exact same no matter what low you draw them down to.
If you notice, all the retracement levels also perfectly line up with past support and ressitance.
But for this chart, that next big point of interest is the 61.8% level around $12.18
That same level tests the May highs and is going to be the next level where we would expect us to find a bottom.
Soybeans have had a very high tendency to turn old resistance into new support.
The August lows came at the March highs.
The June lows came at the November.
We failed to hold the July highs, so maybe we'll be able to turn those May highs into our new lows.
If you did happen to fail that level. The next downside objective would be around $11.80. Which would be the next retracement, and the August lows.
But for now, we are approaching an area where finding a bottom would make sense. Between here and those May highs.
RSI:
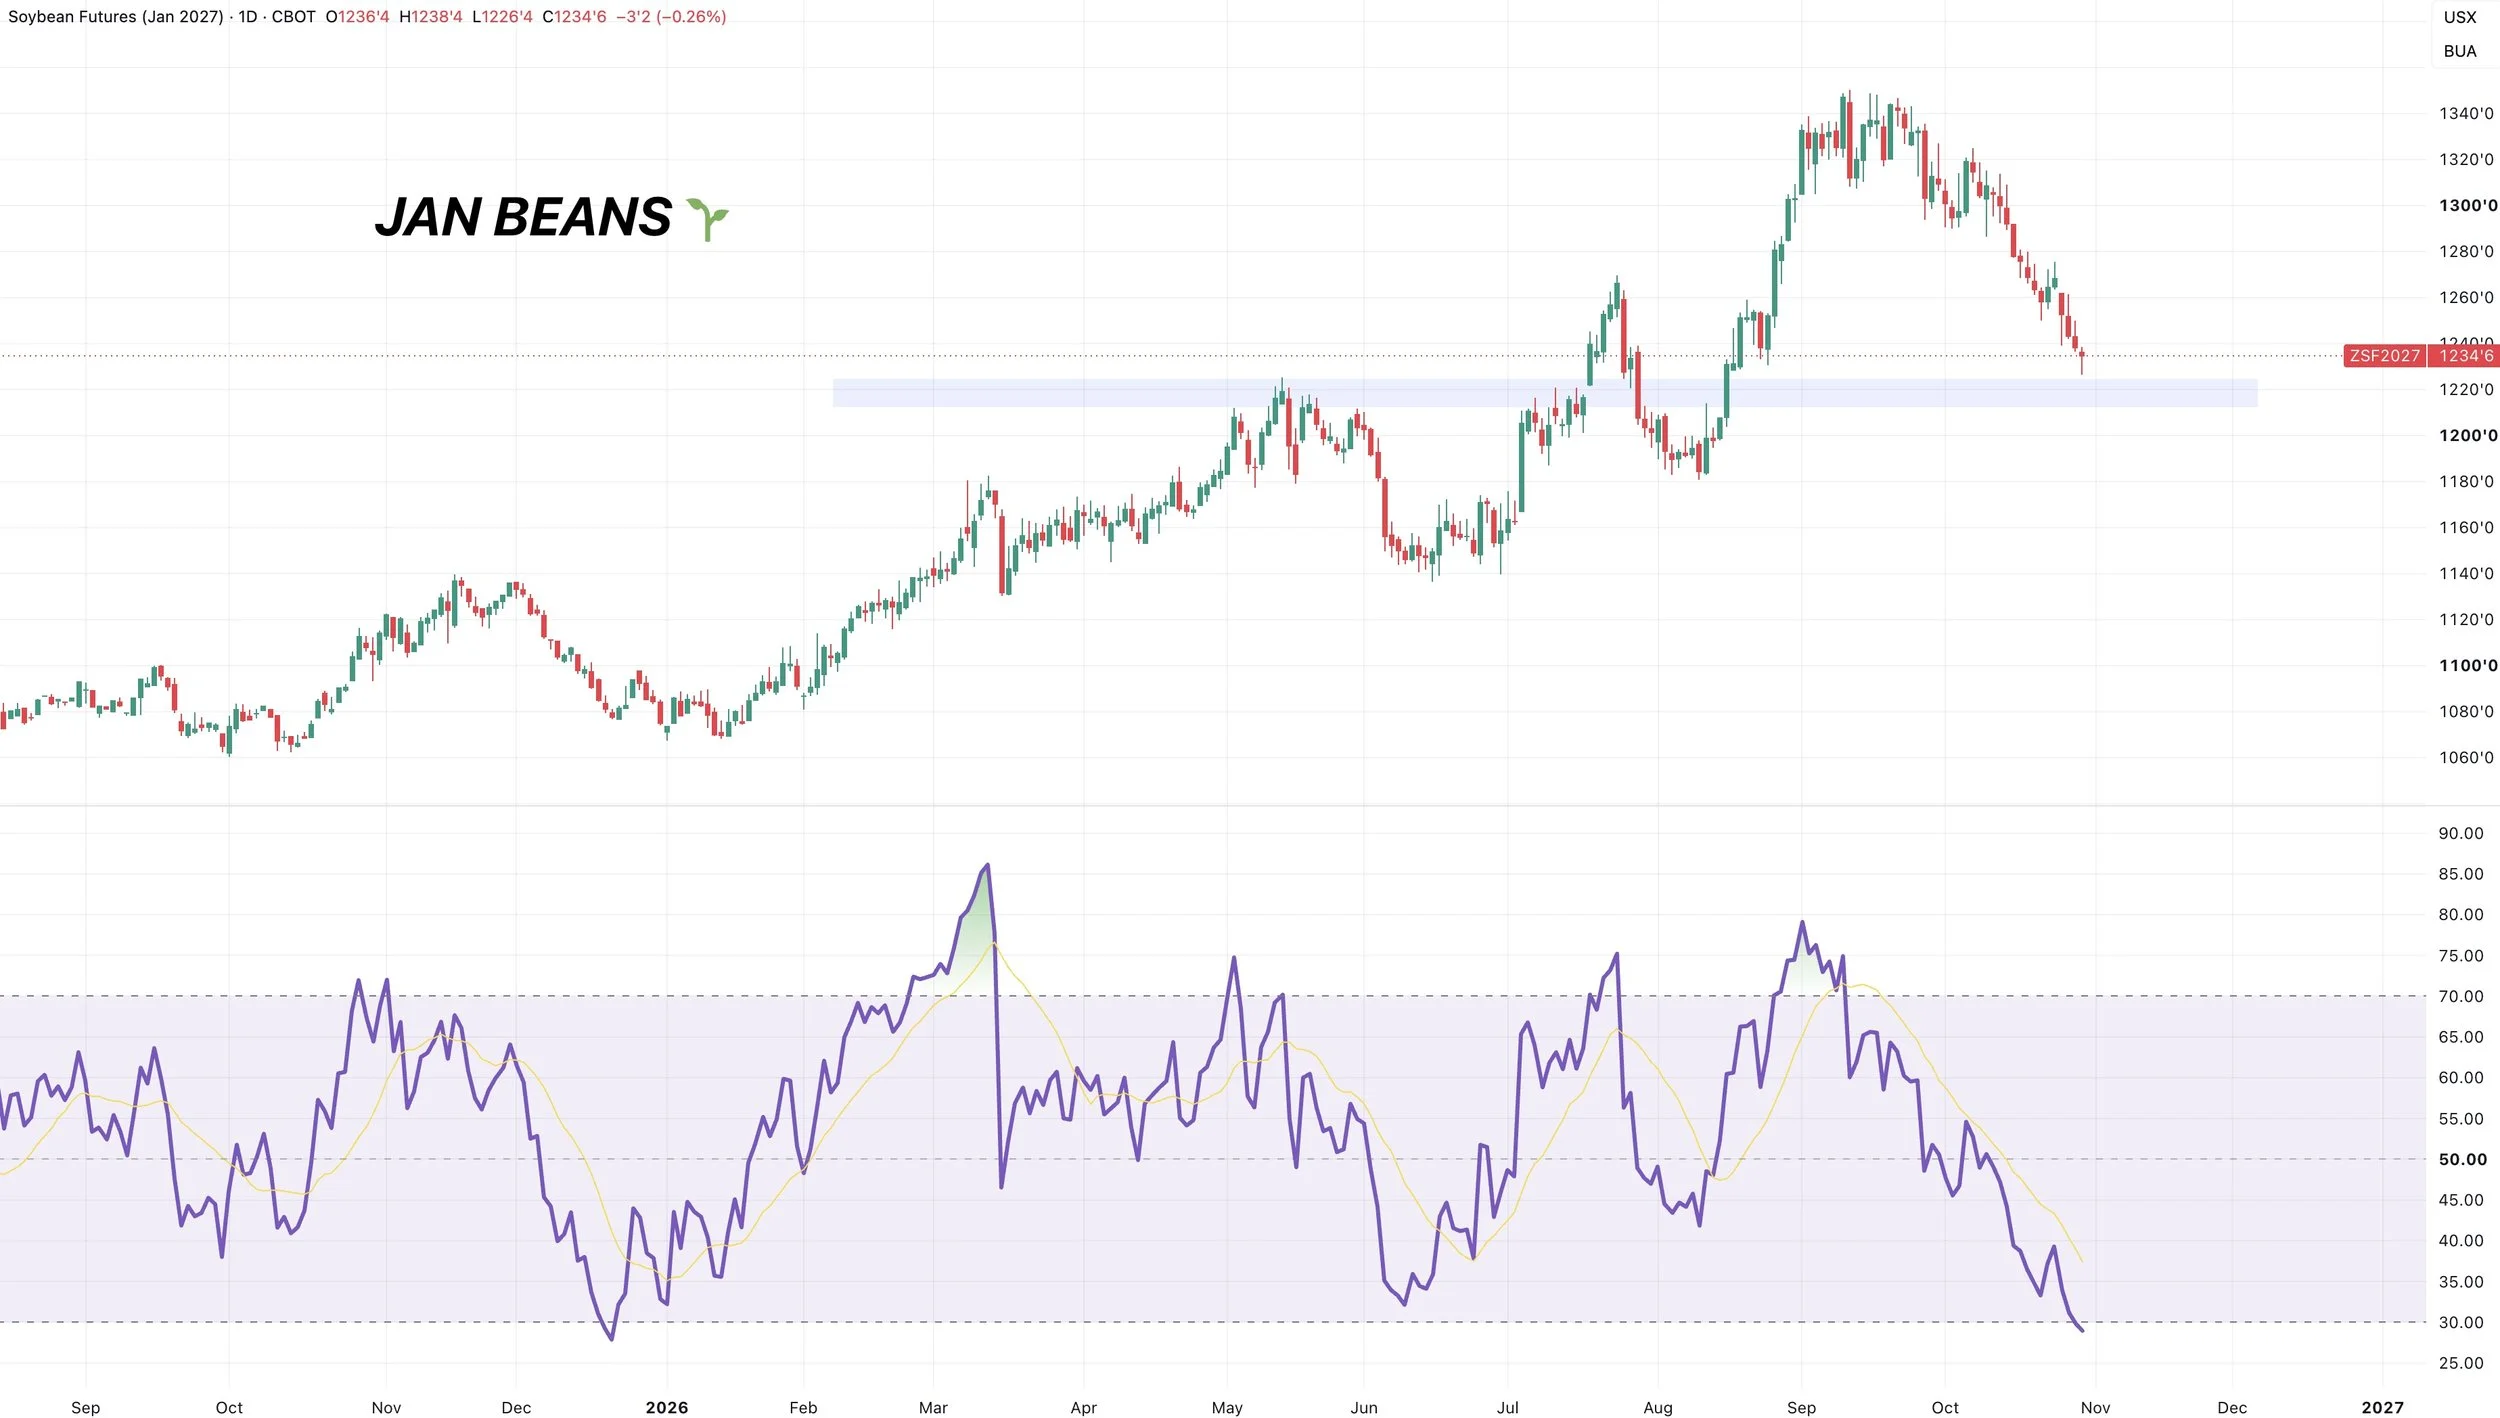
Soybeans are starting to enter into very oversold territory as well.
Not to the extent of corn or wheat, but this is the most oversold soybeans new crop has been this year.
This doesn’t mean the bottom is in today, but it gives us more reason to think we could potentially carve out some lows between here and those May highs.
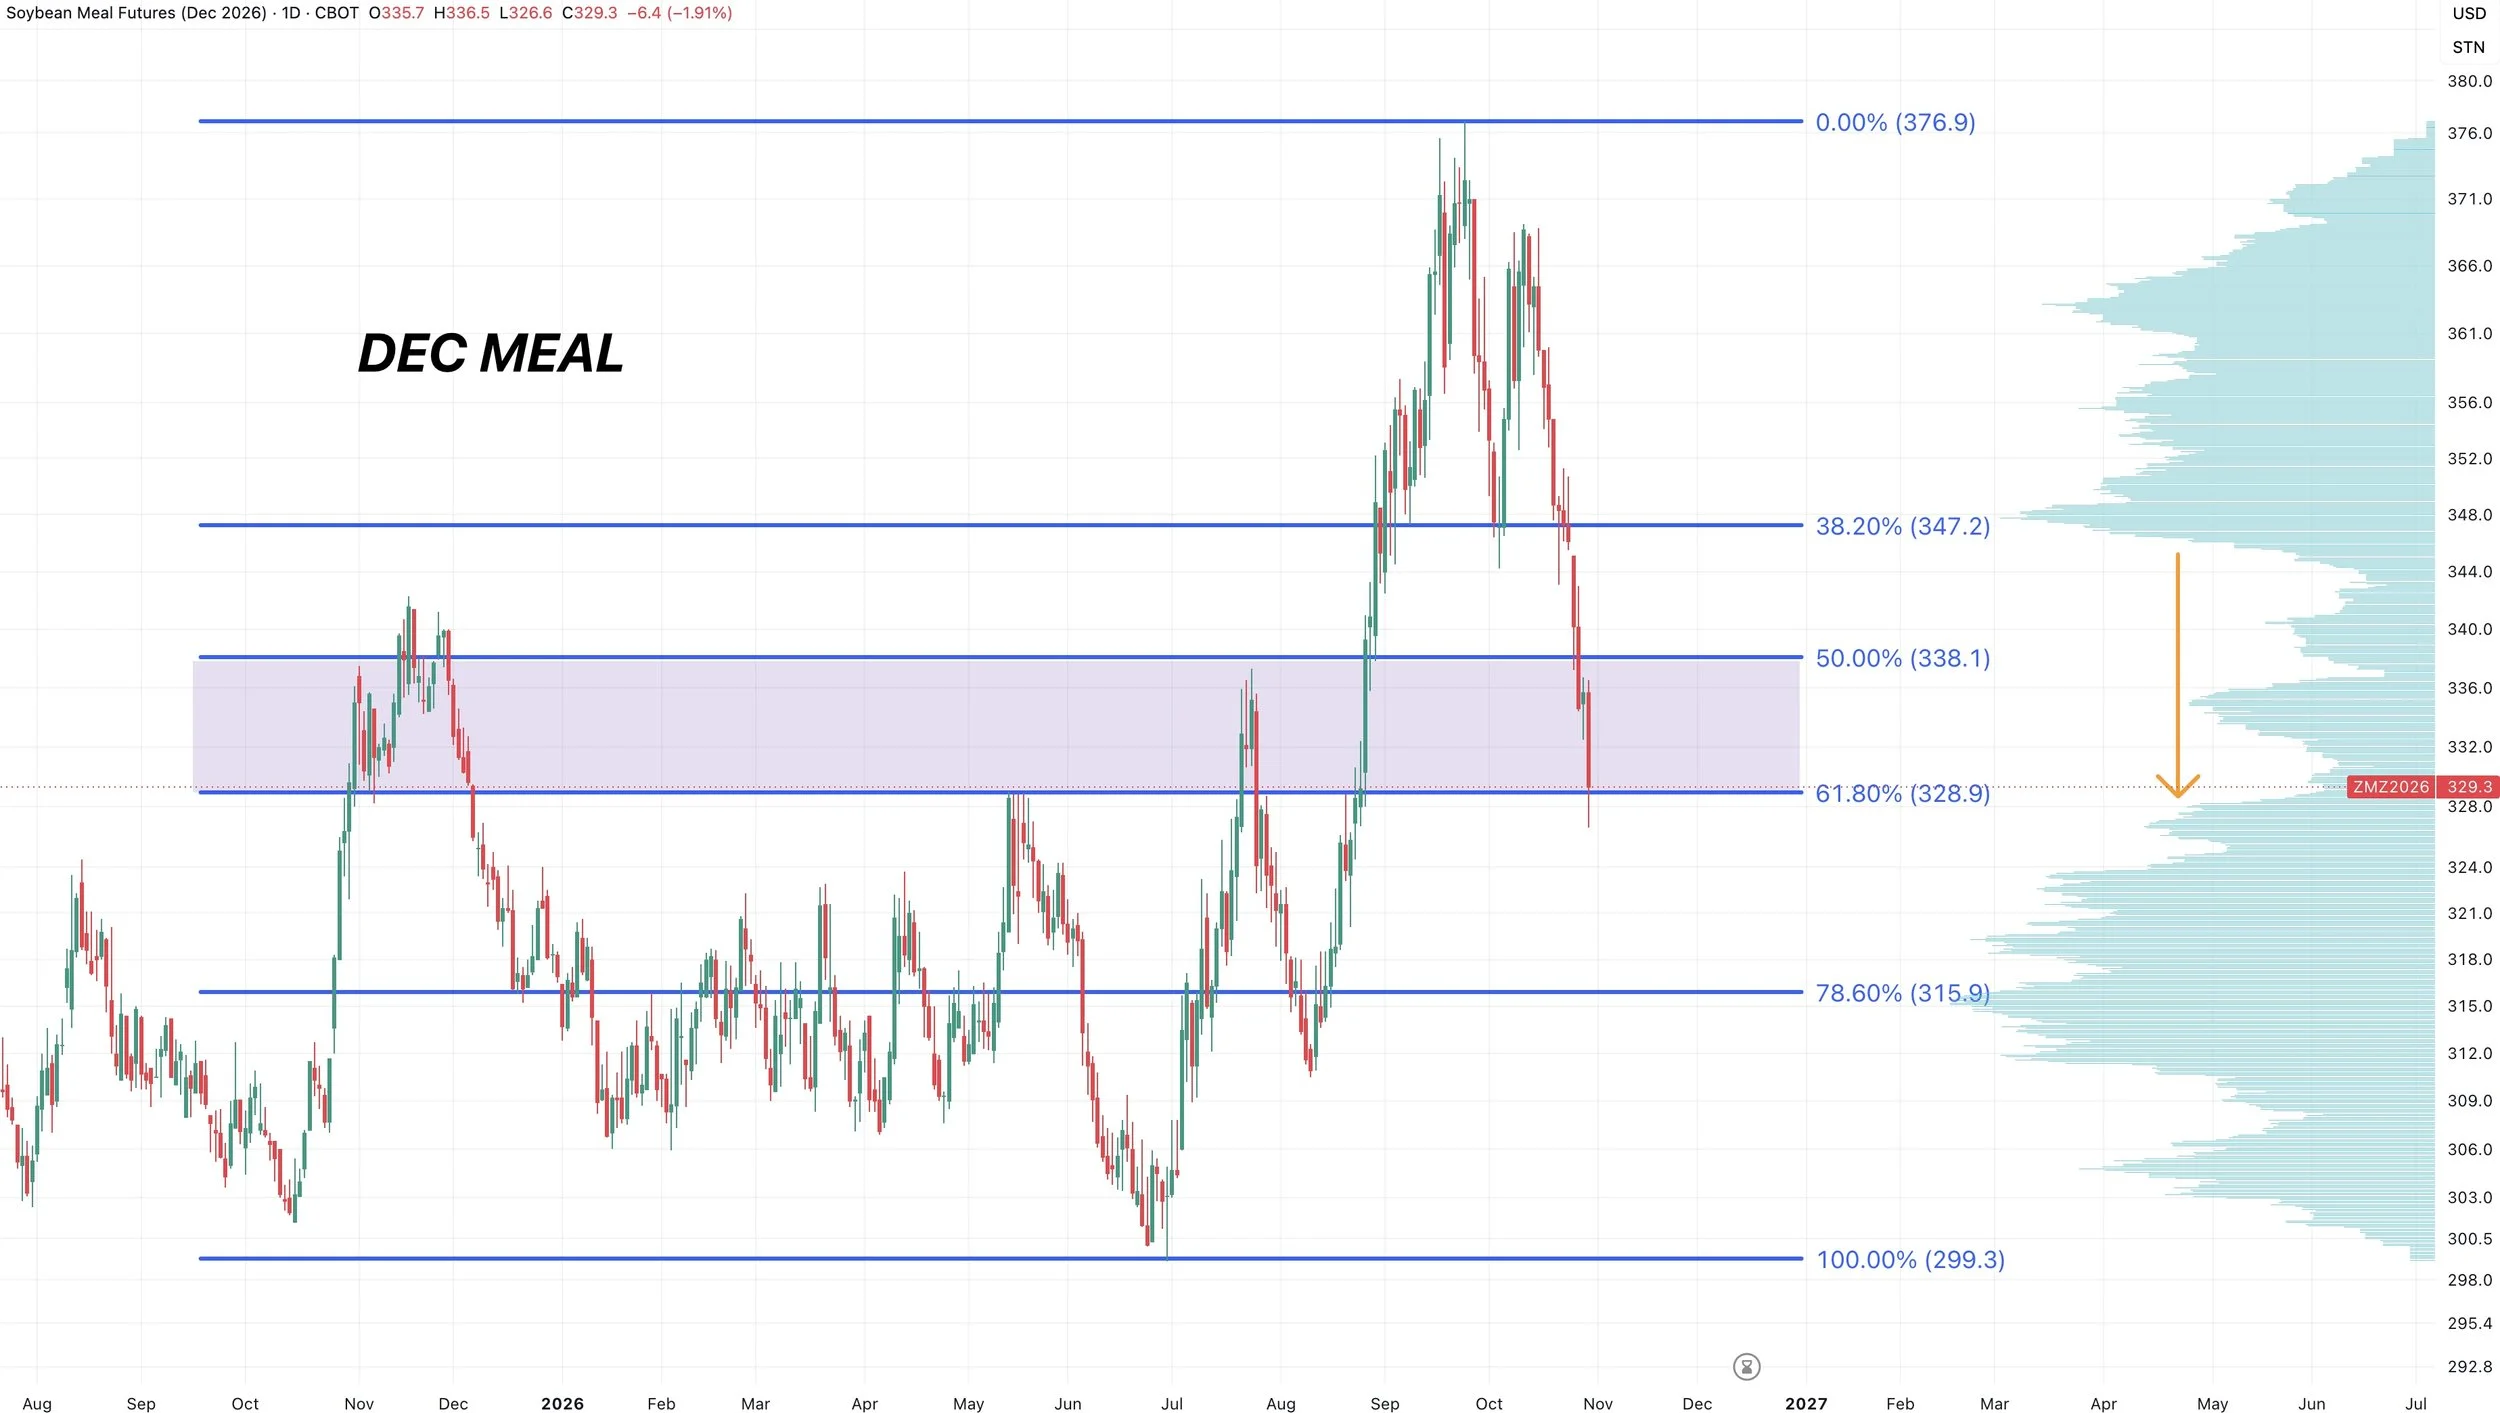
Dec Meal Chart:
The entire soy complex is actually sitting at some key levels.
Meal is sitting at a big spot.
We've gave back 61.8% of the contract highs down to the contract lows.
This same level is re-testing the prior highs for the year.
It's also where volume picks back up after slicing through that volume gap.
Bulls would like this spot to hold or it could open up further downside.
Bean Oil:
Bean oil also at a very important level.
We have this support that we've held all year long.
Today bean oil actually broke below this support, but then we reversed and closed higher.
If we are able to follow this up with some strength, this could be considered a possible bear trap. However, you need follow through.
If bean oil starts to break below this level, there is not a lot of support holding up this market. Which would be a concern.

Wheat
Fundamentals:
Like we talked about, demand for wheat is finally starting to show some signs of life.
It's starting to feel like wheat has become undervalued here long term.
There is talk that China is interested in buying wheat, although nothing has been confirmed that they are going to.
This market really has zero premium built into it.
The market still doesn’t care about the Black Sea because it hasn’t led to extra business anyways.
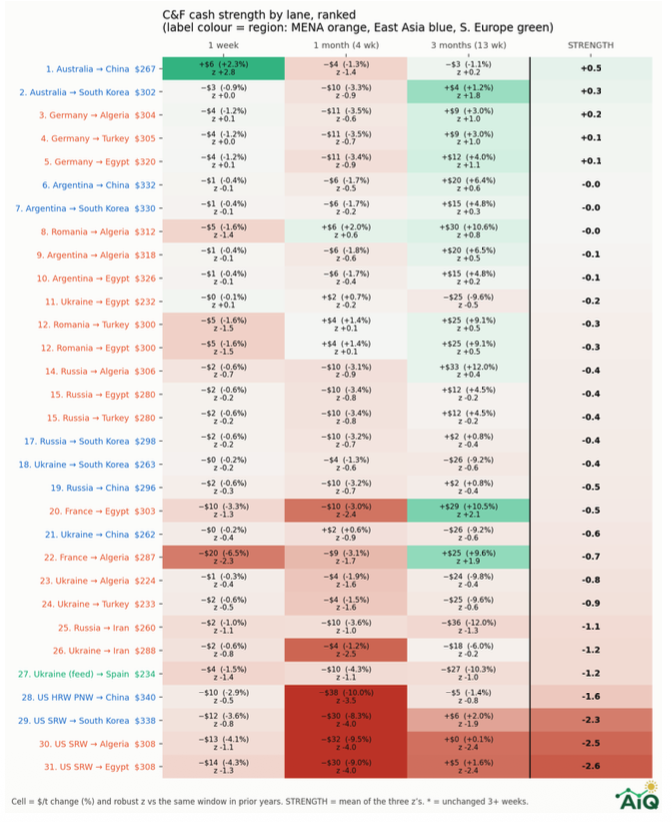
However, here is a nice chart from Nico AiQ over on X.
This chart shows physical wheat prices and their routes.
Currently, the US wheat market has became way cheaper and more competitive than it was. The graphic may be hard to read as it's not super high quality, but it shows how much US prices have fallen vs others.
Wheat is simply becoming economically attractive. As it's getting cheaper relative to others.
Prices are basically getting cheap enough to attract buyers.
Implied Volatility:
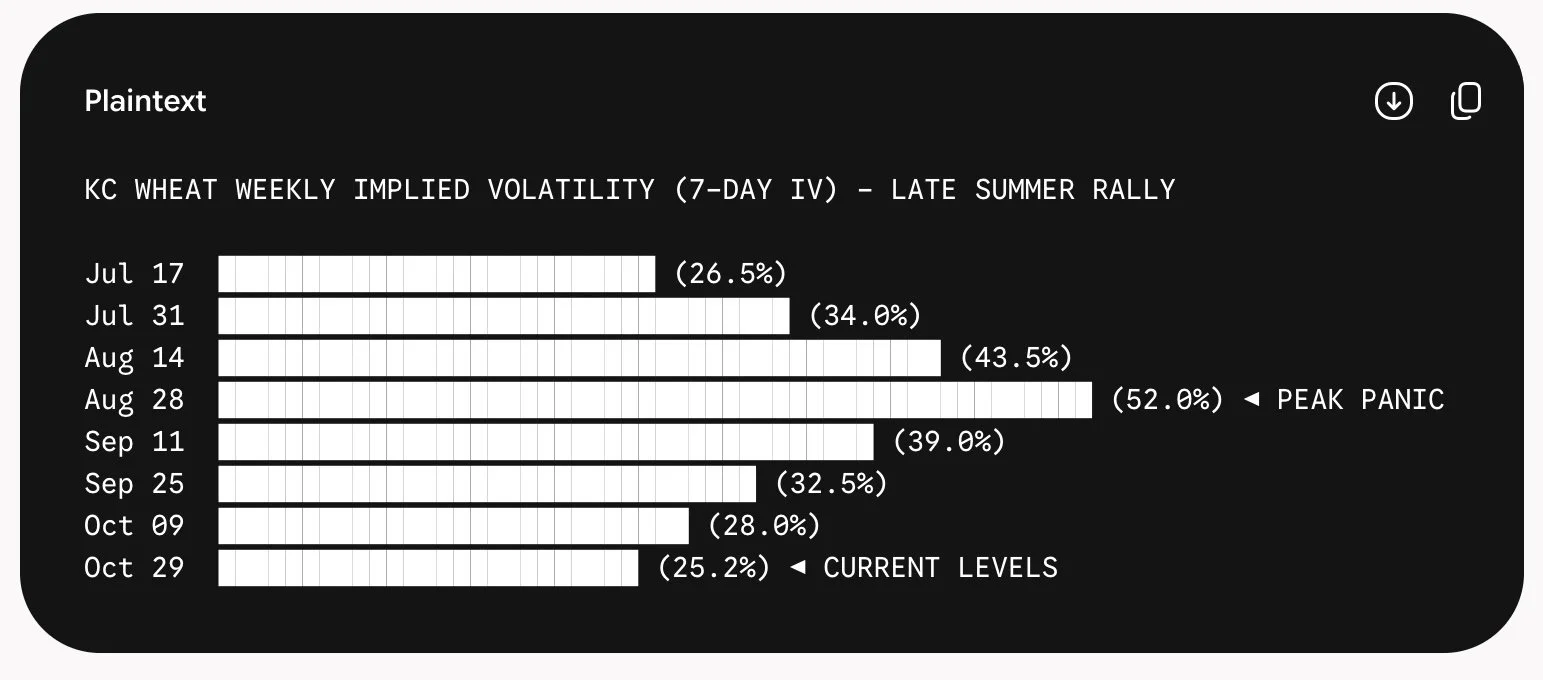
One other thing I wanted to touch on was implied volatility. Essentially, it's how expensive or inexpensive options are. As when the options price in more volatility, they become more expensive and vice versa.
This chart shows KC wheat's implied volatility over the last several months.
It peaked at 52%.
It's now at 25%.
The IV has completely dwindled relative to what it was.
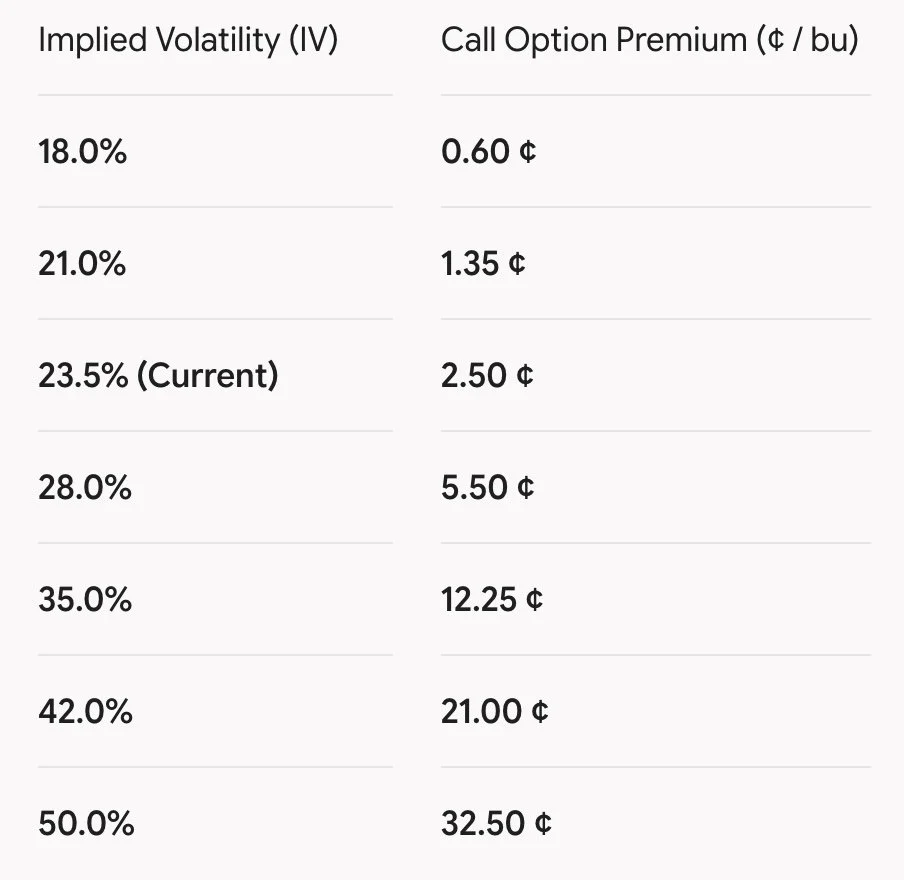
Here is an example on how IV impacts the price of options.
This one shows a KC wheat call that is $1.50 out of the money.
Right now it's 2.5 cents.
As implied volatility goes higher, so does the cost of an option.
For example, when implied volatility was way higher a few months ago, call options way out of the money were a lot more expensive.
The market has wiped away the premium.
This does not mean everyone should just go out an buy wheat calls.
But for some operations, if you want upside exposure, it might make sense to own the cheap volatility. Just something you can consider given they've become cheap.
Give us a call if you'd like to discuss if this is something you and your operation should be looking at.
Office: (806)484-1214
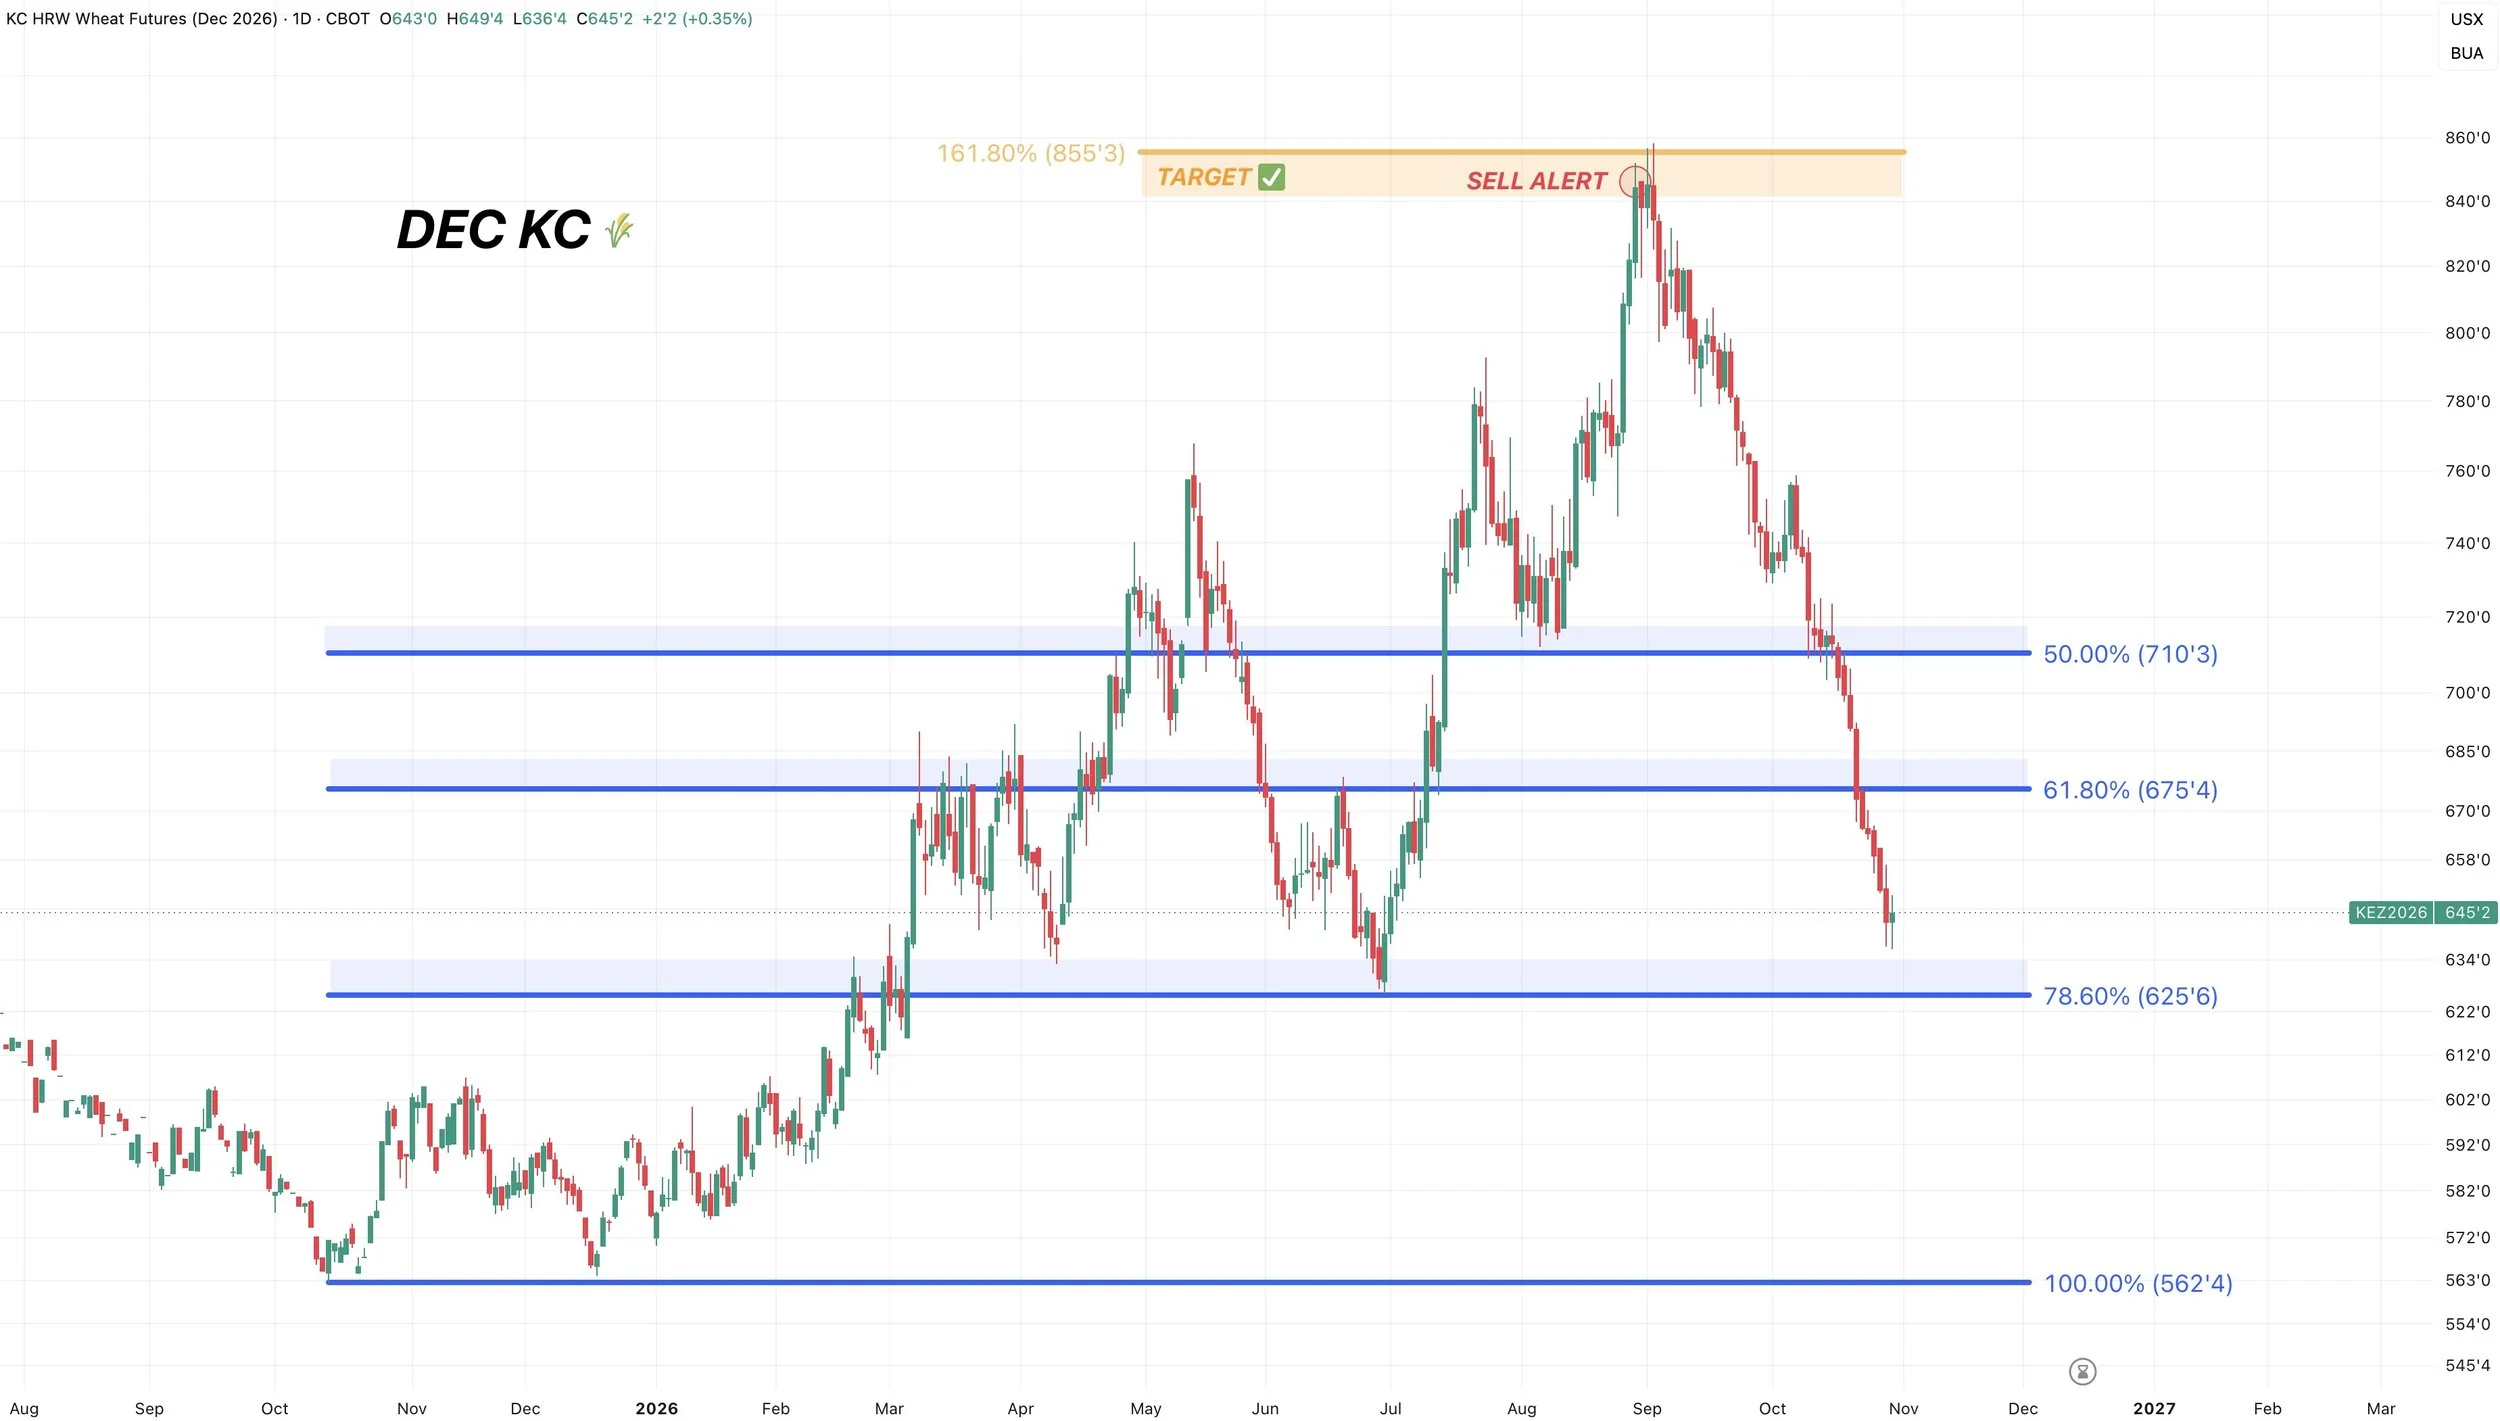
Dec KC Chart:
I'll keep it simple.
You are sitting at one of your last supports between you and contract lows.
That's the last retracement level.
It's the lows from spring and June.
So it would be a convenient time for this wheat market to at the very least stop the bleeding.
But so far, still no confirmation of a complete bottom.
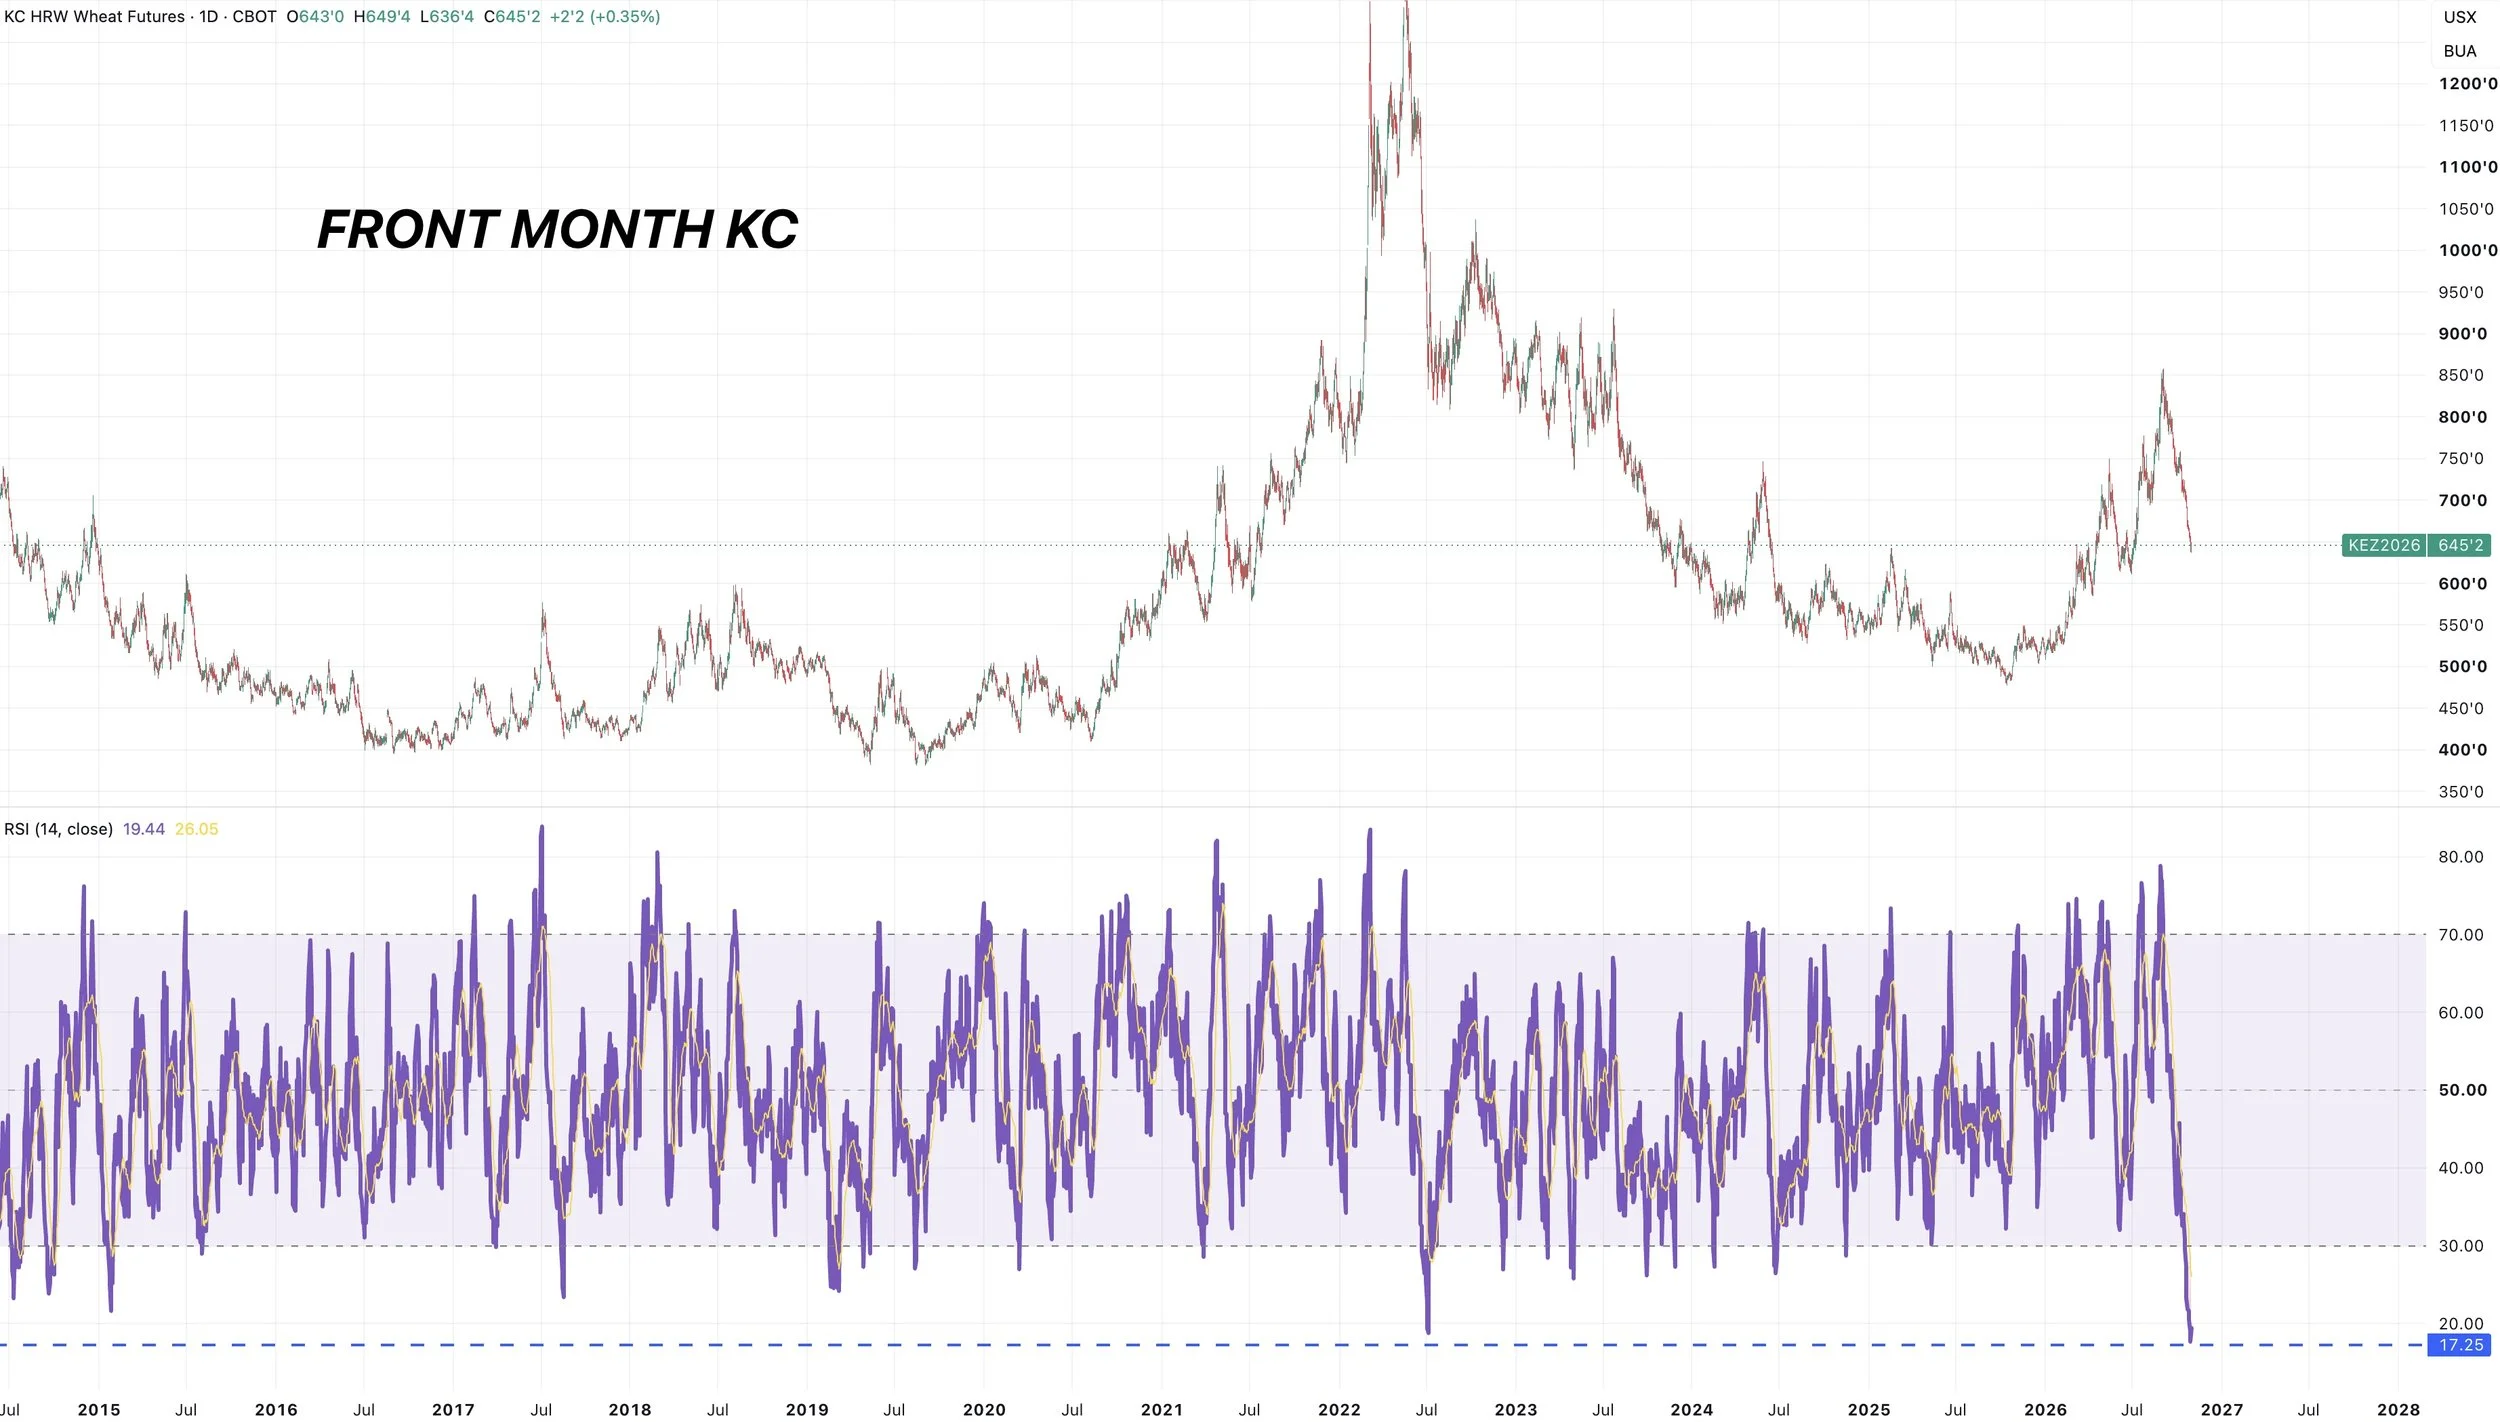
Wheat is incredibly oversold.
The front month contract is the most oversold it's been in at least the last decade.
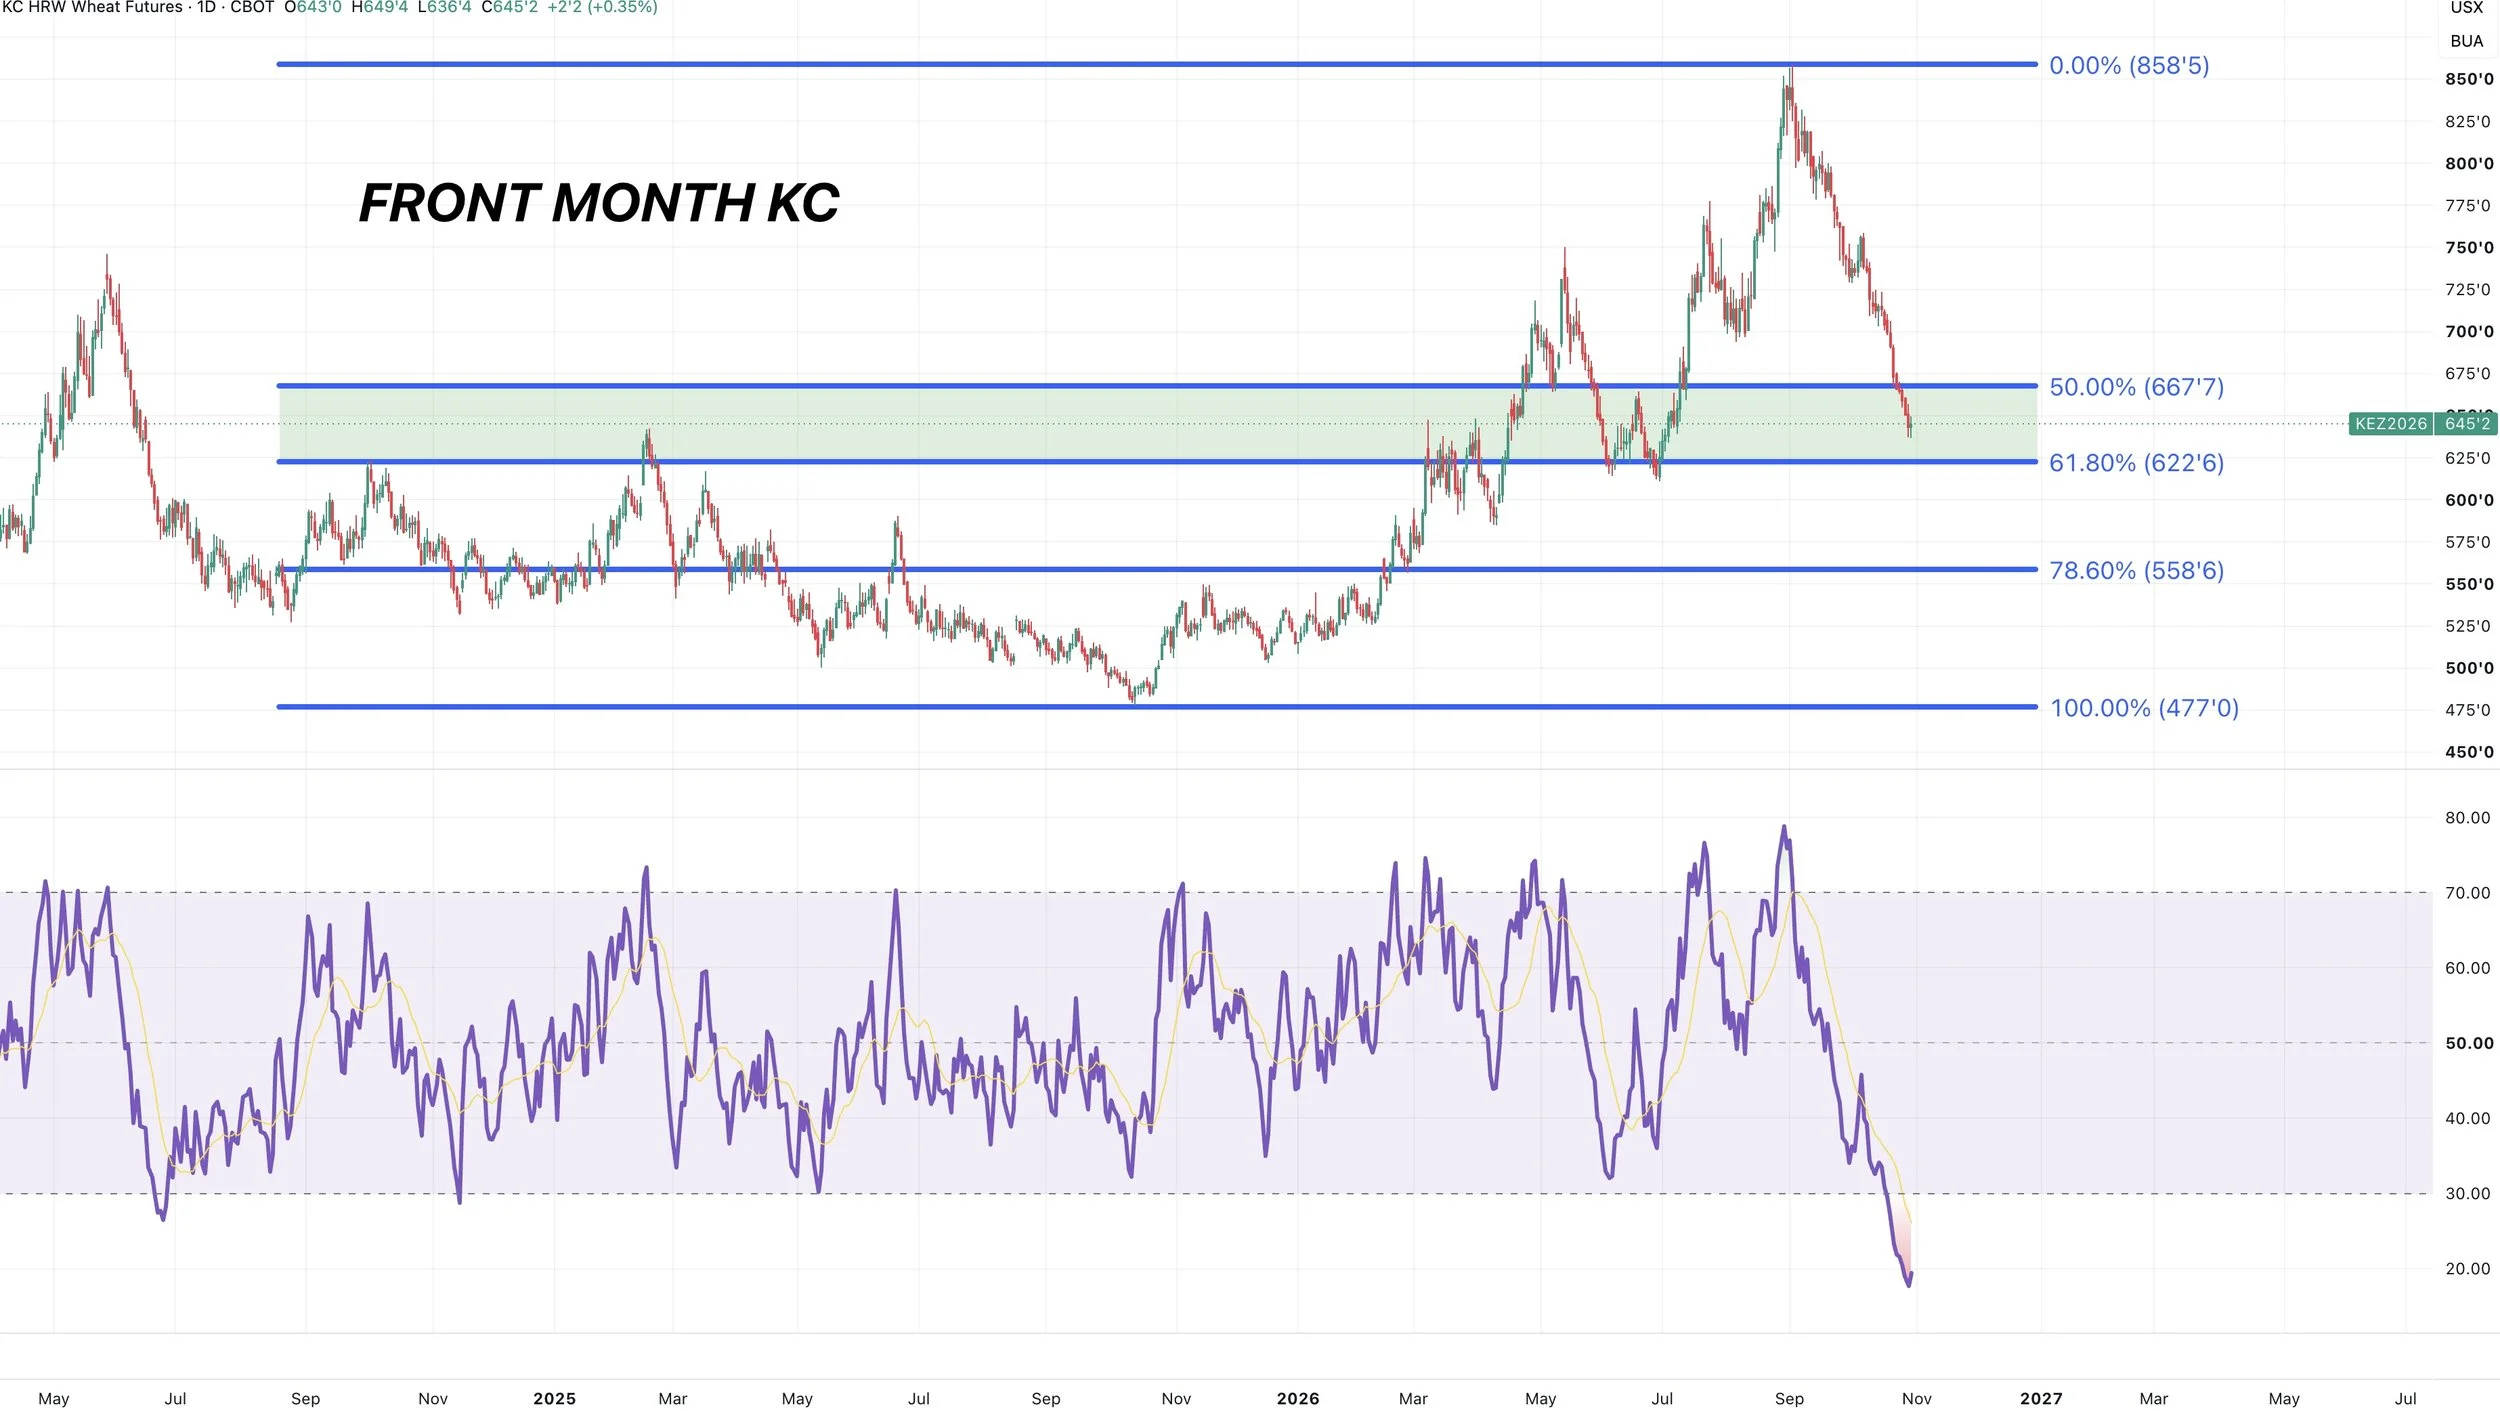
Front Month KC:
On the front month contract, KC is sitting right in the golden zone from those highs all the way down to the bear market lows.
If this market is still in an overall uptrend, this would be a big area we'd typically want to see a market hold.
You are also re-testing several prior highs from the last two years.
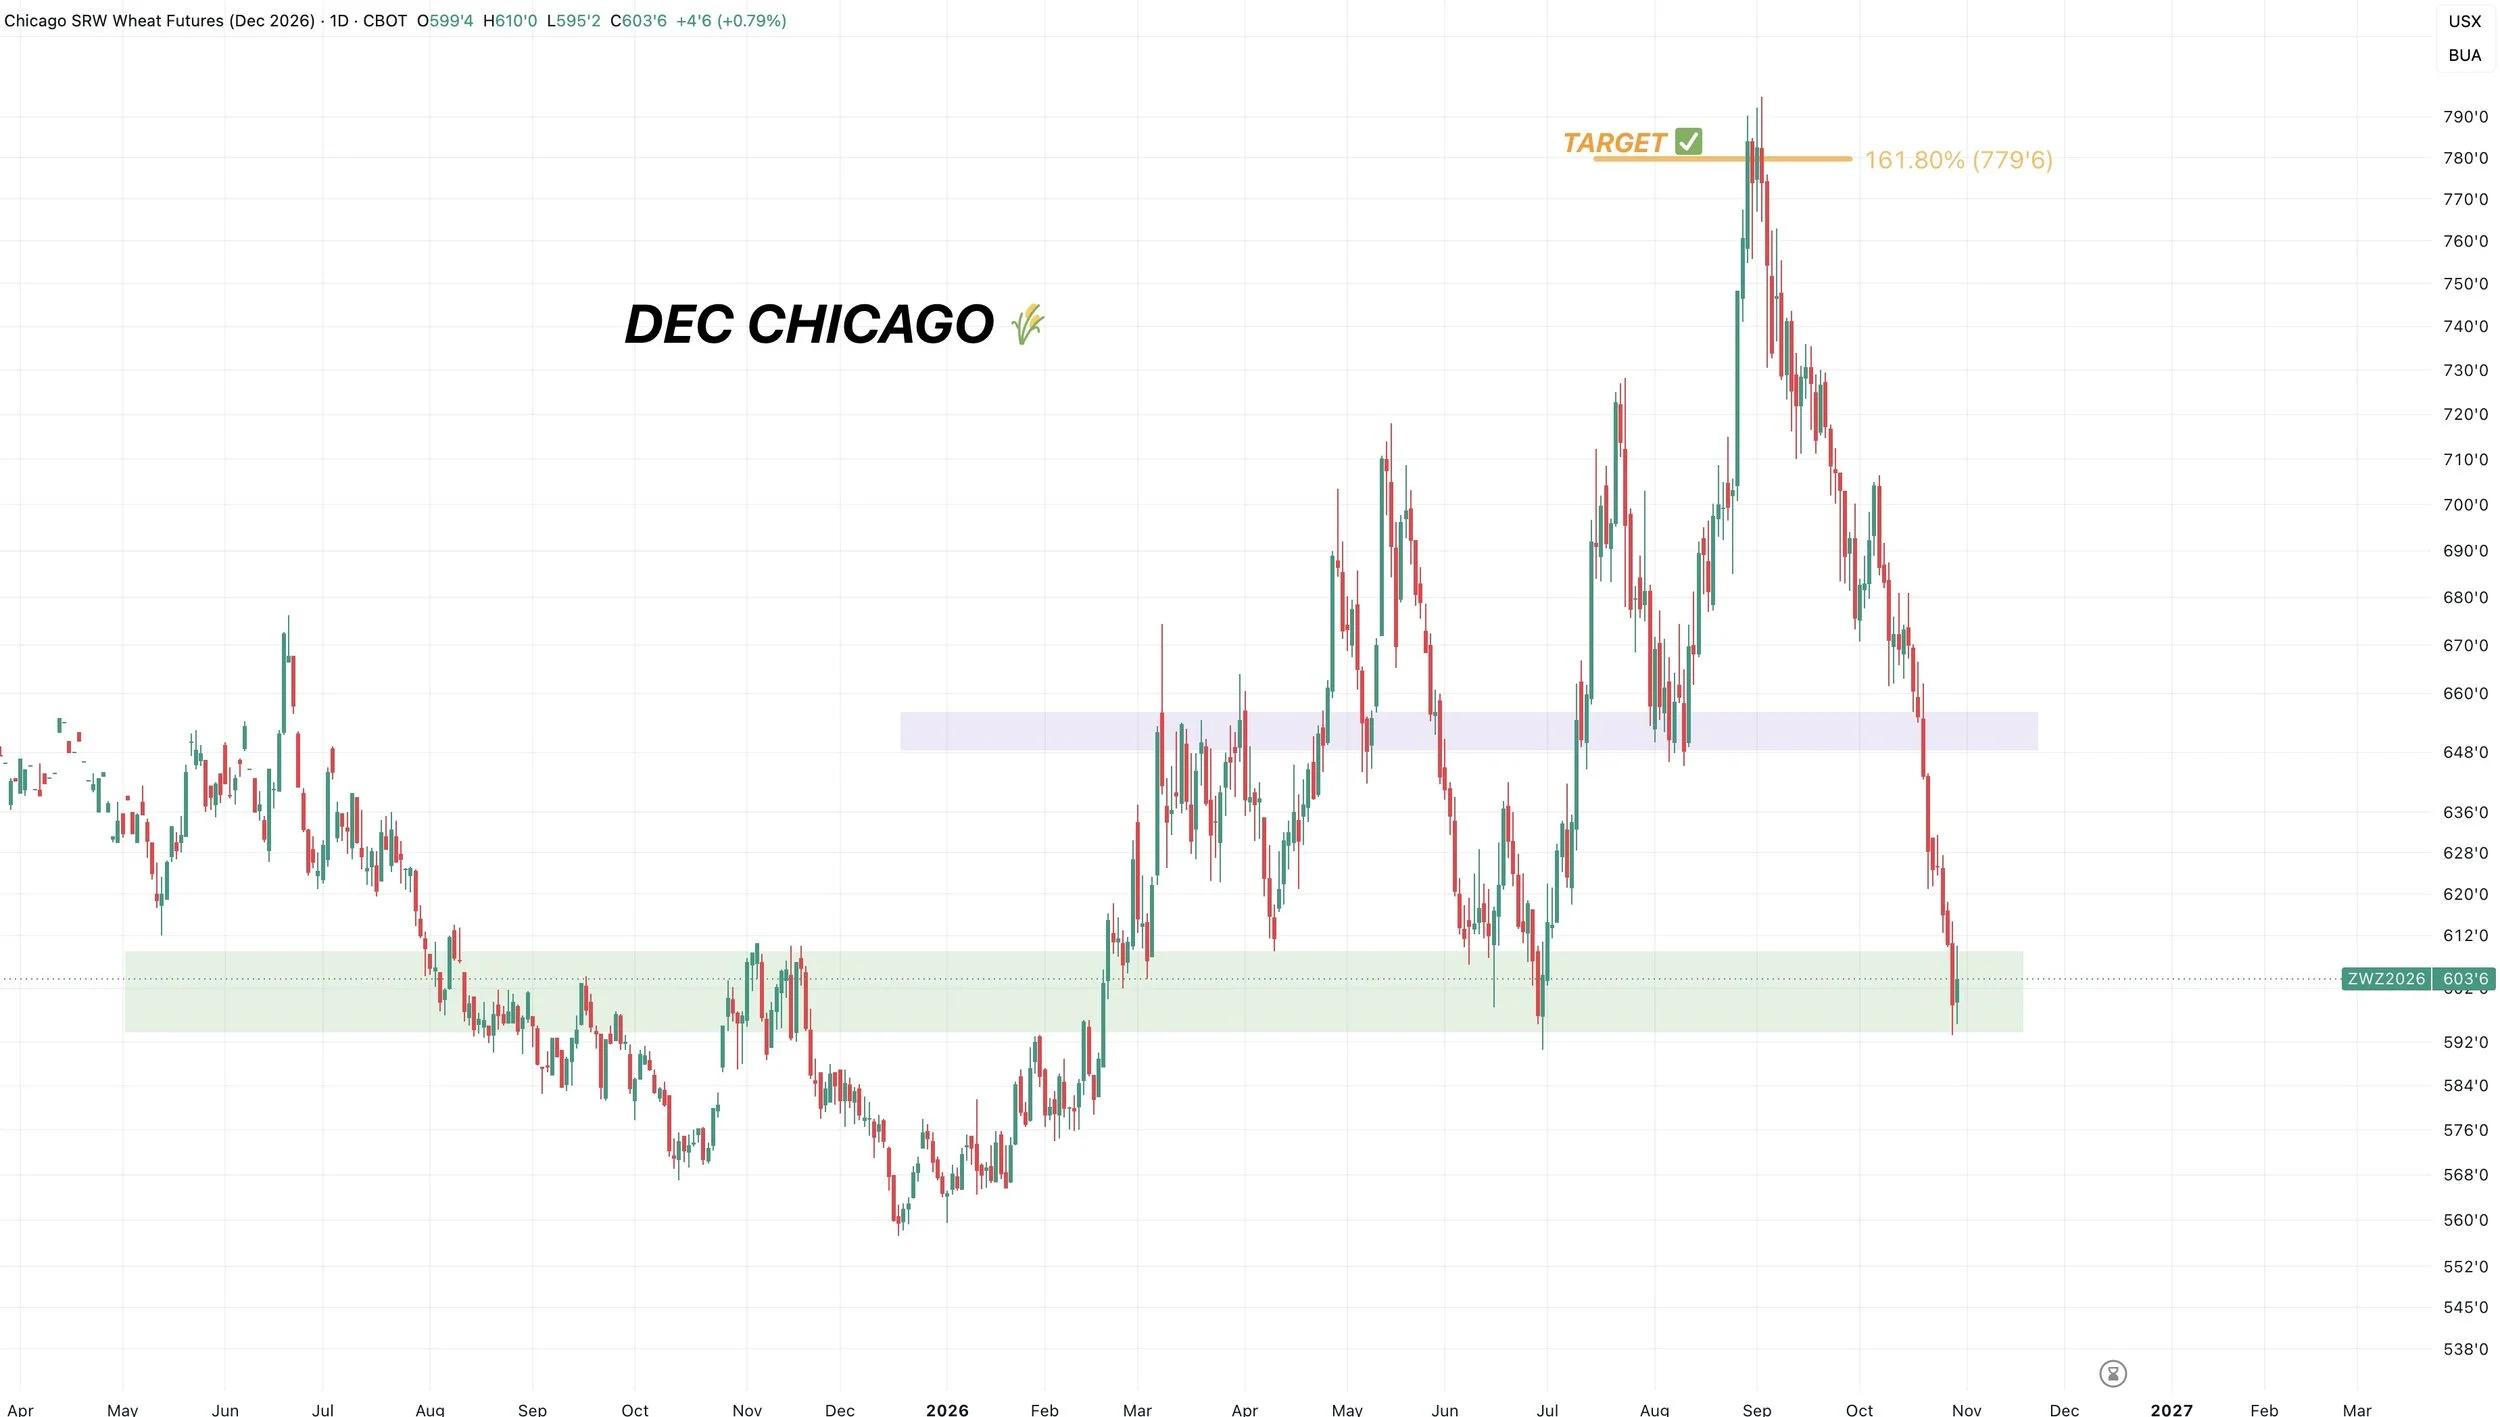
Dec Chicago Wheat Chart:
Chicago also sitting at virtually their last support here.
You have those June lows and highs from late last year.
Bulls would really like to find some life.
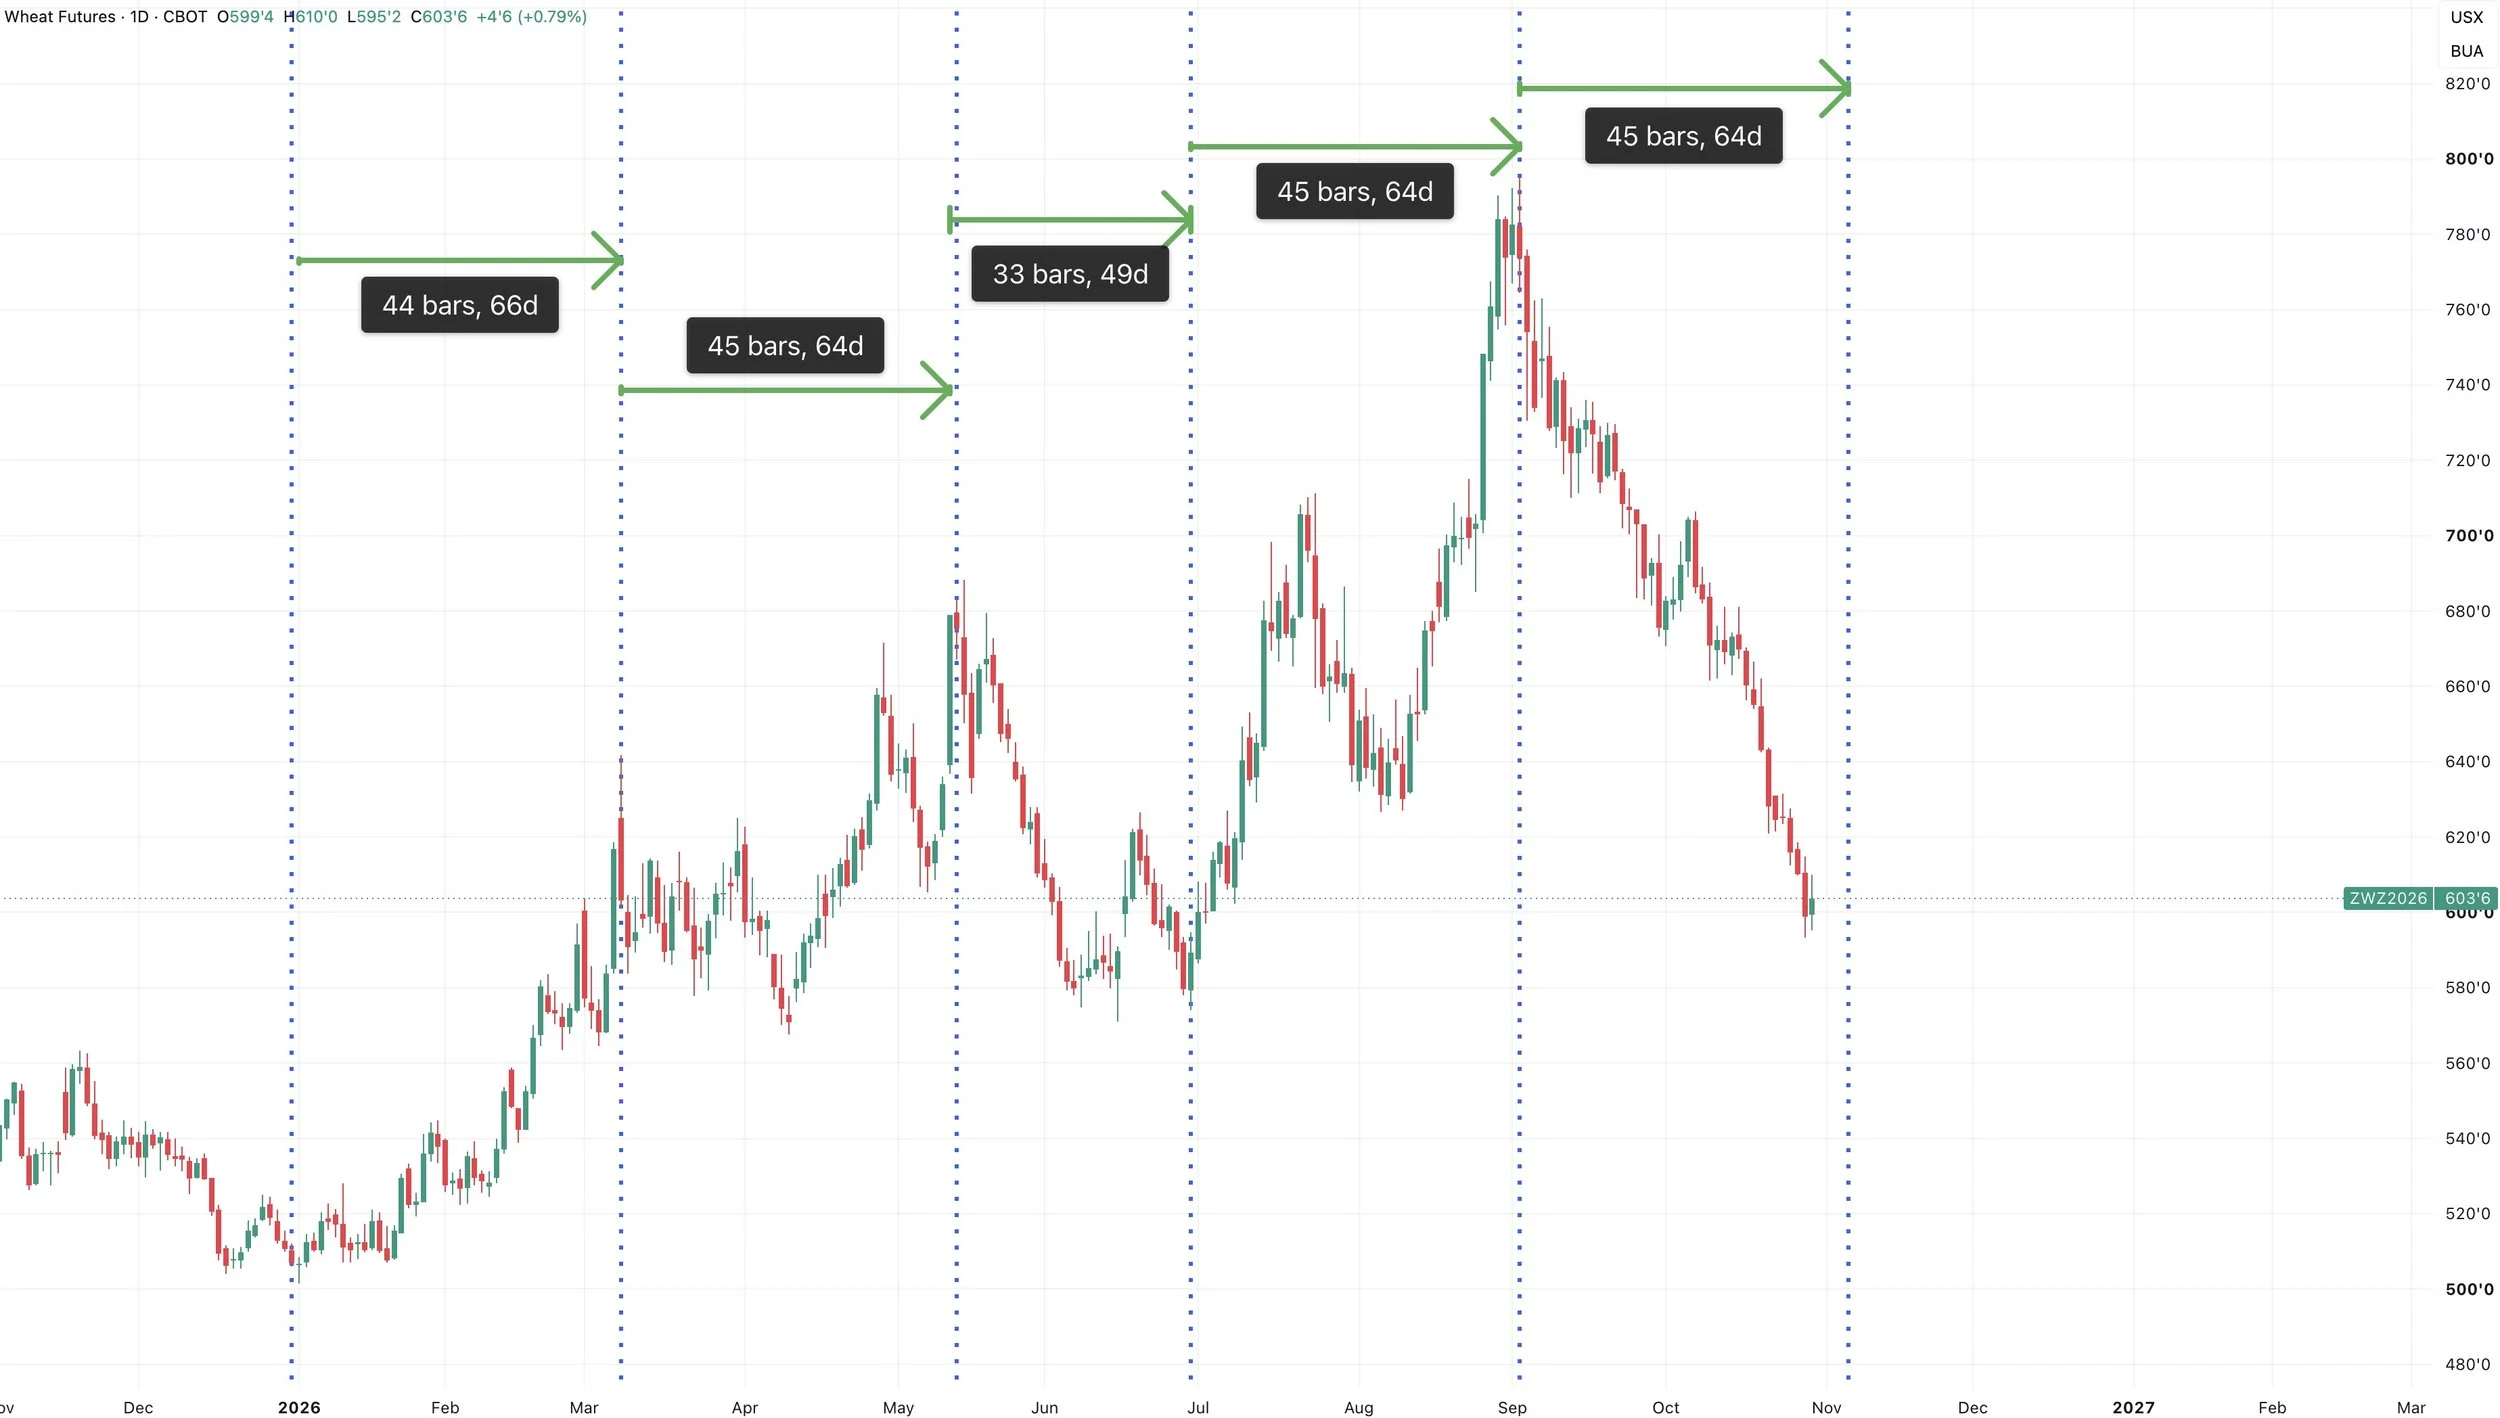
2-Month Pivots?
I talked about this earlier this week.
Roughly every 45 trading days there has been a pivot in the wheat market.
If this holds true again, we are nearing the next 2-month pivot.
This might not mean anything at all, but it is hard to ignore the timing we've seen this year.
Cattle
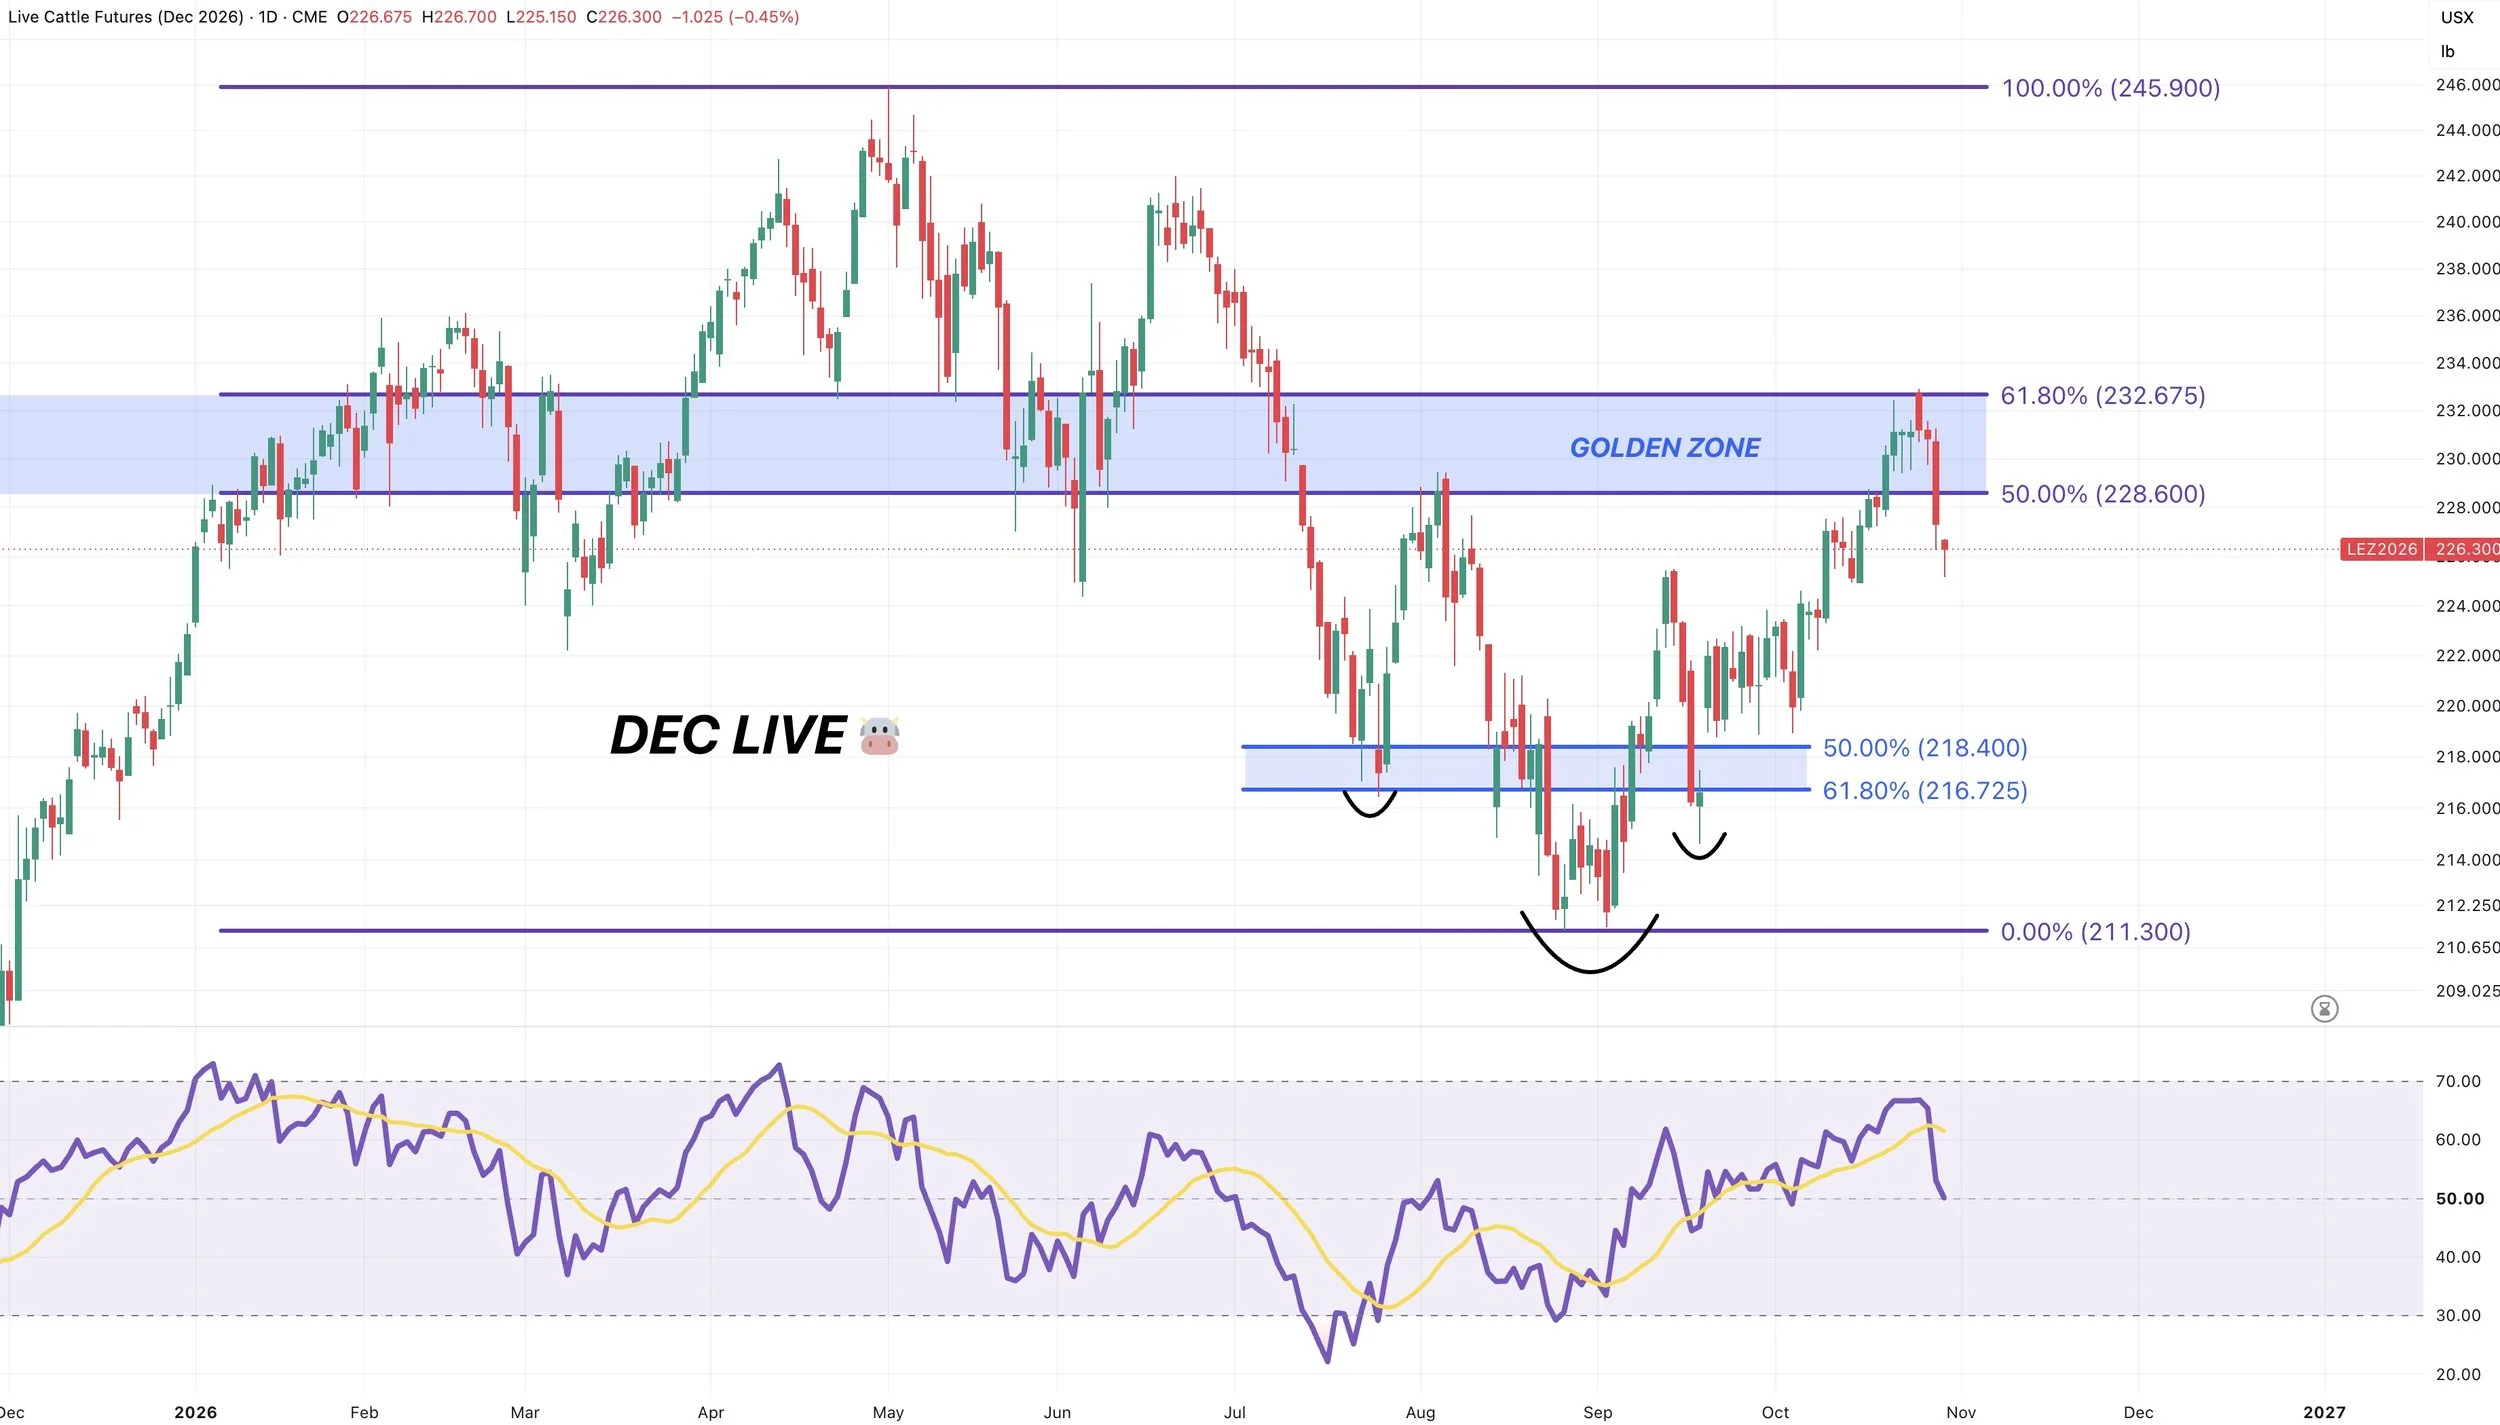
Dec Live:
I had been pretty vocal about protecting the rally in cattle the last week or two.
Live cattle perfectly rejected the 61.8% level up to the contract highs.
A very common level to stall if this market is still in a broader downtrend.
We were also getting pretty overbought. The last few times this market reached this level of overbought, it proved to be an opportunity.
Nov Feeders Chart:
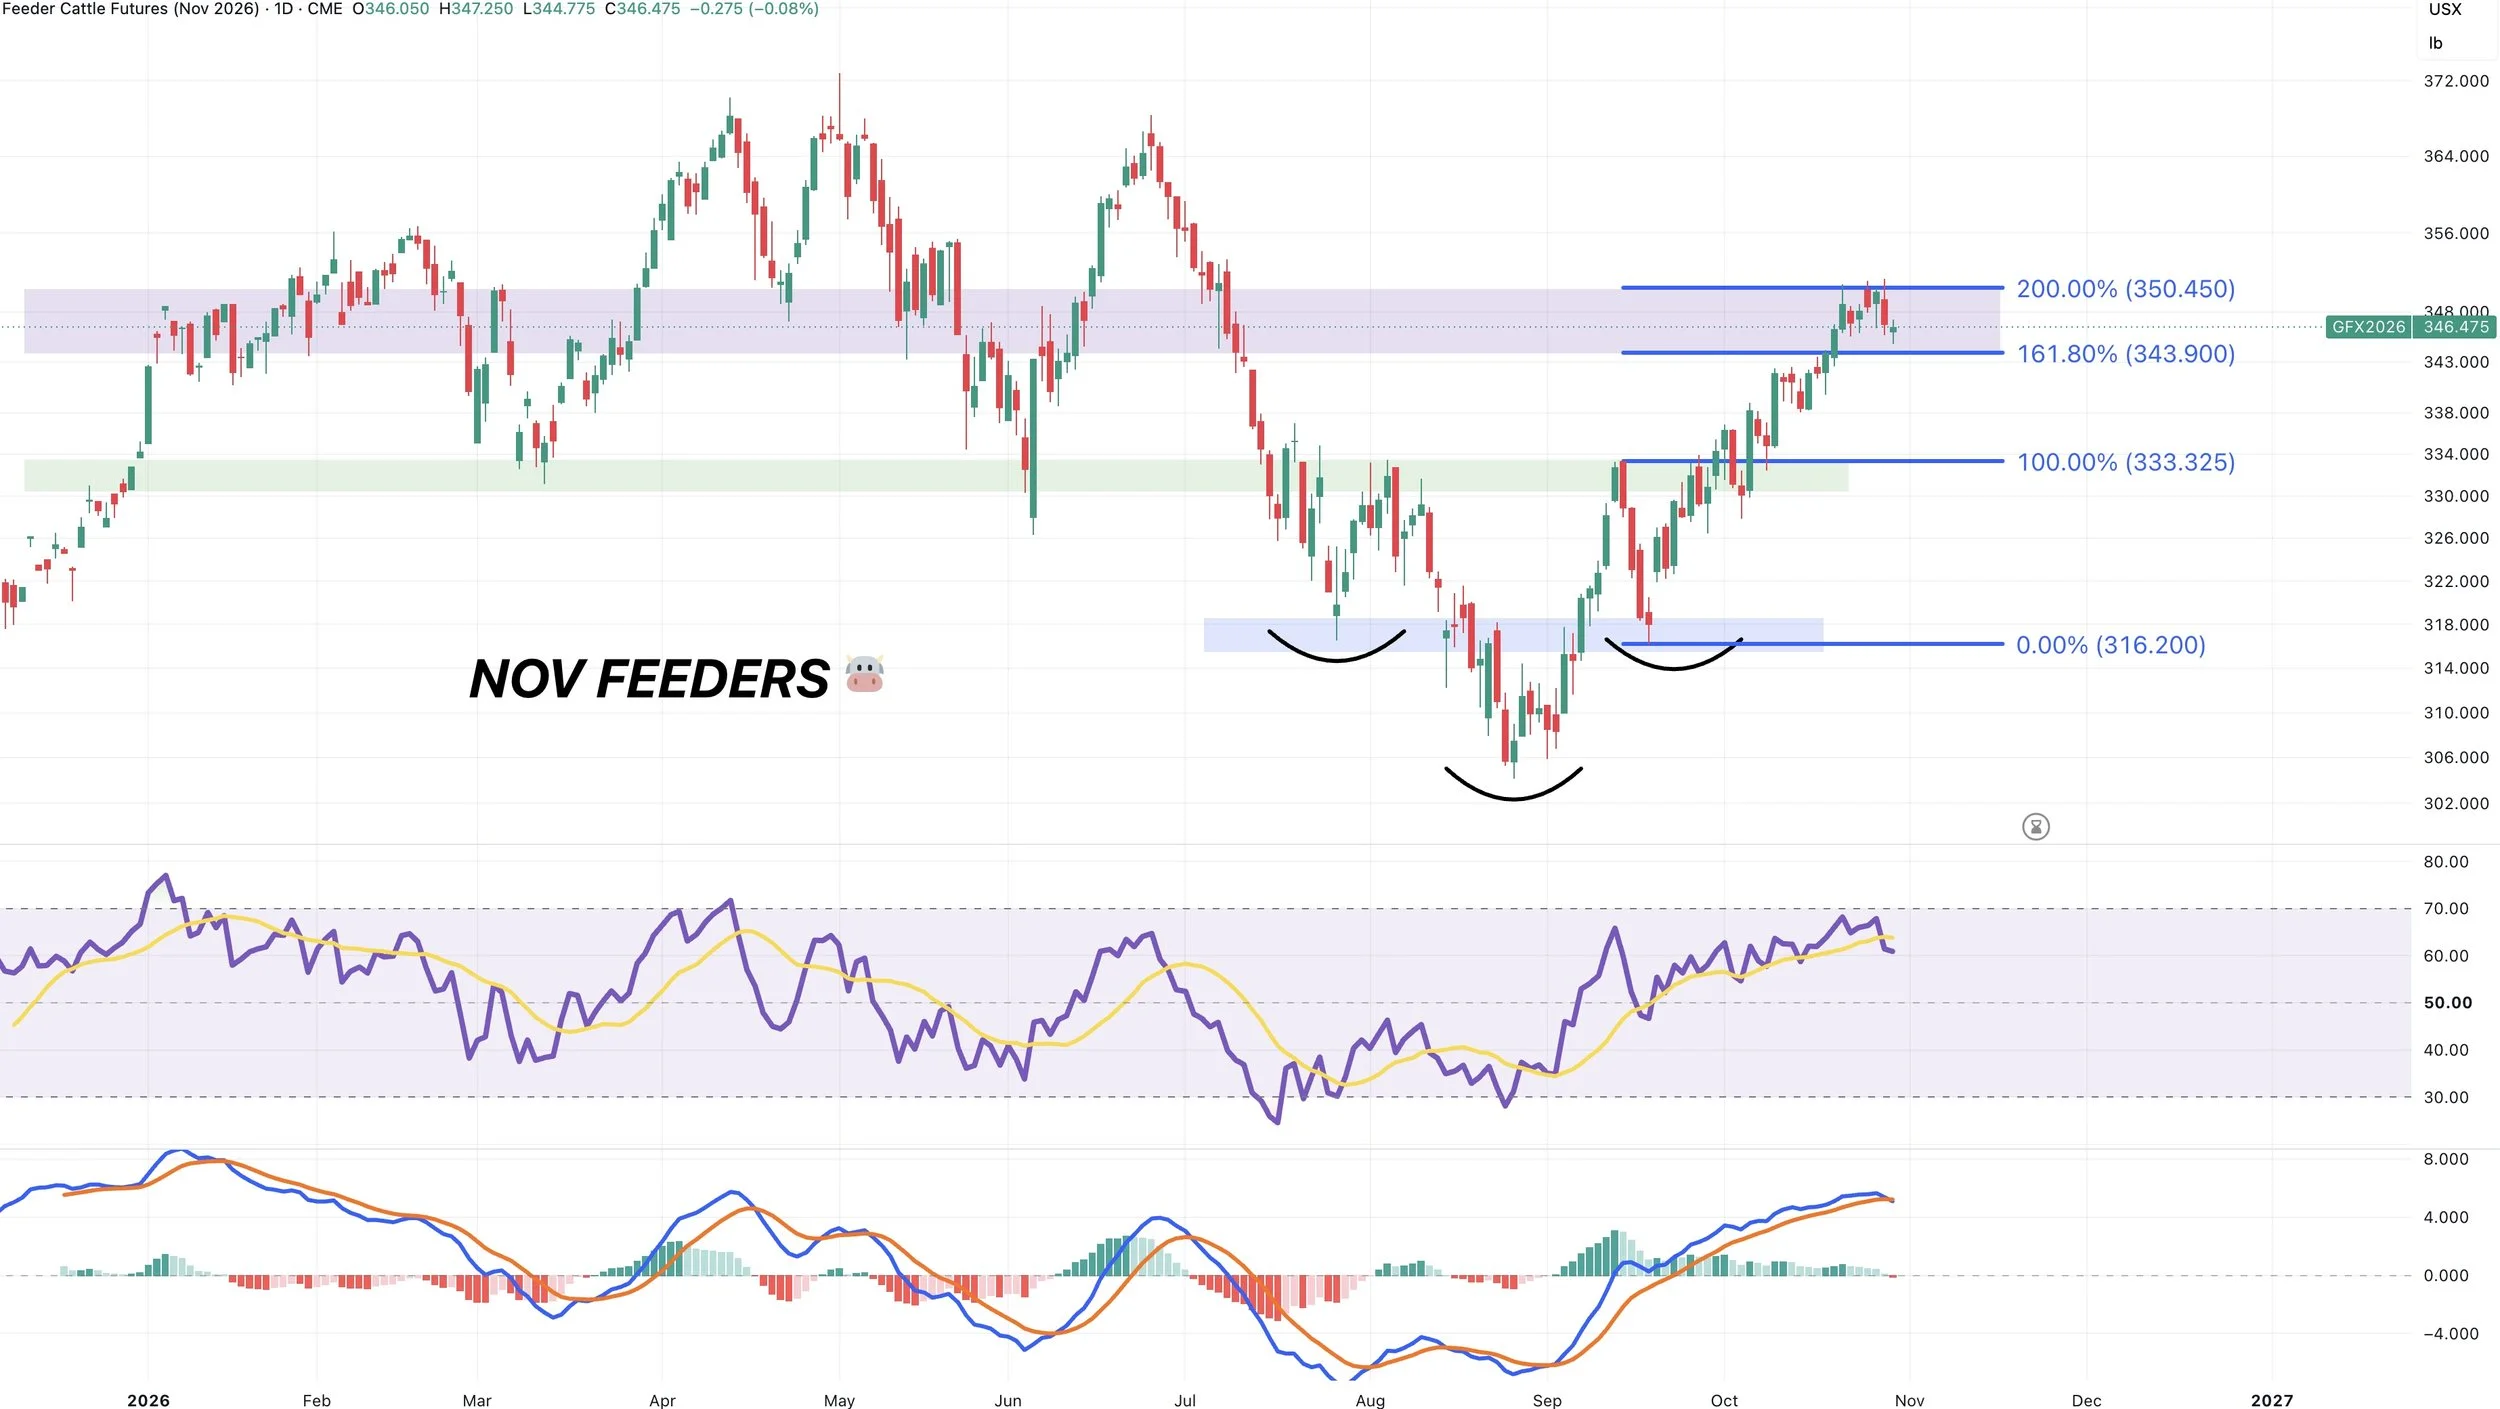
Feeders have been far stronger than live cattle.
However, I do still like protecting the rally in feeders if you have not yet done so.
We hit the 200% fib extension from the recent lows up to those September highs.
The 161.8% to 200% levels are common targets.
We are also pretty overbought like we were in live.
The MACD also looks like it wants to cross bearish. Which could possibly suggest that momentum is starting to slow down.
None of this means feeders can’t keep pushing higher. I think it just makes good risk management sense to do something up here.
Want to Talk?
Our phones are open 24/7 for you guys if you ever need anything or want to discuss your operation.
Jeremey & Office: (806)484-1214
Sebastian: (605)280-1186
Email: sfrost@dailymarketminute.com
Hedge Account
Interested in a hedge account? Use the link below to set up an account or give us a call.