
FRIENDLY USDA. WHAT’S IT MEAN?
MARKET UPDATE
You can scroll to read the usual update as well. As the written version is the exact same as the video.
Timestamps for video:
Overview: 0:00min
Corn USDA: 2:20min
Bean USDA: 7:10min
Corn Charts: 8:35min
Bean Charts: 11:00min
Wheat: 12:55min
Cattle: 14:45min
Want to talk?
Office: (806)484-1214
Enjoying your trial?
Here is extended access to our 4th of July sale. Lock in the offer to keep full access to our updates & signals
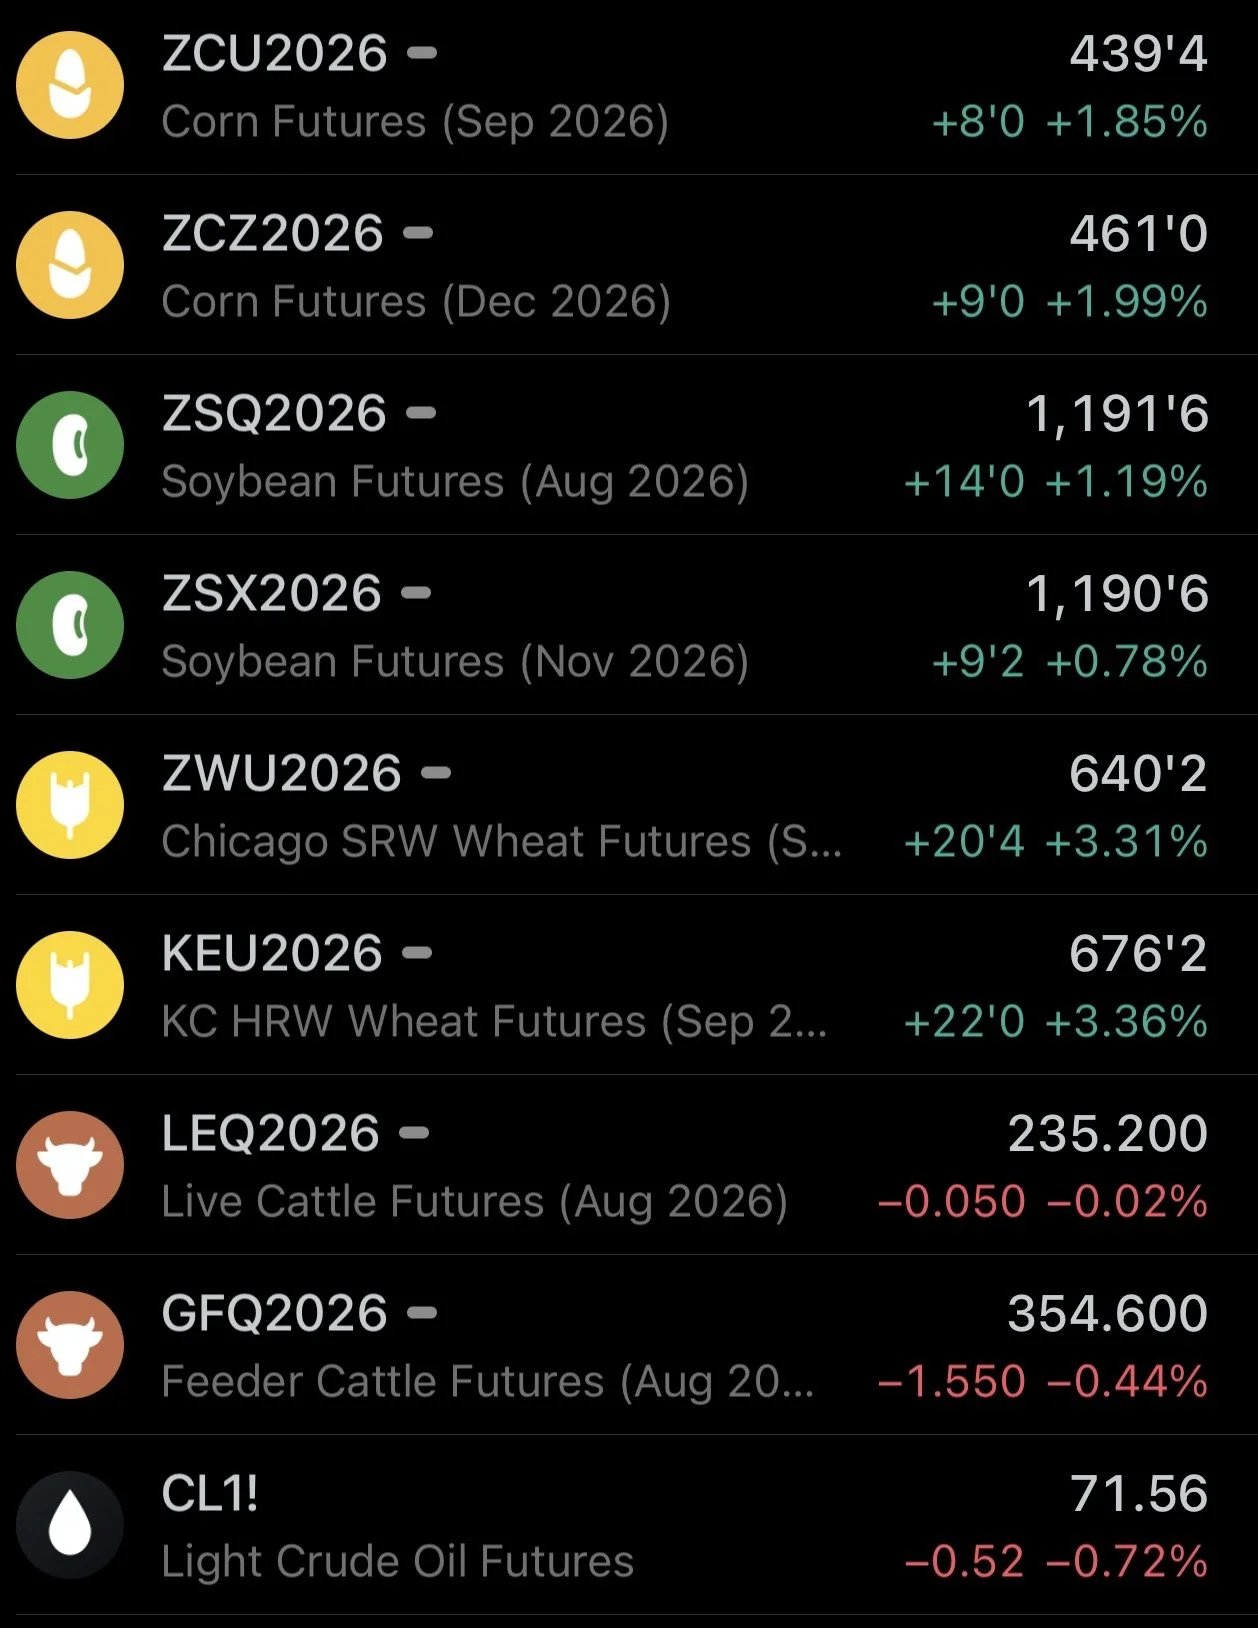
Futures Prices Close
Overview
Grains strong today. We were trading higher before the USDA report, after the report came out it didn’t change the price action a crazy amount.
However, I would consider the report to be on the friendly side overall. Especially for corn.
It wasn’t out of this world bullish for anything, but it wasn’t bearish at all.
What the weather forecasts say on Sunday night is going to be very impactful to the markets, and weather is really going to drive us the next few weeks.
The reason for the mid-week weakness after the strong start was that the extended forecasts shifted slightly cooler and wetter than they previously were.
Let's dive right into the report.
USDA Recap
This is the last "boring" report until November.
This report wasn’t expected to produce any massive changes, as the USDA very rarely touches yield in July.
The August report is going to the big one. But this one did feature some decent changes compared to expectations.
New Crop Carryout:
Corn: 1.79 vs 1.873 est (1.96 in June)
Beans: 0.310 vs 0.330 est (0.310 in June)
Wheat: 0.722 vs 0.714 est (0.744 in June)
Corn came in nearly 83 million bushels below the trade estimate, and 170 million below last month. So that was a friendly surprise. I'll dive into the balance sheets later and go over what changes were actually made.
Soybeans were expected to see an increase vs last month due to the higher acres, but came in unchanged vs last month despite the higher acres.
Wheat came in higher than the trade was expecting, but was still lower than last month.

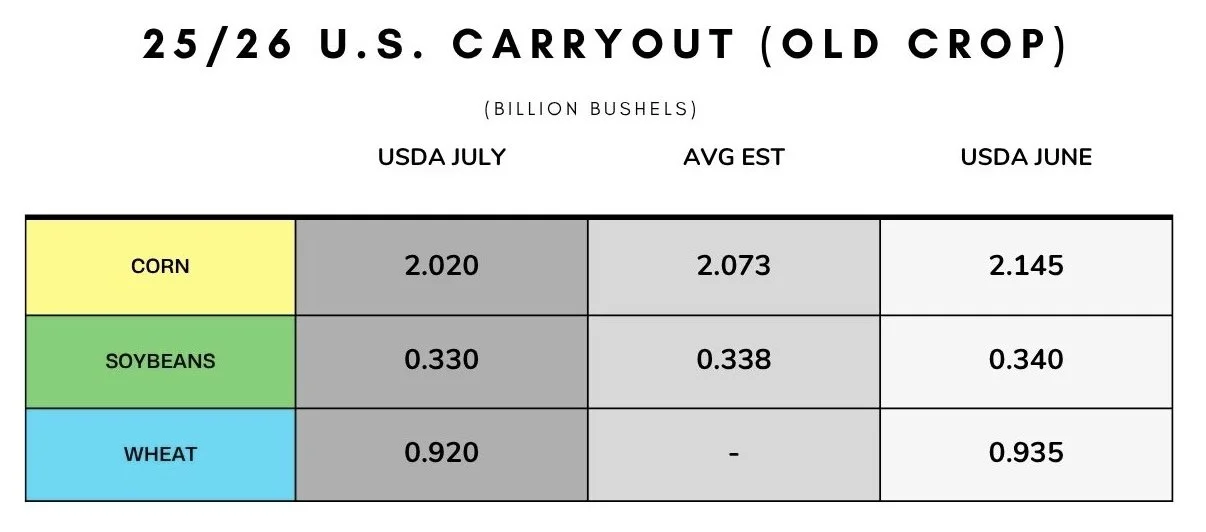
Old Crop Carryout:
Corn: 2.020 vs 2.073 est (2.145 in June)
Beans: 0.330 vs 0.338 est (0.340 in June)
Corn came in below the trade estimates, dropping by 125 million bushels vs last month. Which was over 50 million more than the trade was expecting.
Soybeans came in lower than the estimates as well by about 10 million.
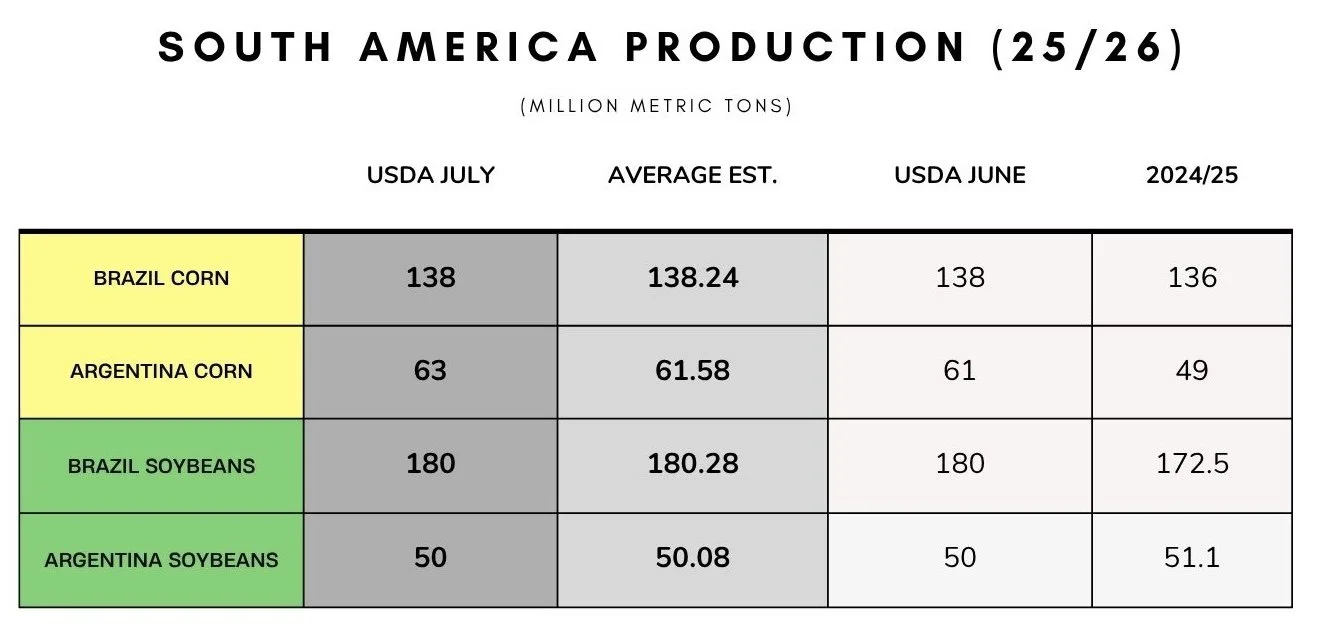
South America:
The only change they made today was they bumped Argentina corn from 61 to 63 MMT.
Outside of that no other changes.
World Carryout:
The world numbers actually all came in below the estimates for everything.
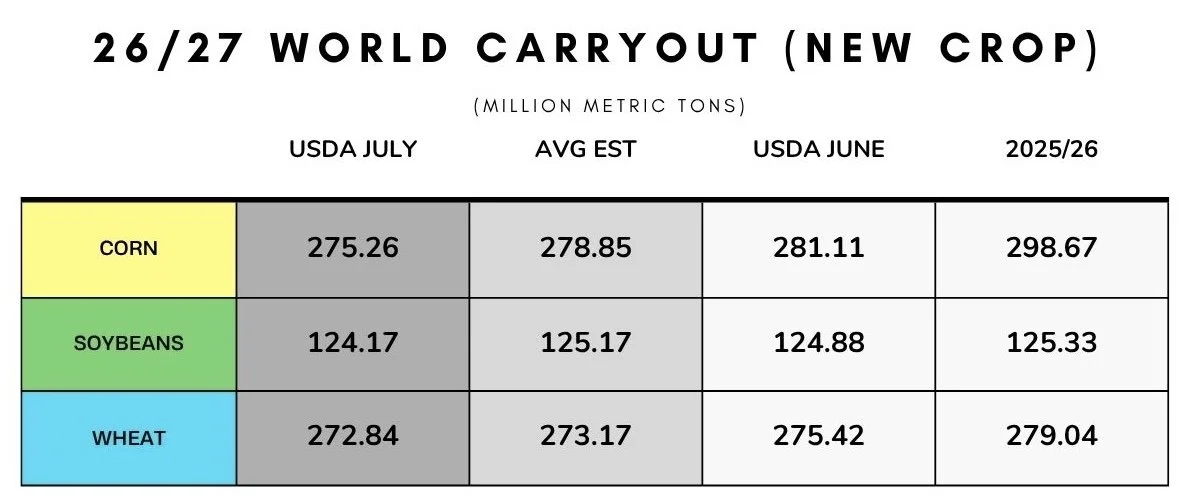
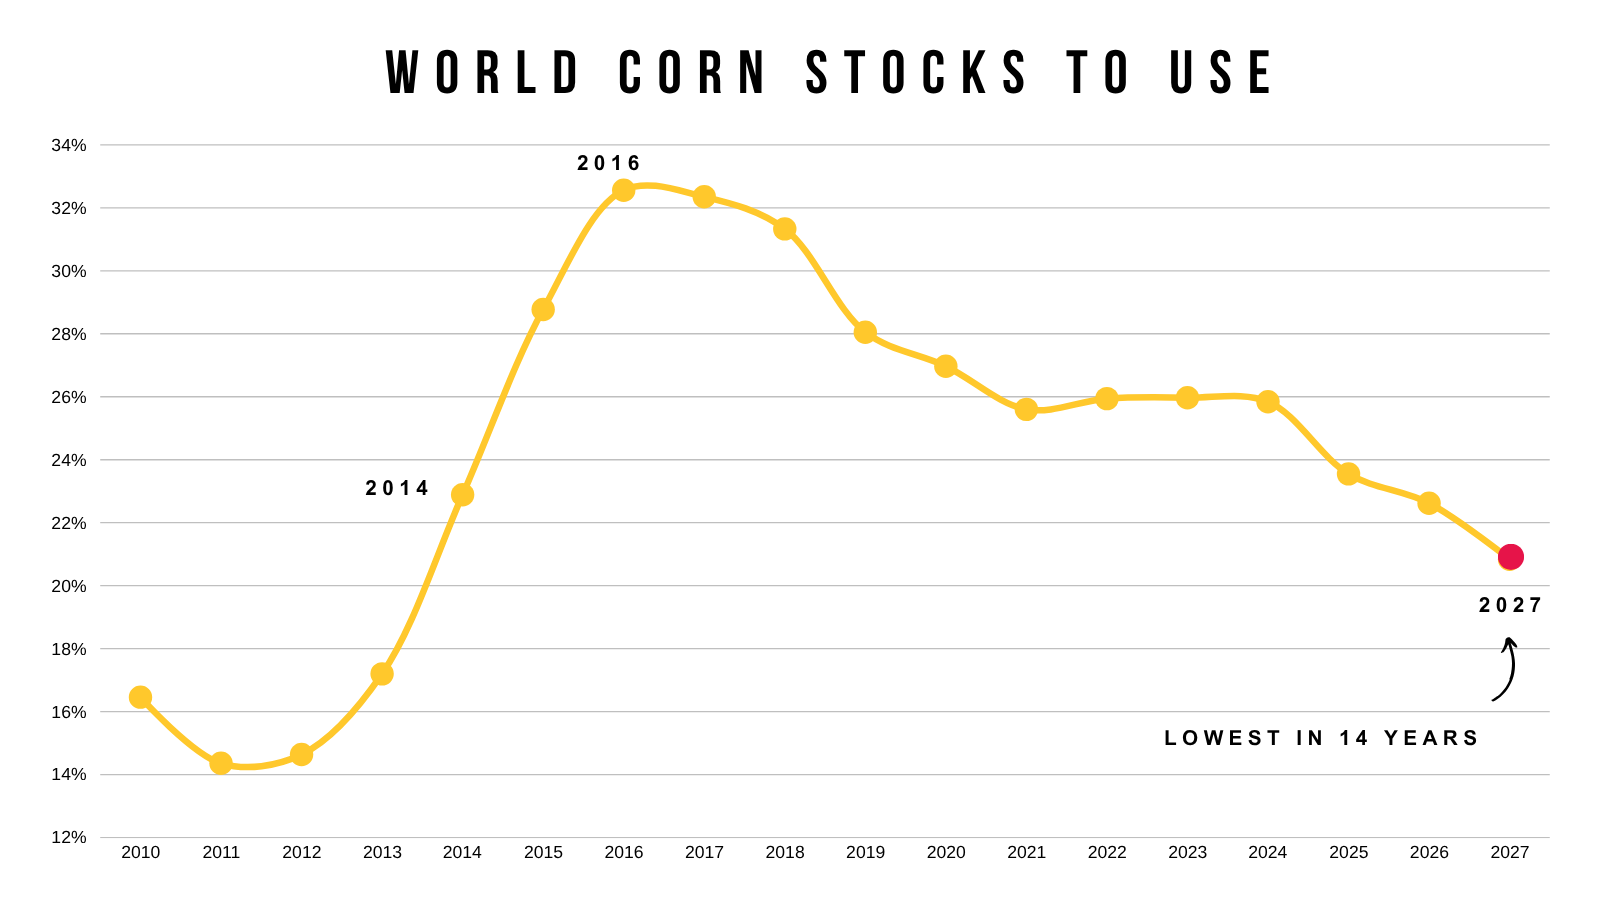
The world corn stocks to use continues to drop. As the situation gets tighter and tighter.
This will matter if the US ever falls short on our crop. As the world needs our corn.
Balance Sheet Changes
Corn: Old Crop Changes
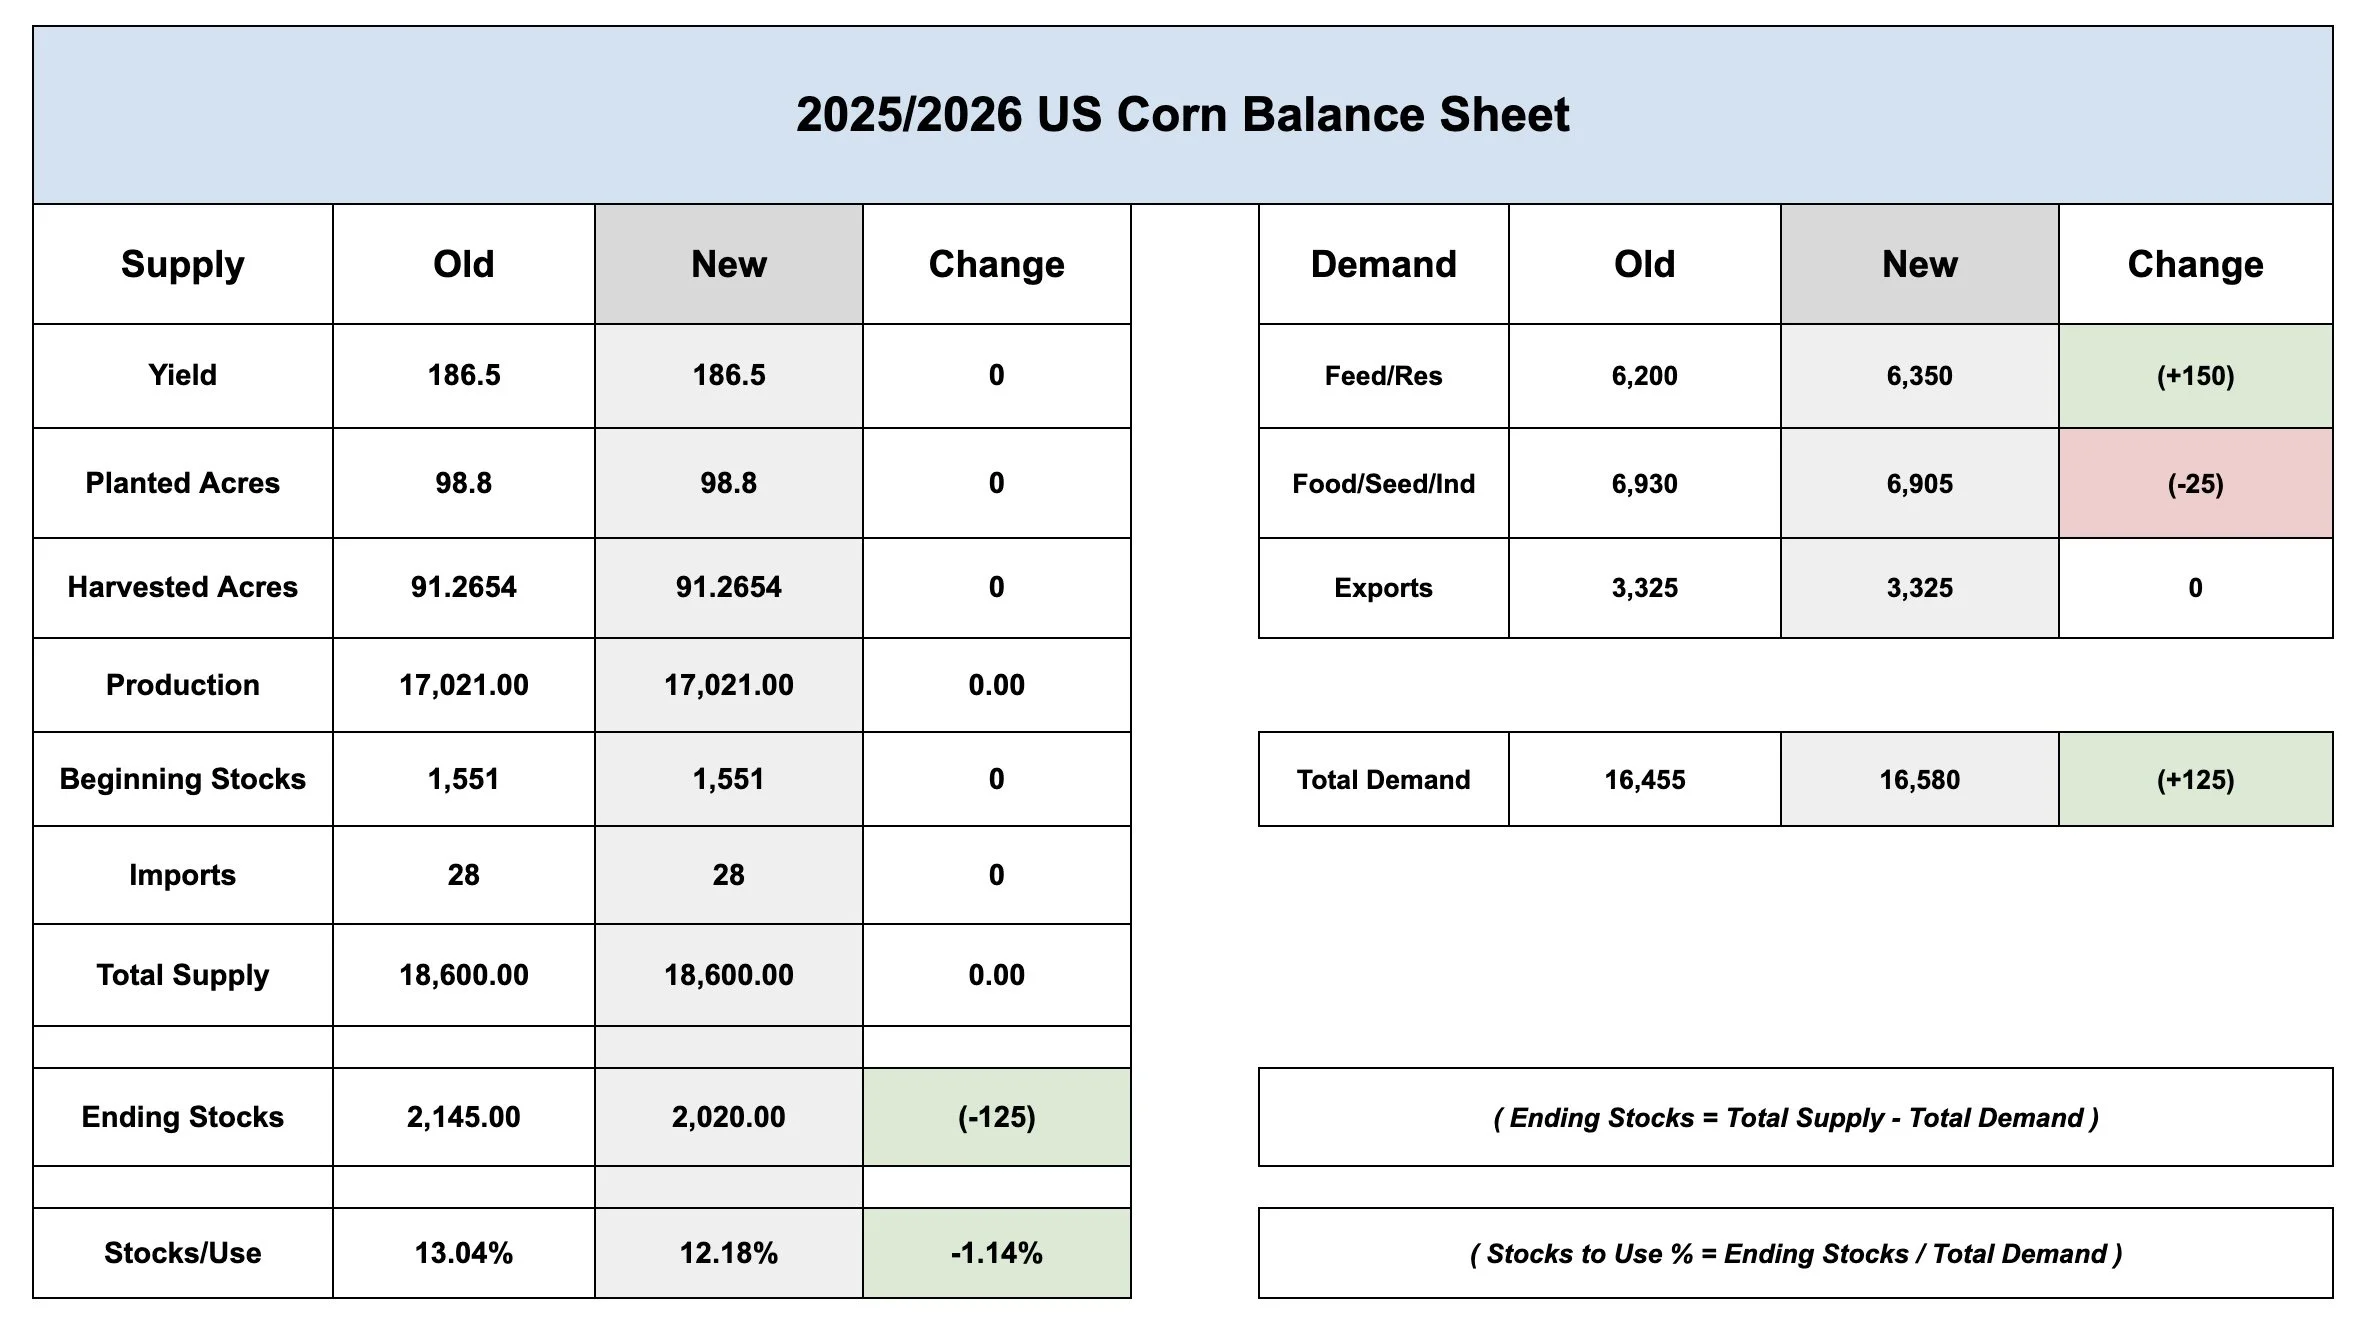
As for what the USDA actually did.
The market knew carryout would be dropping, but it dropped by more than expected.
On old crop corn they bumped feed demand yet again. Raising it another +150 million bushels.
At the same time they dropped ethanol by -25 million bushels.
For a net loss of -125 million on the carryout.
Bringing our stocks to use from 13% to 12%.
Feed Visual:
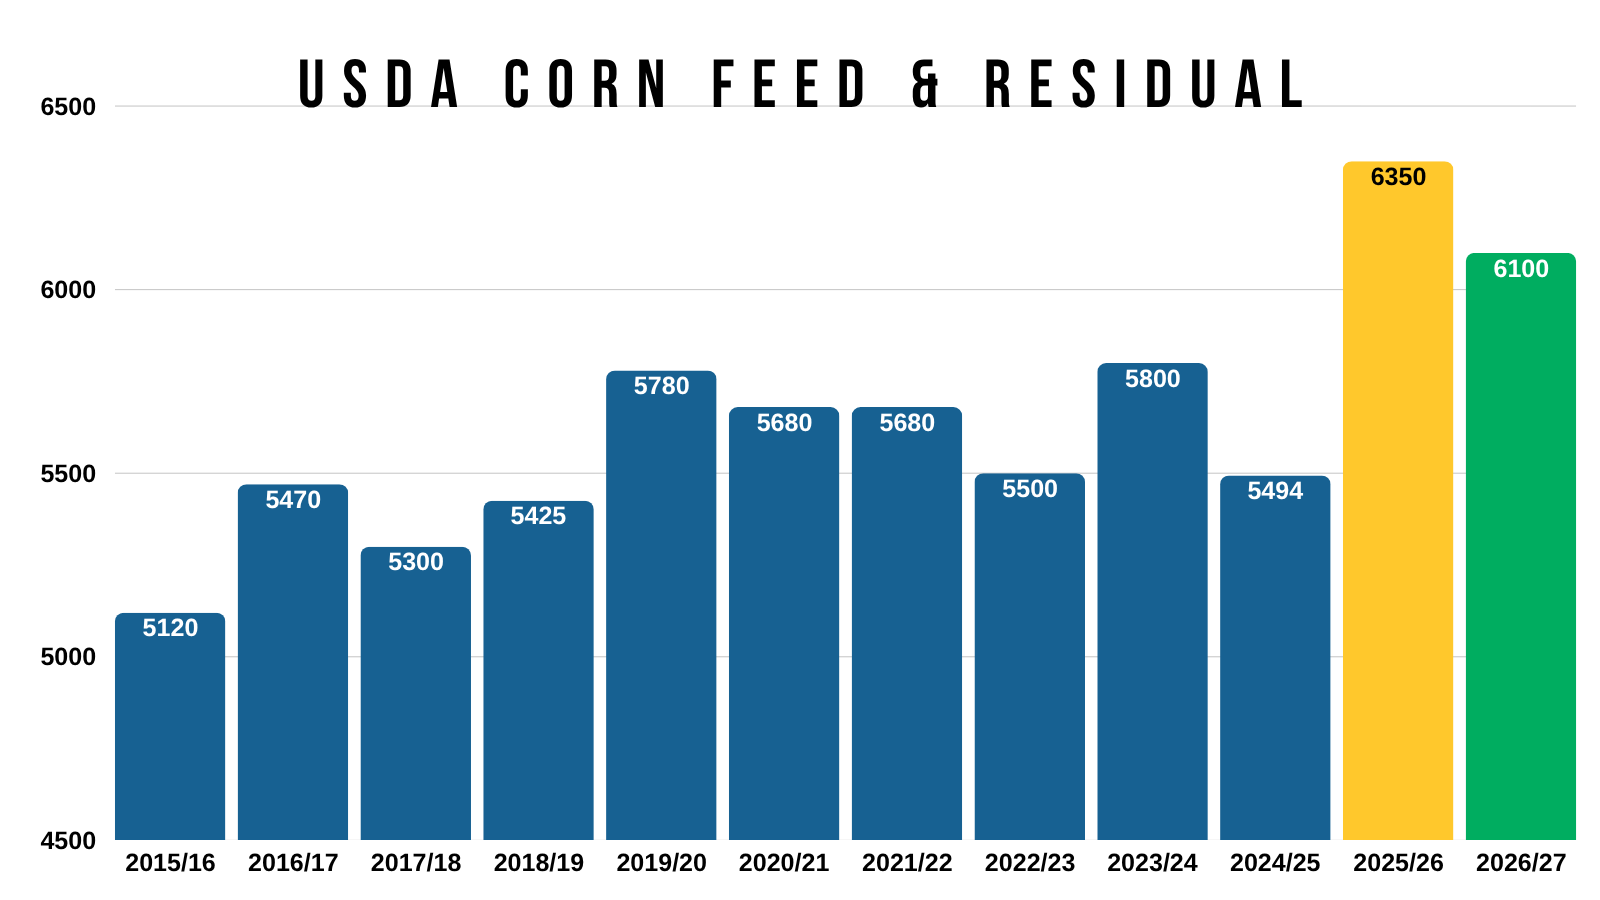
Here is how feed demand has changed over the years.
The USDA is expecting our feed demand to be 15% bigger than last year. That is a massive increase. The largest we have ever seen by a wide margin.
People thought feed demand was too high before this report, yet they raised it again.
What's this mean? Well it could possibly mean that the USDA overstated last years crop and is using the feed demand number to compensate for that.
So we will have to see if the USDA reverses that with a drop to last year's crop size that in the Sep 30th report.
As the numbers really don’t make a ton of sense.
Corn: New Crop Changes
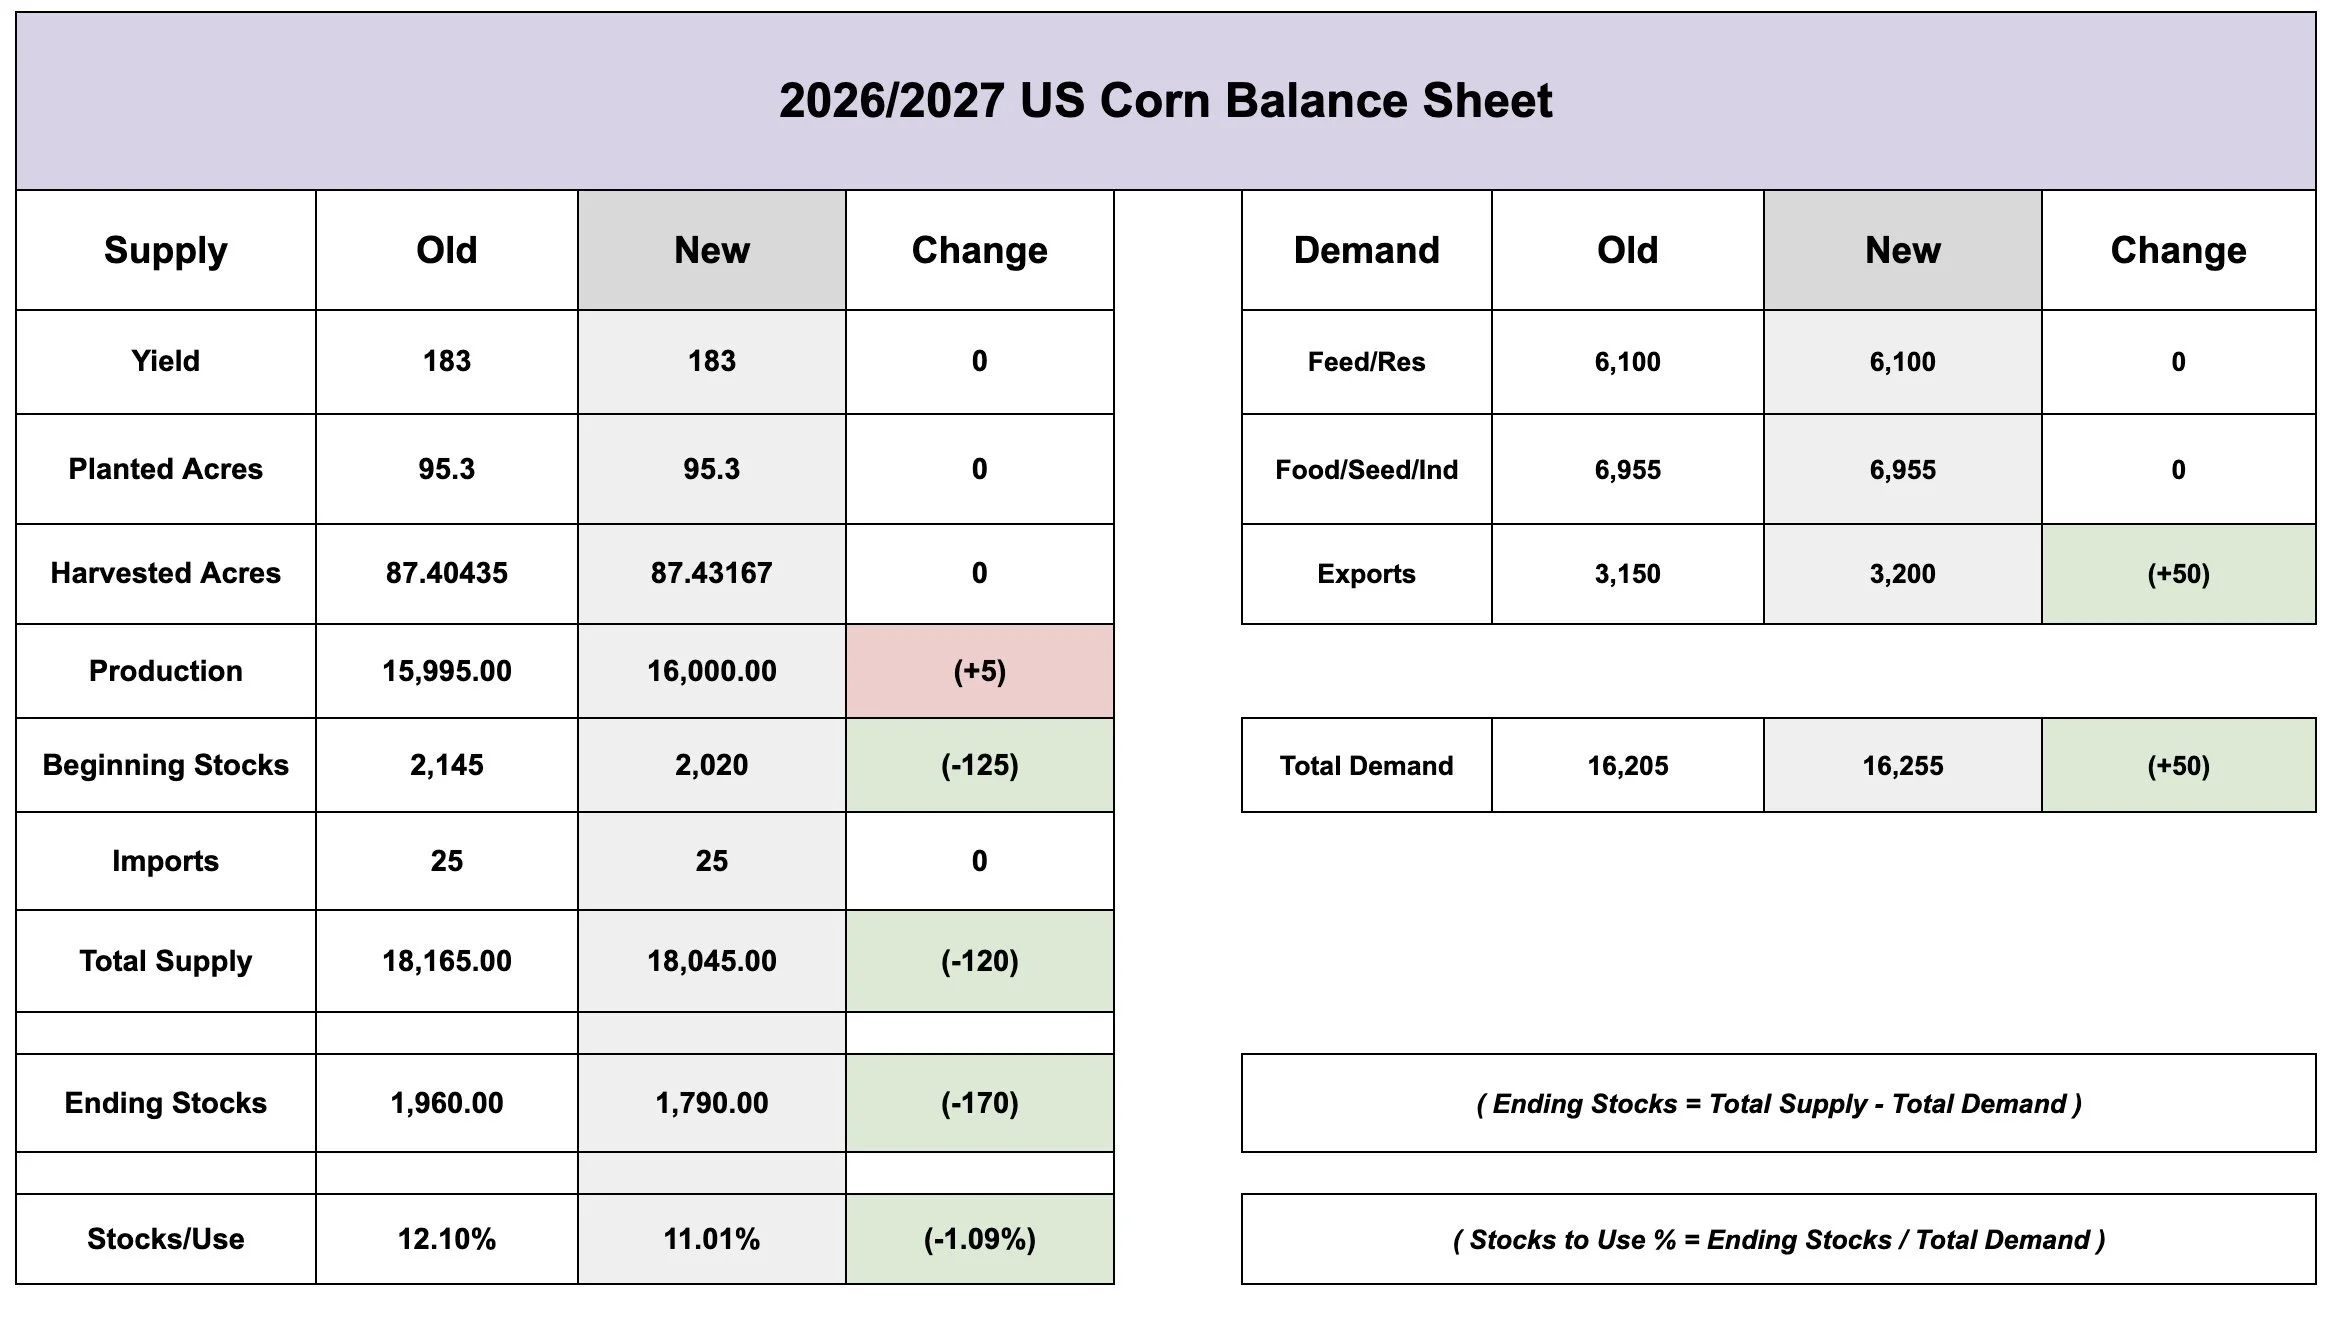
Since the drop in old crop carryout was larger than expected, so was the drop in new crop.
We saw beginning stocks drop by -125 million due to old crop dropping by -125 million.
The USDA then also raised our exports by +50 million.
For a net loss of -170 million to the carryout. Bringing our carryout to under 1.8 million vs the old crop's 2.0 billion.
Our stocks to use is now at 11%, which isn’t bull market territory or anything yet, but that is much smaller than it was just a few months ago.
Stocks to Use Visual:
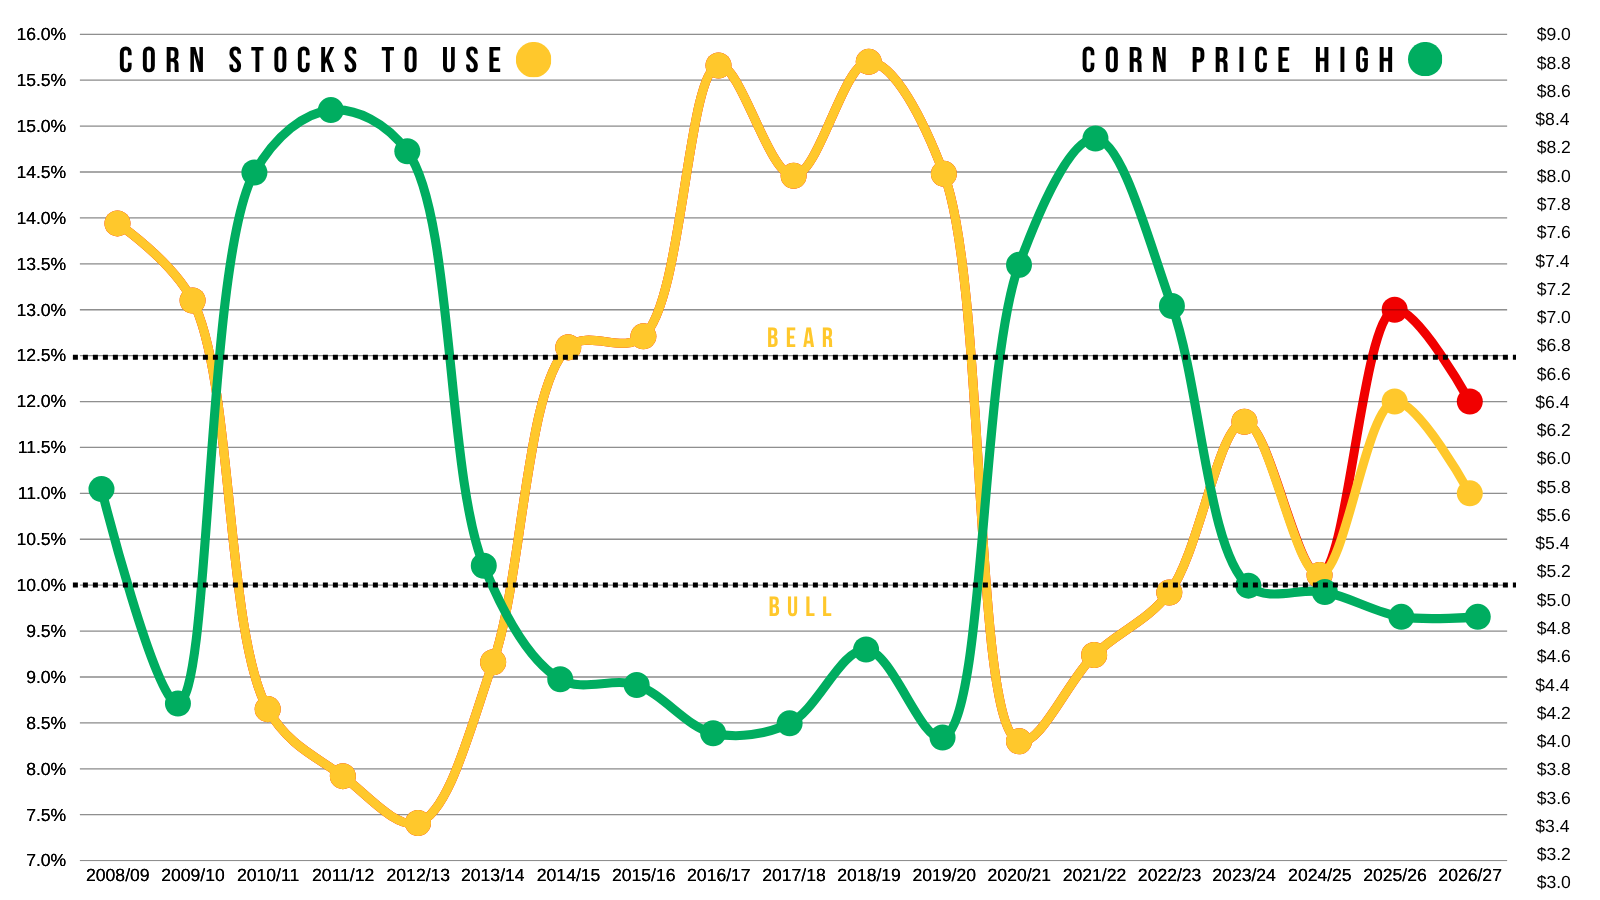
I've shown this chart countless times in the past.
It compares corn's highest price of the year to our stocks to use ratio.
Stocks to use is the best way to determine how high or corn should be based on the fundamentals.
Normally to get front month corn much above $5.00 you typically need to see the stocks to use at or below 10%.
On this chart, I threw on our stocks to use for old crop and new crop from last month in red, with the updated stocks to use in yellow.
Neither are considered super bullish still, but our new crop is down to 11% now.
The bull argument for new crop corn:
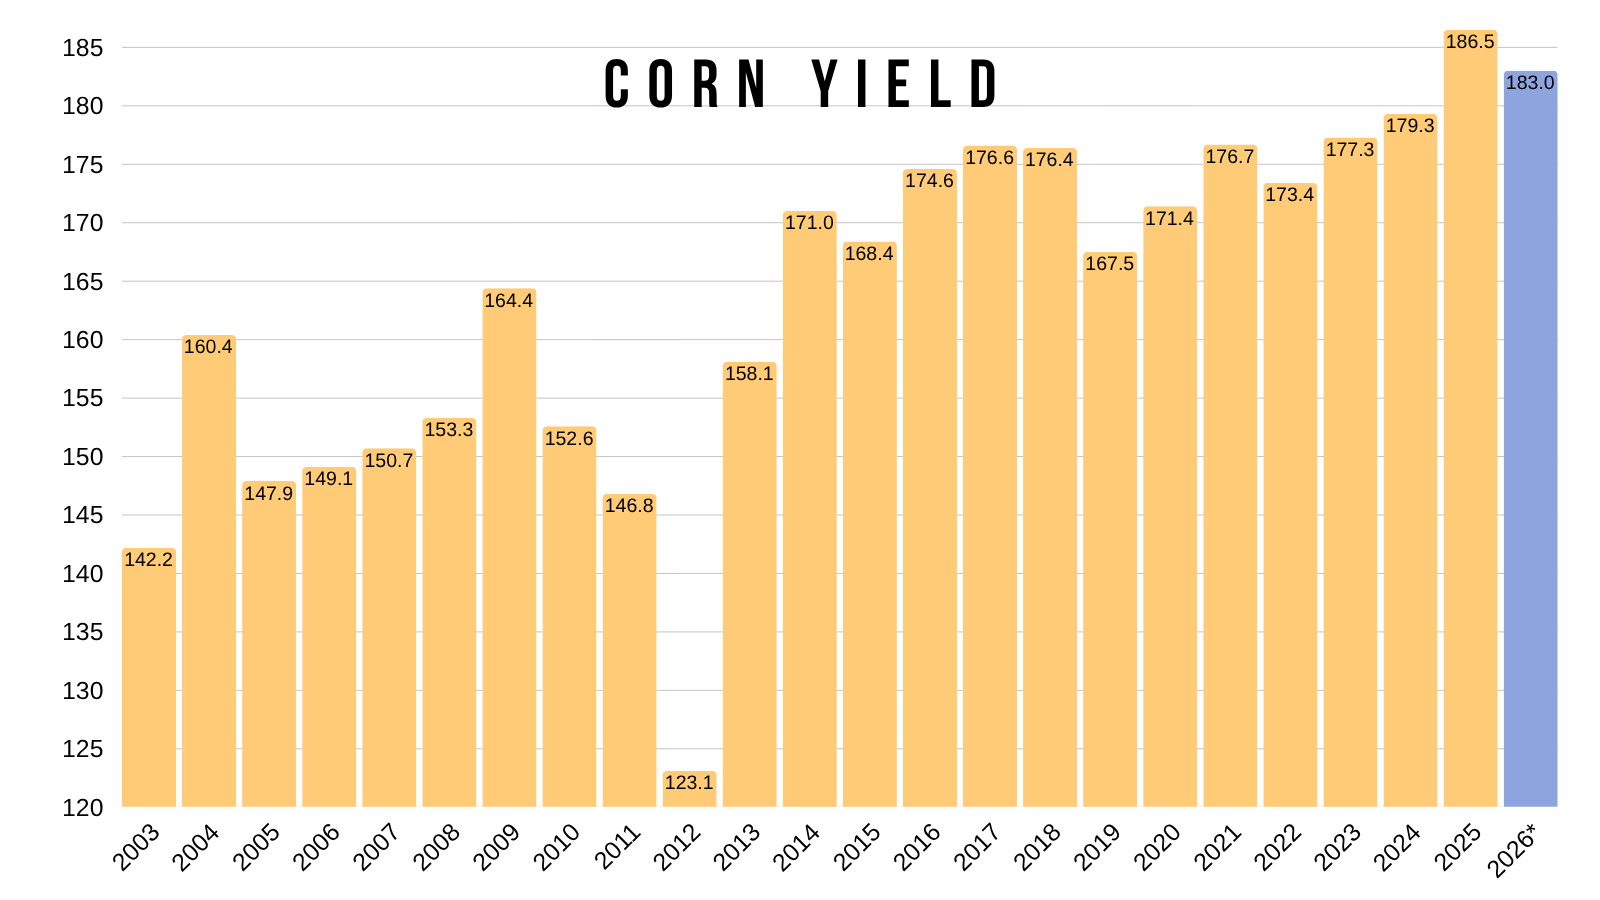
The current 1.8 billion bushel carryout and 11% stocks is IF we have a 183 yield.
Absolutely possible, but far from a given.
It would still be the 2nd largest ever.
Last year was the first and only time we've been above 180.
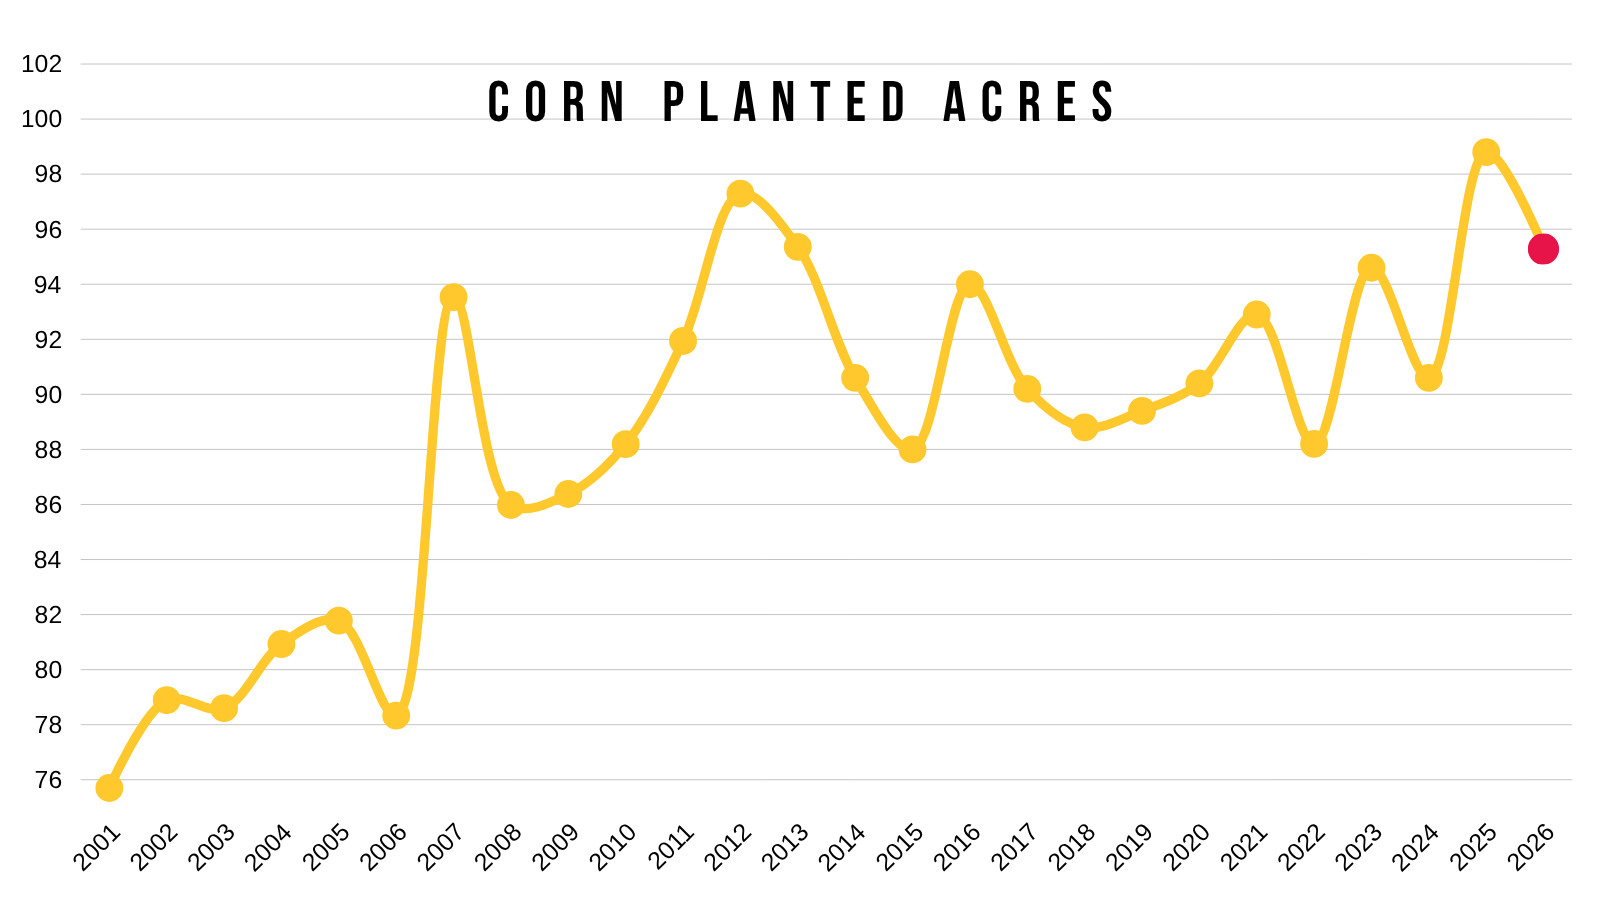
That number also uses 95.3 million acres.
Also one of the largest ever, although obviously lower than last year.
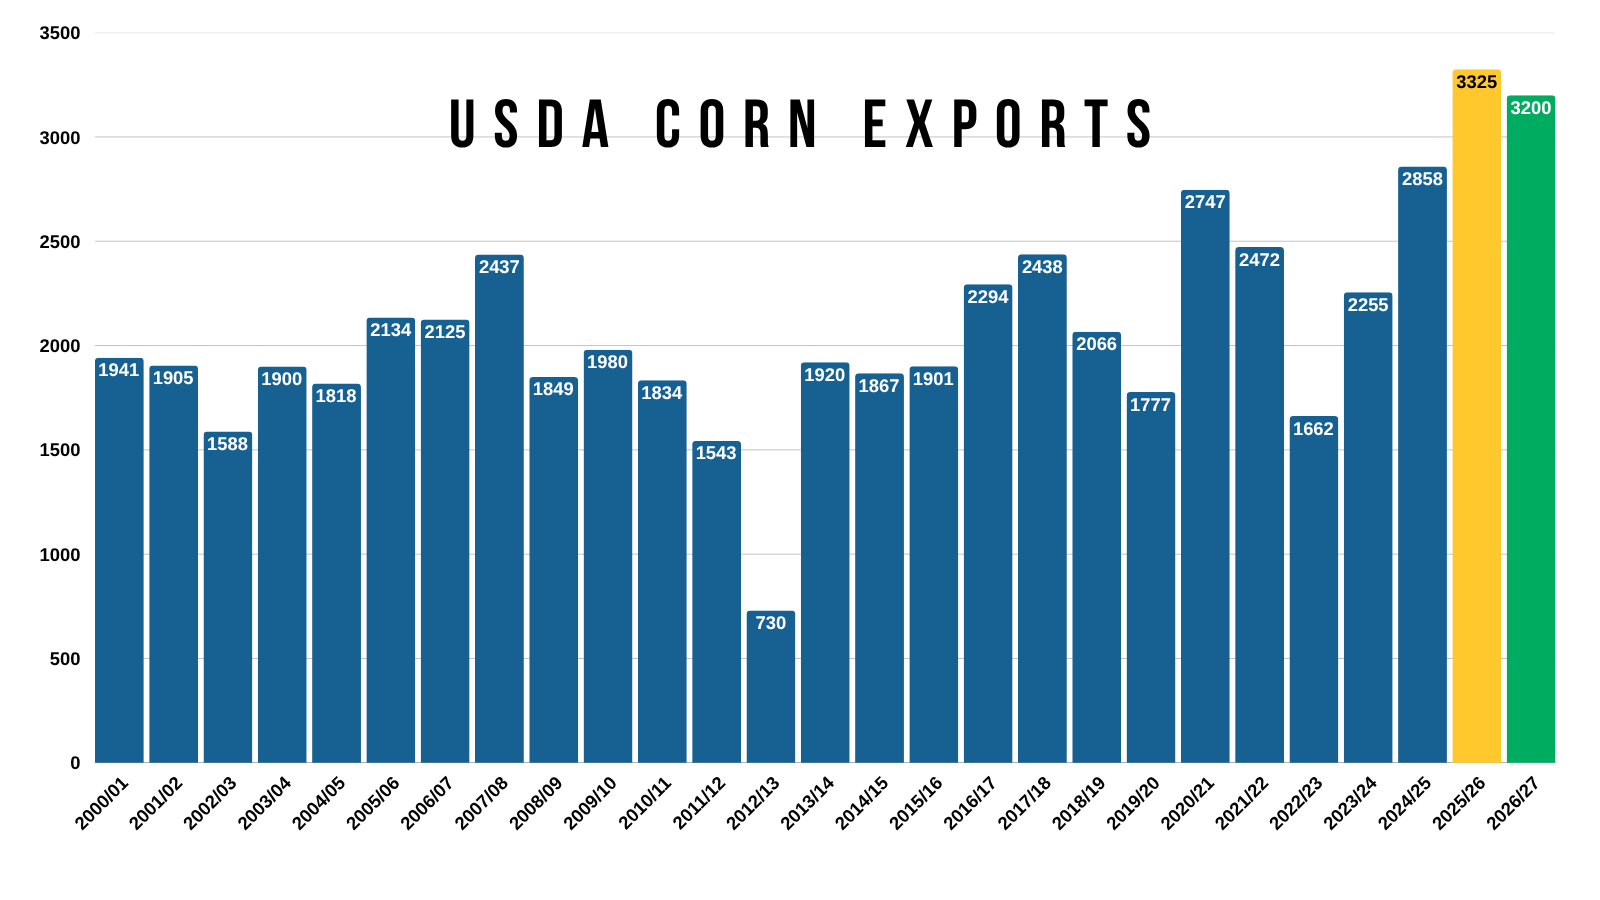
Those numbers also include the USDA expecting demand to be worse than last year.
The USDA simply said that demand will be lower because supply will be lower. It's their way of balancing the balance sheet.
But that's not exactly how it works. The lower demand has to be justified. There has to be a reason for us to lose demand.
What usually has to happen for demand to be rationed lower? Prices usually have to go higher to incentivize the lower demand.
Here is why that matters.
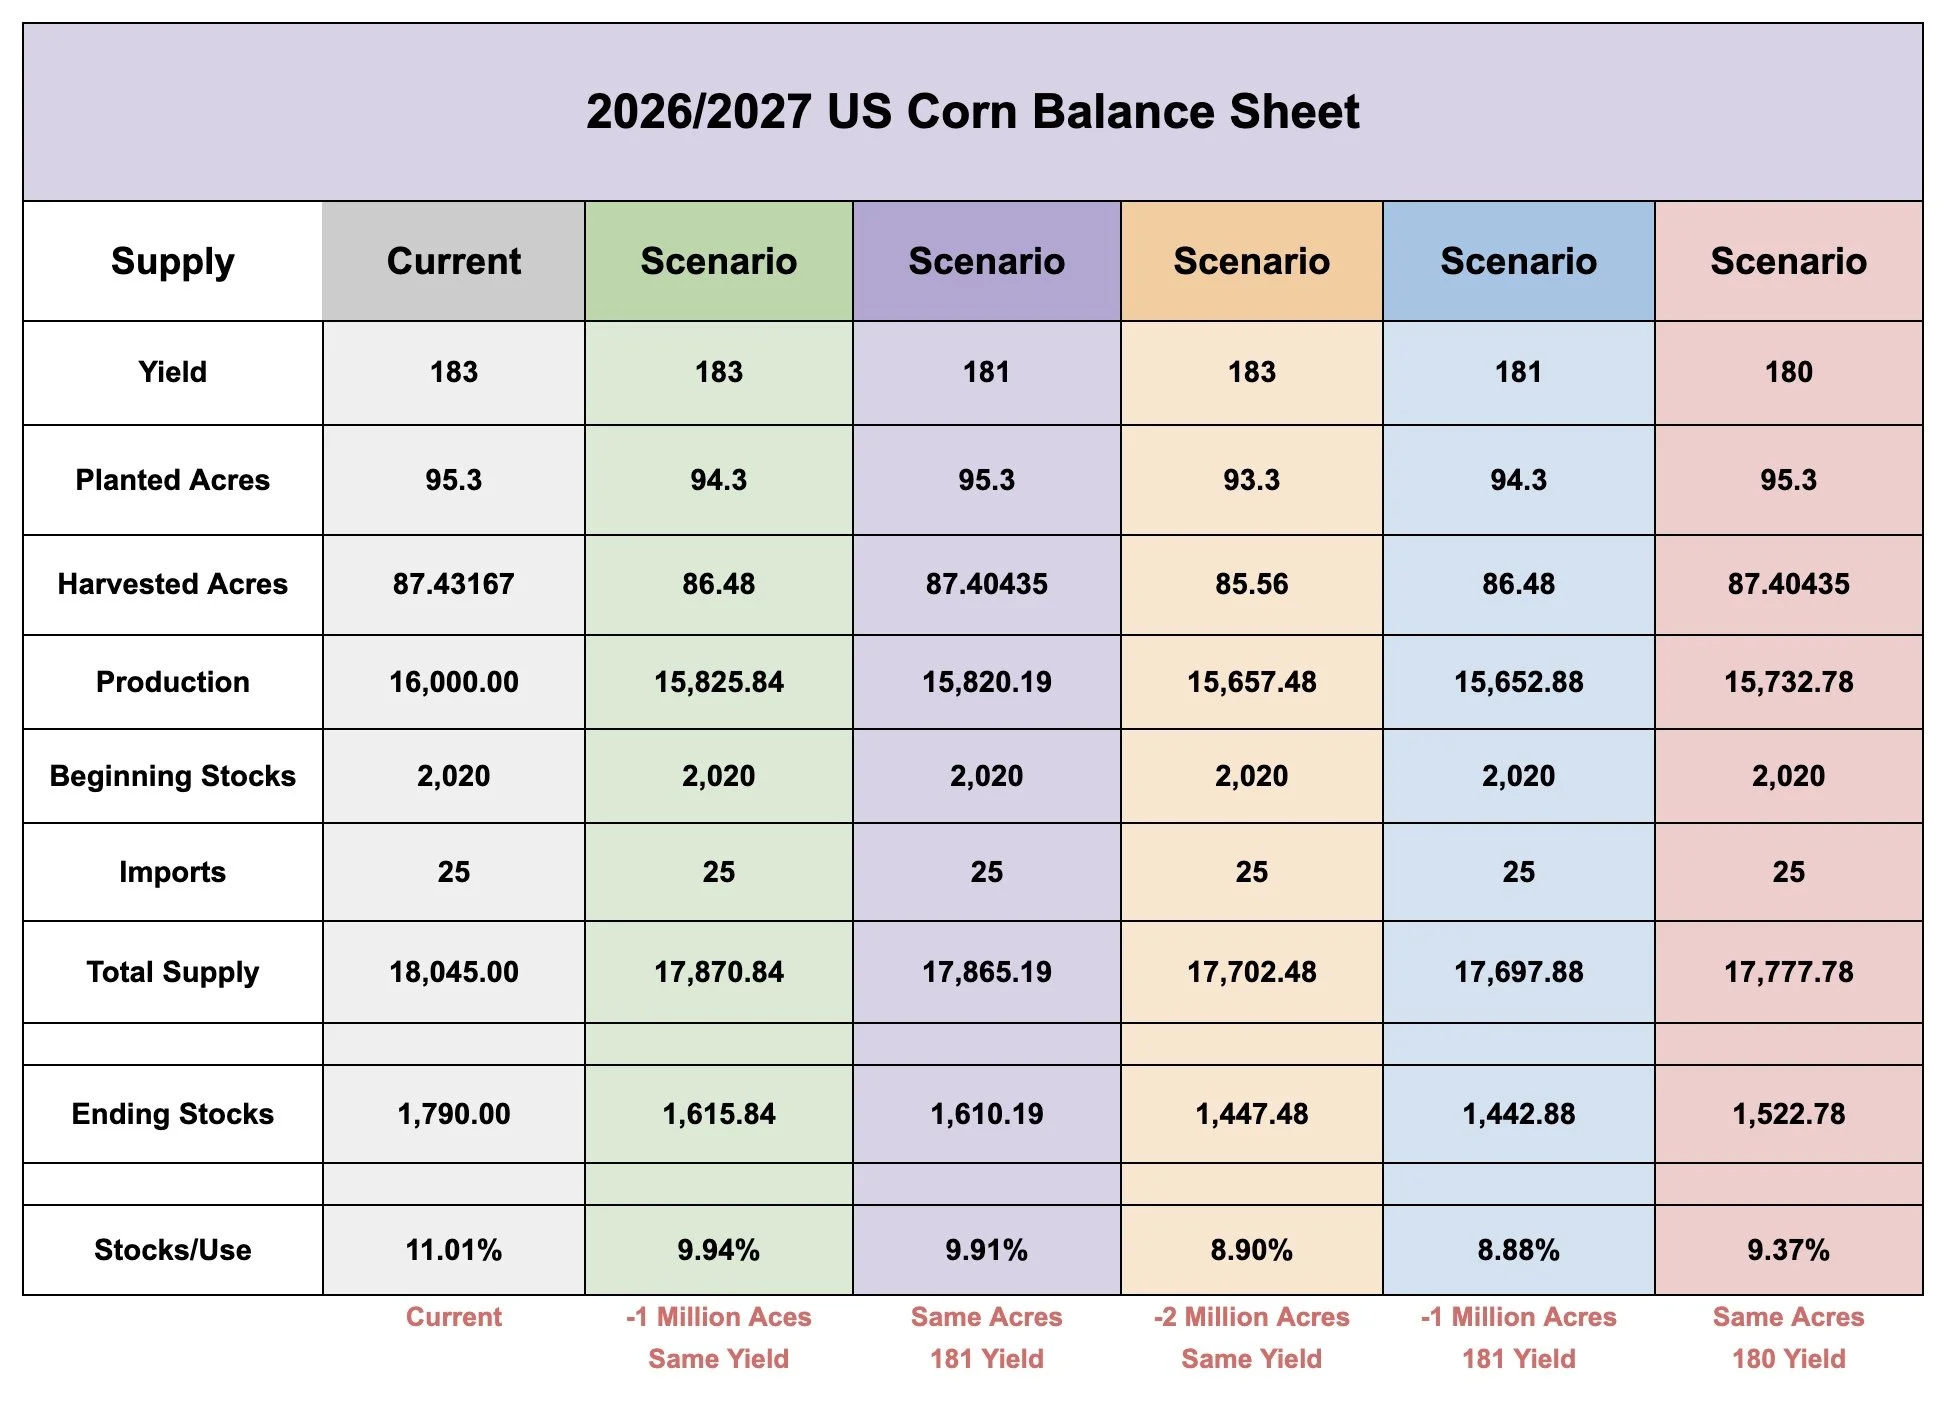
Here are some new balance sheet scenarios.
None of these account for any changes to demand, but they show how yield and acres can change things on the new balance sheet.
Since the balance sheet is now -170 million bushels smaller than it was, the room for error is even smaller.
Just for reference, if yield falls down to 181 and acres stay the same, you get a sub 10% stocks to use.
If yield stays at 183 and acres drop -1 million, you get a sub 10% stocks to use.
There are several different "possible" path ways to get a decently friendly story in new crop corn.
So I would say the story looking towards next year is very much alive. As there is really no wiggle room if either yield or acres come down even slightly.
I think there is a decent chance we see this balance sheet tigthen up down the road and offer opportunities late this year and into next year.
Don’t forget about that possible China buying either...
Soybeans: Old Crop Changes
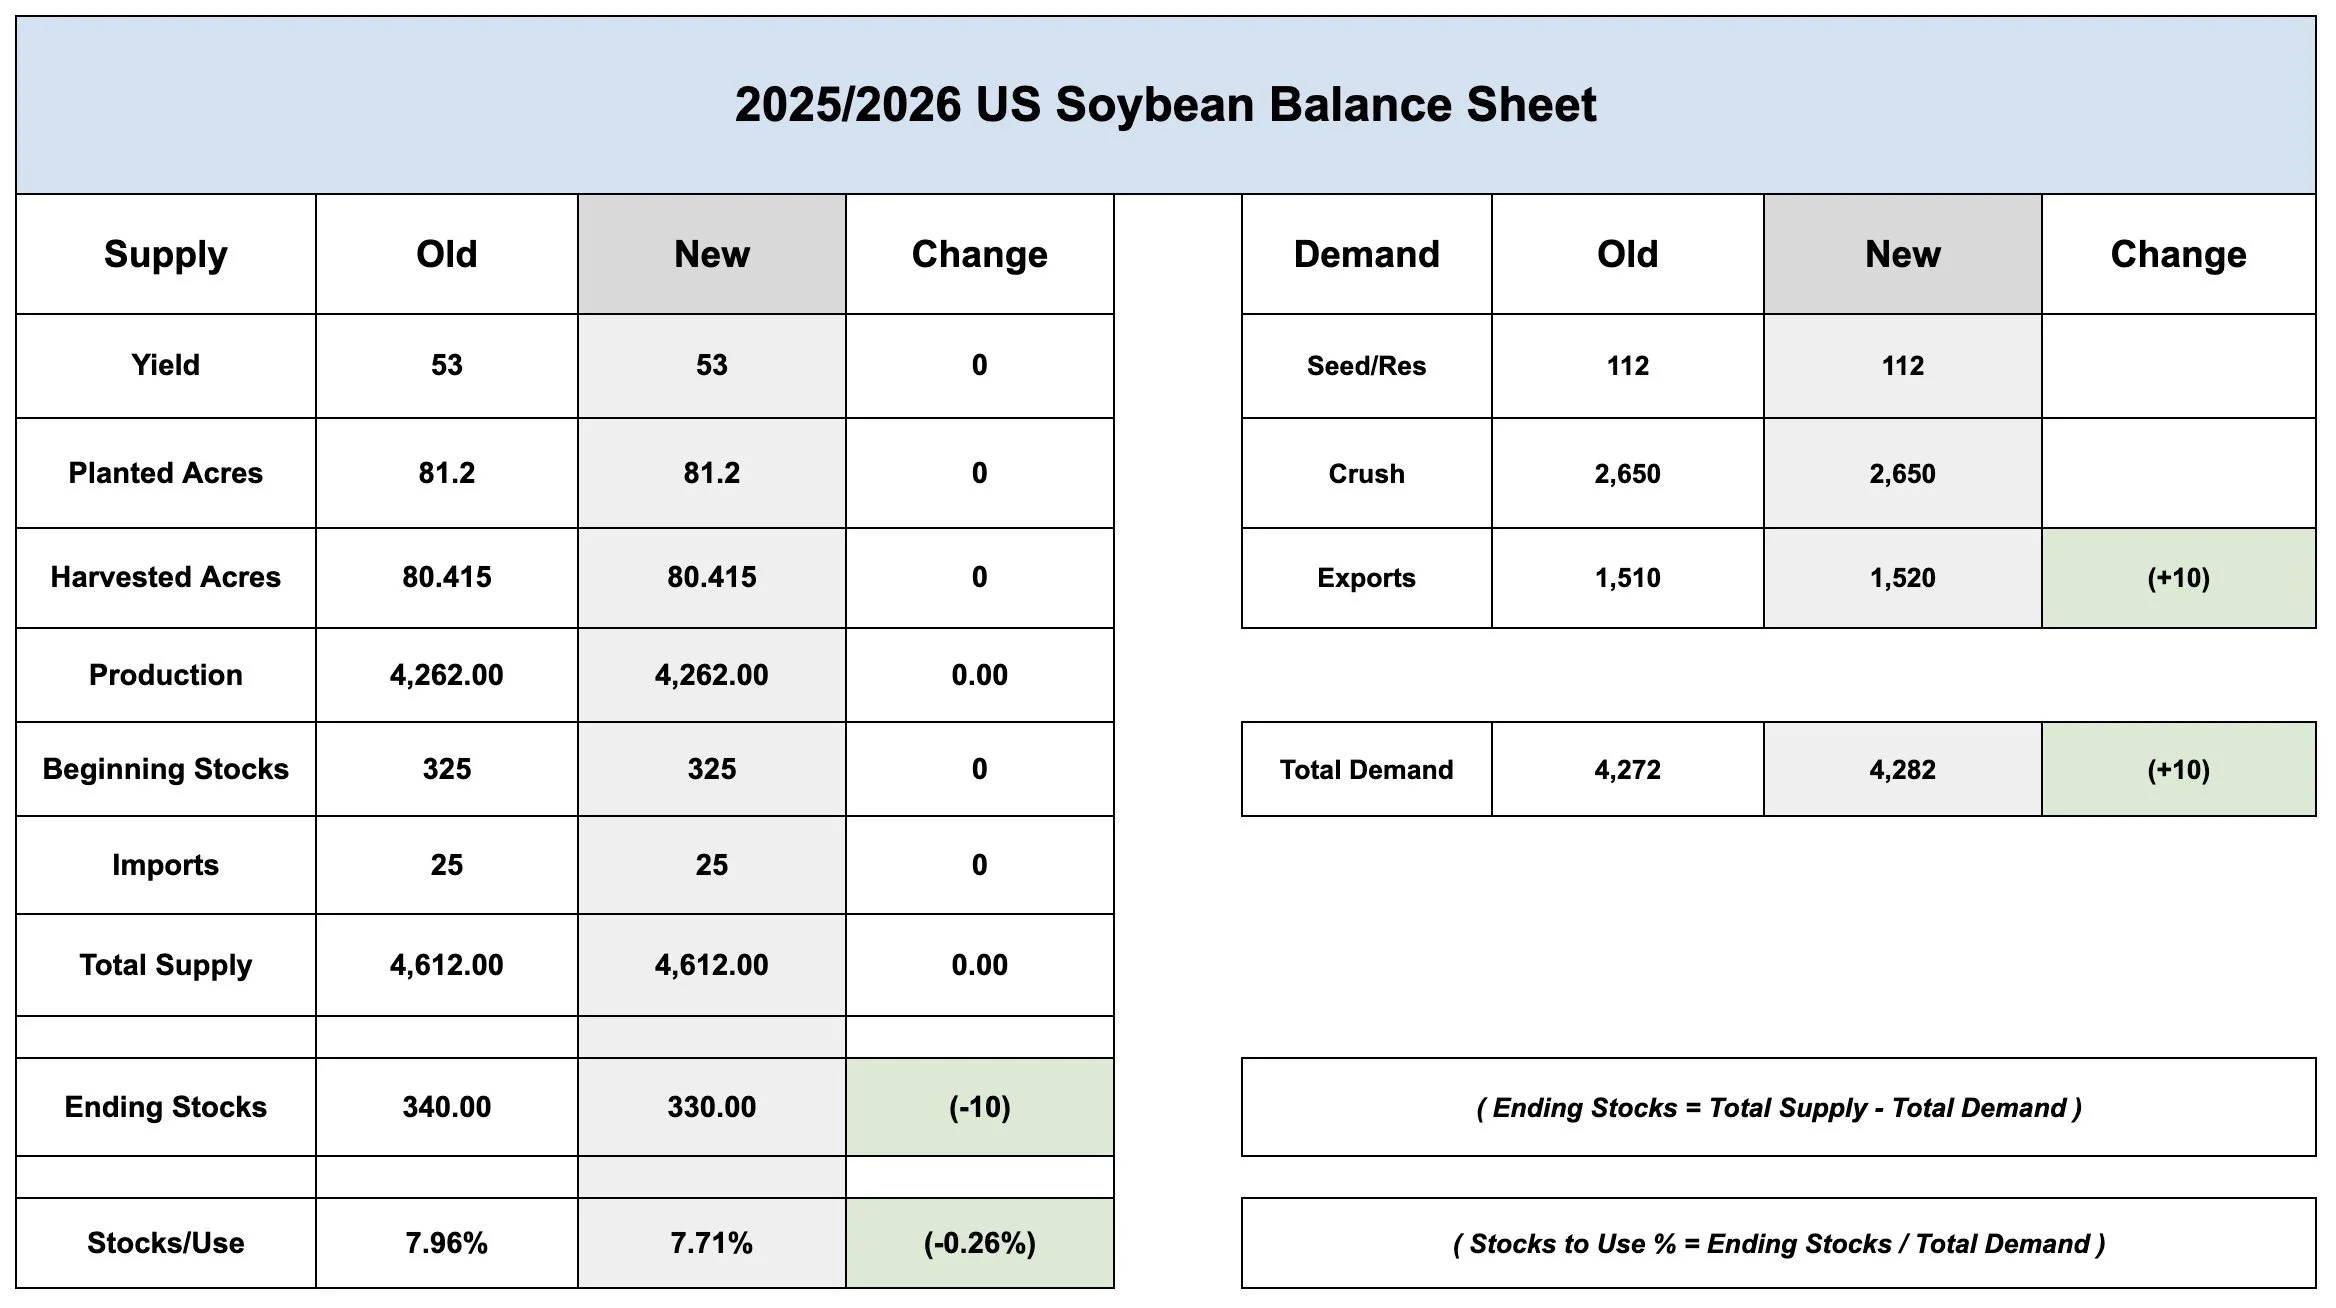
The only change they made was bumping exports by +10 million, which dropped carryout by +10 million.
Soybeans: New Crop Changes
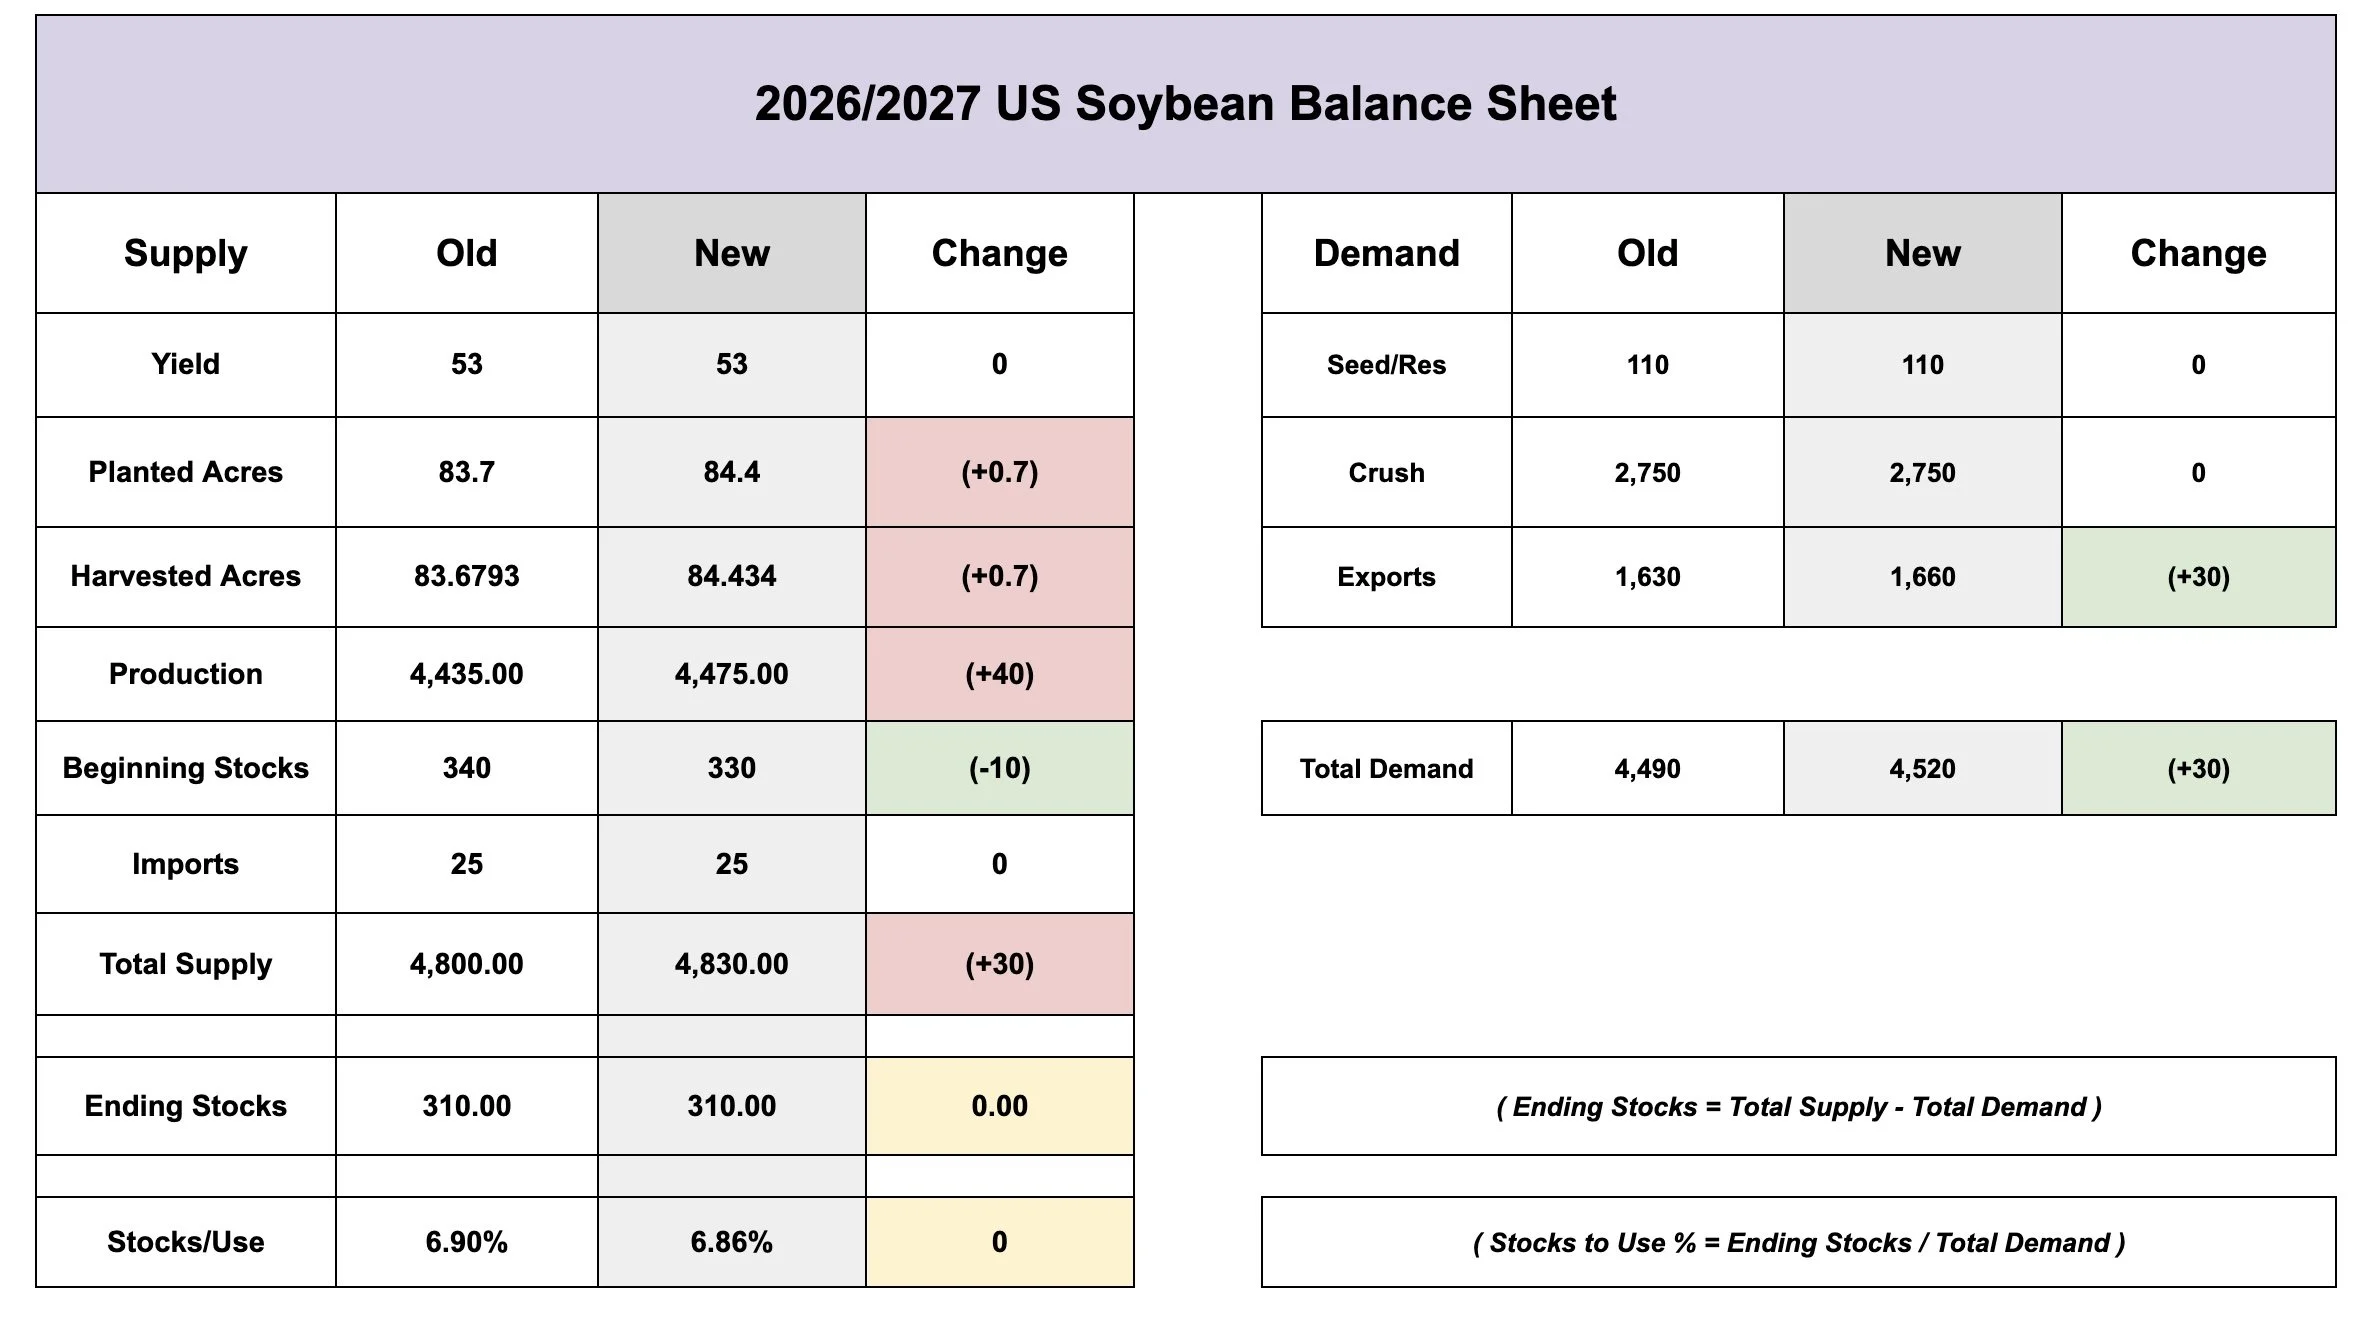
So we got the bump in acres by +0.7 million acres.
However, we then got the -10 million bushel decrease from the old crop carryout dropping.
They also bumped exports by +30 million.
So production increased by +40 million bushels due to the acres.
But the -10 million beginning stocks and +30 million in the exports led to a complete wash on the carryout.
Leaving it at 310 million despite the increase in acres.
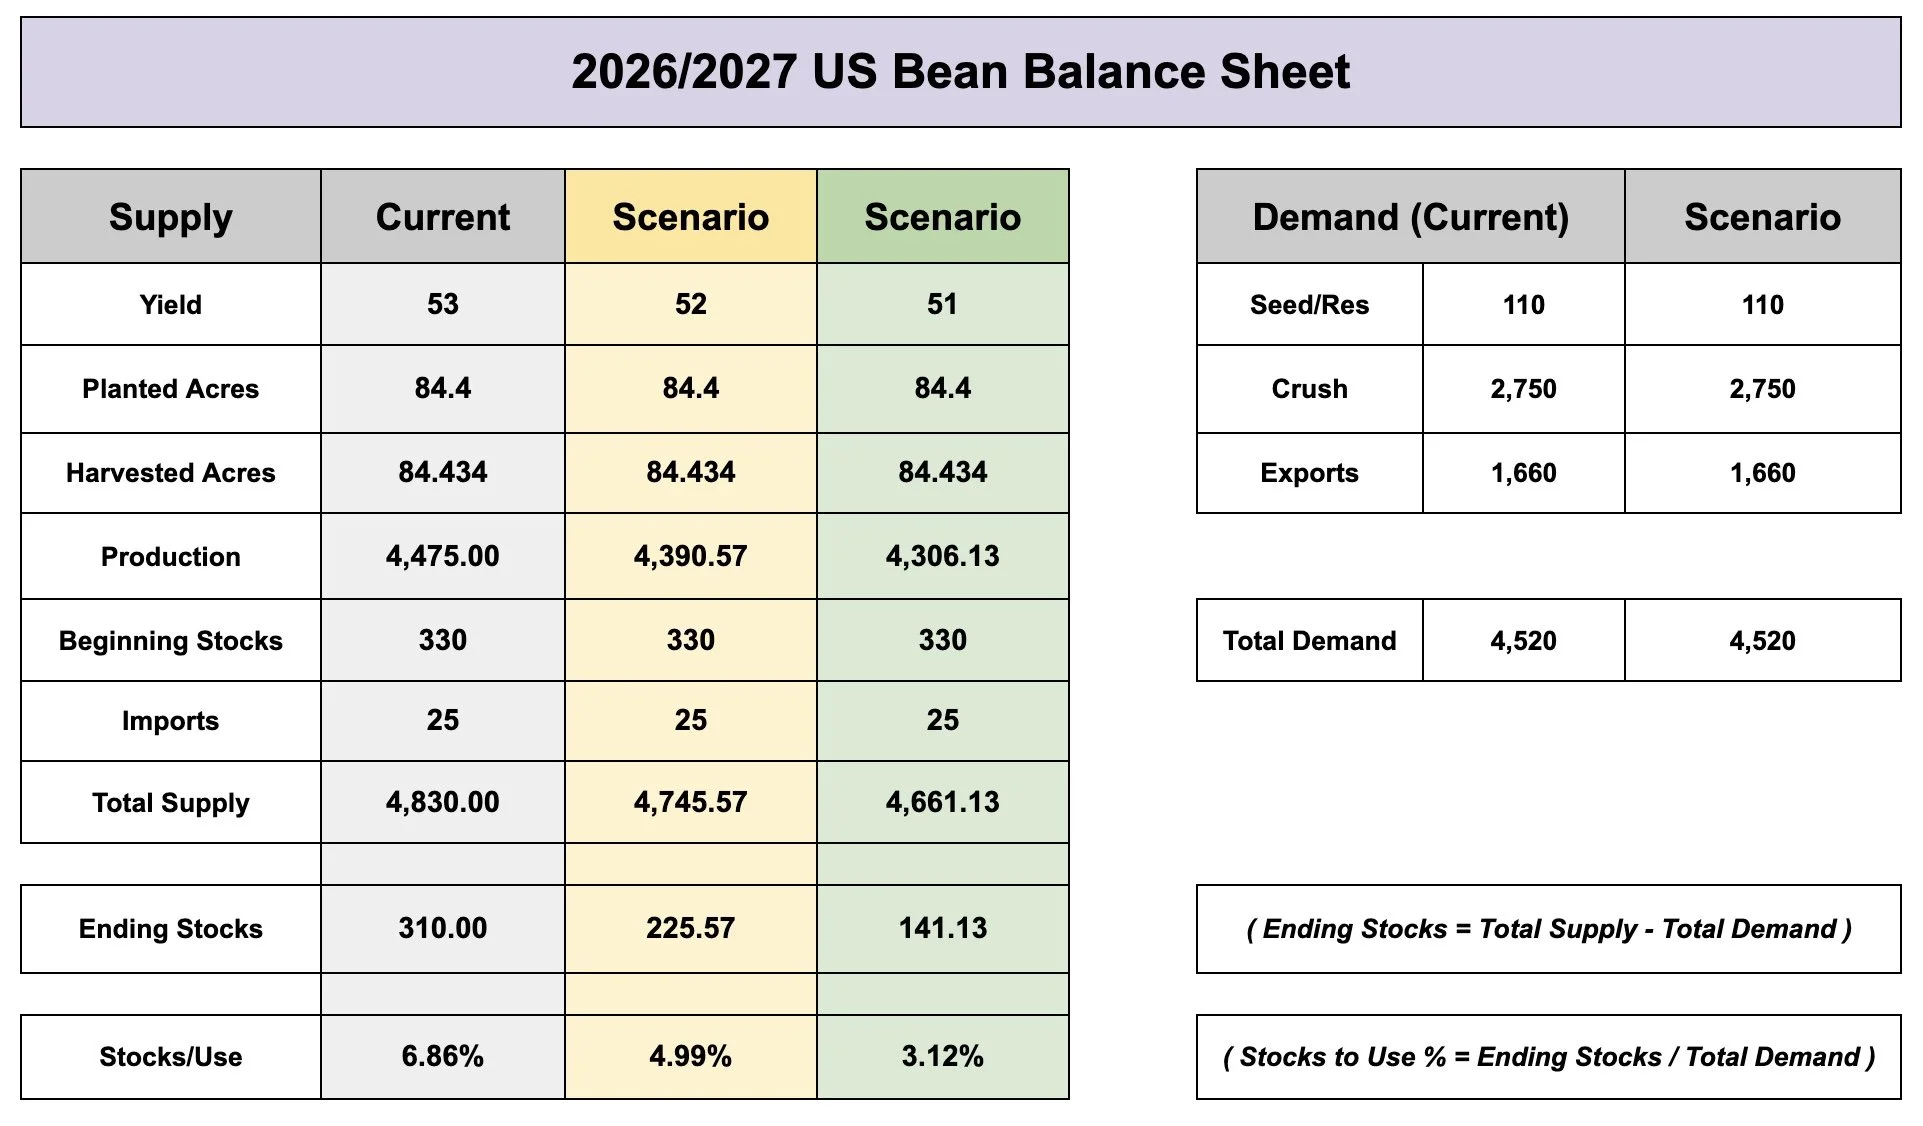
Here is the updated scenarios on how yield could possibly impact the balance sheet before touching demand.
There is still no room for error at all on the soybean balance sheet.
A 52 bpa yield would drop the carryout by 25% while a 51 bpa yield cuts it literally in half.
Again, there will be changes to demand so the impact won’t be quiet that aggresive, but you get the point.
Things get extremely interesting if we are unable to raise yet another record yield.
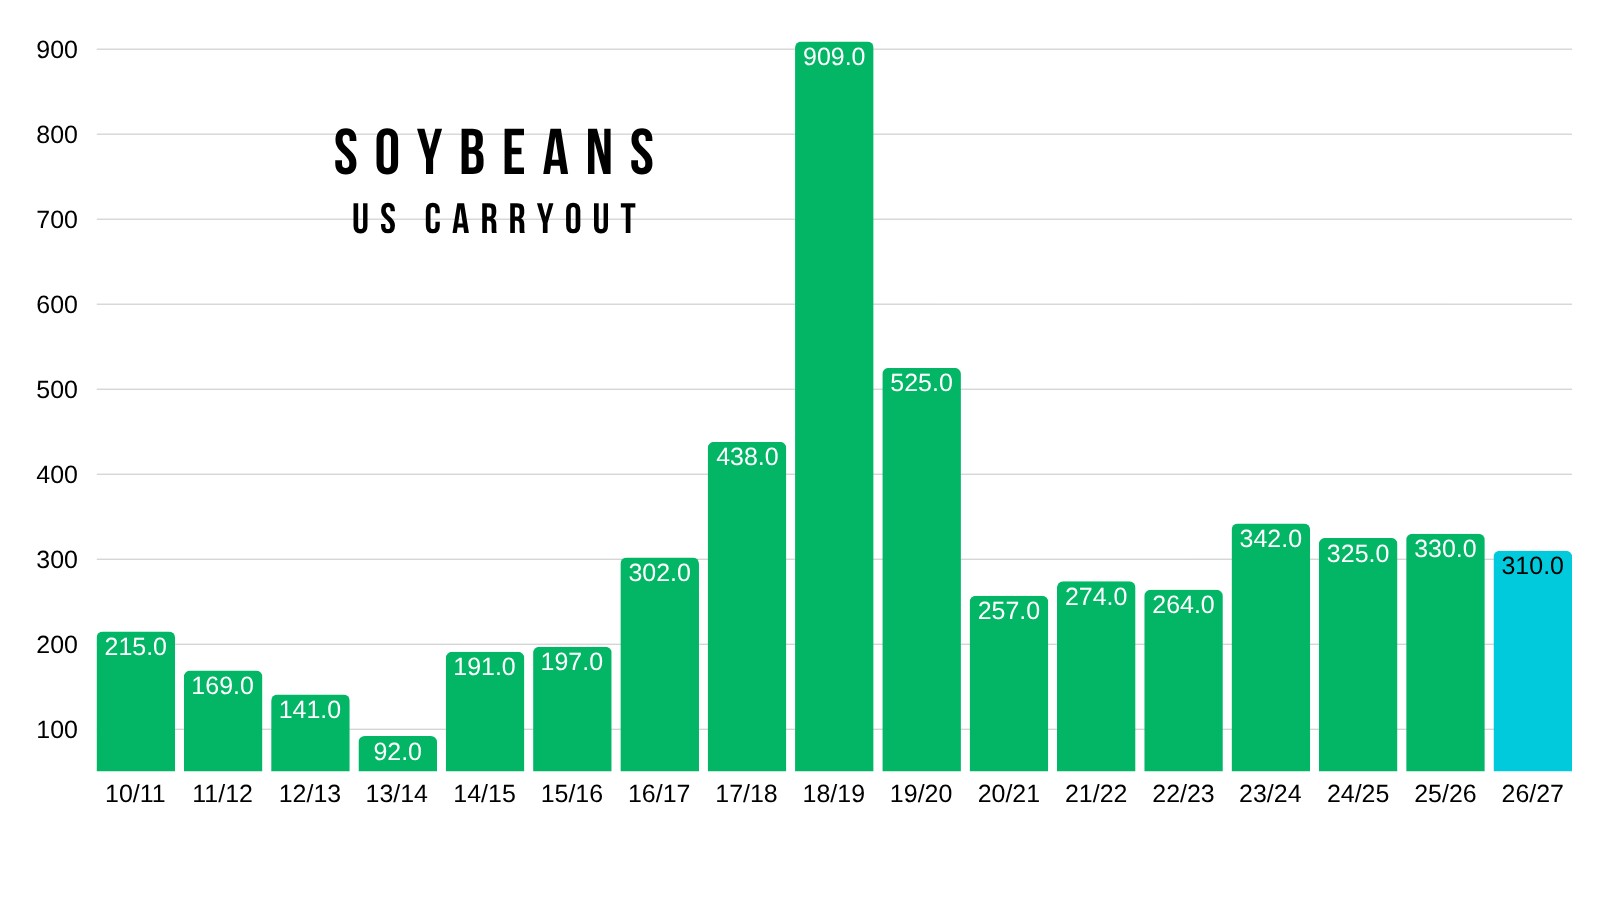
Just for reference, here is a visual of soybean carryout.
Last time we saw sub 300 million was 2020 to 2023.
Today's Main Takeaways
Corn
Despite there being an absolute path way for a friendly story in corn, we do have to keep in mind that this is seasonally a weak time frame.
So it probably makes sense to at least defend this rally here soon if you need to do so.
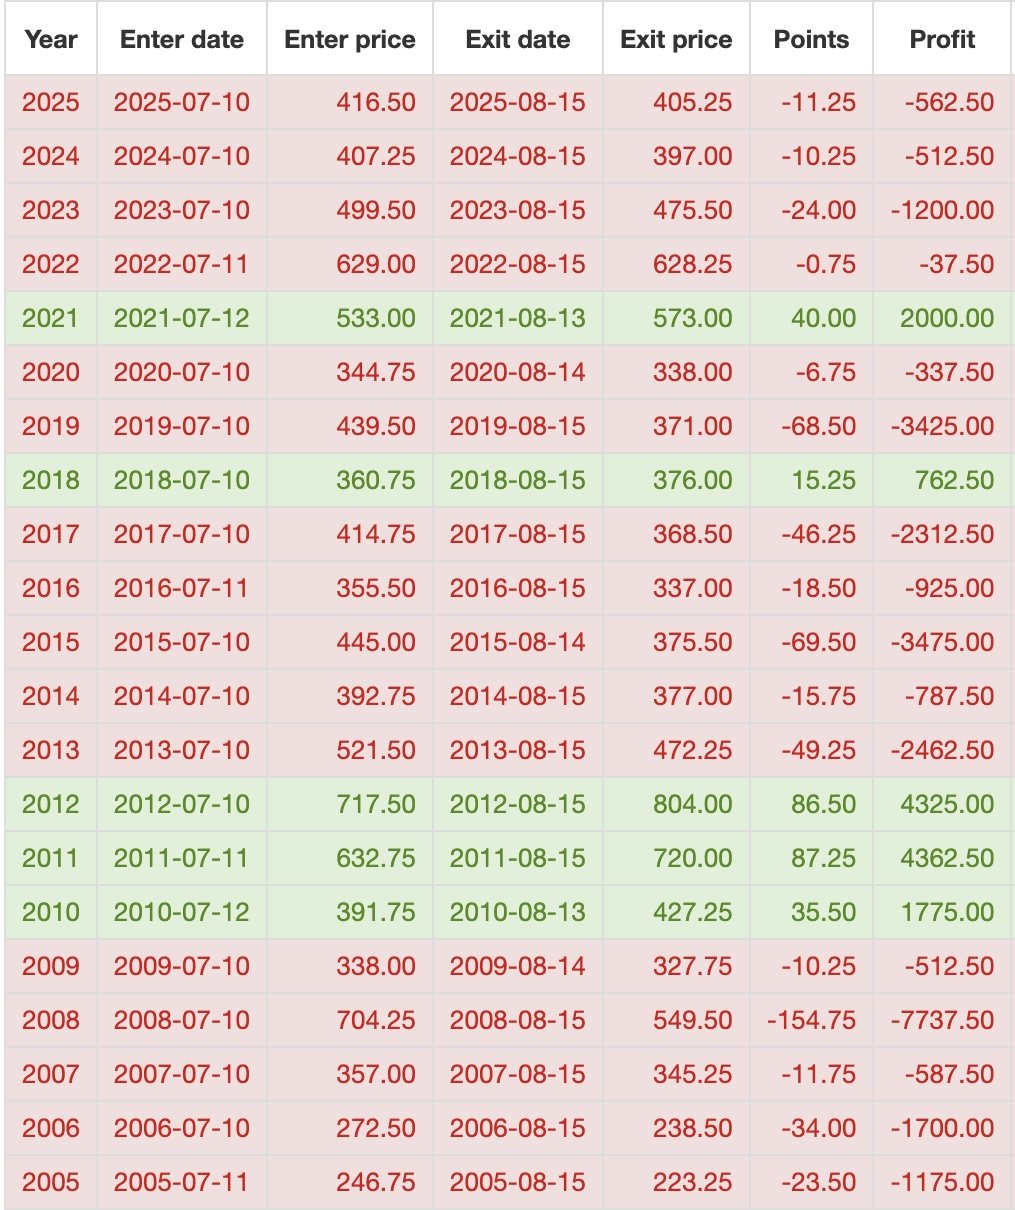
I think we have a ton of potential long term, but we have to keep in mind that we have been lower from today by August 15th in the last 11 of 13 years.
Seasonally we are suppose to be weak until August. Just something we have to keep in mind.
Sep Corn Chart:
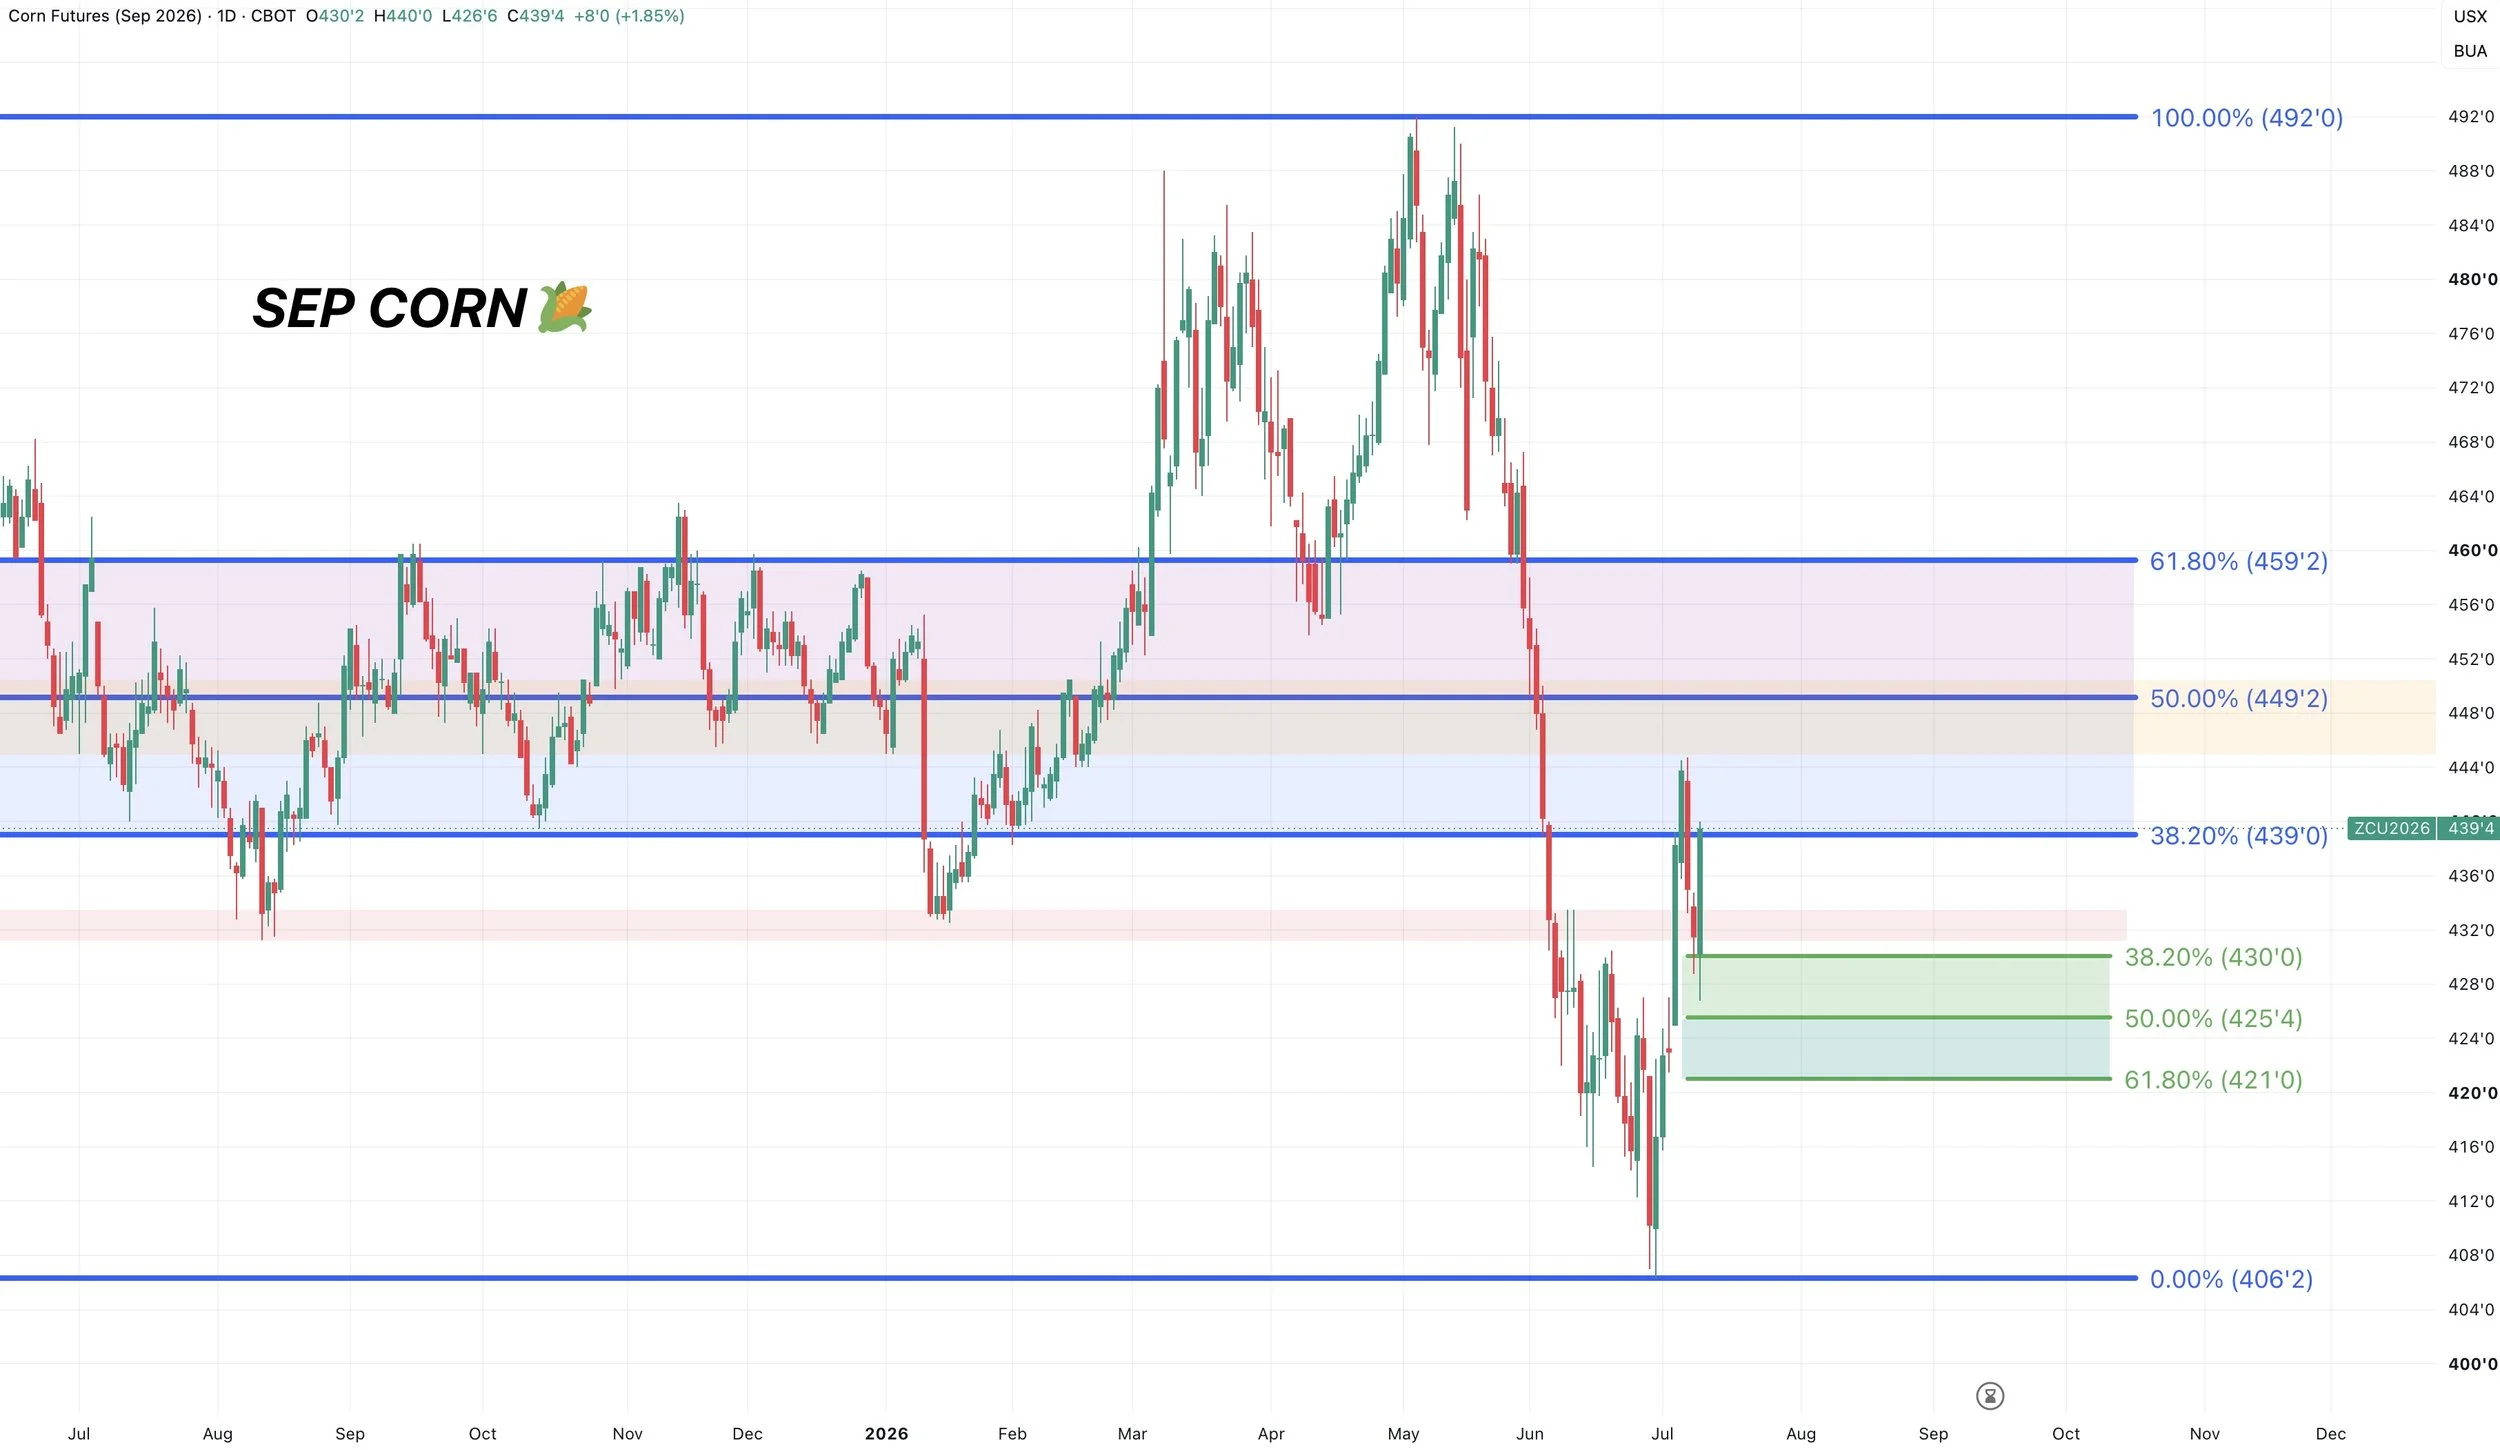
We had an outside up day today, which is friendly.
Meaning we took out yesterday’s lows but closed above yesterday’s highs. So we'd like to see some follow through strength.
We still want to reward a move towards $4.49 if we get there.
$4.49 claws back 50% of the entire sell off.
It's an area of high volume and prior support.
Dec Corn Chart:
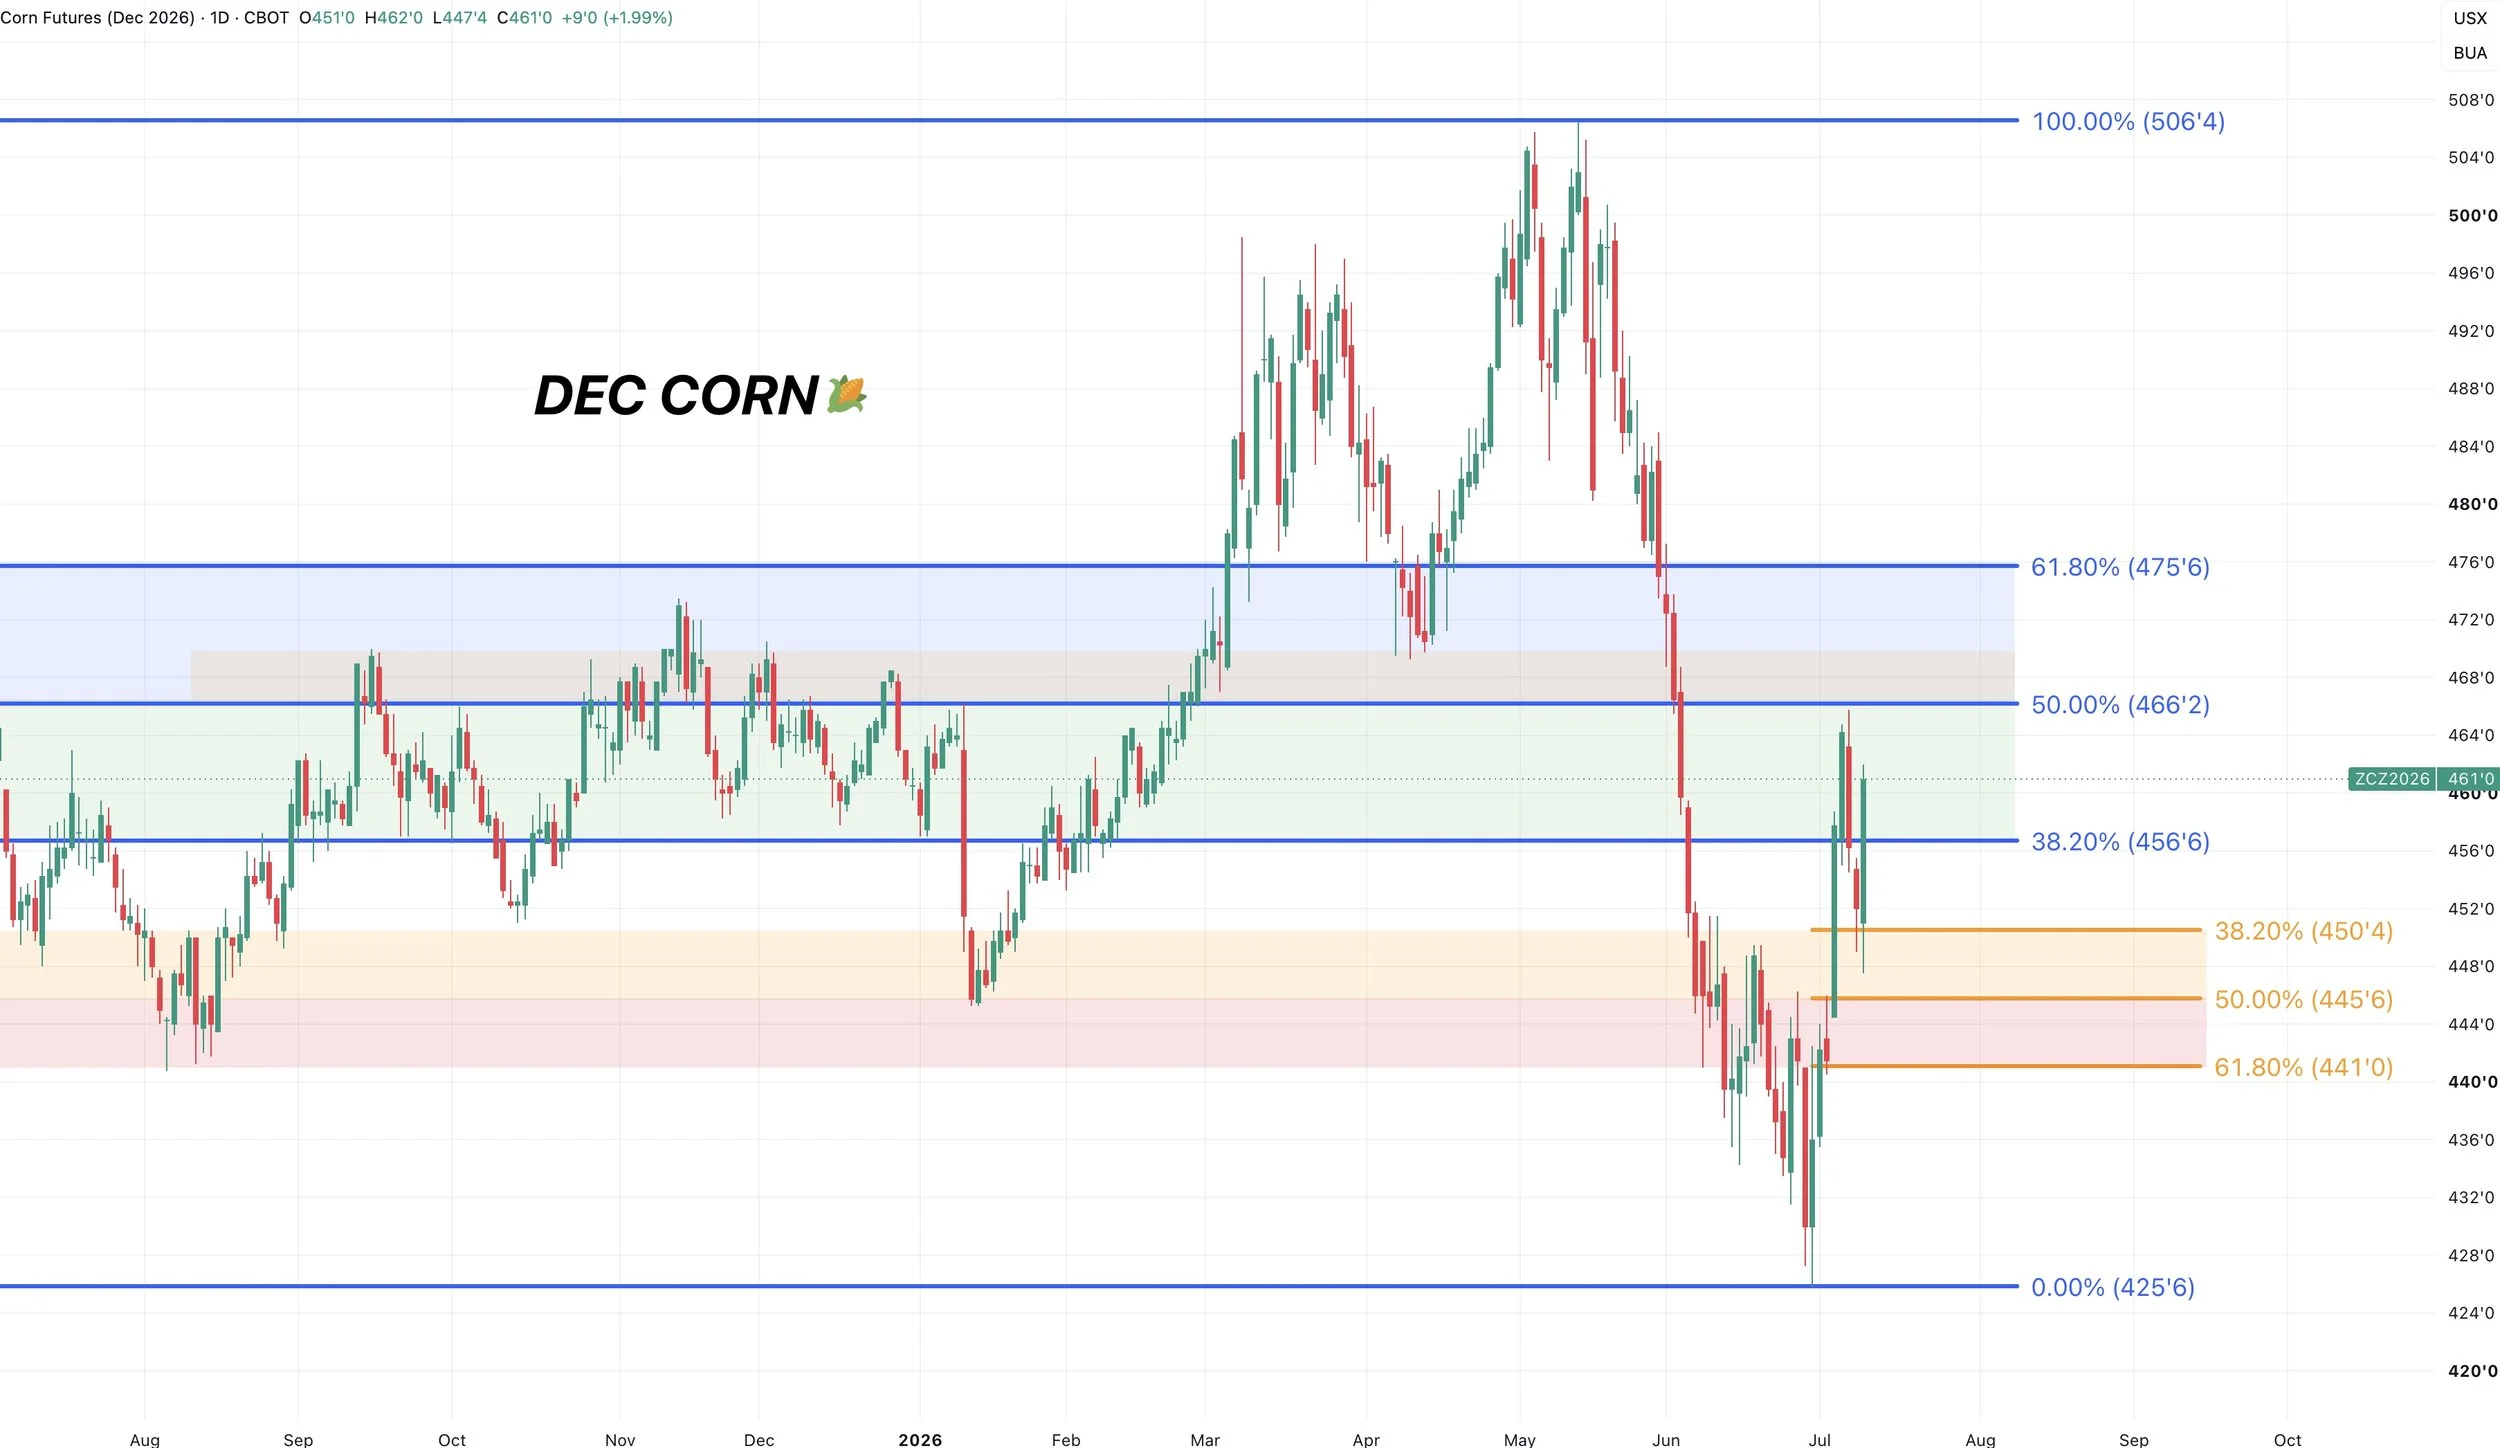
Like in Sep, we had an outside up day which is positive. But we need to see some follow through.
We still want to reward a move towards $4.65 to $4.70 if it comes.
Which we did tag once already.
$4.66 claws back 50% of the entire sell off.
$4.70 has been key support and resistance in the past.
It's where we failed time and time again in the fall. It's where we bounced in April.
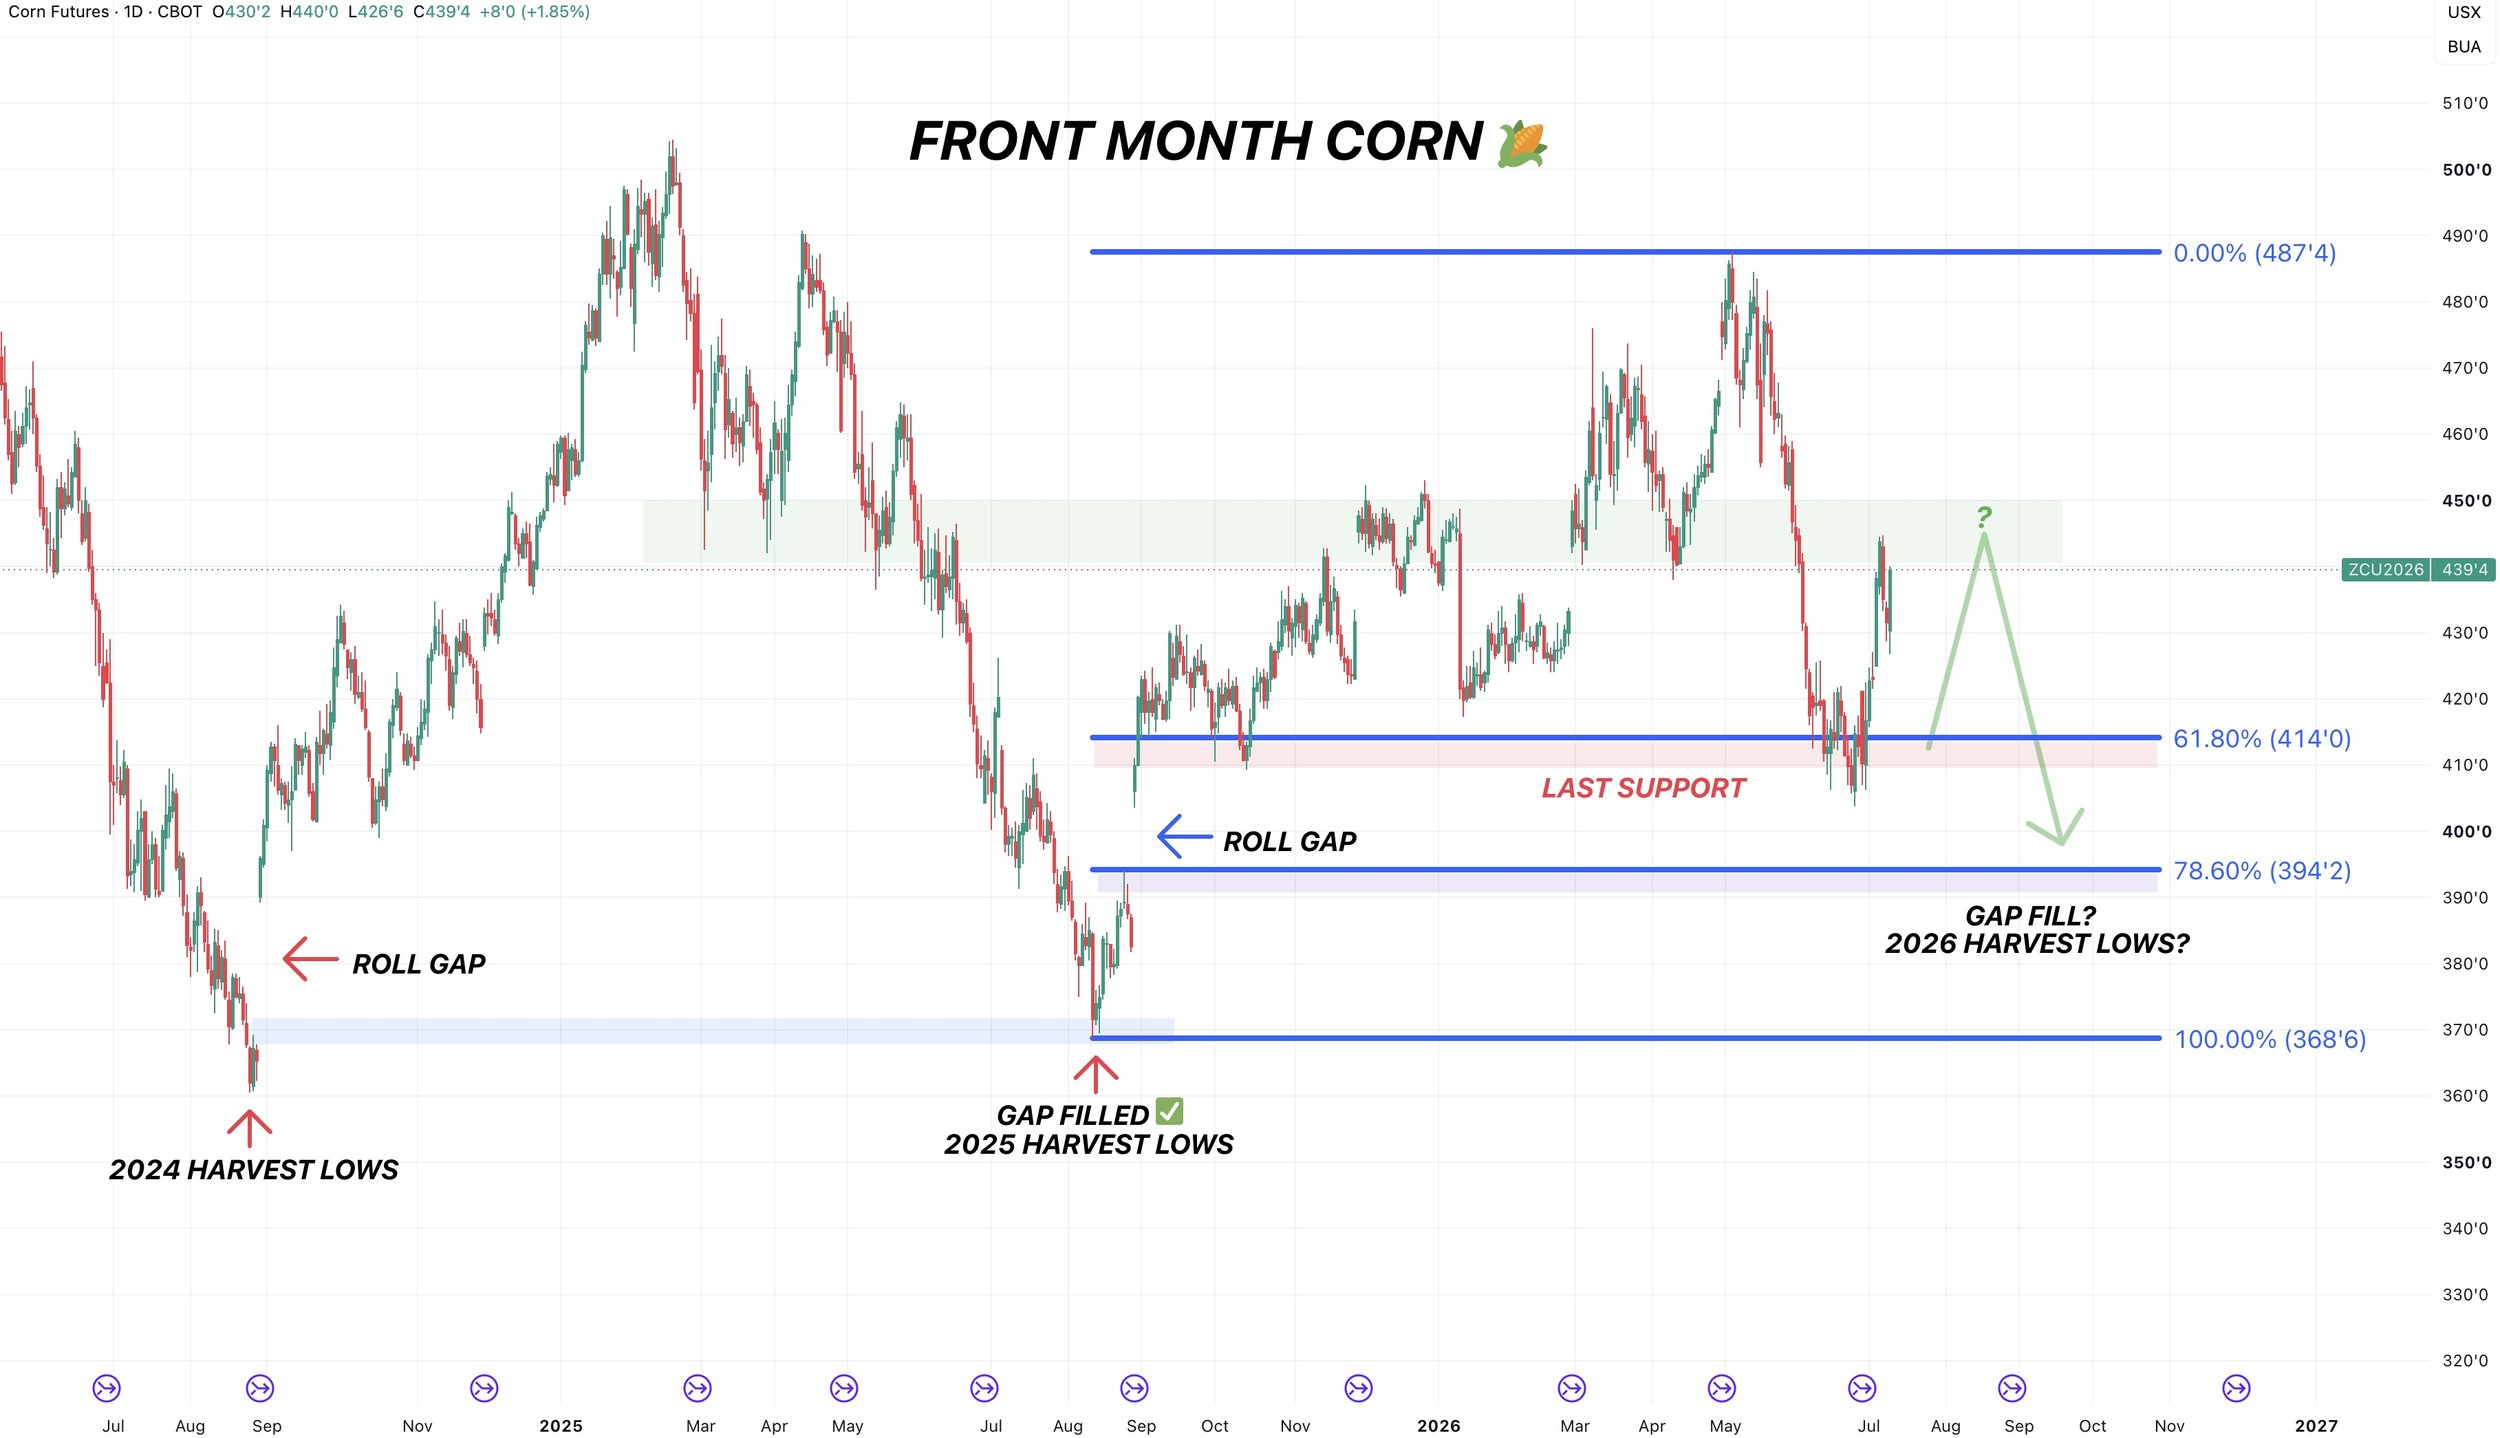
Continuous Daily Chart:
We bounced right at our last level of support on this chart right where we needed to see it happen.
We are now approaching some possible resistance up at these levels.
The April lows and highs from last fall.
Continuous Weekly Chart:
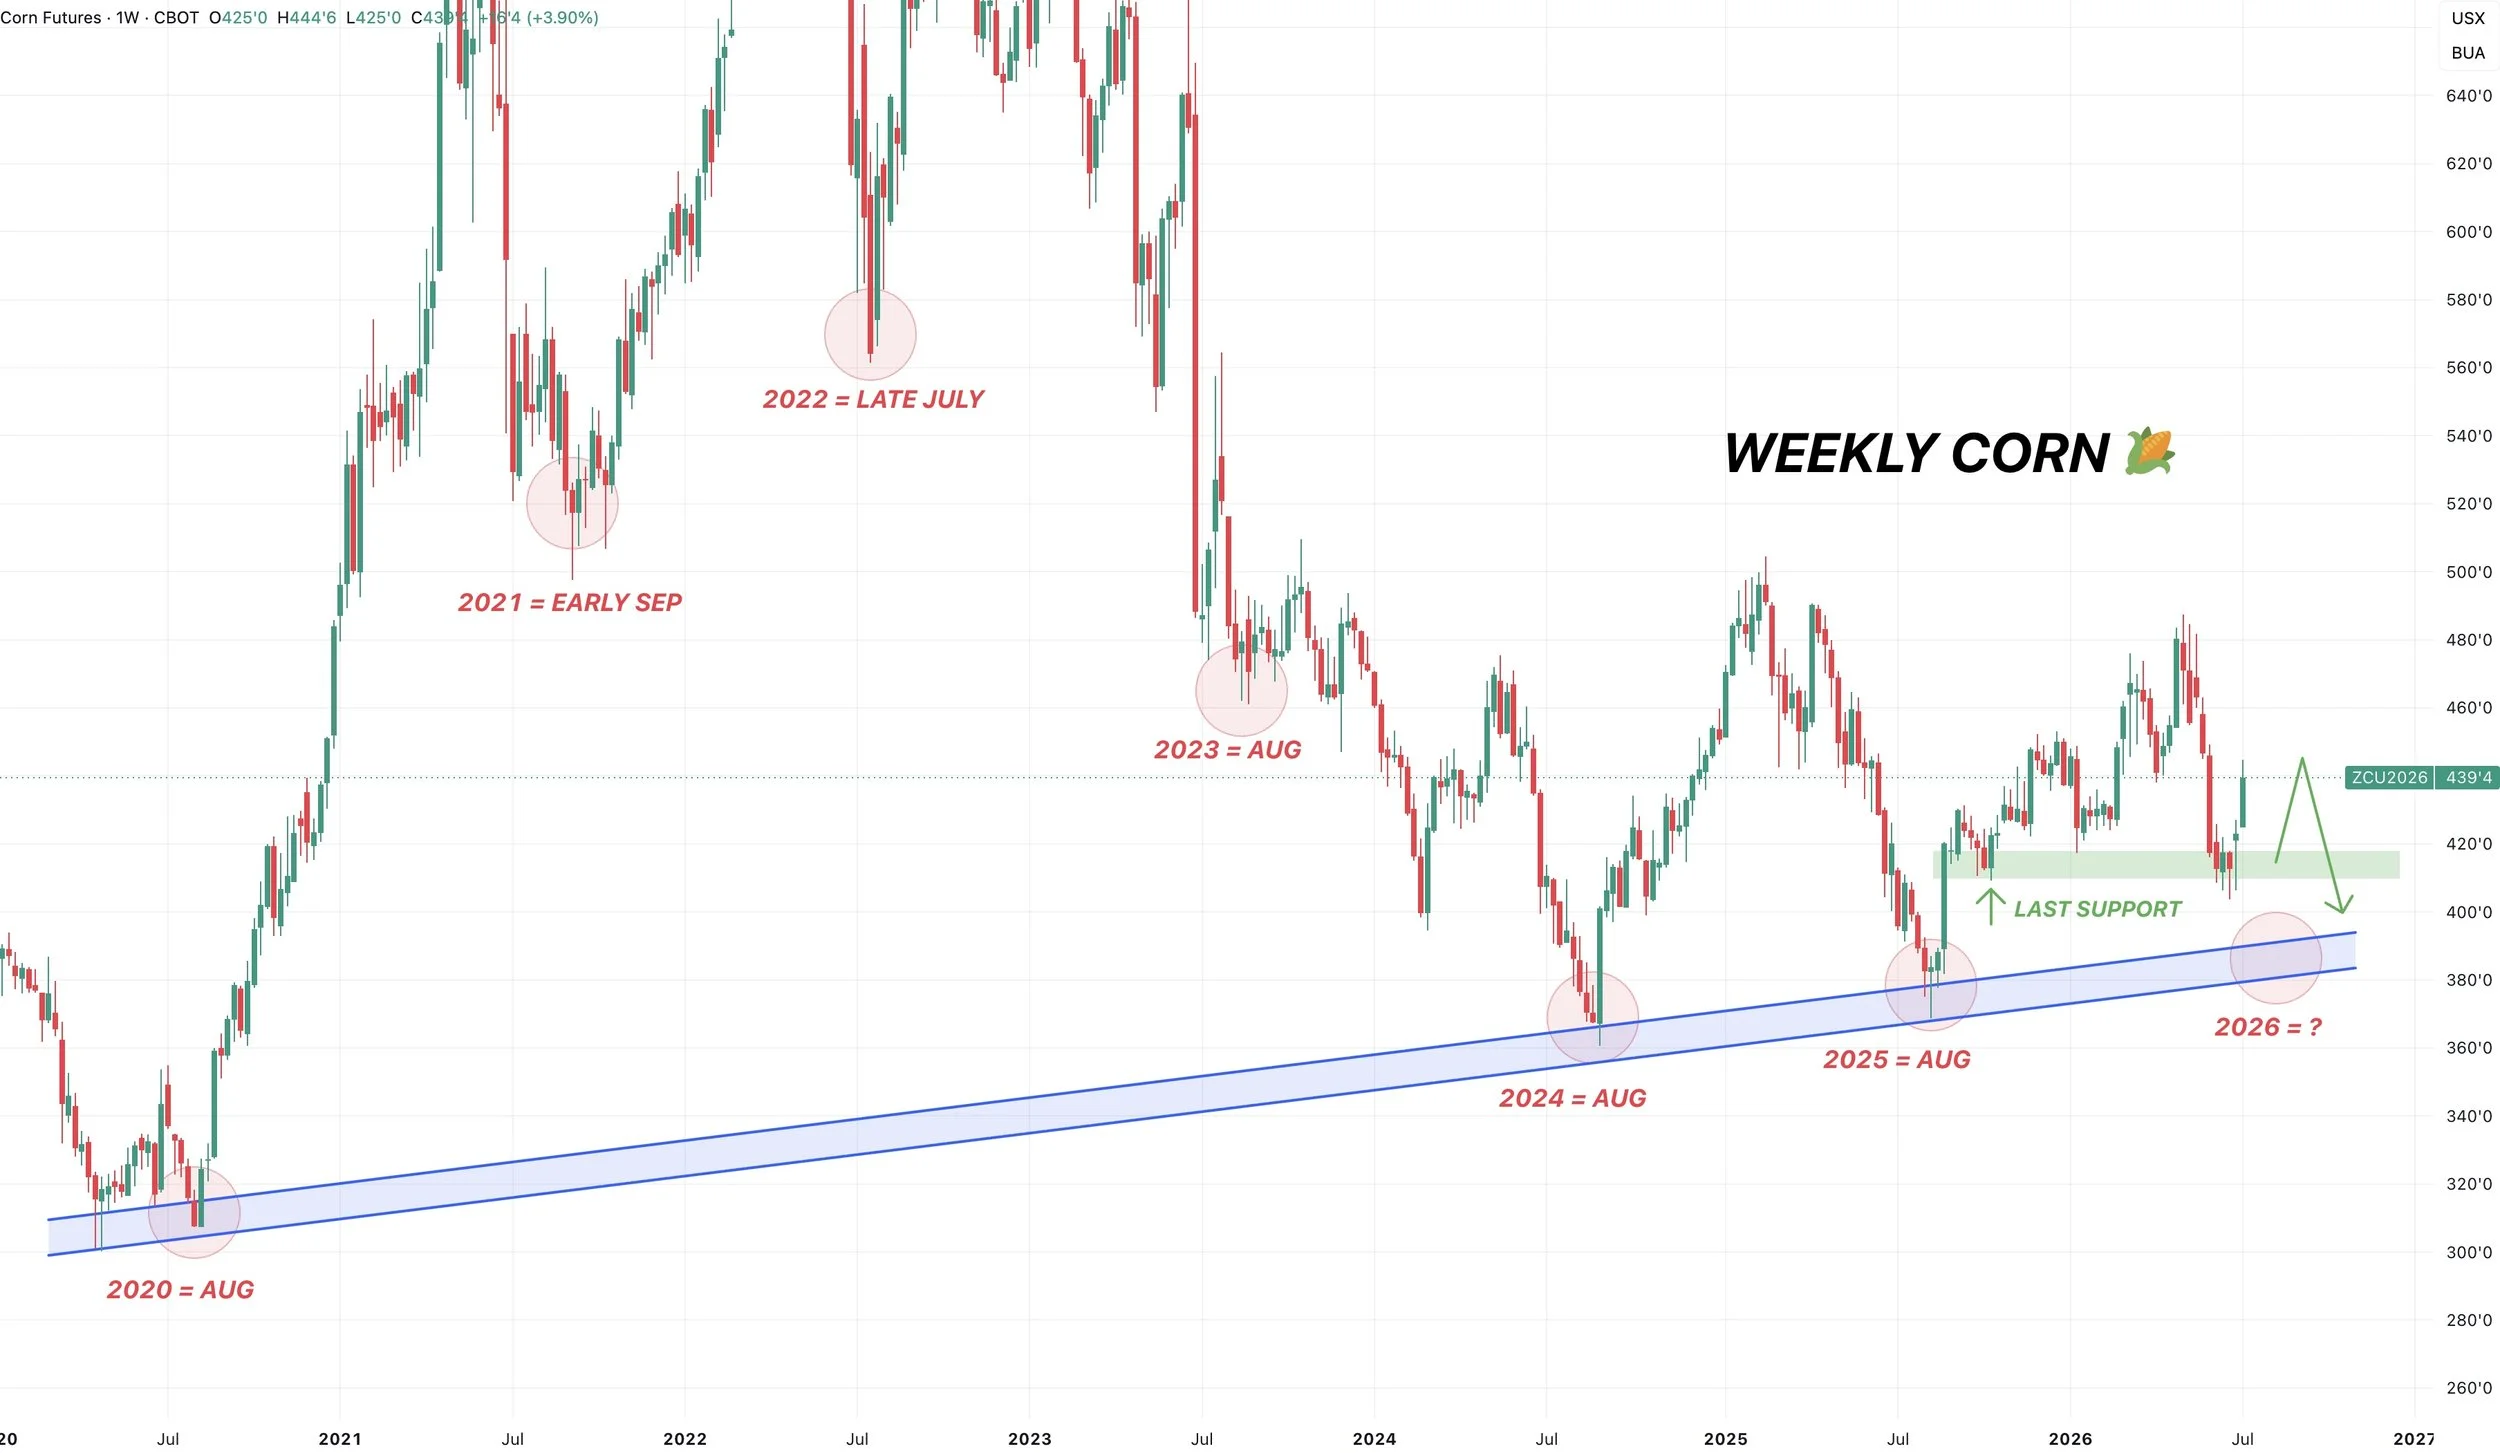
I still think there is a real possibility for us to post another leg lower into those harvest lows.
It doesn’t "have" to happen, but I think it's definitely a possibility.
Unless weather really turns or unless China steps into this market. Then we can of course simply go higher from here and the lows could be in.
If weather is favorable, and China does not step in yet, I think we could still head lower into harvest.
Our Past Several Harvest Lows:
2025: Aug
2024: Aug
2023: Aug
2022: Late July
2021: Early Sep
2020: Aug
2019: Aug
Doesn’t have to happen, maybe we've seen the lows, but it's a reason why it might make sense to at the very least defend these levels soon if you are someone who doesn’t have a lot of time on your hands or flexibility.
Soybeans
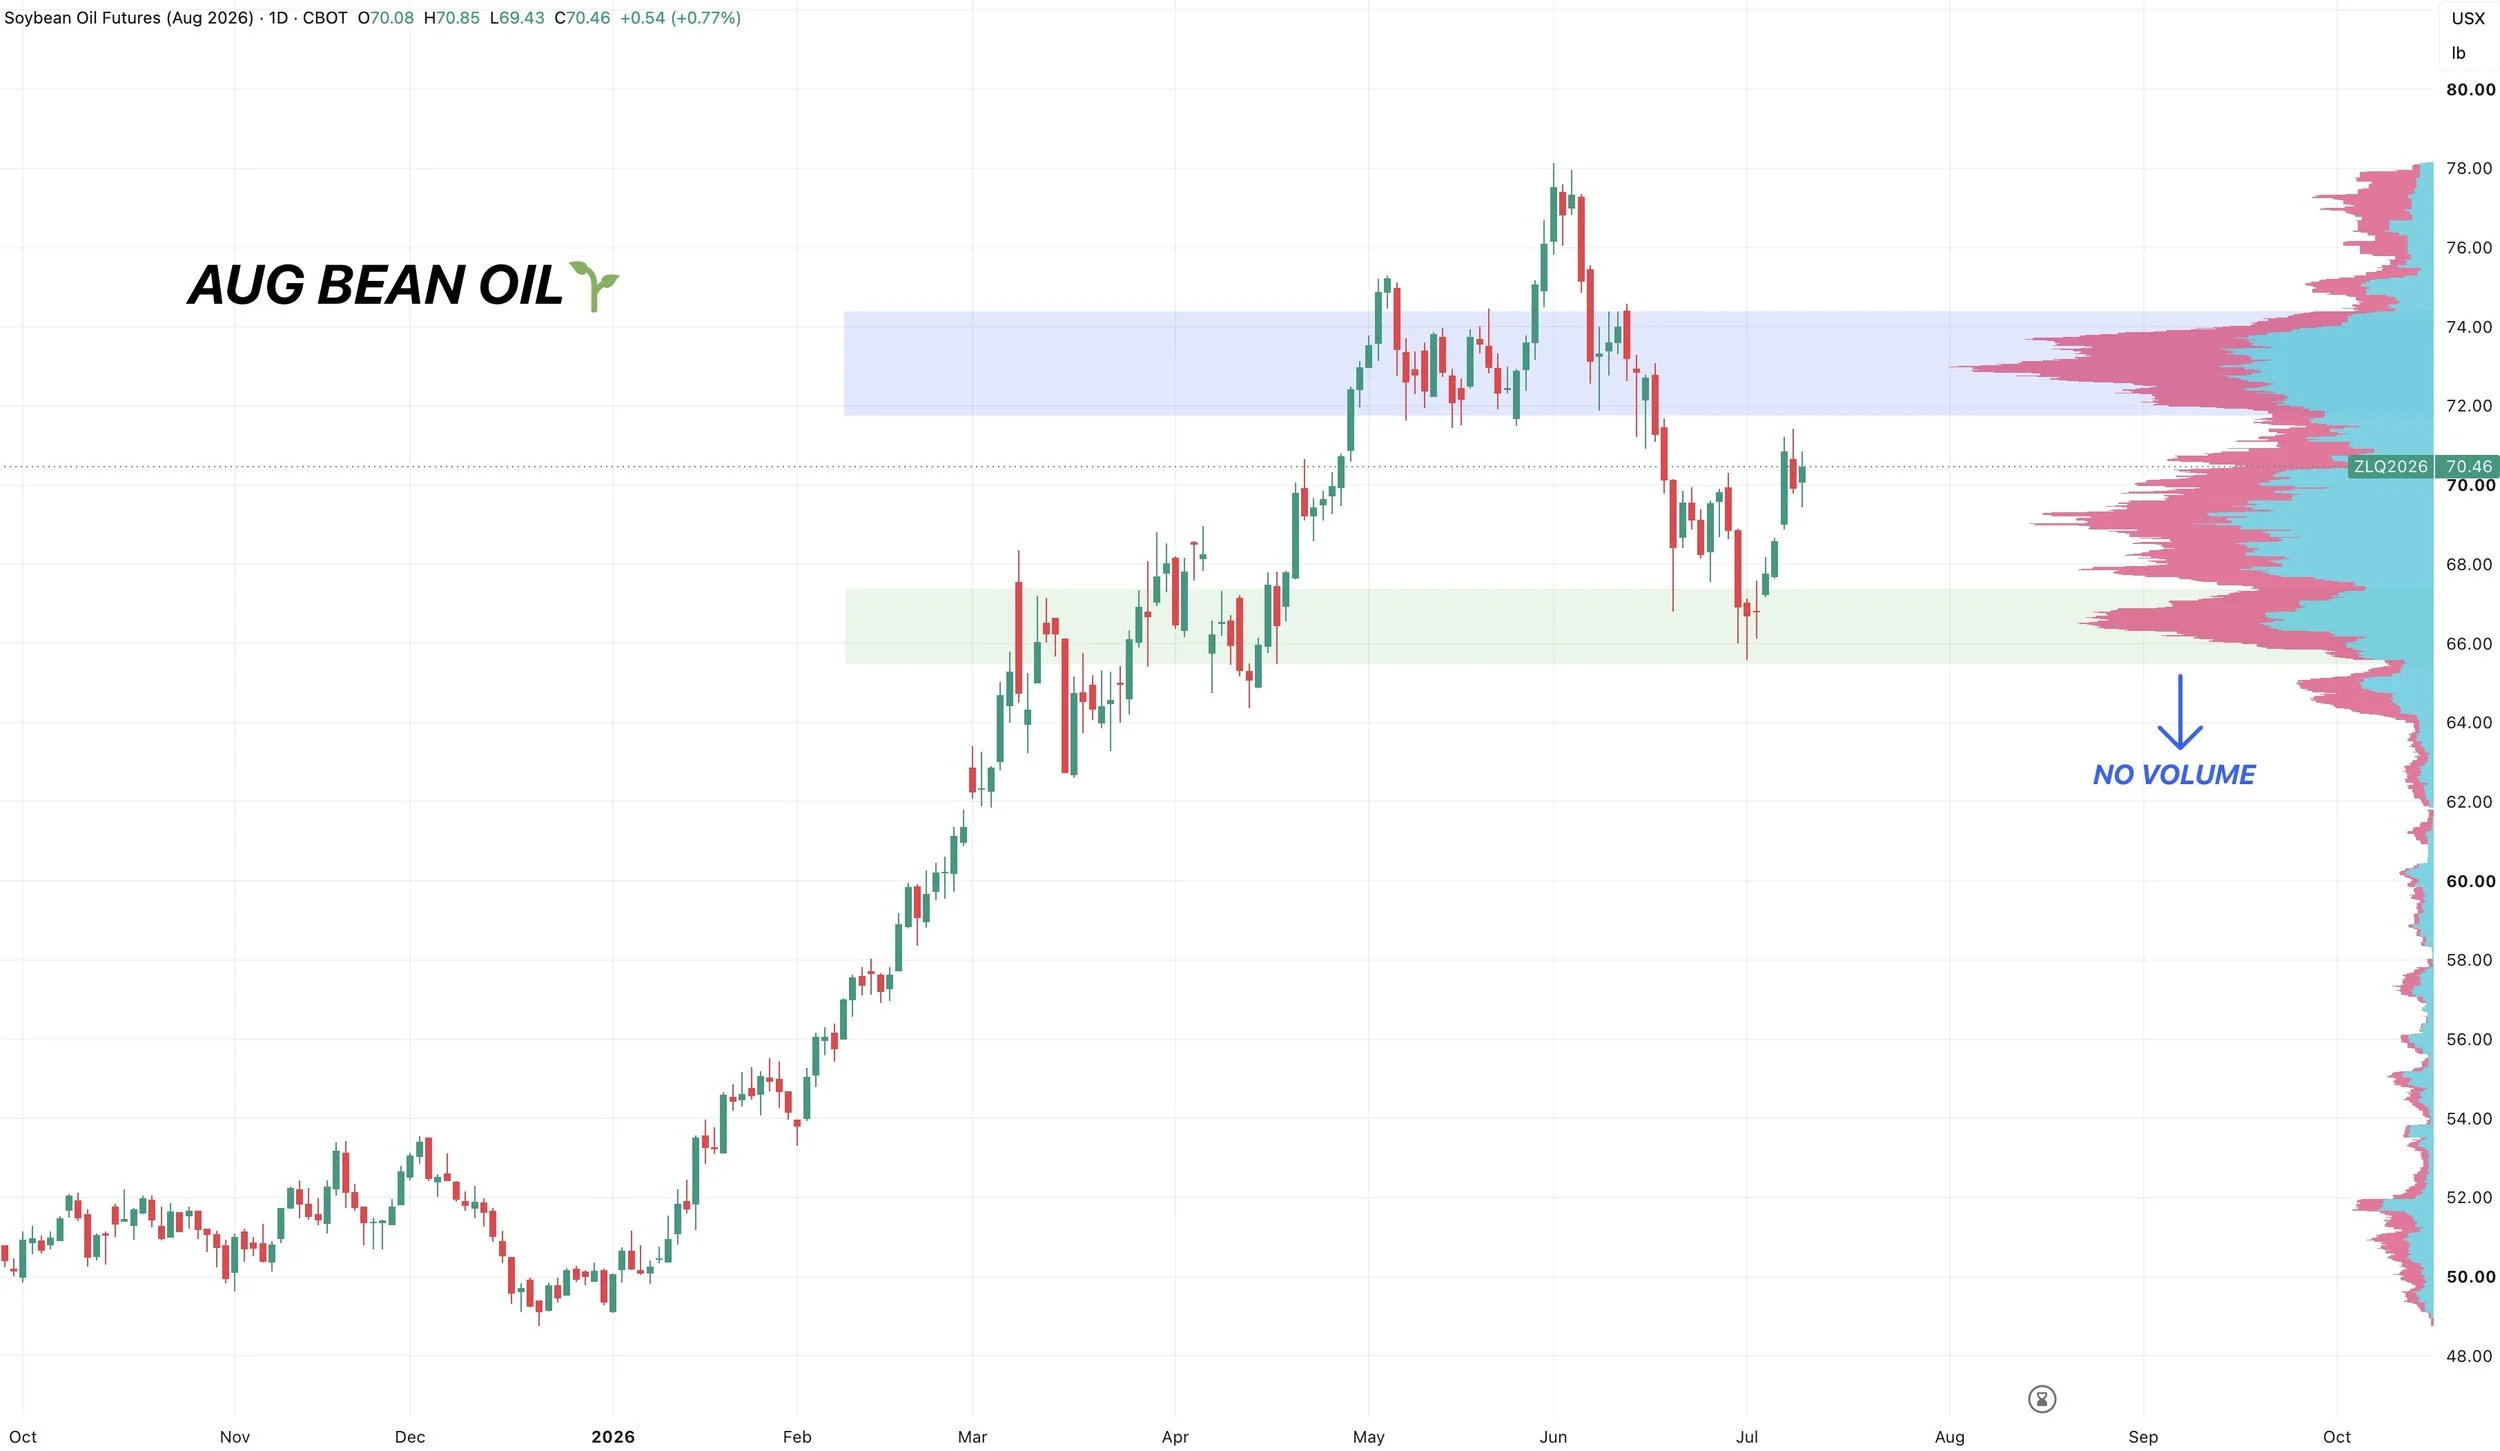
Aug Bean Oil Chart:
Funds are defending their longs in the soybean complex largely due to bean oil.
Bean oil continues to hold support. So unless bean oil starts to break down, I don't see why the funds would puke out and get too short soybeans.
We continue to hold this volume shelf. Which is an important area because there is zero support below.
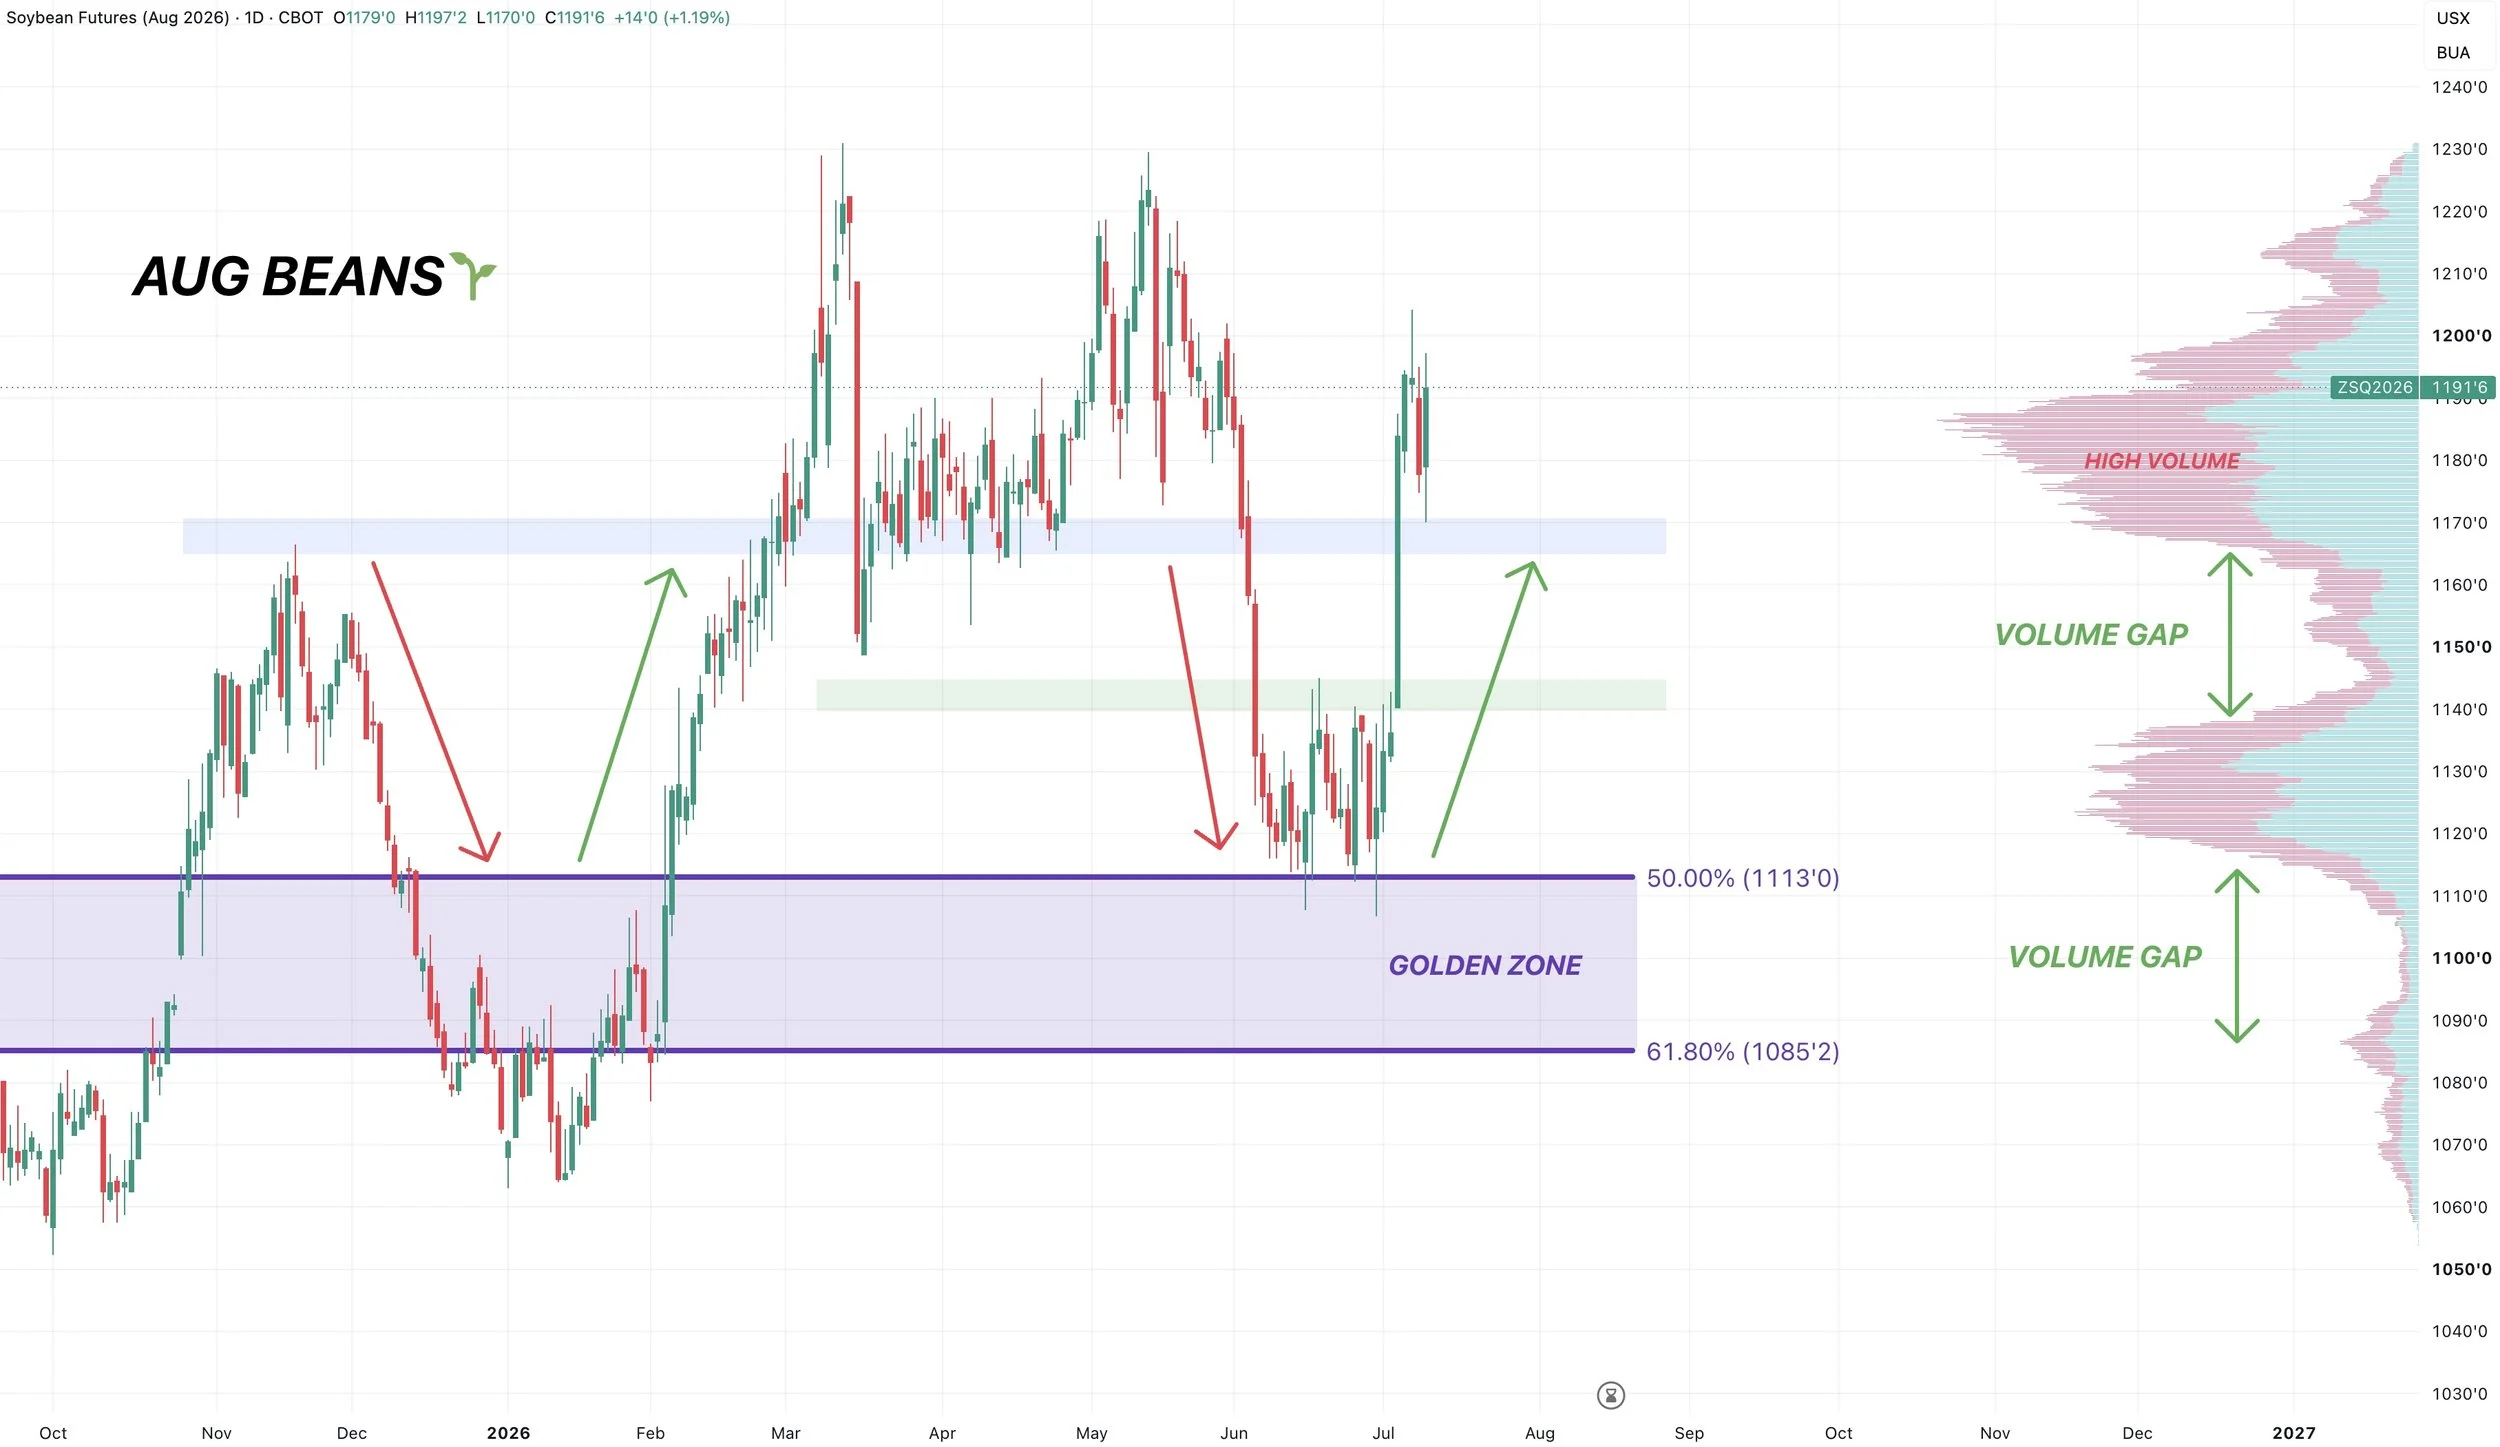
Aug Beans Chart:
We sent out that sell signal and hedge alert earlier this week. Our first since May 12th.
If you haven’t, I still think it makes sense to do some catch up at these levels.
Currently, we are struggling at this area of high volume after slicing right through that volume gap we had been talking about for weeks.
Areas of high volume act as magnets. So it wouldn’t be a shock to see this offer resistance.
If we break above this area of volume, the next big resistance is really going to be the highs.
On the flip side, we want to hold that $11.65 level and the bottom of that old range we were trapped in back in the spring.
As there is still a volume gap to the downside, meaning no support.
Every time we have traded below that level, we have sliced right through. Both to the uspide as well as the downside.
It has happened on 4 separate occasions now.
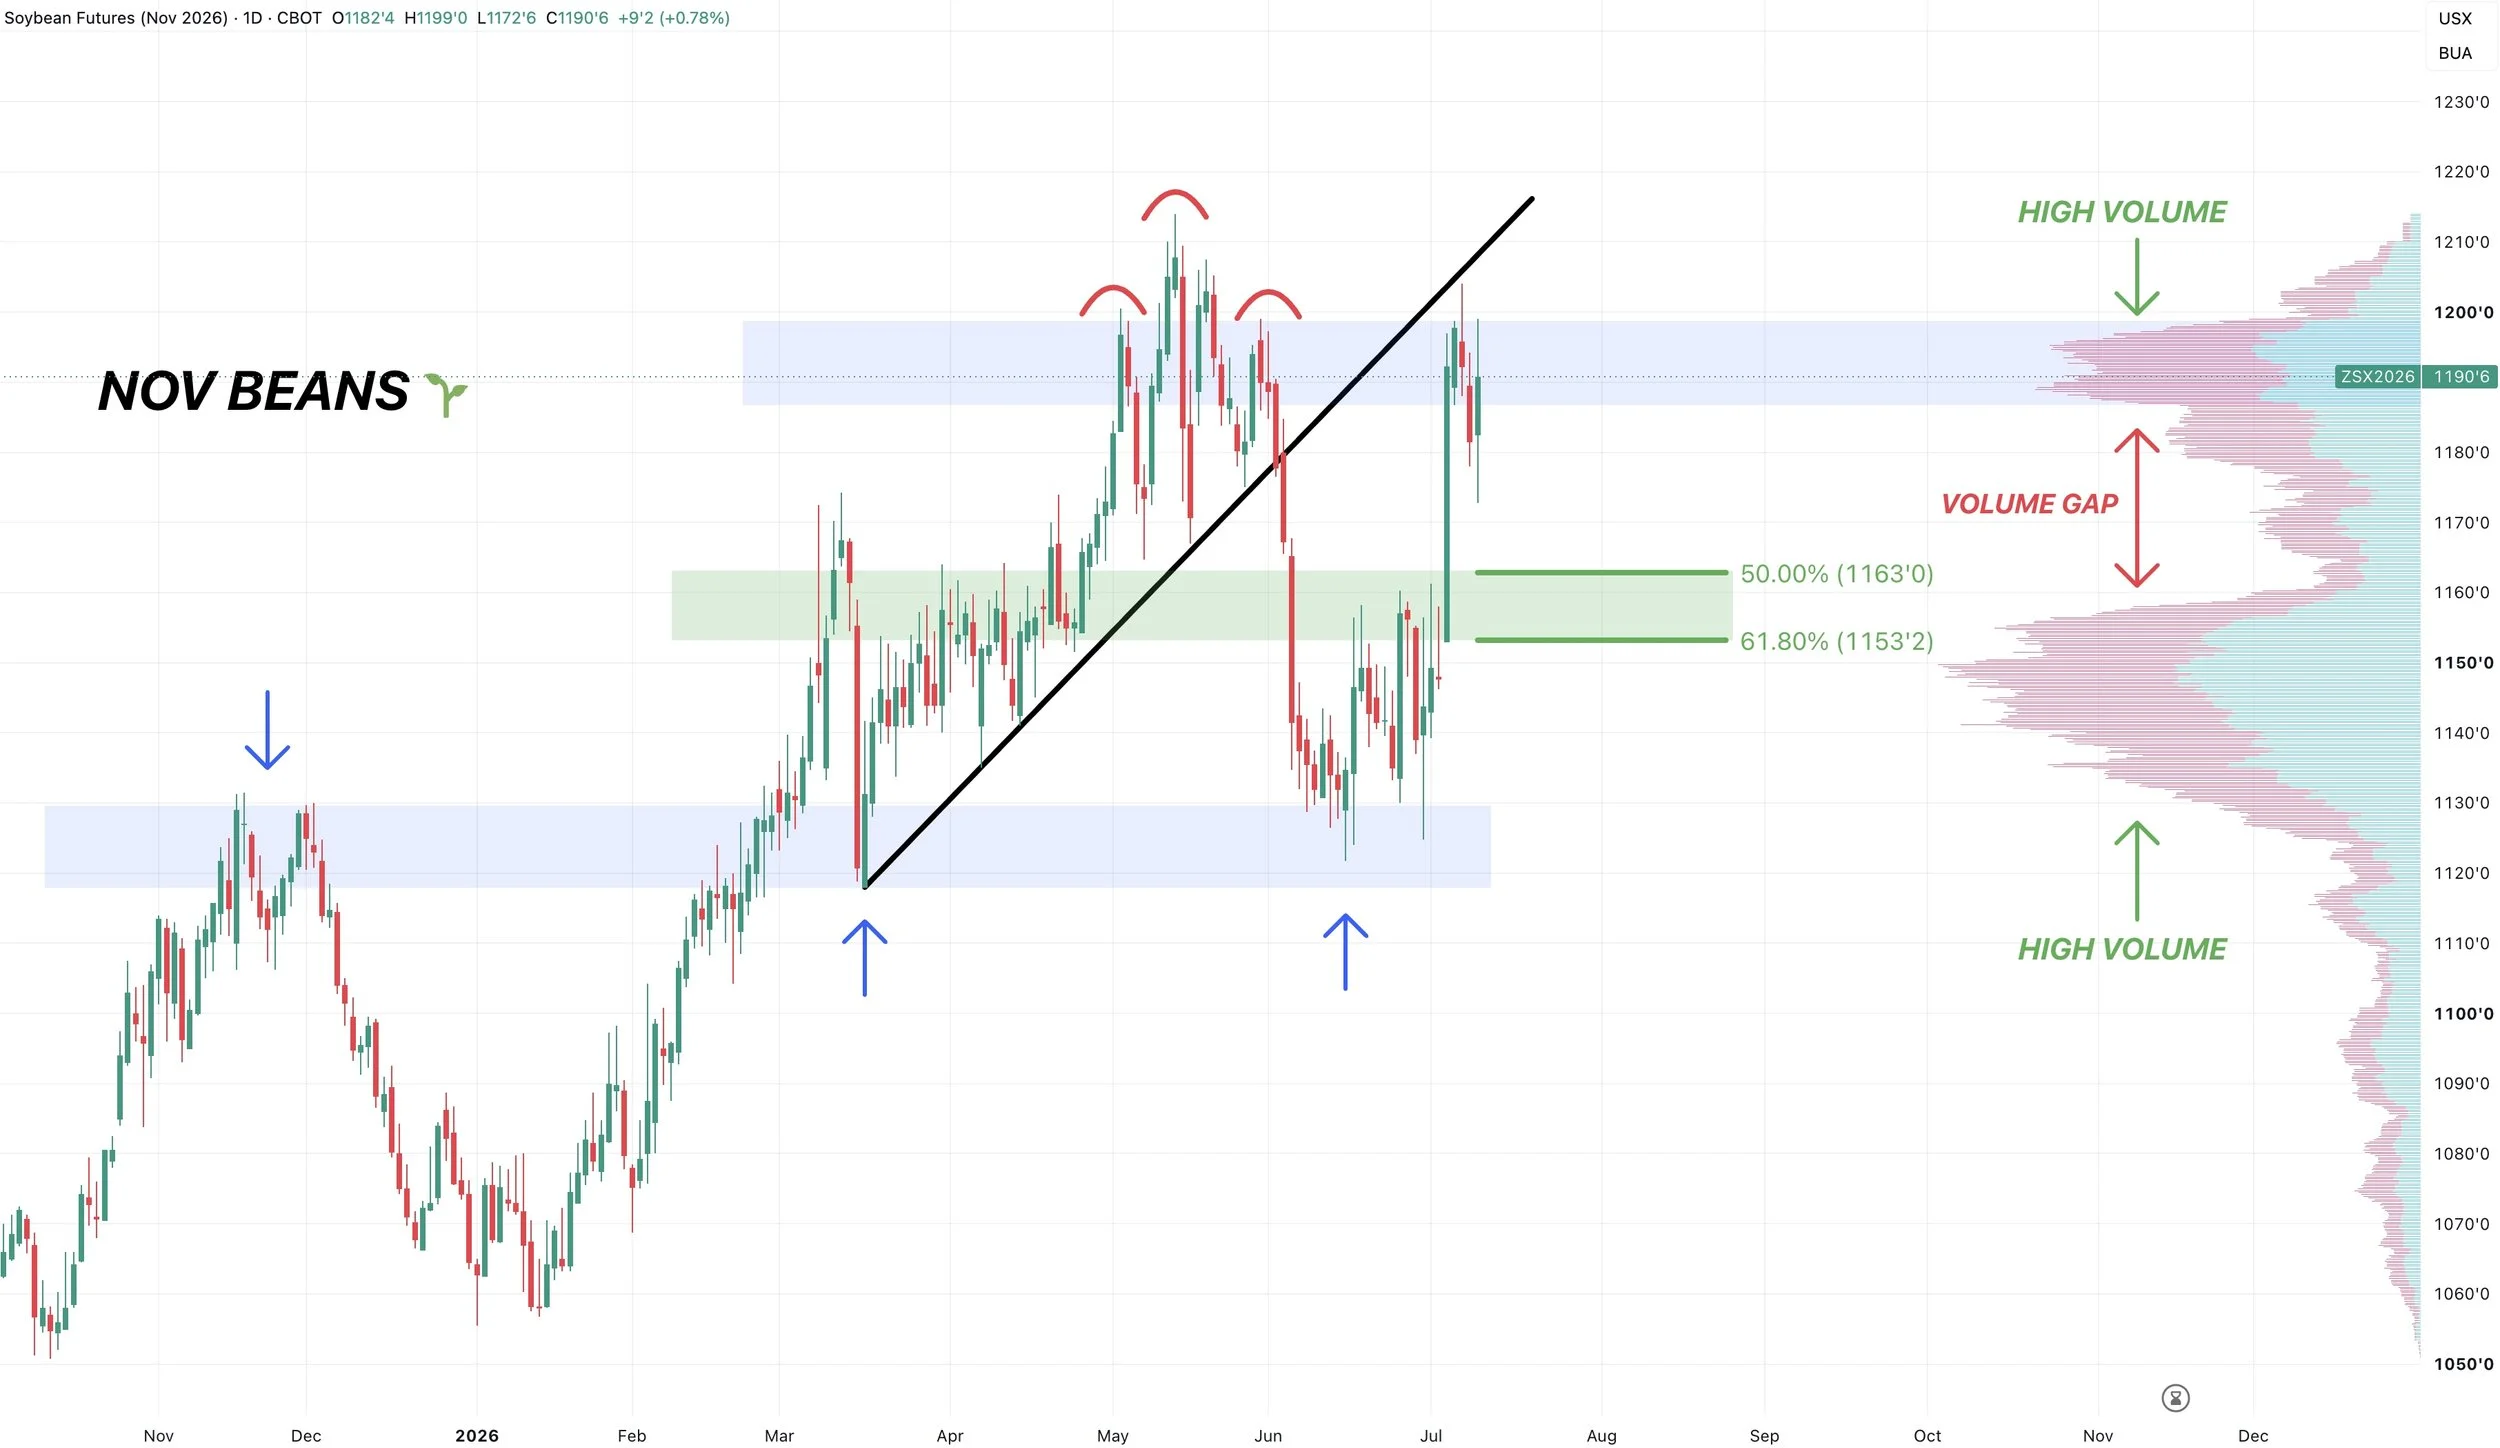
Nov Beans Chart:
Also finding resistance at this area of high volume. Hence the sell signal and hedge alert earlier this week.
We are also potentially rejecting that prior trendline support.
If we happen to reject here, there is a volume gap to the downside towards the golden retracement zones.
We don’t have to fall down there, but that would be an area we'd want to hold if we do.
Wheat
Today's Alert:
Today we sent out a sell signal and hedge alert in wheat. As we hit some targets for the first time since that old $7.50 target.
The alert was more for those who have to move stuff off the combine or are in some type of storage program. If you aren’t in that situation, you can afford to be less aggressive.
If you missed it: Click Here to View
Russia News:
Today's rally didn’t have much to do with the report. Wheat was trading +25 cents higher before the report came out.
The report didn’t offer a bullish surprise like some thought it could. Many were speculating that wheat was trading higher in anticipation of a bullish report.
But it was geopolitically driven.
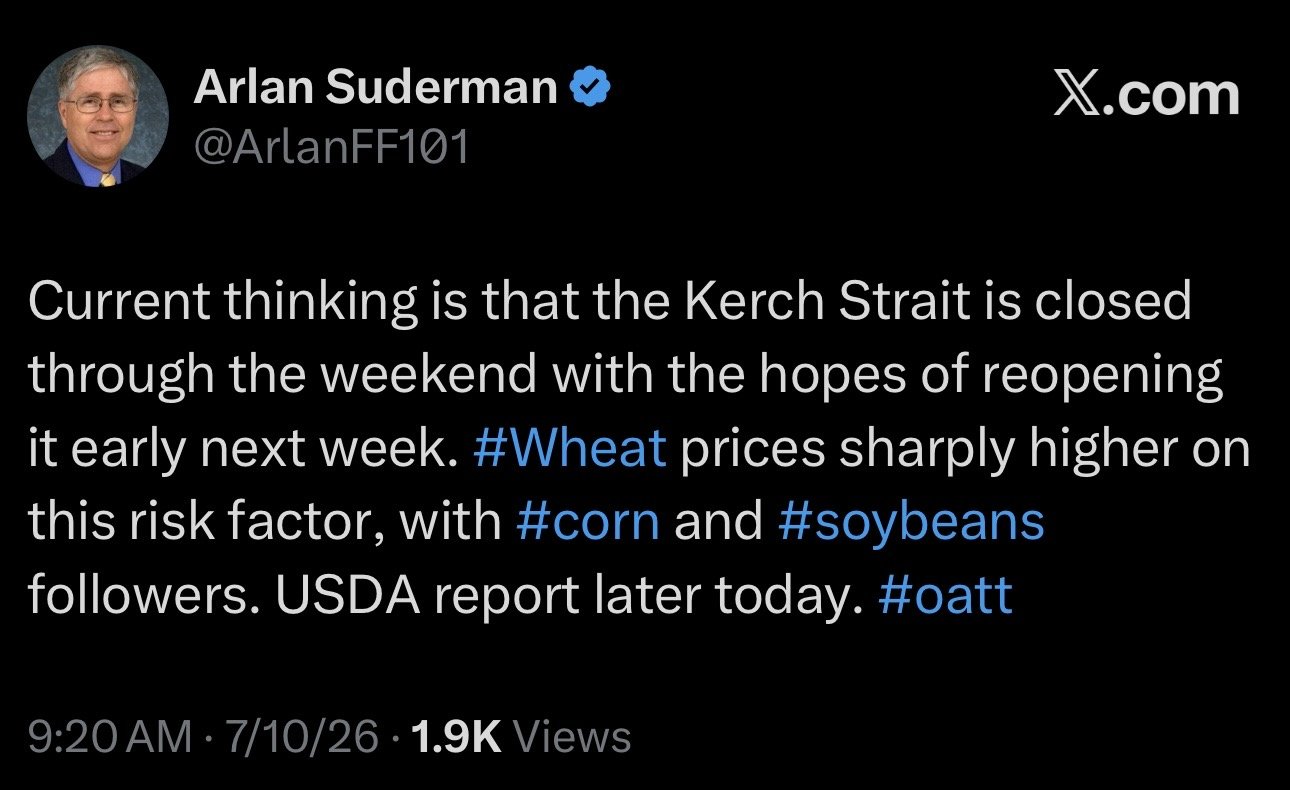
Reports came out saying that the Kerch Strait is closed until early next week. This Strait handles 1/3rd of all of Russia's wheat exports.
So that was a big reason for the rally.
Sep KC Chart:
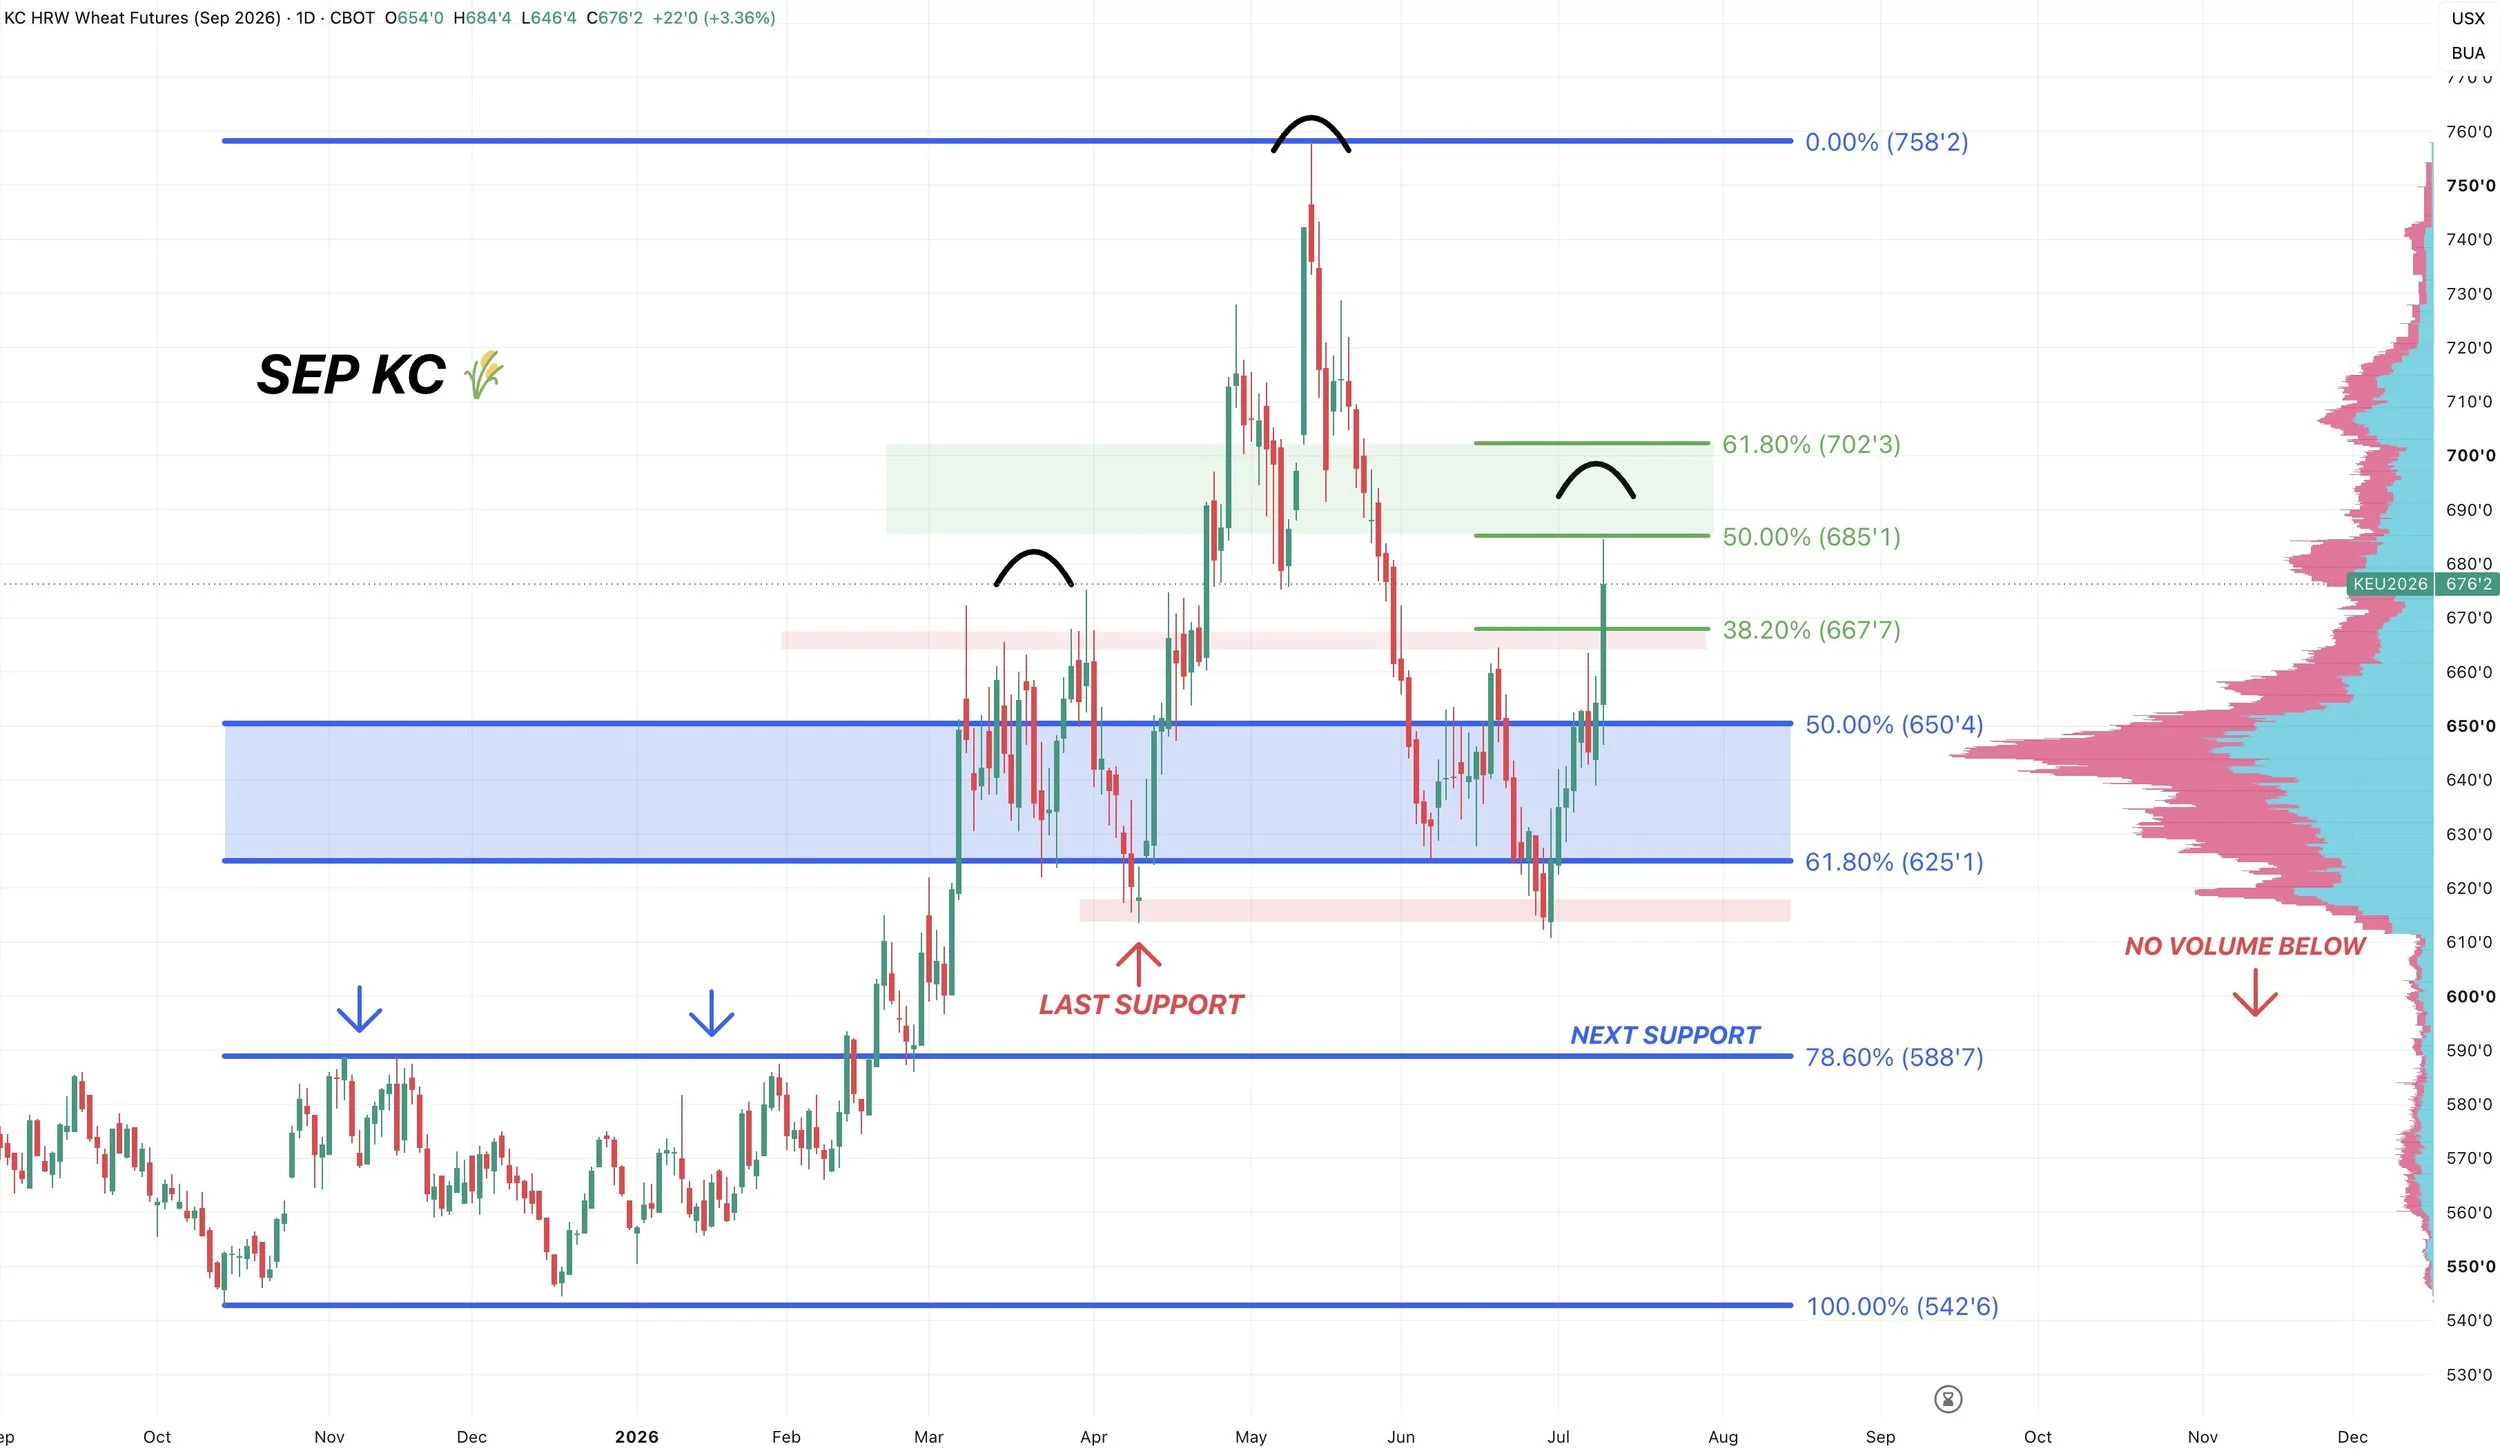
The charts were the biggest reason for the signal.
We clawed back 50% of the entire $1.50 meltdown.
The 50% to 61.8% retracments from $6.85 to $7.00 are the most common levels for a market to fail.
You also have a potentially sloppy head and shoulders pattern still intact.
This doesn’t mean we "have" to fail here. It's simply an area where it makes sense to de-risk if you are someone who needs to do so.
Sep Chicago Wheat Chart:
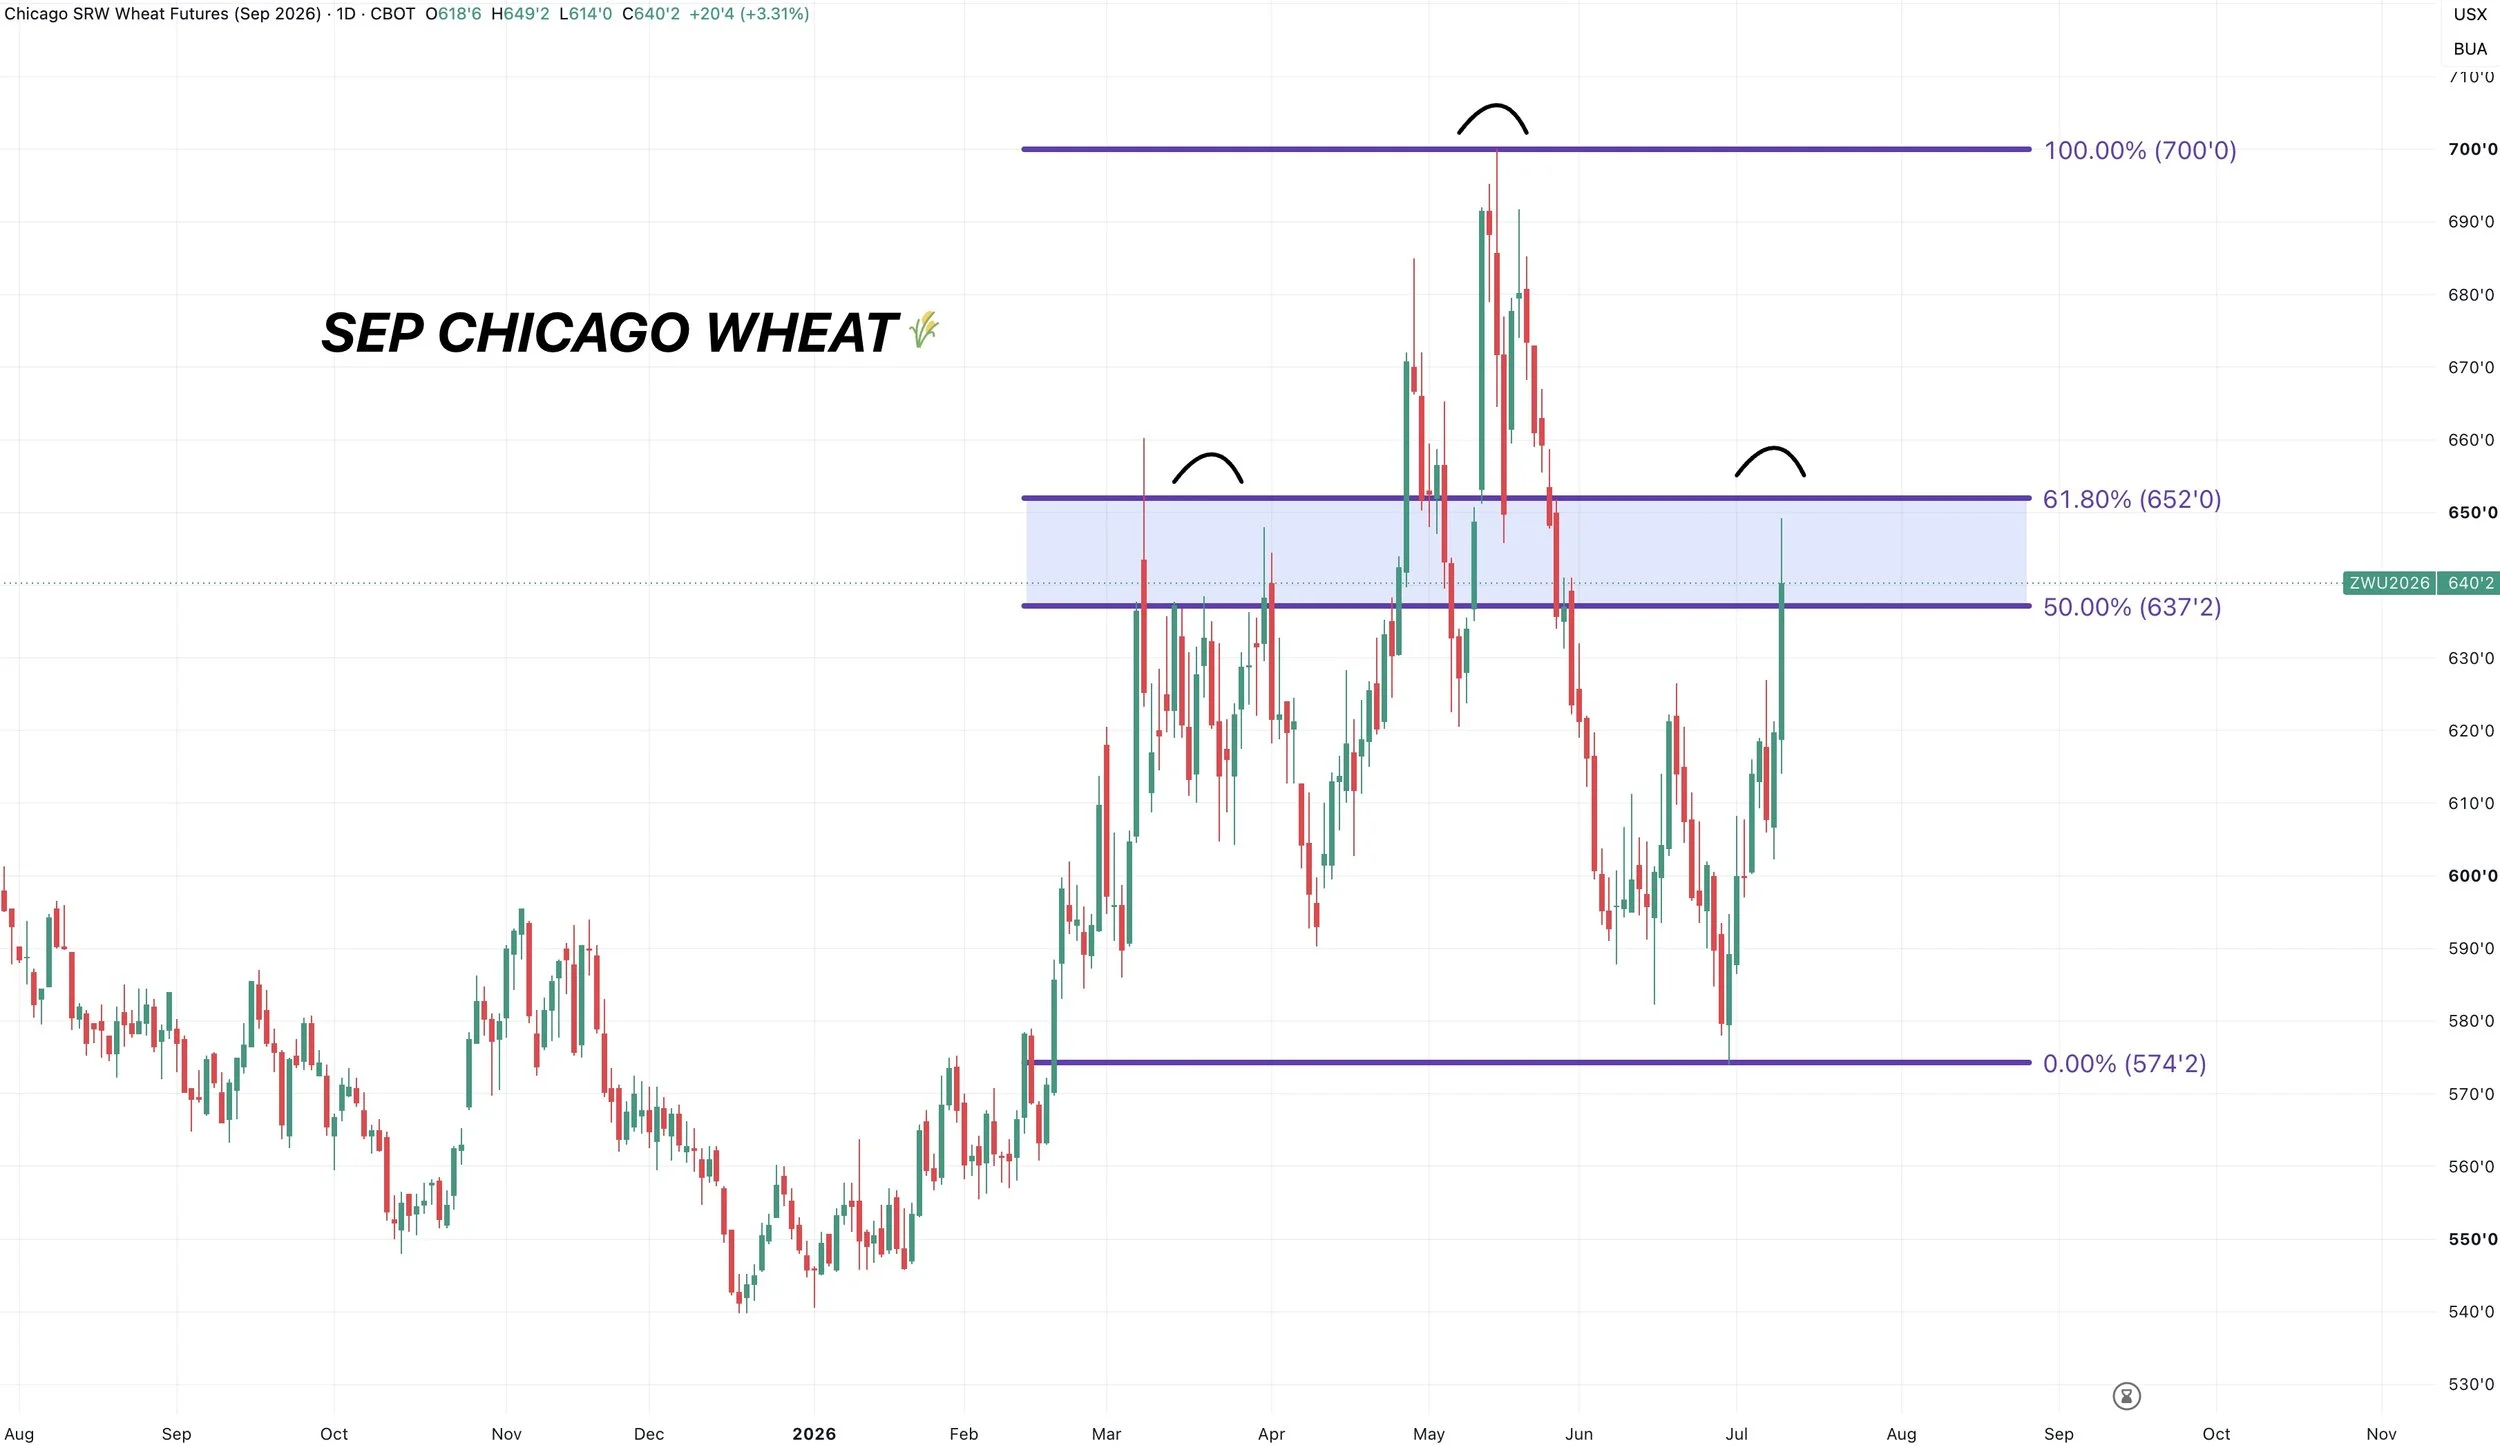
Chicago wheat reclaimed just about 61.8% of the the entire sell off.
The most common retracement level.
We don’t have to fail here. But if we are going to fail, this would be a common spot for it to happen. So again, makes sense to defend this level.
We also have a far more textbook head and shoulders pattern in Chicago which adds even more caution.
As this right shoulder would line up perfectly with the left shoulder from March.
Cattle
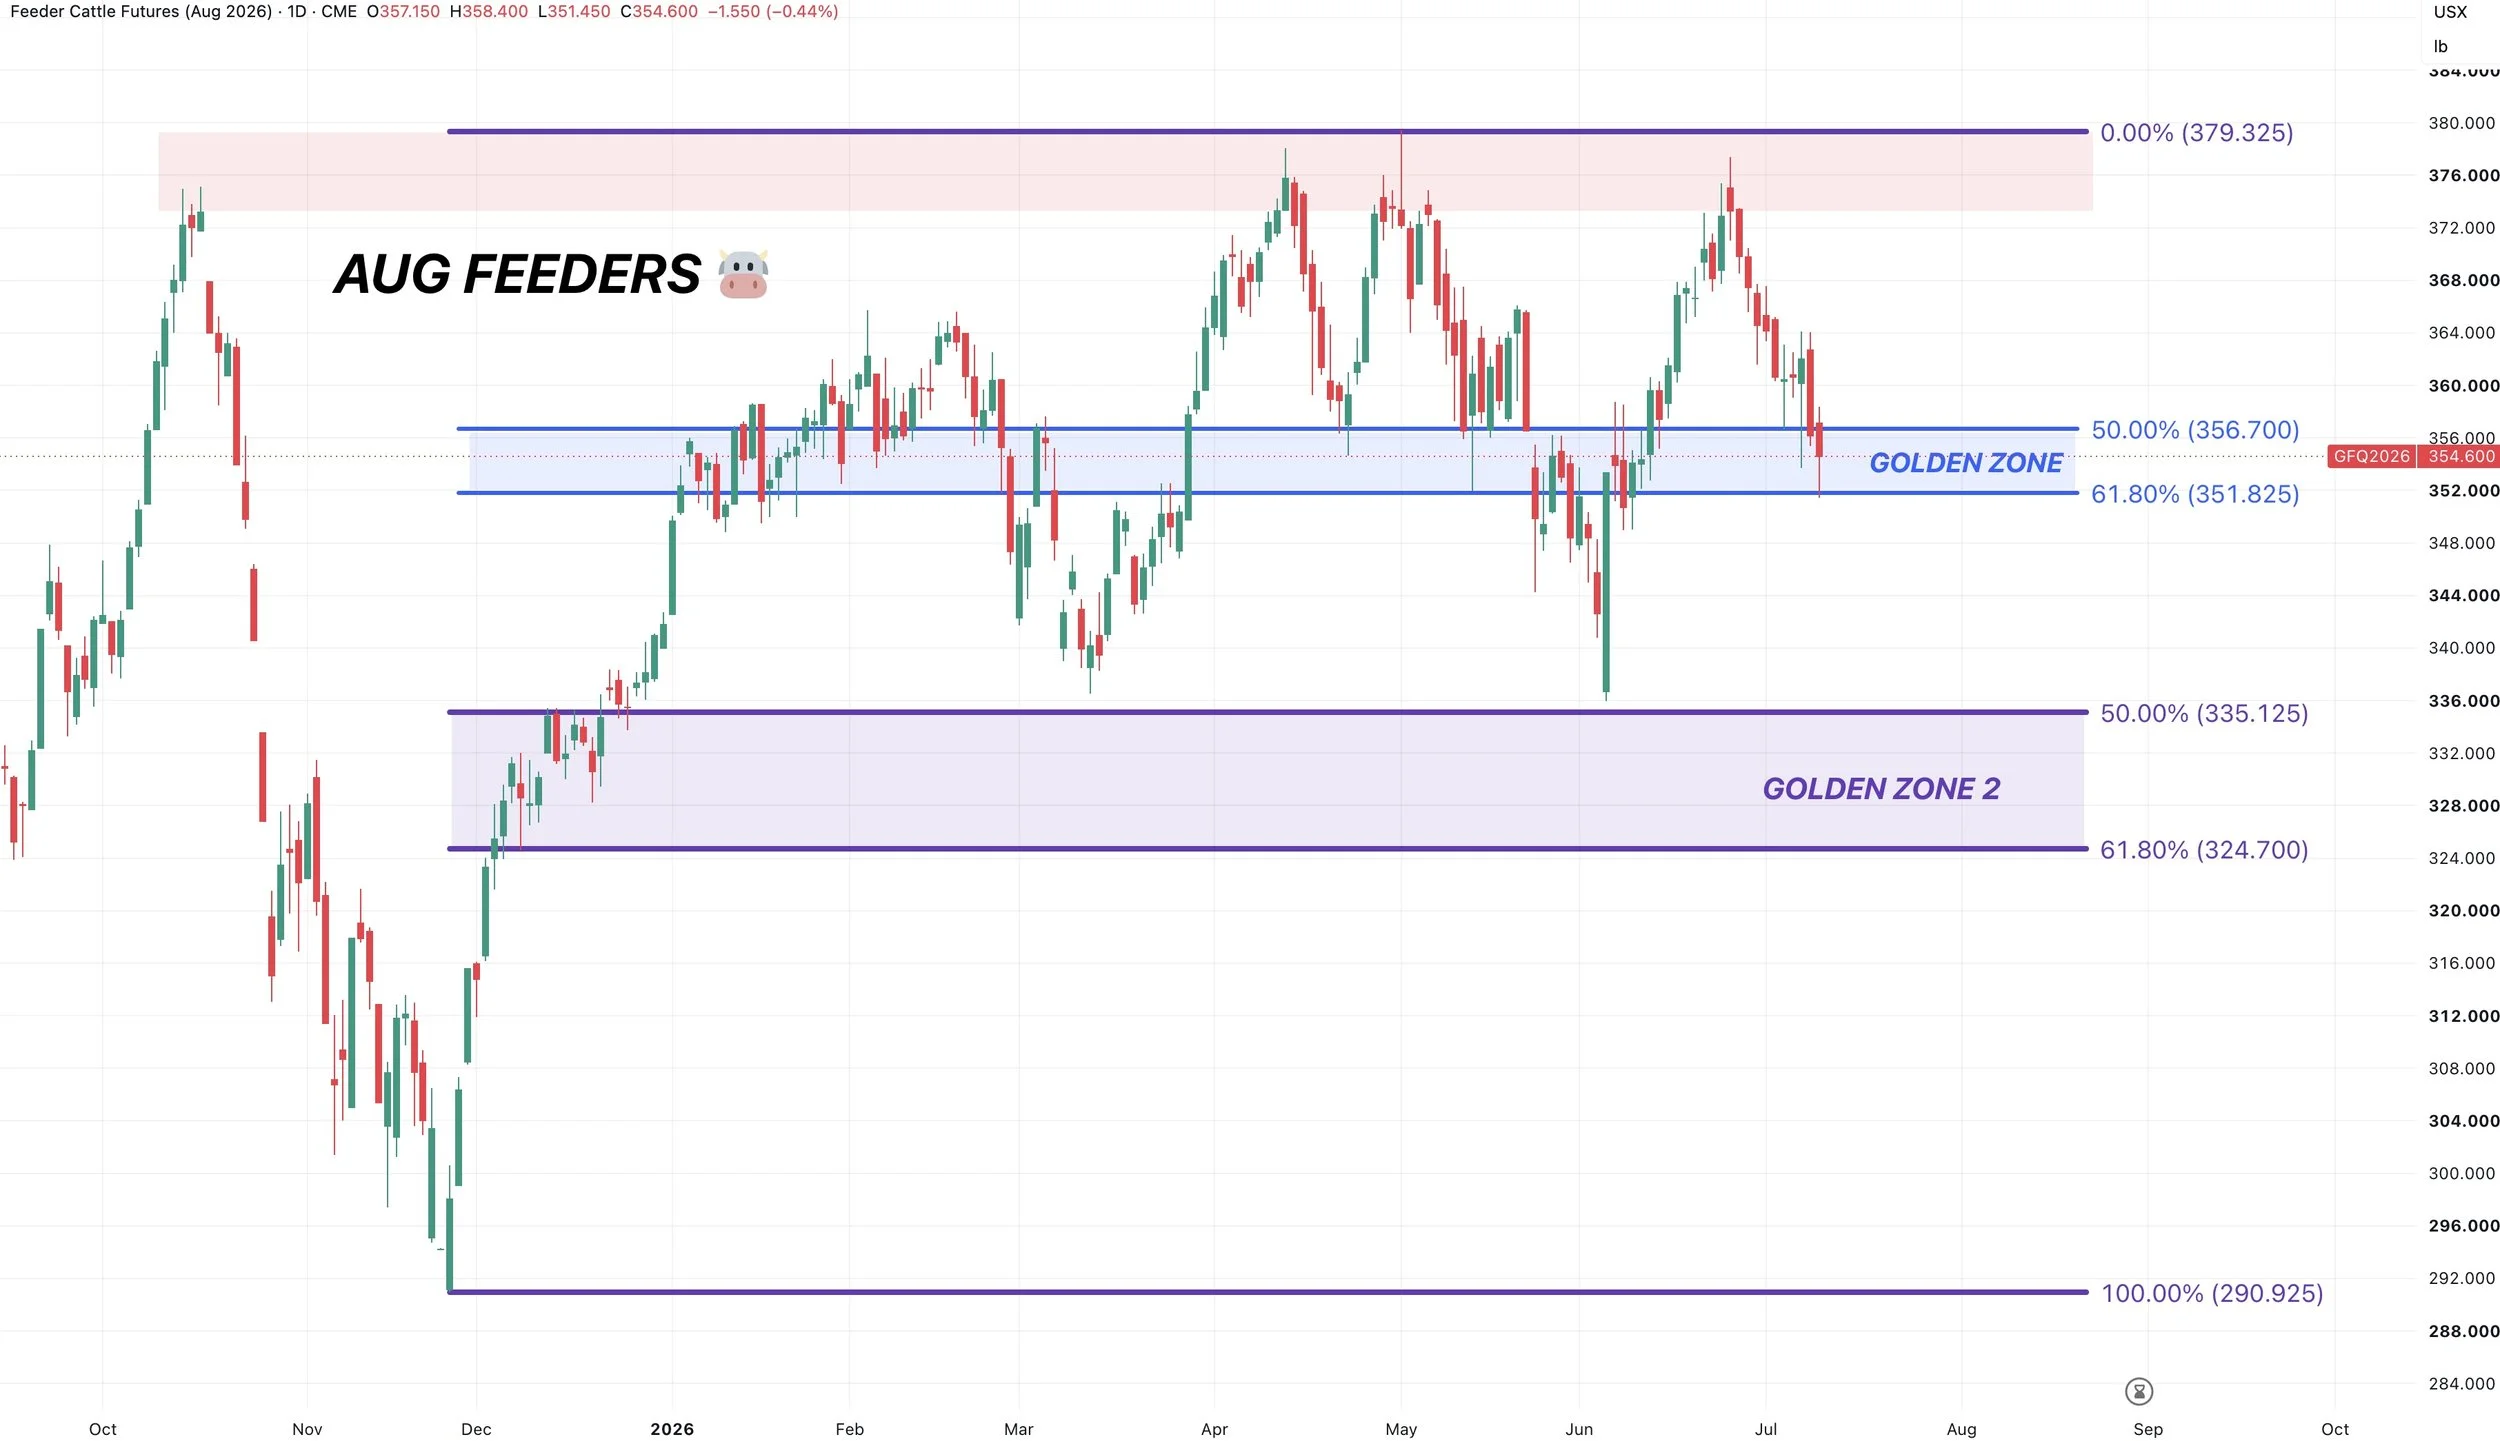
Aug Feeders Chart:
Perfect bounce in cattle today that adds some optimism.
We exactly tagged the 61.8% retracement down to the June lows.
This is a pretty important level to hold. If we break it, we likely get a sizeable leg lower. Potentially towards the bigger golden zone from the December lows.
Bulls really want to see this hold.
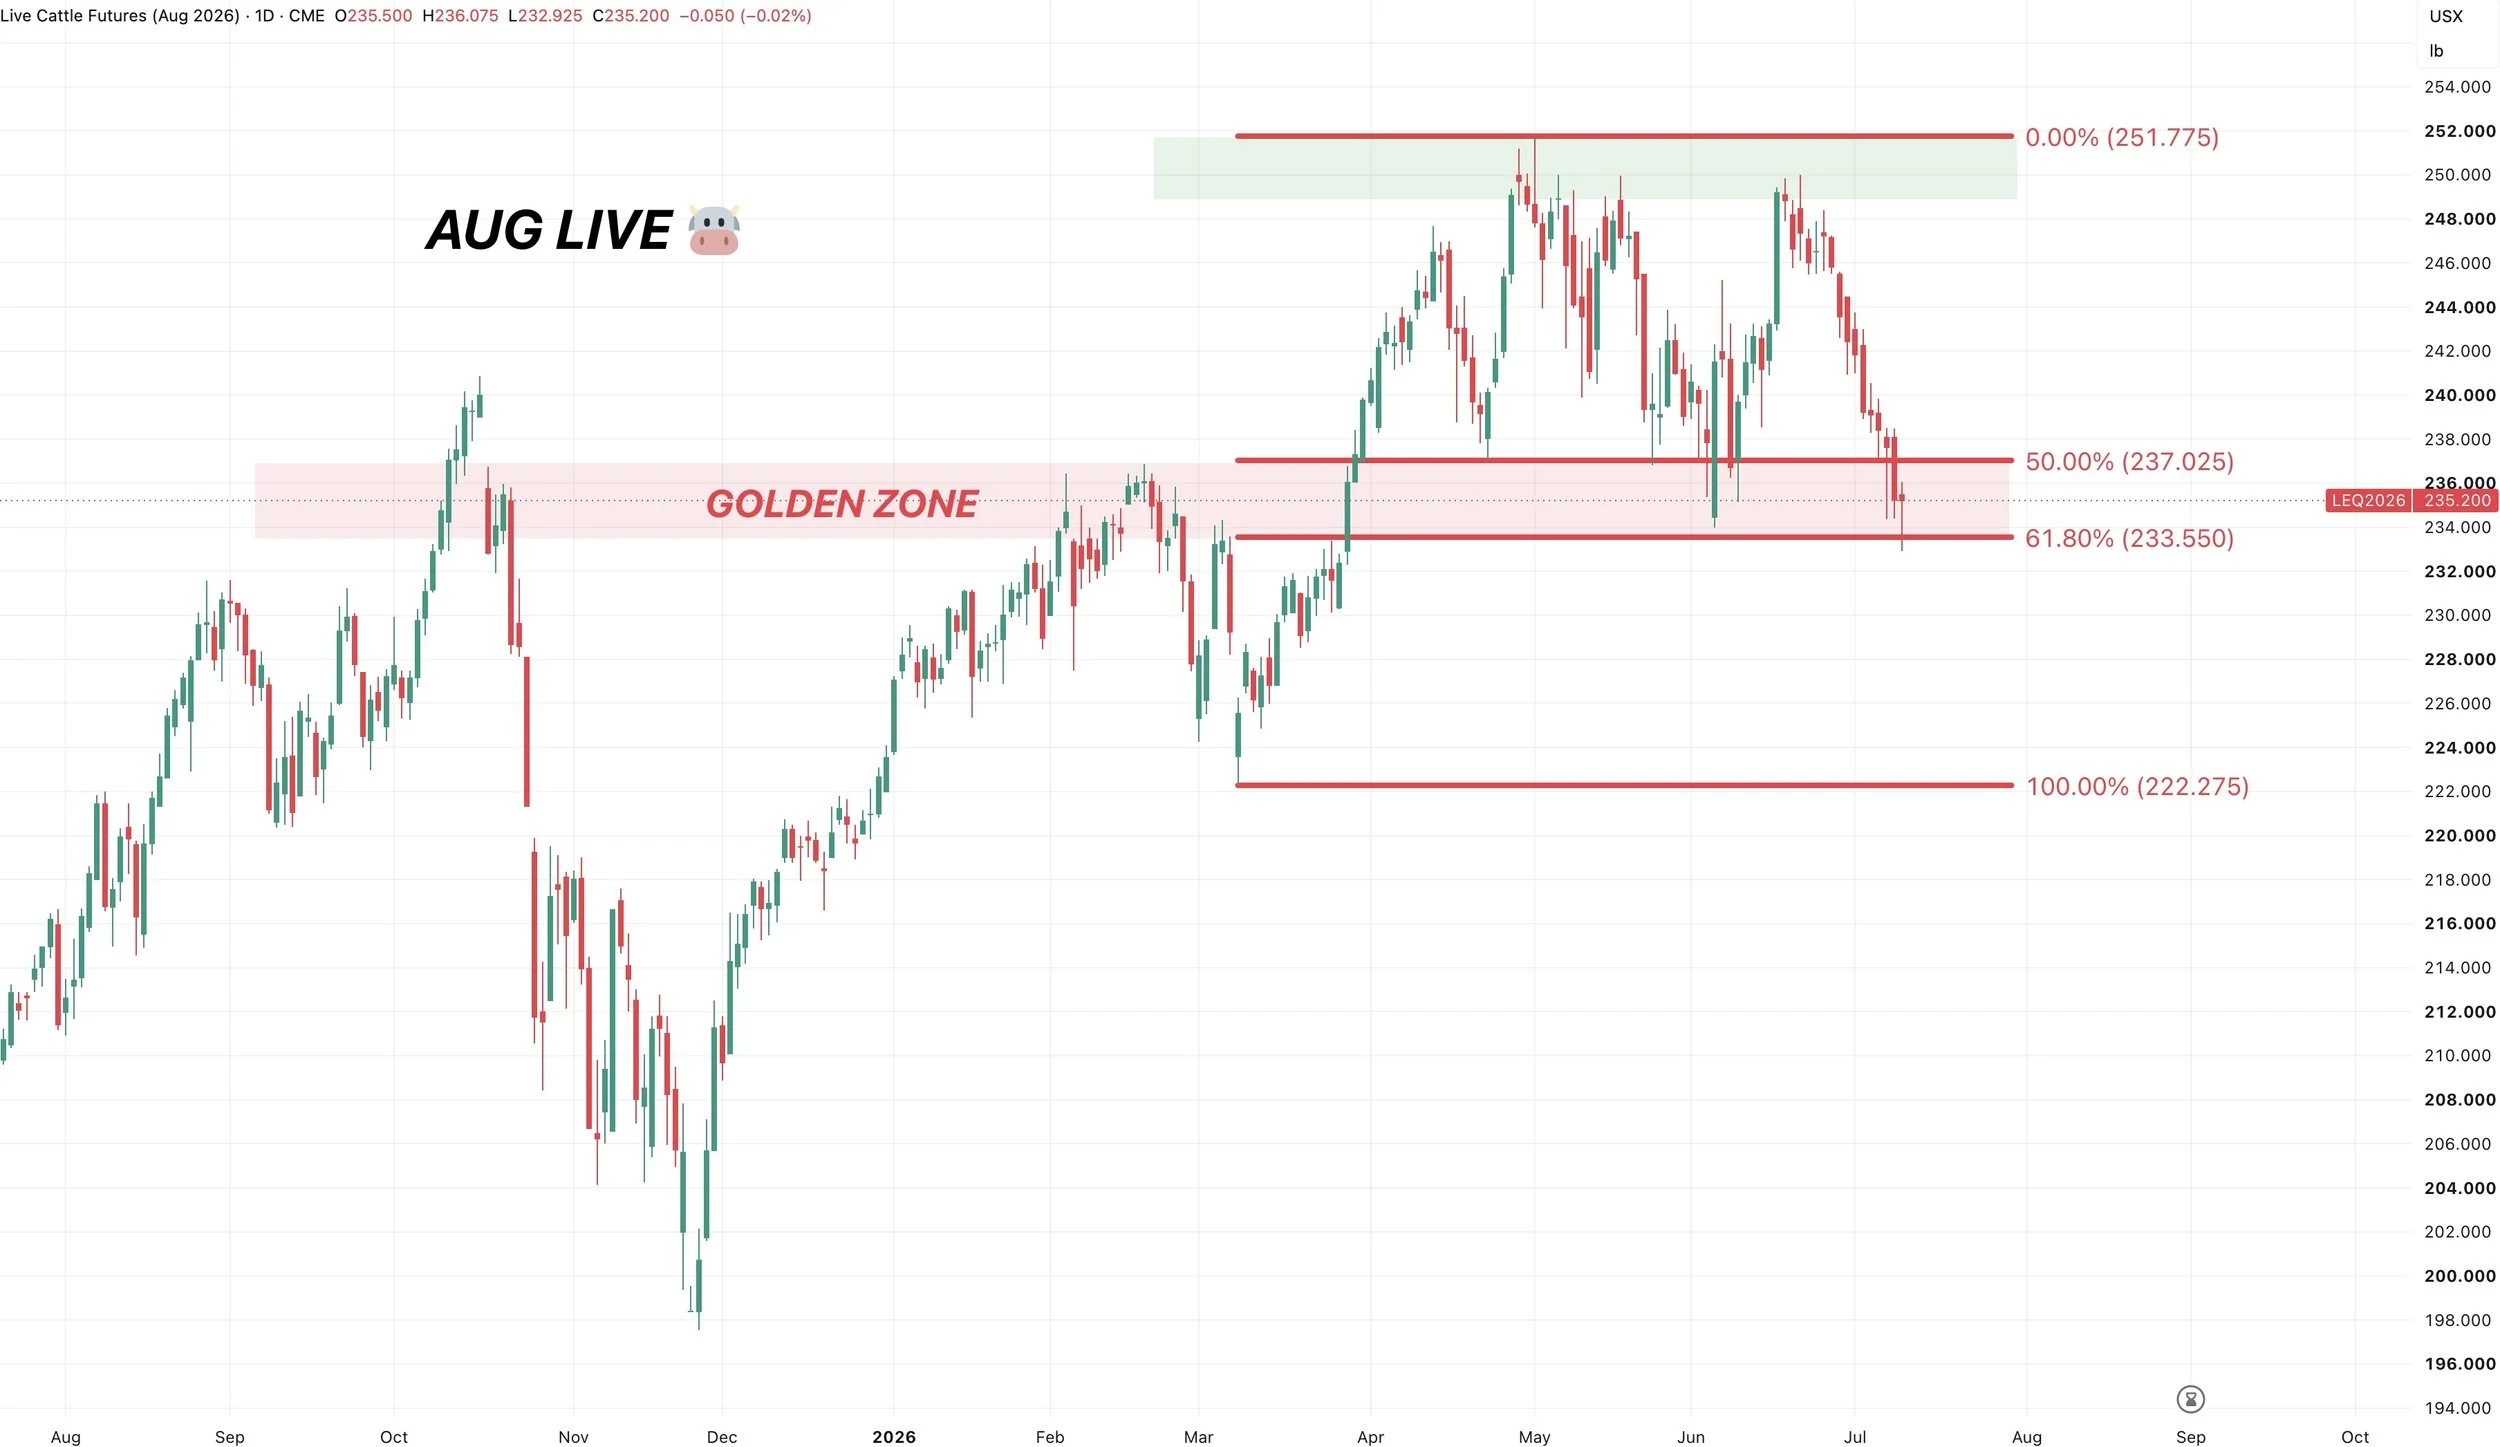
August Live Chart:
Live cattle also sitting at a very important level here.
We bounced right at the 61.8% retracement down to the March lows.
Absolutely a must hold level to prevent further downside.
Not only is this the golden zone, but it's where this market just bounced at back in June and right where this market failed at back in February.
Very important level.
Want to Talk?
Our phones are open 24/7 for you guys if you ever need anything or want to discuss your operation.
Jeremey & Office: (806)484-1214
Sebastian: (605)280-1186
Email: sfrost@dailymarketminute.com
Hedge Account
Interested in a hedge account? Use the link below to set up an account or give us a call.